
The cryptocurrency market spent most of its day recovering from the move that brought Bitcoin to $9,000. Bitcoin is currently trading for $9,119, which represents a decrease of 0.85% on the day. Meanwhile, Ethereum lost 1.88% on the day, while XRP lost 1.37%.

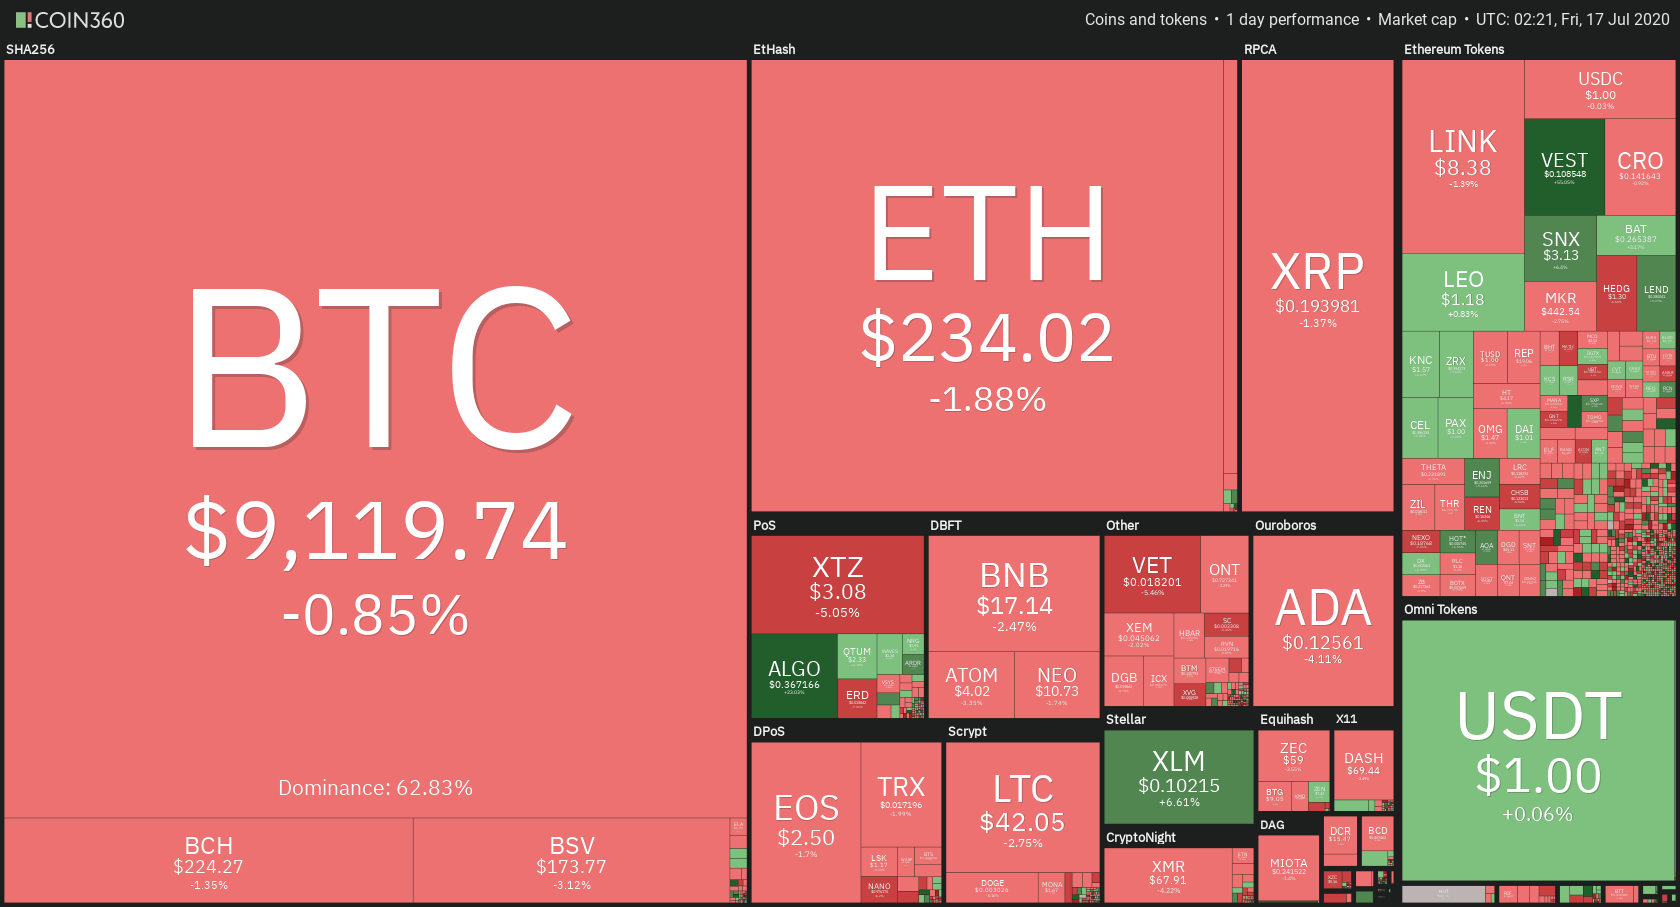
Daily Crypto Sector Heat Map
When talking about top100 cryptocurrencies, Ampleforth gained 28.69% on the day, making it by far the most prominent daily gainer. Algorand (24.57%) and Aurora (16.45%) also did great. On the other hand, Divi has lost 8.28%, making it the most prominent daily loser. It is followed by Nexo’s loss of 7.12% and Elrond’s loss of 6.55%.
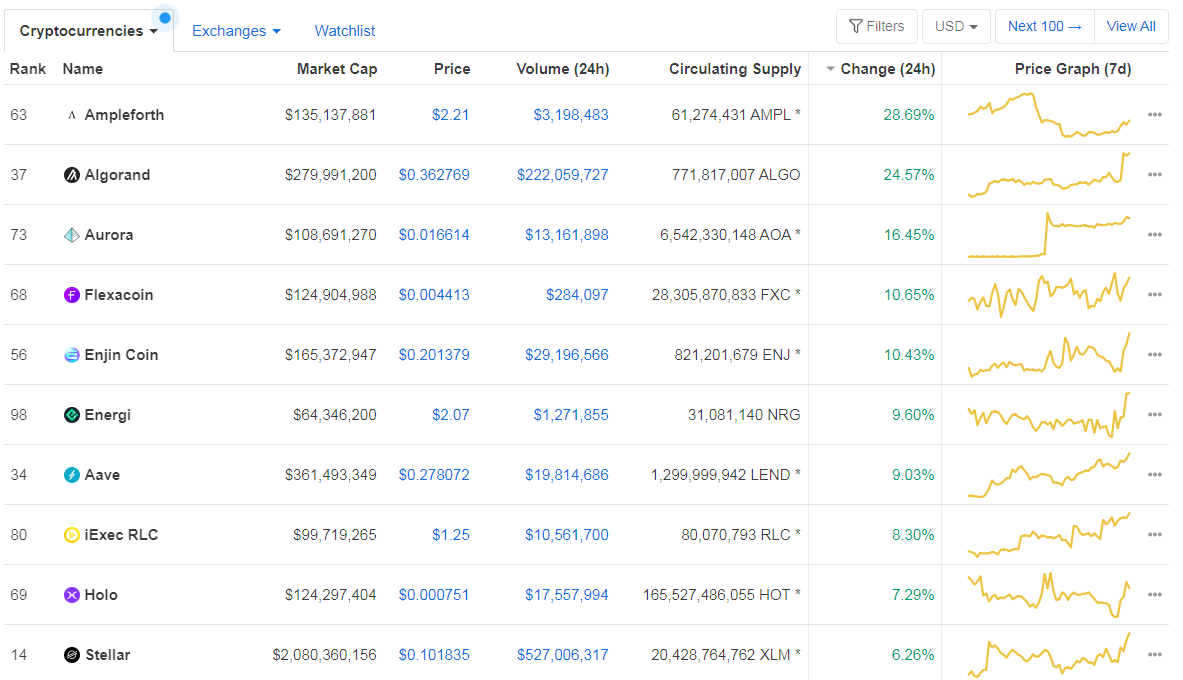
Top 10 24-hour Performers (Click to enlarge)
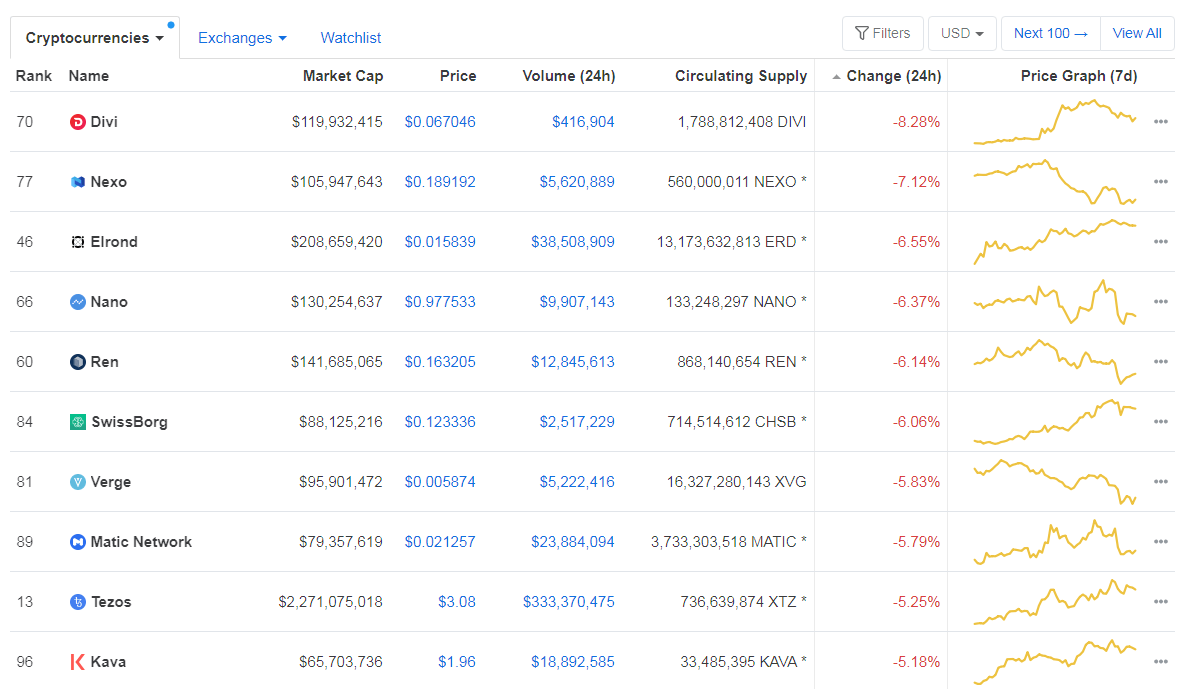
Bottom 10 24-hour Performers (Click to enlarge)
Bitcoin’s dominance level increased slightly since we last reported, with its value currently at 62.83%. This value represents a 0.11% difference to the upside when compared to yesterday’s value.
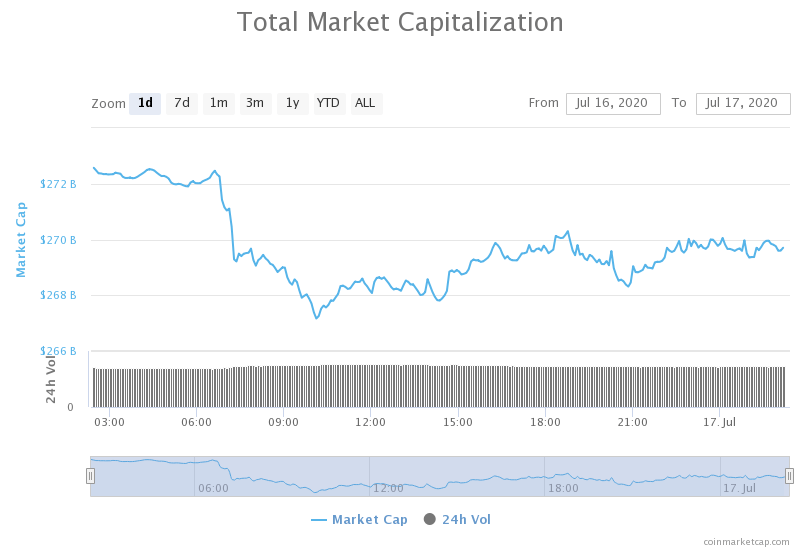
Daily Crypto Market Cap Chart
The cryptocurrency market capitalization decreased slightly when compared to when we last reported, with the market’s current value being $269.69 billion. This value represents a decrease of $2.84 billion when compared to the value it had yesterday.
_______________________________________________________________________
What happened in the past 24 hours?
_______________________________________________________________________
- Twitter Hack Sparks Fresh Calls to “Ban Bitcoin” (Cryptobriefing)
- The Federal Bureau of Investigation is reportedly investigating the Twitter account hack (The Block)
- Q4 2020 will be crazy for crypto, says VC: DeFi, Ethereum 2.0, Libra, and more (Cryptoslate)
- Beijing government releases its blueprint for becoming a blockchain hub (The Block)
- Bitcoin exchange volume dominance picks up after hitting lows in 2018 (The Block)
- How COVID-19 is helping bring ‘blockchain, not Bitcoin’ back from the dead (The Block)
- Why Is XRP Crashing? Data Shows Ripple Is Flooding the Market (Cryptobriefing)
- Amazon Prime Membership Should Have Been a Tokenized Asset (Coindesk)
- Abra CEO Agrees With Bitcoin’s Role as Digital Gold (Cointelegraph)
- DeFi Tokens Outperformed Bitcoin in Q2, but Will the Rally Continue? (Cointelegraph)
_______________________________________________________________________
Technical analysis
_______________________________________________________________________
Bitcoin
The largest cryptocurrency by market capitalization started the day quite rough, with its price dropping to $9,000 as bearish influence and volume increased. However, the price quickly retraced back above the $9,120 level, where it is currently consolidating. However, Bitcoin is approaching the descending trend line, which fell under during its drop to $9,000, which may cause the price to move once again.
BTC traders should look for a trade opportunity when Bitcoin reacts to the descending trend line.
BTC/USD 4-hour Chart
Technical factors:
- Price is below its 50-period EMA and its 21-period EMA
- Price right below the middle B.B. (20-period SMA)
- RSI neutral/low (40.42)
- Average volume (came back from increased)
Key levels to the upside Key levels to the downside
1: $9,251 1: $9,120
2: $9,580 2: $8,980
3: $9,735 3: $8,820
Ethereum
Ethereum started the day by being rejected from the $240 level, therefore triggering a fall towards the $228 level. The second-largest cryptocurrency by market capitalization managed to stop its price drop at $229 and slowly start to recover and consolidate. While the price is on a slow path towards the upside, the ultimate short-term direction of Ethereum is unknown.
Ethereum traders should look for an opportunity when Ethereum approaches the $240 level.
ETH/USD 4-hour Chart
Technical Factors:
- Price below the 50-period EMA and the 21-period EMA
- Price below the middle B.B. (20-period SMA)
- RSI neutral (40.36)
- Average volume (back from greatly increased)
Key levels to the upside Key levels to the downside
1: $240 1: $228
2: $251.4 2: $225.4
3: $260 3: $218
Ripple
The third-largest cryptocurrency by market cap was no exception to how the price action played out. The day started with a sharp price drop, which brought the price below $0.19. However, XRP quickly recovered and got on a slow upward trend, which may be stopped by the moving averages above it. If, however, XRP manages to pass them, the $0.2 resistance level will still pose a big problem.
XRP traders can look for an opportunity to trade when the volume increases, and the trend becomes clear enough, as the low volume and volatility are certainly not ideal for trading at the moment.
XRP/USD 4-hour Chart
Technical factors:
- XRP in a mid-term descending trend (though it broke the trend in the short-term)
- XRP lacks strong support levels below $0.178
- Price below 21-period and the 50-period EMA
- Price right under the middle B.B. (20-period SMA)
- RSI is neutral (43.89)
- Volume lower than average
Key levels to the upside Key levels to the downside
1: $0.2 1: $0.19
2: $0.205 2: $0.178
3: $0.214
Related posts
 Daily Crypto Review, Feb 21 – Morgan Stanley dipping its toes into crypto? Analysts still confused by the price drop
 Daily Crypto Review, Mar 4 – Bitcoin and Altcoins Recover, Look for Further Strength
 Daily Crypto Review, July 22 – Ethereum Passes Bitcoin and Becomes the Most Used Blockchain
 Daily Crypto Review, July 24 – Bitcoin Above $10,000; Ethereum Passing $300