On the news front, the eyes will remain on the U.S. Unemployment Claims figures, which are expected to perform slightly better. With this, the U.S. dollar can exhibit more buying, driving gold lower and the dollar higher.
Economic Events to Watch Today
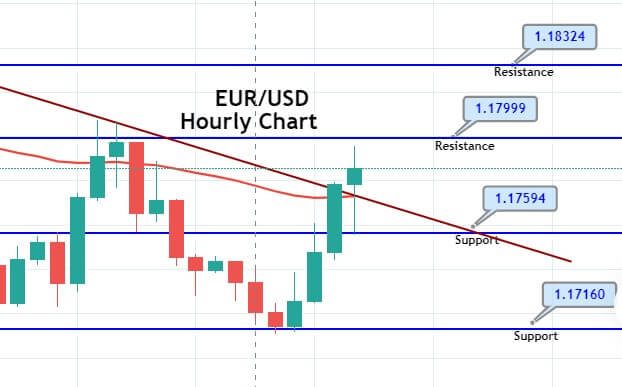
EUR/USD – Daily Analysis
The EUR/USD was closed at 1.17393 after placing a high of 1.18078 and a low of 1.17217. Overall the movement of the EUR/USD pair remained flat throughout the day. The EUR/USD pair took bids and surged above 1.18050 level, but after the release of U.S. economic data, the EUR/USD pair started to decline and posted losses. The pair ended its day on the same level it started its day with and hence, gave a smooth movement throughout the day.
The fresh risk appetite droved the rise in the EUR/USD pair amid the registration of the first coronavirus vaccine from Russia. Russia became the first country to register its vaccine for coronavirus, and this news gave a push to heavy risk appetite in the market.
The stock markets rushed to their higher level on this news, and the riskier currency Euro also gained from it in the early trading session. The gains continued after the release of macroeconomic data from the European side.
At 14:00 GMT, the ZEW Economic Sentiment for Eurozone in August surged to 64.0 against the expected 55.3 and supported the single currency. The ZEW Economic Sentiment for Germany surged to 71.5 from the anticipated 57.0 and supported Euro. The better than expected economic sentiment for the month gave strength to a single currency and pushed EUR/USD pair above 1.18050 level.
However, the gains could not last for long as the U.S. President Donald Trump announced that he was very seriously considering a capital gains tax cut to help job creation. If Trump gave another executive order on capital taxation, it would likely face legal challenges as it would push the boundaries of the President’s executive orders.
Daily Technical Levels
| Support | Pivot | Resistance |
| 1.1722 | 1.1769 | 1.1828 |
| 1.1664 | 1.1874 | |
| 1.1617 | 1.1933 |
EUR/USD– Trading Tip
The EUR/USD has traded with bullish sentiment at 1.1805 level, holding right below an immediate resistance level of 1.1815. Below this, the pair is likely to trade bearish until 1.1783 and 1.1745 level. Conversely, the bullish breakout of the 1.1815 level can lead the pair further higher until the 1.1890 level. Let’s keep an eye on 1.1815.
GBP/USD – Daily Analysis
The GBP/USD closed at 1.30470 after placing a high of 1.31318 and a low of 1.30413. Overall the movement of GBP/USD pair remained bearish throughout the day. The GBP/USD pair dropped on Wednesday and posted losses as the unemployment benefits claims surged in the local country and also because of the strength of the U.S. dollar onboard.
At 04: 01 GMT, the BRC Retail Sales Monitor from Great Britain surged to 4.3% from the expected 2.5% and supported British Pound. At 11:00 GMT, the Claimant Count Change for July rose to 94.4K from the expected 9.7K and weighed heavily on British Pound. The Unemployment Rate from the U.K. came in as 3.9% in June and fell short of expectations of 4.2% and supported GBP.
The clamant count change from the U.K. that showed that more people claimed for unemployment benefits in July. According to the Office of National Statistics, around 730,000 people have become unemployed since March this year, and since June, further 114,000 people have lost their jobs.
However, the jobless rate remained flat at 3.9% in June; this reflected that the number of people who had given up looking for work increased.
The ONS Deputy national statistician, Jonathan Athow, said that the labor market had continued its recent fall in employment and significantly reduced work hours because many people were furloughed.
The people without a job and those who were not even looking for a job but wanted to work increased as the demand for workers was depressed.
It is also believed that the full extent of Britain’s’s job problems has been hidden under the Government’s furlough scheme, which promised to cover 80% of the salaries of workers who could not work due to lockdown.
Daily Technical Levels
| Support | Pivot | Resistance |
| 1.3002 | 1.3035 | 1.3066 |
| 1.2971 | 1.3099 | |
| 1.2938 | 1.3130 |
GBP/USD– Trading Tip
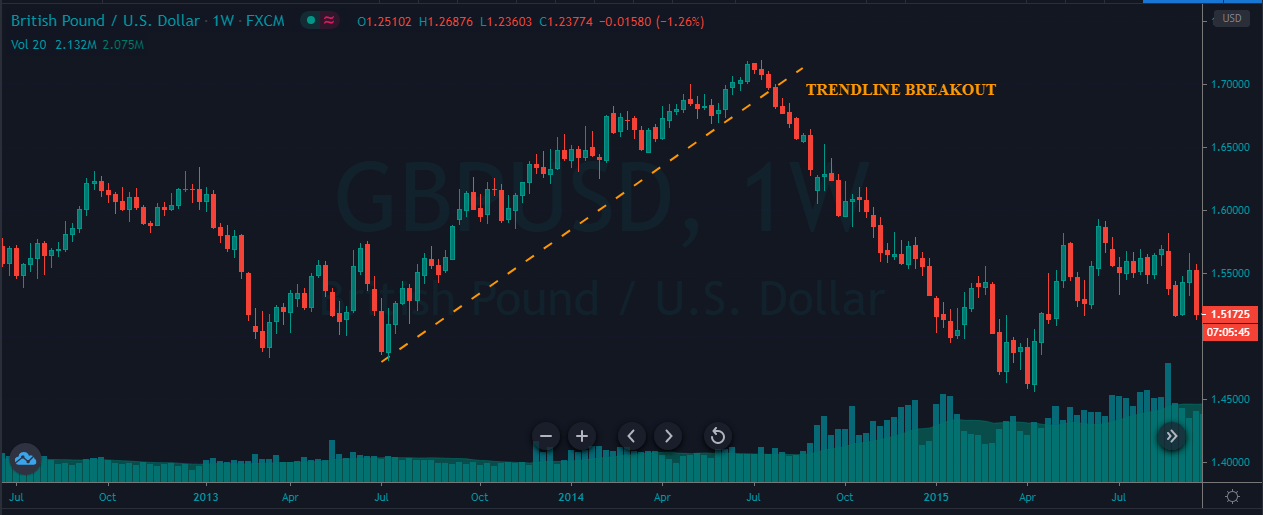
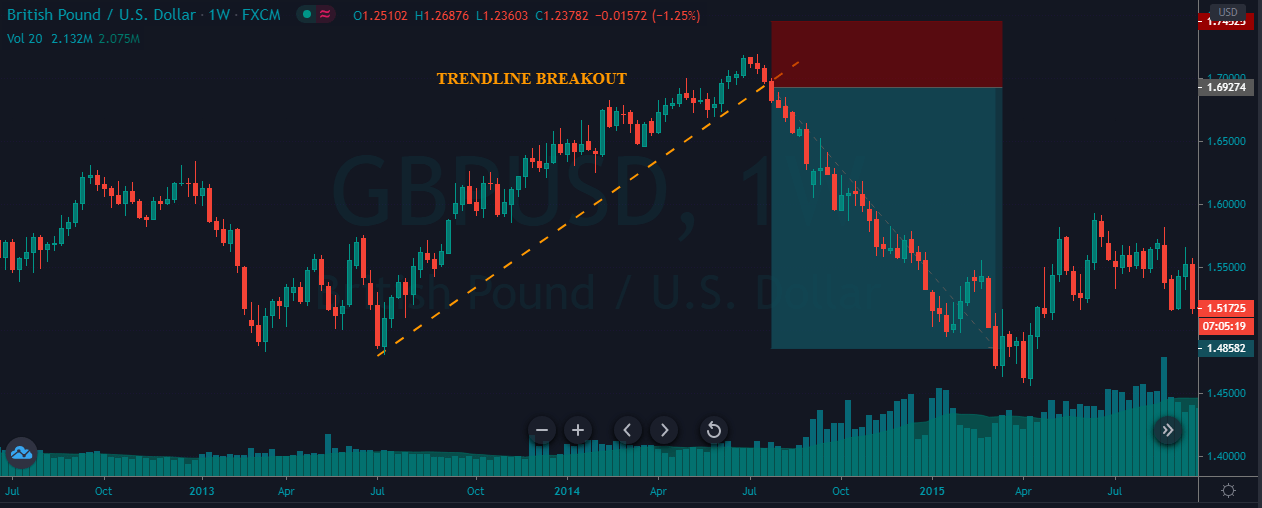
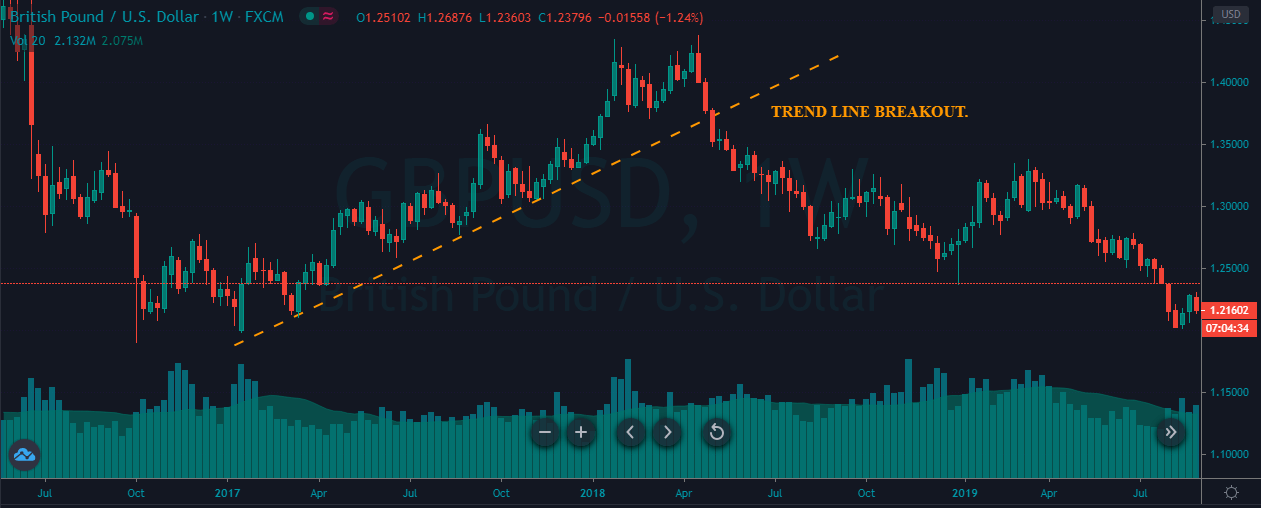
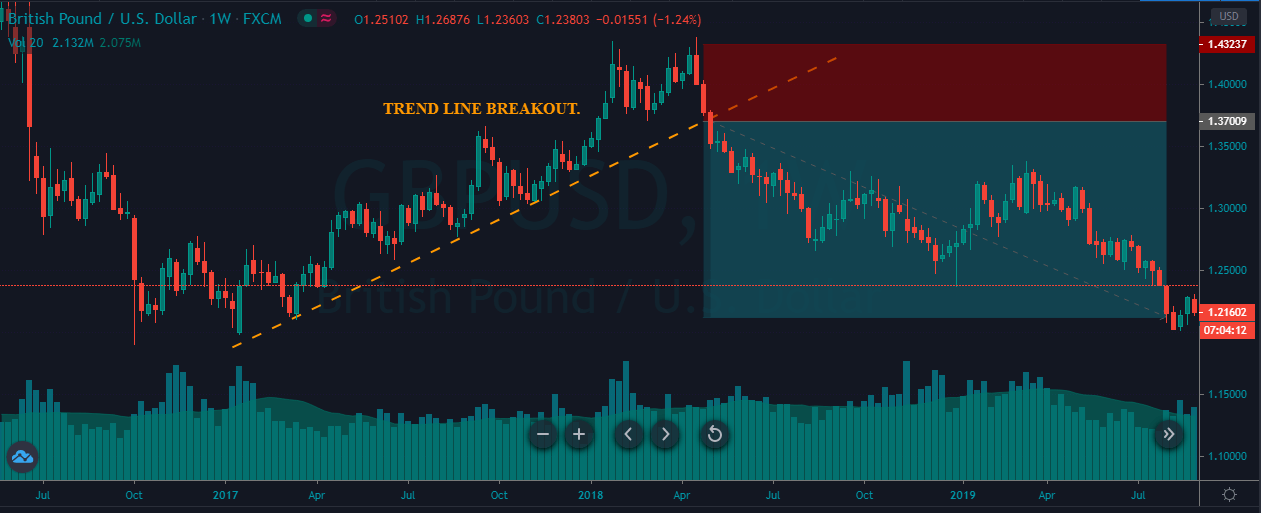
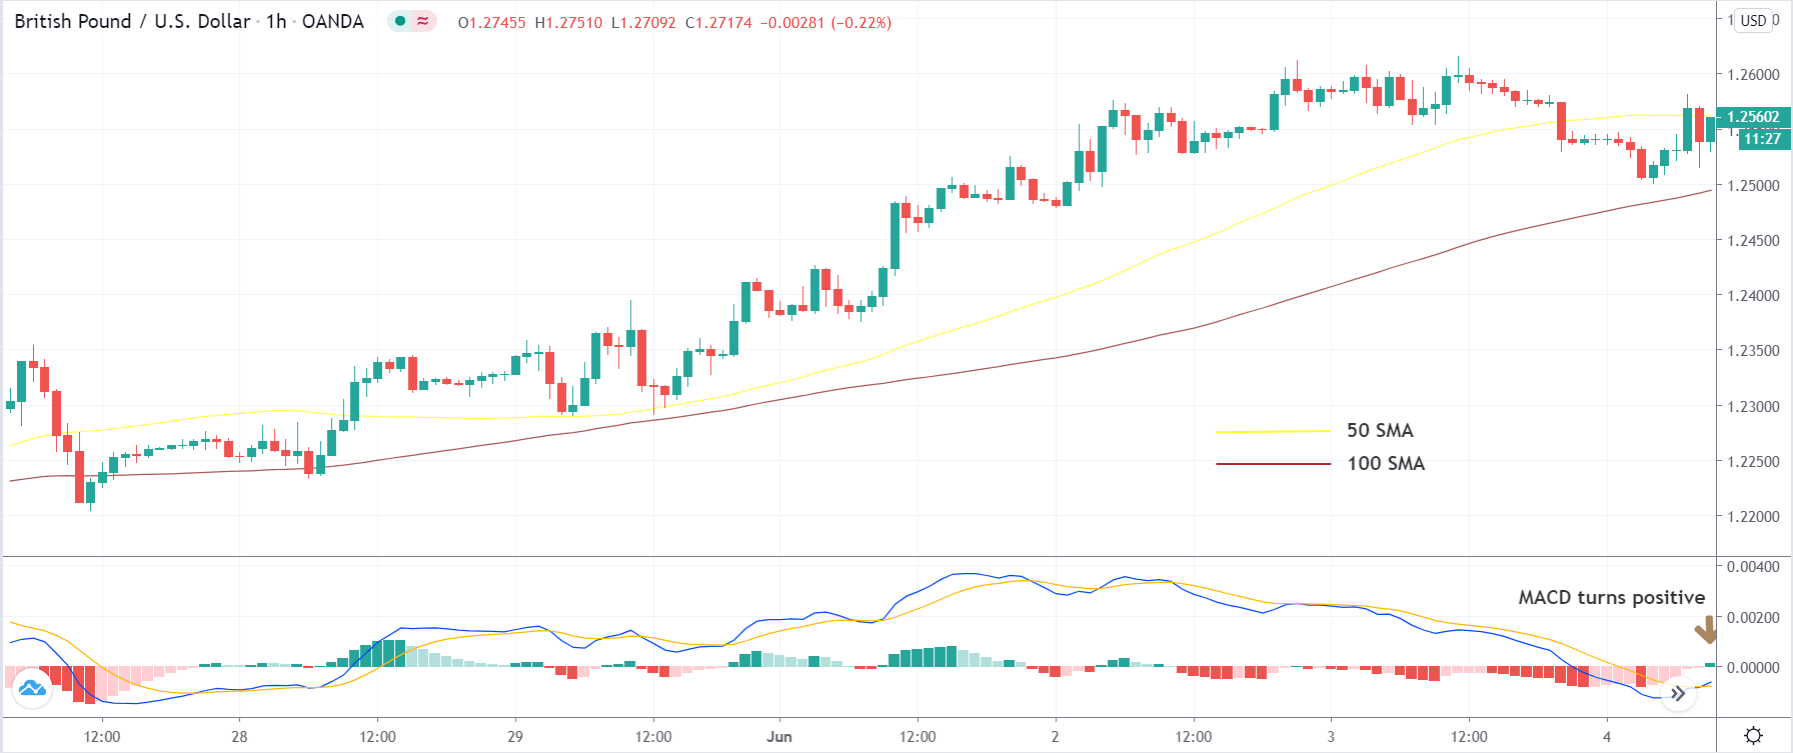
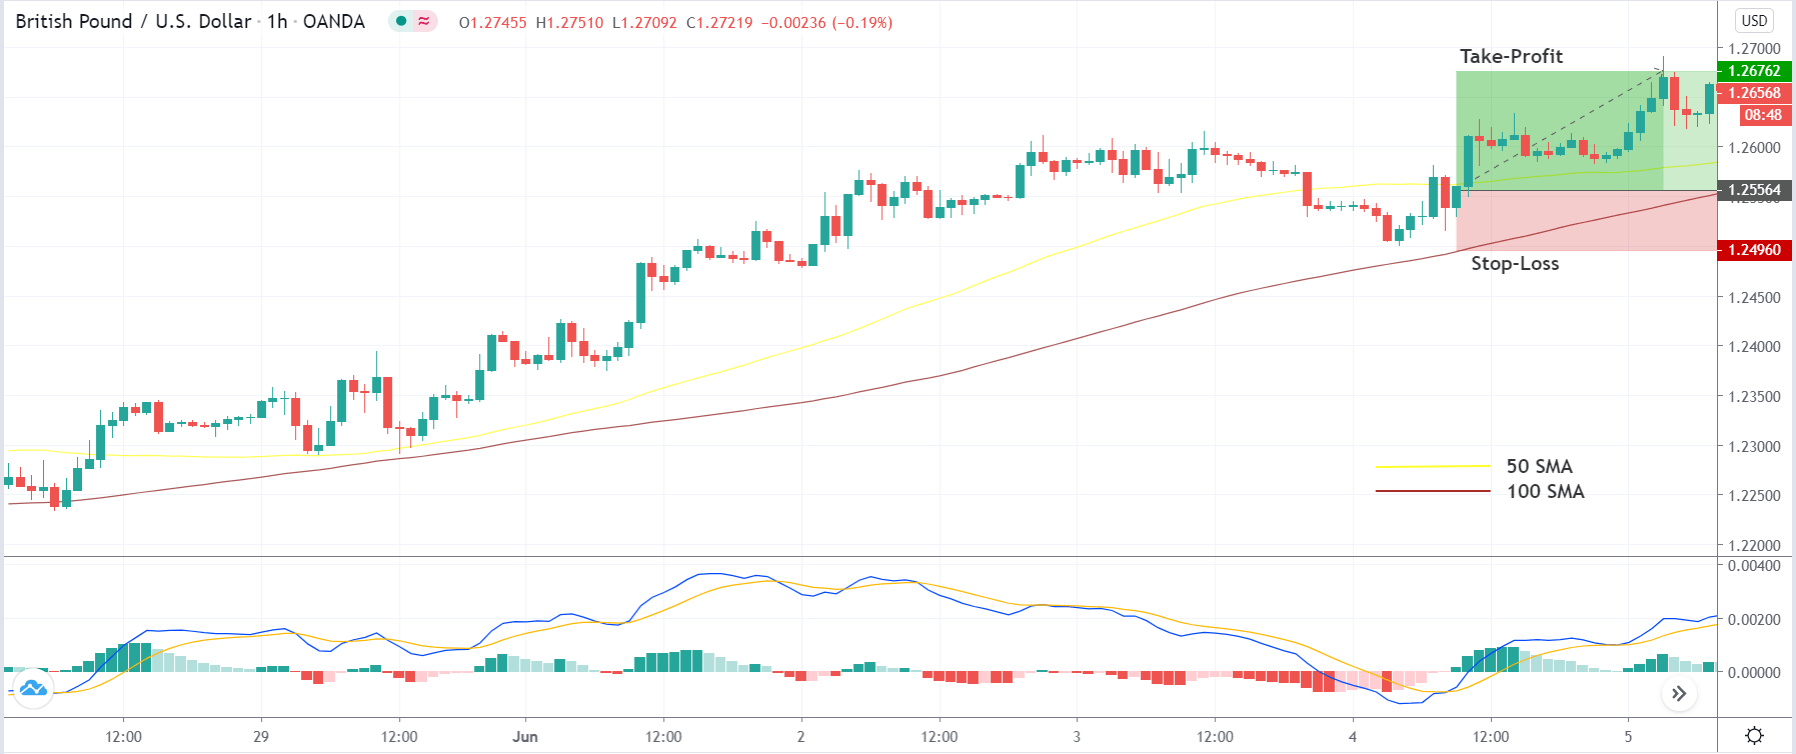
The GBP/USD consolidates at 1.3070 level, holding right above the 50 periods EMA support area of 1.3040 level while the bearish breakout of 1.3040 level can extend selling unto 1.2918 level. Recently as we can see in the chart above that the GBPUSD pair has violated its upward trendline that supported the pair around 1.3130 level, and now below this, we can expect GBP/USD to continue trading bearish. The GBP/USD should show a bearish crossover to confirm a strong selling bias in the Cable. On the higher side, Sterling may find resistance at 1.3105 and 1.3175. Let’s consider selling below 1.3045 level today.
USD/JPY – Daily Analysis
The USD/JPY pair was closed at 106.491 after placing a high of 106.682 and a low of 105.870. Overall the movement of the USD/JPY pair remained bullish throughout the day. The USD/JPY pair extended its previous day gains and rose for the 3rd consecutive day amid increased risk appetite in the market. The Russian vaccine, U.S. Stimulus package, Trump’s executive orders, and the rise of the equity market drove Wednesday’s move of USD/JPY pair.
The President of Russia, Vladimir V. Putin, announced that the Russian government had approved the world’s first coronavirus vaccine. Putin said that his daughter had taken the vaccine in a cabinet meeting, and it has worked adequately enough to declare it safe.
However, global health authorities have said that the vaccine has to complete the last stage of clinical trials to be approved. Despite this, Mr. Putin thanked the scientists in a congratulatory note to the nation who developed the vaccine. He also said that it was “the first” very important step for Russia and generally for the whole world.
Scientists in Russia and other countries said that rushing to offer the vaccine before final-stage testing could backfire. Tens of thousands of people are included in the final stage of trials, and it could take months to prove its effectiveness.
However, investors cheered the news of the vaccine as it was long-awaited, and as in result, the risk appetite of the market rose. The equity markets surged that weighed on the safe-haven Japanese Yen, which ultimately pushed the USD/JPY pair higher, which keeps challenges the upbeat market tone. In the meantime, the White House National Security Adviser Robert O’Brien blamed China while saying that the “Chinese hackers have been targeting U.S. election infrastructure ahead of the 2020 presidential election.” These gloomy updates capped further upside in the currency pair by giving support to the safe-haven Japanese yen.
Later today, the eyes will remain on the U.S. Jobless claims data to determine further trends in the USD/JPY pair.
Daily Technical Levels
| Support | Pivot | Resistance |
| 106.5500 | 106.7900 | 107.1400 |
| 106.2100 | 107.3700 | |
| 105.9700 | 107.7200 |
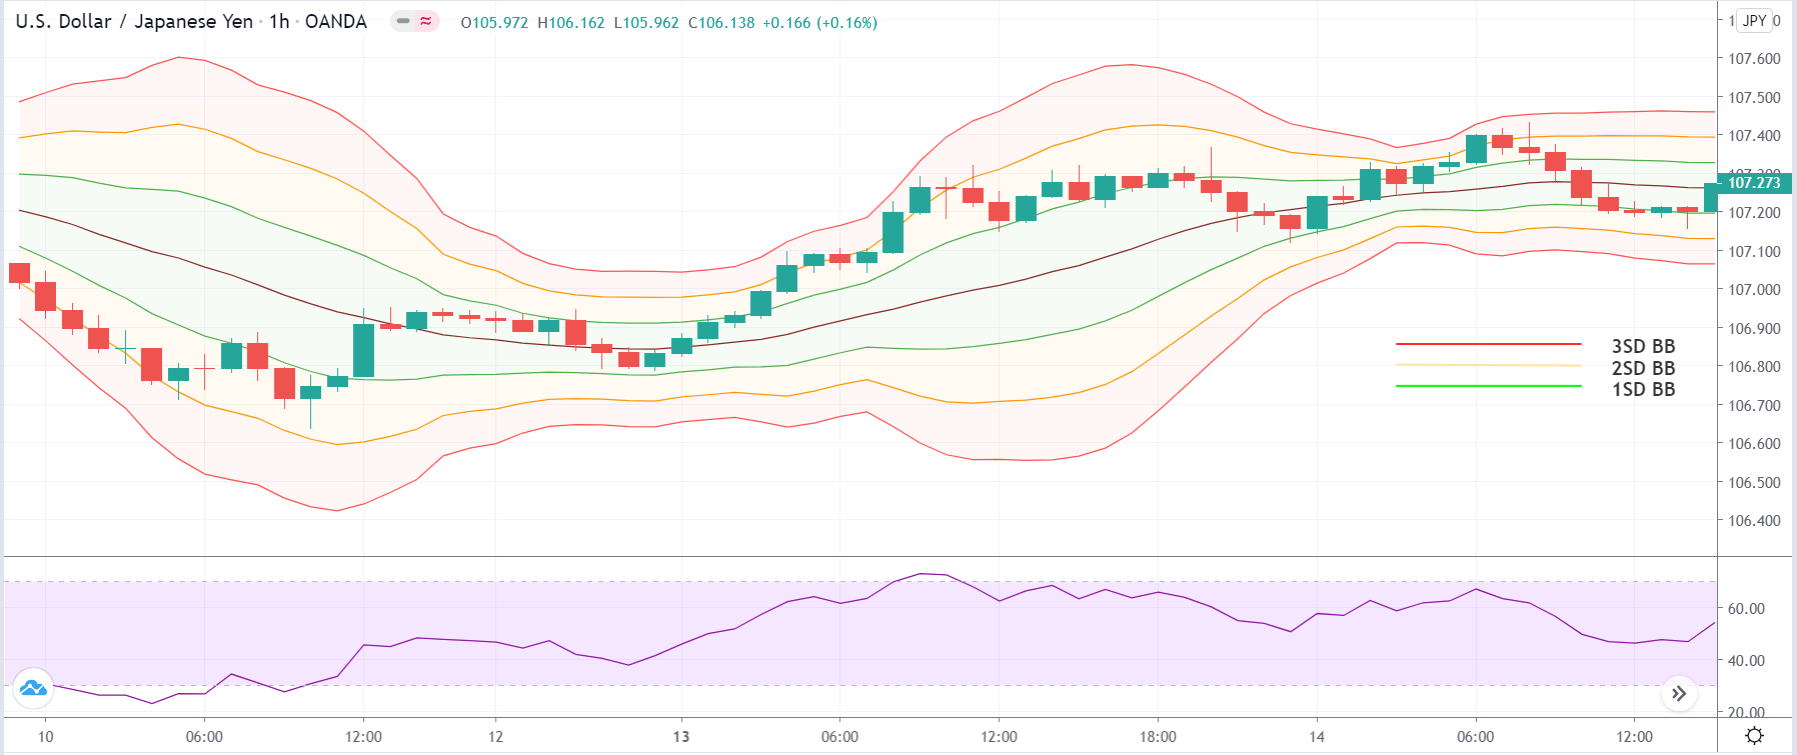
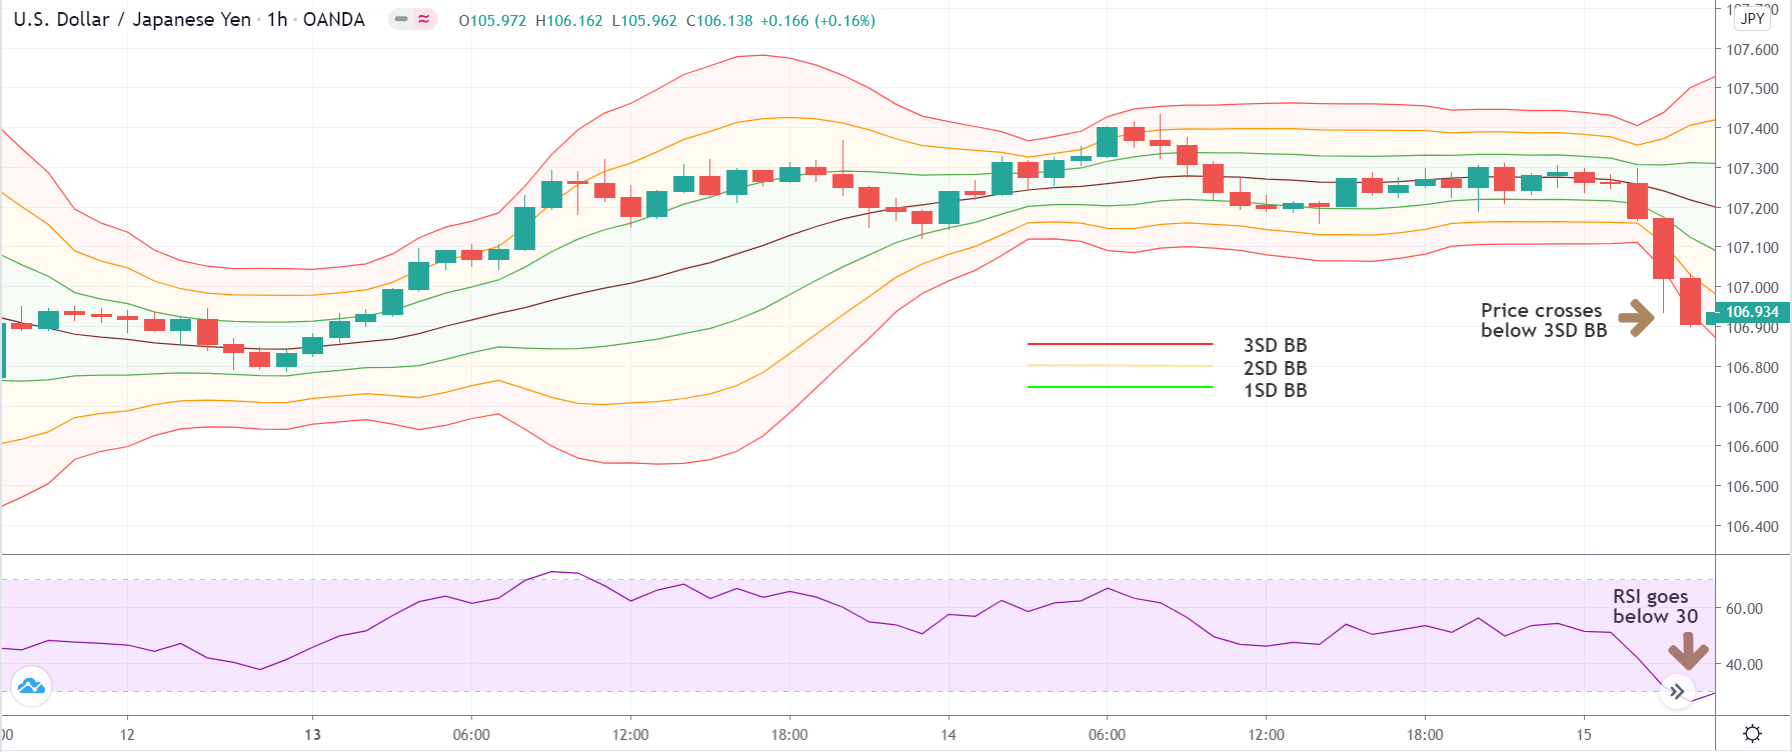
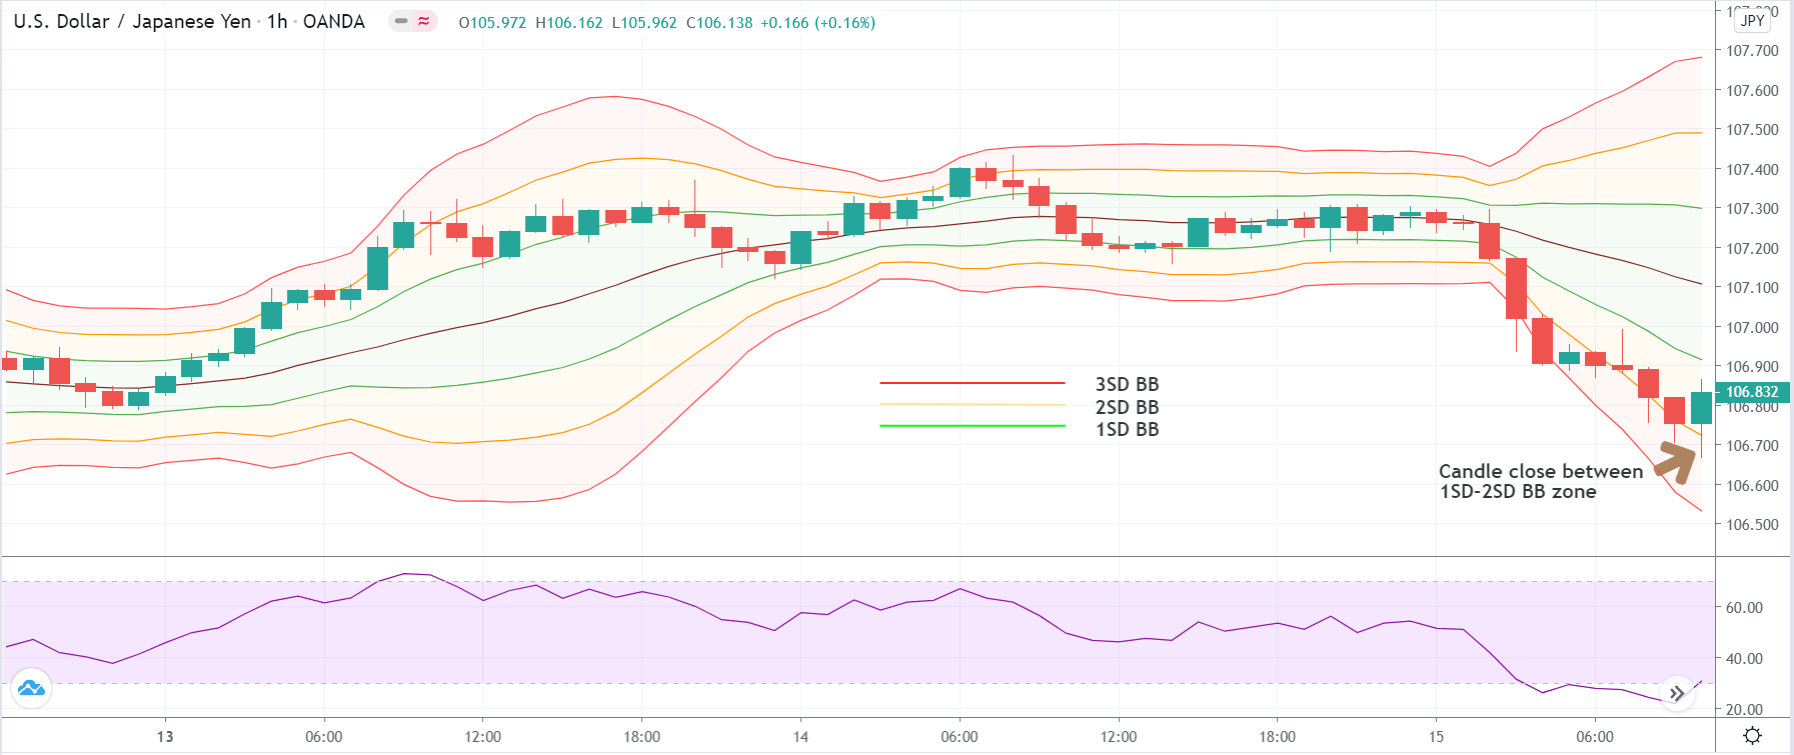
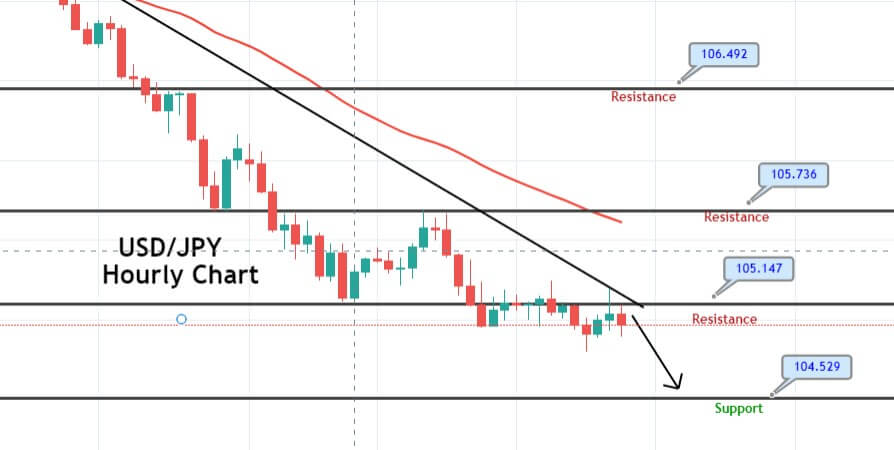
USD/JPY – Trading Tips
The USD/JPY trades sideways over resistance become support level of 106.628 level. Above this, the USD/JPY pair is opening further room for buying until 107.450 level. The RSI and MACD are also supporting bullish bias in the pair. A recent bullish breakout of 106.450 level can extend the buying trend until 107.390. The current market price of USDJPY is staying over 50 EMA, which extends support at 105.950 and may push the pair higher. Let’s consider buying above 106.480 level today. Good luck!