
The cryptocurrency market had quite a weird weekend in terms of price performance. The market and most of its cryptocurrencies had a “flash crash,” but quickly recovered to a price slightly below the previous highs. Bitcoin is currently trading for $11,160, which represents a decrease of 6.59% on the day. Meanwhile, Ethereum lost 4.04% on the day, while XRP gained 1.03%.

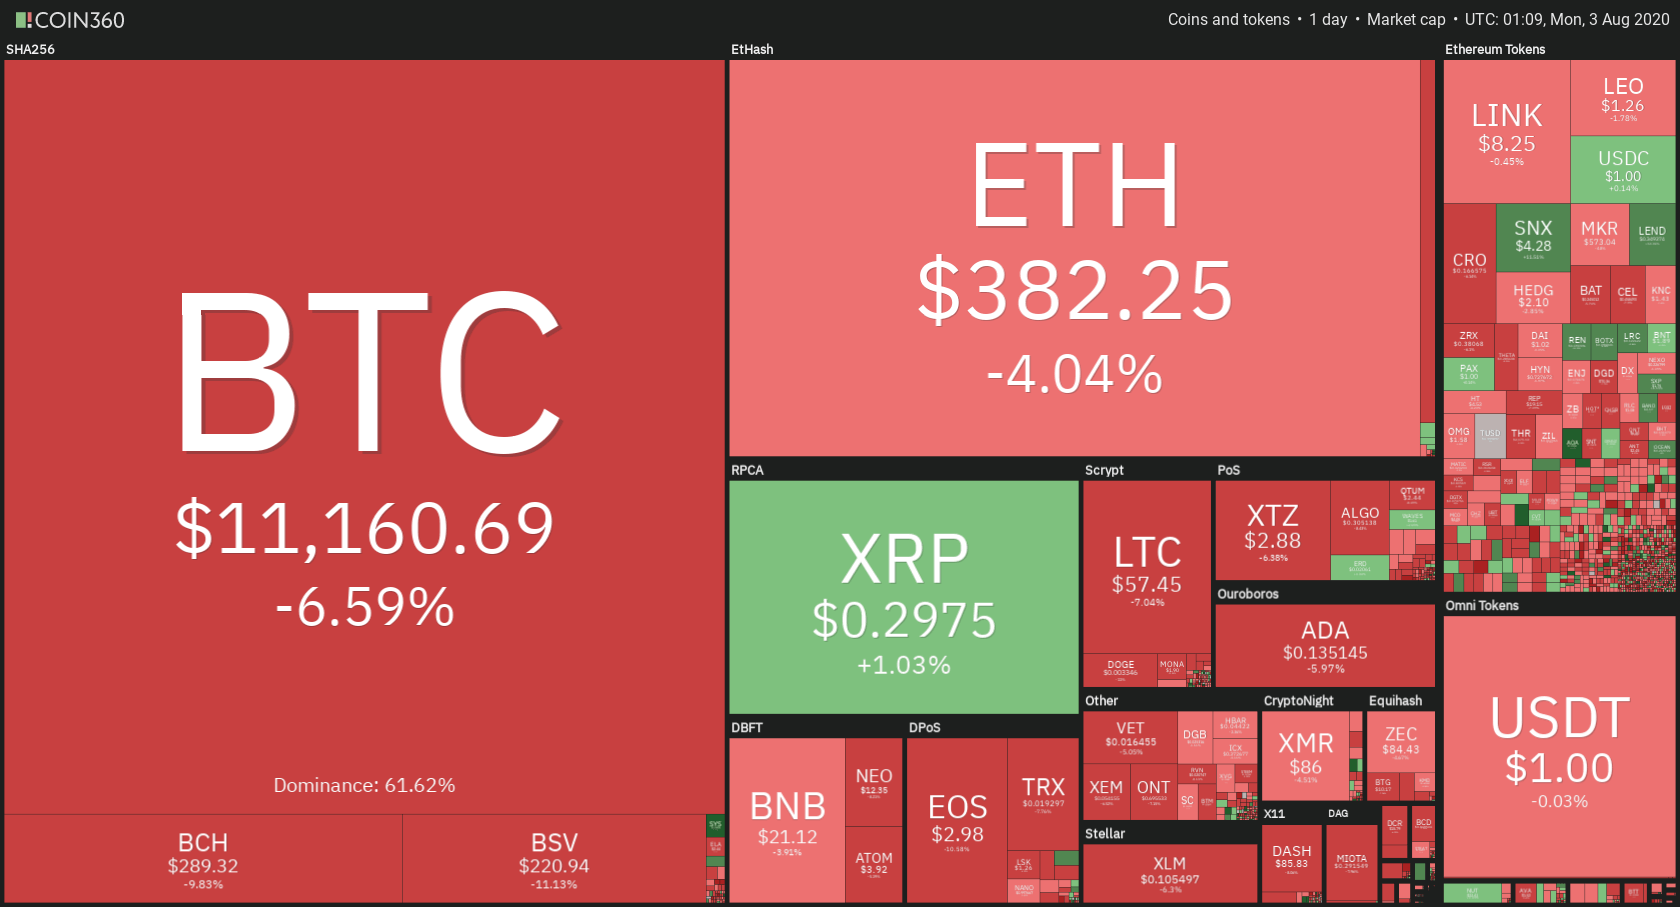
Daily Crypto Sector Heat Map
When talking about top100 cryptocurrencies, Loopring gained 17.24% on the day, making it the most prominent daily gainer. Terra (14.69%) and Synthetix Network (13.73%) also did great. On the other hand, Ampleforth has lost 20.21%, making it the most prominent daily loser. It is followed by The Midas Touch’s loss of 18.78% and Quant’s loss of 15.89%.
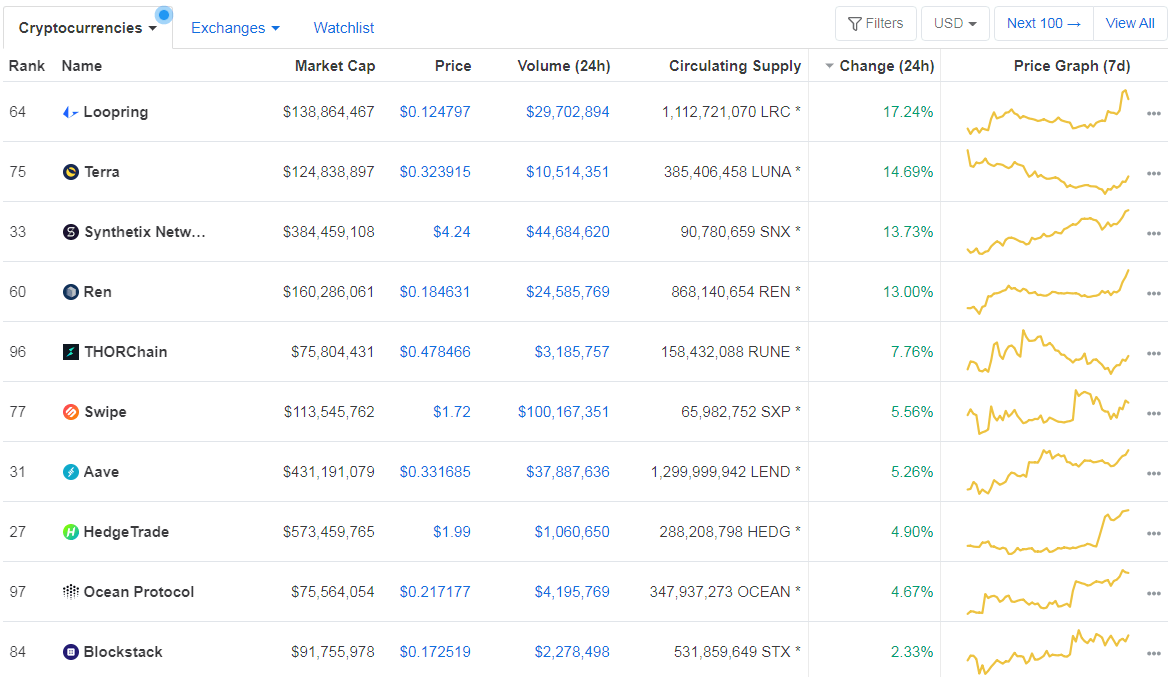
Top 10 24-hour Performers (Click to enlarge)
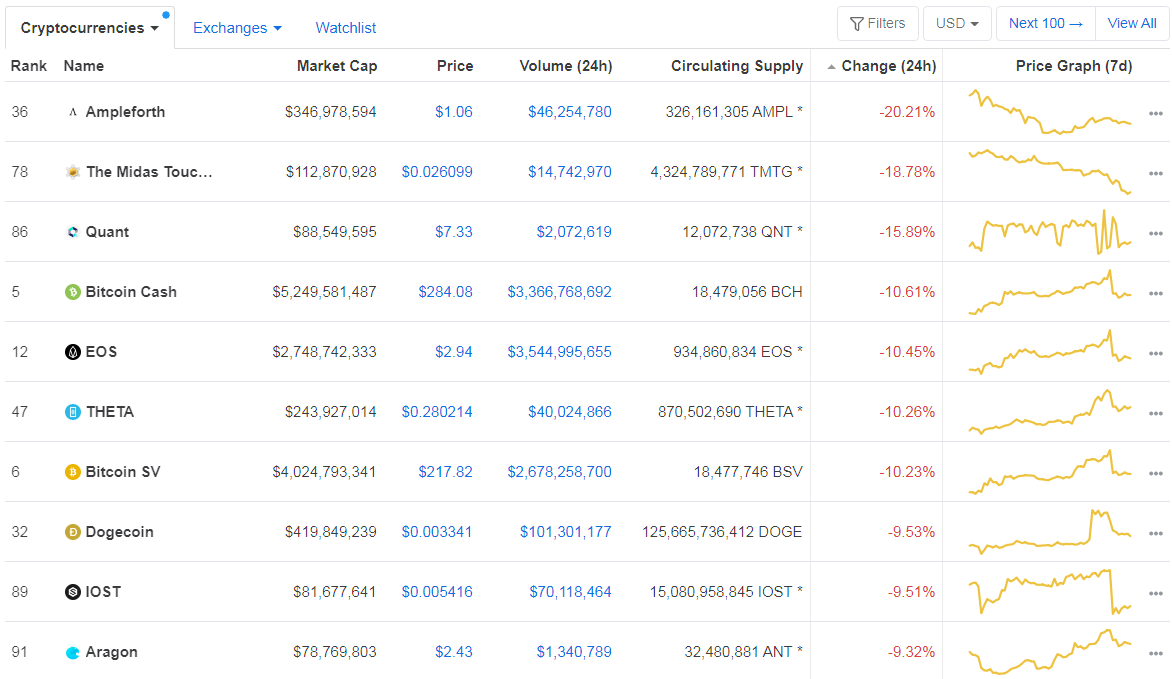
Bottom 10 24-hour Performers (Click to enlarge)
Bitcoin’s dominance level decreased since we last reported, with its value currently at 61.62%. This value represents a 1.29% difference to the downside when compared to Friday’s value.
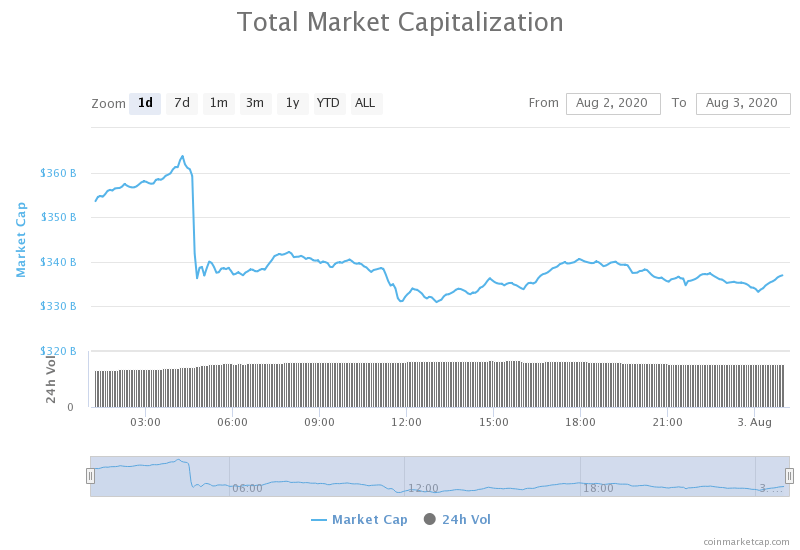
Daily Crypto Market Cap Chart
The cryptocurrency market capitalization increased since we last reported. Its current value is $337.43 billion, which represents an increase of $9.65 billion when compared to the value it had on Friday.
_______________________________________________________________________
What happened in the past 24 hours?
_______________________________________________________________________
- Bitcoin and Ethereum crash by more than 12% in 6 minutes as more than $1B of positions gets liquidated (The Block)
- Decentralized exchange volumes surged to $4.3 billion in July, breaking monthly record (The Block)
- Ethereum Classic experiences 3,693 block-long reorg (The Block)
- Ethereum’s fifth anniversary saw network near $1 trillion in aggregate transaction volume since launch (The Block)
- Uniswap does a third of Coinbase volumes while “Tendies” tokens surge (Cryptoslate)
- Economist: Gold shows that Bitcoin could see further upside despite “blowoff top” (Cryptoslate)
- Why Trump Banning TikTok May Be a Blessing for Bitcoin Price, Adoption (Cointelegraph)
- OKCoin Says Institutional Investors Benefit Most From OCC Crypto Clarity (Cointelegraph)
- Former China Central Bank Exec Pushes for Digital Currencies (Cointelegraph)
- $20,000 Won’t Pose Any Resistance for Bitcoin Price, Says Max Keiser (Cointelegraph)
_______________________________________________________________________
Technical analysis
_______________________________________________________________________
Bitcoin
The largest cryptocurrency by market capitalization spent the weekend crashing down to $10,555 and then recovering from the drop. After the price going up all the way up to $12,000, Bitcoin suddenly dropped to $10,555, which liquidated $1 billion of positions. However, the price quickly recovered and went over $11,000. It is still unsure if the price will end up being above this support level, but it is more likely that BTC will remain above, rather than fall below it.
BTC traders should look for a trade opportunity when BTC bounces from $11,000 or falls below it.
BTC/USD 4-hour Chart
Technical factors:
- Price is currently below its 50-period EMA and its 21-period EMA
- Price is between its bottom B.B. and its middle B.B (20-period SMA)
- RSI is neutral (47.02)
- Volume increased (descending)
Key levels to the upside Key levels to the downside
1: $11,630 1: $11,090
2: $12,000 2: $10,855
3: $10,505
Ethereum
Ethereum acted pretty much the same as Bitcoin over the weekend, with its price reaching a major high of $415, and then plummeting down to $320 before recovering to $380 levels. While the current price is considerably lower than the $415 high, but Ethereum made insane gains over the course of the week and month.
Ethereum traders should look for a trade opportunity after the cryptocurrency decides its price direction.
ETH/USD 4-hour Chart
Technical Factors:
- Price is above the 50-period EMA and the 21-period EMA
- Price is between its top B.B. and its middle B.B (20-period SMA)
- RSI is elevated (61.44)
- Above-average volume (descending)
Key levels to the upside Key levels to the downside
1: $340 1: $302
2: $362 2: $289
3: $278
Ripple
XRP spent the weekend reaching the resistance level of $0.32, which it could not pass over, and then dropping towards the downside. The third-largest cryptocurrency reached a low of $0.241 before bouncing back to above $0.285 level, where it currently is consolidating (and rising slowly).
XRP traders can look for an opportunity in the range between $0.285 and $0.31.
XRP/USD 4-hour Chart
Technical factors:
- Price above 21-period and the 50-period EMA
- Price is between the top B.B. and the middle B.B. (20-period SMA)
- RSI is elevated (63.79)
- Elevated volume (descending)
Key levels to the upside Key levels to the downside
1: $0.32 1: $0.285
2: $0.3328 2: $0.266
3: $0.245
Related posts
 Daily Crypto Review, May 6 – China’s Digital Yuan to Fully Replace Cash? Former BoC President Discusses
 Daily Crypto Review, May 26 – Tether (USDT) now Third-Largest Cryptocurrency by Market Cap; XRP Down to Fourth
 Daily Crypto Review, May 27 – BTC Transaction Fees Down More Than 50%
 Daily Crypto Review, Jun 05 – Hackers Target US Universities After “Kidnapping” a Whole Town; BTC Used as Ransom