The cryptocurrency market mostly traded sideways as Bitcoin was fighting to regain $11,000. Bitcoin is currently trading for $11,065, which represents an increase of 1.2% on the day. Meanwhile, Ethereum gained 0.33% on the day, while XRP gained 0.45%.
Daily Crypto Sector Heat Map
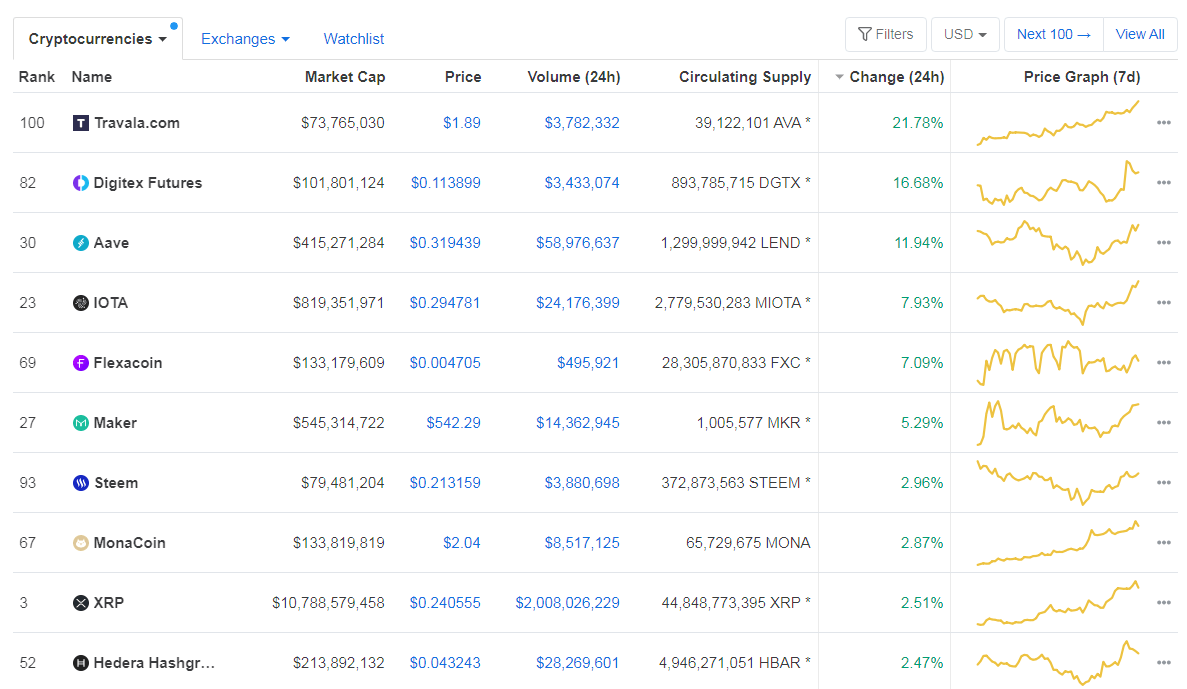
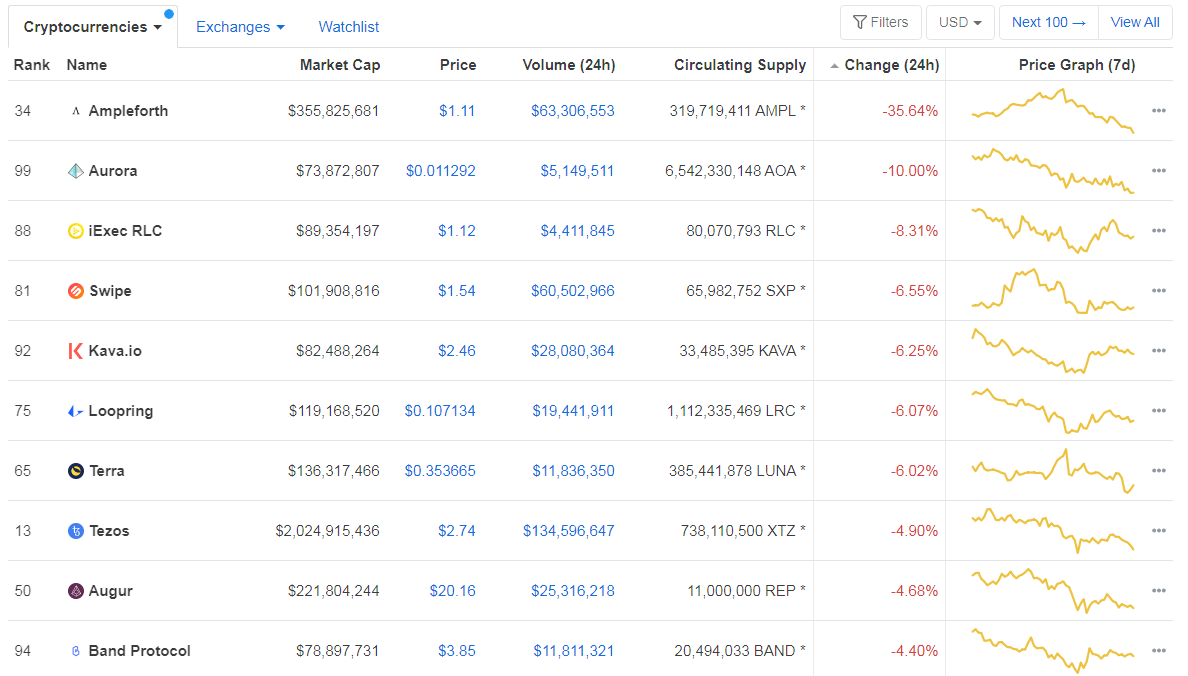
When talking about top100 cryptocurrencies, Travala.com gained 21.78% on the day, making it the most prominent daily gainer. Digitex Futures (16.68%) and Aave (11.94%) also did great. On the other hand, Ampleforth has lost 35.64%, making it the most prominent daily loser. It is followed by Aurora’s loss of 10% and iExec RLC’s loss of 8.31%.
Top 10 24-hour Performers (Click to enlarge)
Bottom 10 24-hour Performers (Click to enlarge)
Bitcoin’s dominance level increased slightly since we last reported, with its value currently at 63.66%. This value represents a 0.35% difference to the upside when compared to yesterday’s value.
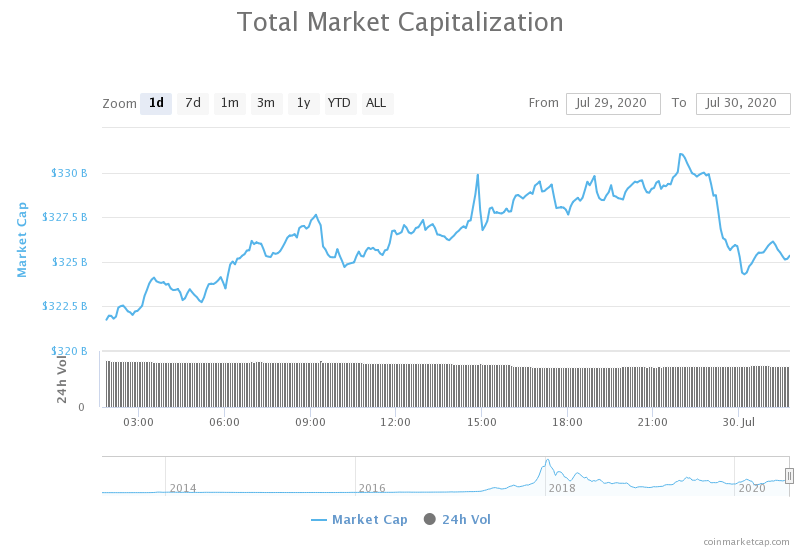
Daily Crypto Market Cap Chart
The cryptocurrency market capitalization increased since we last reported. Its current value is $325.17 billion, which represents an increase of $4.246 billion when compared to the value it had yesterday.
_______________________________________________________________________
What happened in the past 24 hours?
_______________________________________________________________________
- Bitcoin Is a Better Hedge Against USD Than Gold (Cointelegraph)
- Ethereum’s Adoption Rate After 5 Years Far Exceeds Bitcoin’s (Cointelegraph)
- Bitcoin Scaling Tech Could Have Saved Companies and Users $500M in Fees: Report (Coindesk)
- Data: Institutions are now more involved with Bitcoin than ever before (Cryptoslate)
- Utreexo: ‘re-thinking’ how Bitcoin works to help it scale without a protocol change (The Block)
- As Binance slows down asset listings, Poloniex attempts to retake market share (The Block)
- DeFi lending protocol Aave details its decentralization bid, outlines swap process for new token (The Block)
- Coinbase will now reward users who hold DAI in their accounts (The Block)
- Binance launches crypto trading platform in Australia (The Block)
- Despite Its Hype, DeFi Only Attracts 1% of All Crypto Users (Cryptobriefing)
_______________________________________________________________________
Technical analysis
_______________________________________________________________________
Bitcoin
The largest cryptocurrency by market capitalization had another slow day, where it tried to pass $11,000 and consolidate above it. However, while it has passed the threshold, BTC hasn’t confirmed its position above it, making the $11,000 mark uncertain. The $10,855 support level is, on the other hand, a strong support that has been confirmed.
BTC traders should look for a trade opportunity when BTC bounces off of $10,855 or falls below it.
BTC/USD 4-hour Chart
Technical factors:
- Price is currently above its 50-period EMA and its 21-period EMA
- Price is between its top B.B. and its middle B.B (20-period SMA)
- RSI is elevated (62.24)
- Volume increased (descending)
Key levels to the upside Key levels to the downside
1: $10,855 1: $10,505
2: $11,090 2: $10,015
3: $11,630 3: $9,870
Ethereum
Ethereum spent its day consolidating above the $315 level, finding support at the 21-period moving average. The second-largest cryptocurrency by market cap ensured its position above $302 (at least in the short-term). Its future movement will most likely be determined by Bitcoin’s next move.
Ethereum traders should look for a trade opportunity after the cryptocurrency breaks its consolidation phase.
ETH/USD 4-hour Chart
Technical Factors:
- Price is above the 50-period EMA and the 21-period EMA
- Price is under the middle B.B. (20-period SMA)
- RSI has normalized (56.41)
- Above-average volume (descending)
Key levels to the upside Key levels to the downside
1: $340 1: $302
2: $362 2: $289
3: $278
Ripple
Unlike Bitcoin and Ethereum, the third-largest cryptocurrency by market cap maintained high volume and tried to make a move that would break its current ranging position. XRP first moved to the upside, trying to break $0.2454, but failed to do so, which triggered a reaction from XRP bears. The cryptocurrency then made an attempt to break $0.235 to the downside but failed in doing that as well, therefore “locking” XRP in a range between the two resistances.
XRP traders can look for an opportunity when the cryptocurrency breaks its ranging moves to either side.
XRP/USD 4-hour Chart
Technical factors:
- XRP in a mid-term descending trend (though it broke the trend in the short-term)
- Price above 21-period and the 50-period EMA
- Price is between the top B.B. and the middle B.B. (20-period SMA)
- RSI is elevated (65.63)
- Elevated volume
Key levels to the upside Key levels to the downside
1: $0.235 1: $0.227
2: $0.245 2: $0.214
3: $0.205






2 replies on “Daily Crypto Review, July 30 – Bitcoin Confirmed as Better Hedge than Gold? BTC fighting for $11,000”
interesting a lot of cryptos on the rise
Interesting indeed Craig!