The cryptocurrency market mostly traded sideways as Bitcoin still continues its fight for $11,000. Bitcoin is currently trading for $11,065, which represents a decrease of 0.43% on the day. Meanwhile, Ethereum gained 4.76% on the day, while XRP gained 2.04%.

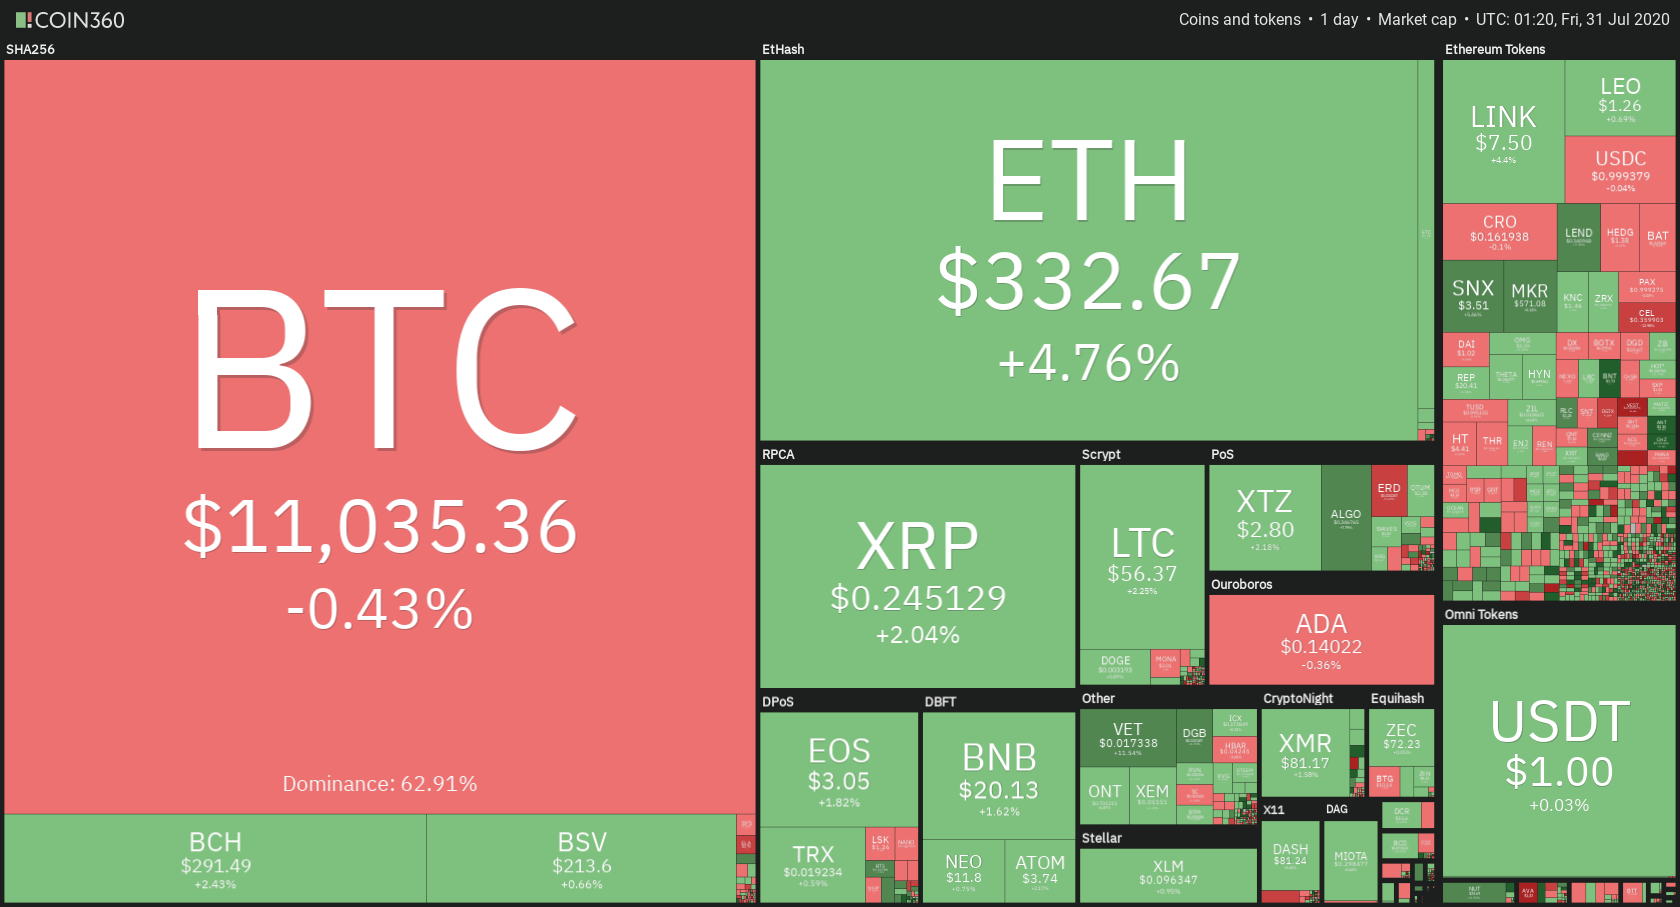
Daily Crypto Sector Heat Map
When talking about top100 cryptocurrencies, Chilliz gained 29.75% on the day, making it the most prominent daily gainer. Bancor (14%) and VeChain (12.22%) also did great. On the other hand, Ampleforth has lost 45.57%, making it the most prominent daily loser. It is followed by Flexacoin’s loss of 8.58% and Quant’s loss of 8.06%.
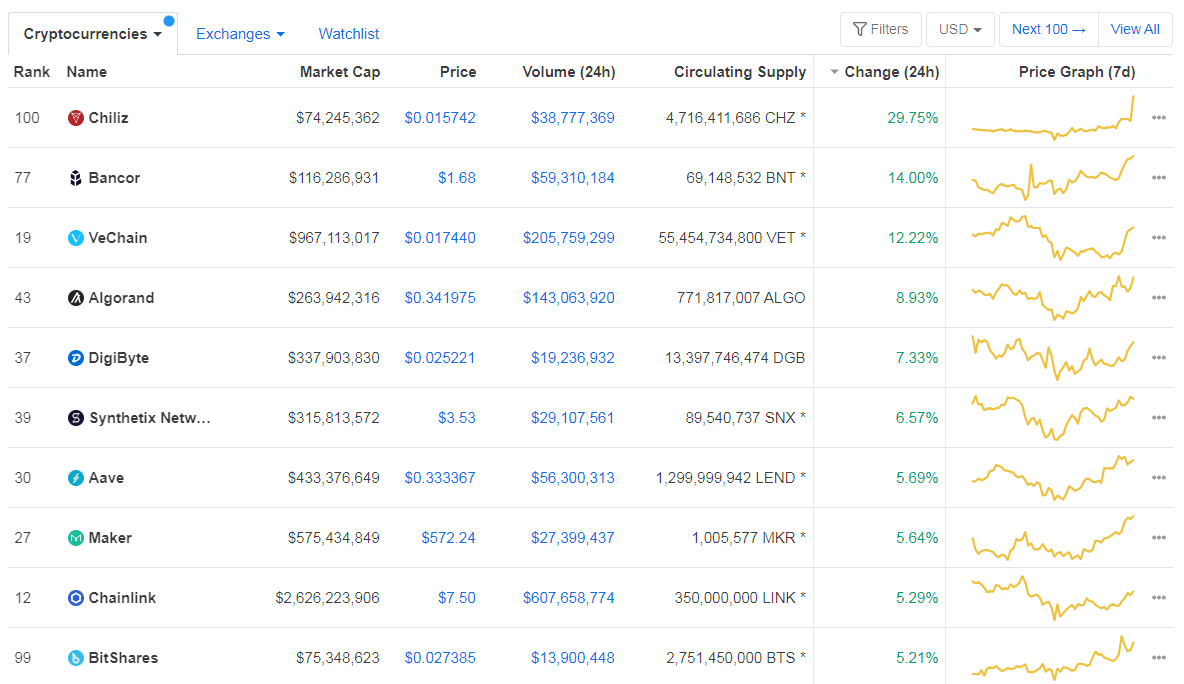
Top 10 24-hour Performers (Click to enlarge)

Bottom 10 24-hour Performers (Click to enlarge)
Bitcoin’s dominance level decreased slightly since we last reported, with its value currently at 62.91%. This value represents a 0.75% difference to the downside when compared to yesterday’s value.
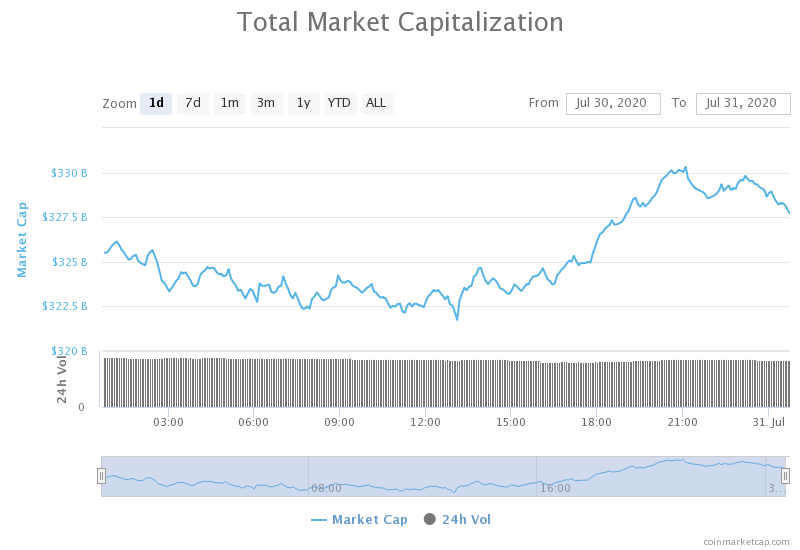
Daily Crypto Market Cap Chart
The cryptocurrency market capitalization increased slightly since we last reported. Its current value is $328.13 billion, which represents an increase of $3.04 billion when compared to the value it had yesterday.
_______________________________________________________________________
What happened in the past 24 hours?
_______________________________________________________________________
- XRP Whales Go Into Buying Frenzy, Further Gains Ahead? (Cryptobriefing)
- Chinese authorities have arrested all 27 major suspects of PlusToken Ponzi scheme – report (The Block)
- Circle links up with Genesis Global Trading to advance USDC services, nets $25M in funding from Digital Currency Group (The Block)
- SEC highlights Binance Chain transaction tracing in new contract notice (The Block)
- The number of Robinhood users holding Kodak stocks soars after Trump admin announces $765M loan (The Block)
- Here’s how Bitcoin’s rally past $11,000 has altered its fundamental strength (Cryptoslate)
- VC: Ethereum has “negative” network effects, needs scaling solutions “NOW” (Cryptoslate)
- China Aims to Be the World’s Dominant Blockchain Power – With Help From Google, Amazon and Microsoft (Coindesk)
- Bank of England Building Payments Network to Support a Potential Digital Pound (Coindesk)
- Binance Confirms Crypto Debit Cards Shipping to Europe (Cointelegraph)
_______________________________________________________________________
Technical analysis
_______________________________________________________________________
Bitcoin
The largest cryptocurrency by market capitalization spent the day fighting for $11,000 yet again. The sideways movement ranged from the support of $10,855 to a little above $11,090 resistance level. While it is still unsure of whether Bitcoin will end up above or below $11,000, the rally from the $9,000 levels has been extremely successful. As for the short-term future of Bitcoin, it is still unsure, as some analysts call for an immediate correction while others predict a price increase to $11,500 levels.
BTC traders should look for a trade opportunity when BTC bounces off of $10,855 or falls below it.
BTC/USD 4-hour Chart
Technical factors:
- Price is currently above its 50-period EMA and its 21-period EMA
- Price is between its top B.B. and its middle B.B (20-period SMA)
- RSI is elevated (60.82)
- Volume increased (descending)
Key levels to the upside Key levels to the downside
1: $11,090 1: $10,855
2: $11,630 2: $10,505
3: $10,015
Ethereum
Ethereum broke off from its period of stagnation and moved towards the upside. The second-largest cryptocurrency by market cap moved to $340 before being stopped. ETH is now consolidating just above the previous consolidation phase.
Ethereum traders should look for a trade opportunity after the cryptocurrency moves back below $324 or if it makes another move towards the upside.
ETH/USD 4-hour Chart
Technical Factors:
- Price is above the 50-period EMA and the 21-period EMA
- Price is at the top B.B.
- RSI is elevated (66.5)
- Above-average volume (descending)
Key levels to the upside Key levels to the downside
1: $340 1: $302
2: $362 2: $289
3: $278
Ripple
XRP spent its day mostly trading sideways, but also gaining in value slightly. The third-largest cryptocurrency by market cap failed (so far) to break the $0.2454 level completely, but it has approached that event considerably. If, however, XRP doesn’t break the resistance level soon, it might fall back and retest the support level of $0.235.
XRP traders can look for an opportunity when the cryptocurrency breaks its ranging moves to either side.
XRP/USD 4-hour Chart
Technical factors:
- XRP in a mid-term descending trend (though it broke the trend in the short-term)
- Price above 21-period and the 50-period EMA
- Price is between the top B.B. and the middle B.B. (20-period SMA)
- RSI is elevated (61.84)
- Elevated volume (descending)
Key levels to the upside Key levels to the downside
1: $0.245 1: $0.235
2: $0.227
3: $0.214
Related posts
 Daily Crypto Review, Oct 23 – PayPal Enabling Crypto Not as Good as it Sounds; Ethereum Pushes Towards $420
 Daily Crypto Review, Oct 29 – Bitcoin Back At $13,000: What’s Next? Trading Ideas and Market Overview
 Daily Crypto Review, Nov 10 – Bitcoin Miners Migrated: BTC Hash Rate Up 42%
 Daily Crypto Review, Nov 30 – Ethereum Soars on Great Fundamentals; Bitcoin Bulls Back in the Game
One reply on “Daily Crypto Review, July 31 – Binance Debit Cards Now in Europe; XRP Whales Started Buying?”
Big step forward with debit cards