
Introduction
In our previous course lessons, we saw how to trade breakouts in an effective manner. As we know, Breakout trading is one of the most common ways of trading the financial markets. Most of the other trading tools tend to fail in accurately identifying a trading signal, or they lag a lot in doing so. But that’s not the case with breakout trading. If done accurately, it helps traders in making consistent cash from the market.
In this lesson, let’s learn how to trade breakouts using trendlines. Trendlines are one of the simplest tools you can use to trade the breakouts on both lower and higher timeframes.
Trendline and it’s working!
A trend line highlights the ongoing trend by connecting the swing lower highs in an uptrend and swing higher lows in a downtrend. Just like S&R levels, trendlines also signify the appropriate areas to enter the market. The only difference is that support and resistance levels are horizontal areas while trendlines are sloping. Now let’s get to the topic.
Trading Breakouts Using Trendlines
Upward Trendline
An upward trend line connects a swing high to swing low from the lowest point to the highest point in an ongoing trend.
Buy Trade 1
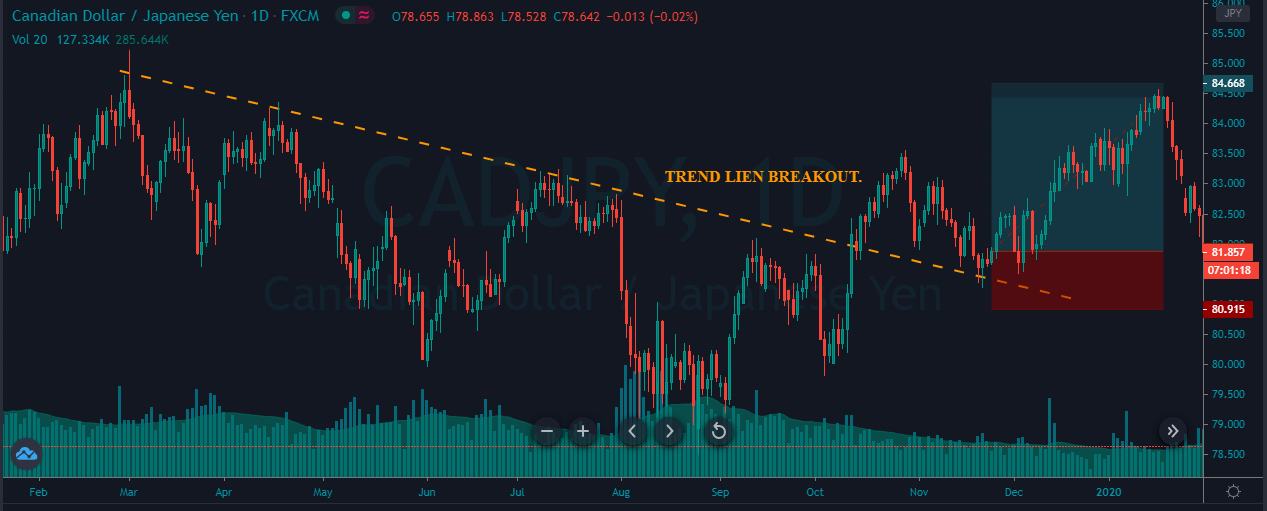
The price chart below represents a trendline Breakout on the daily chart.
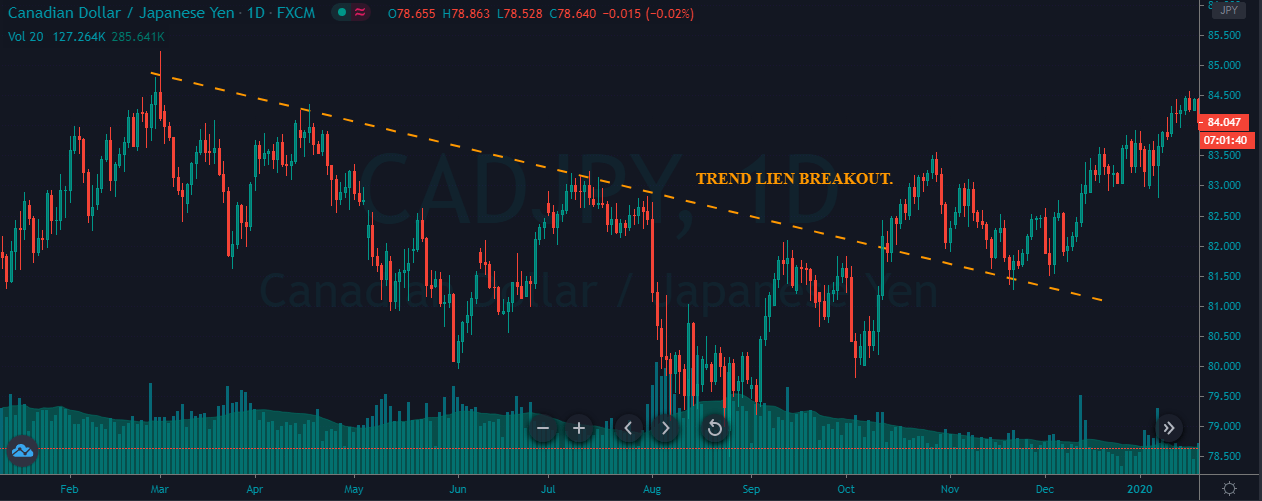
By looking at the market, it is clear that the sellers had a hard time going down as the buyers continue to give a strong fight. After a couple of months, sellers gave up, and buyers took the show to break above the trend line. The hold above the trendline confirms the buying entry in this pair. After riding the uptrend for a bit, we understood that the buyers got weak. Hence we decided to close our positions at the most recent higher high.
Buy Trade 2
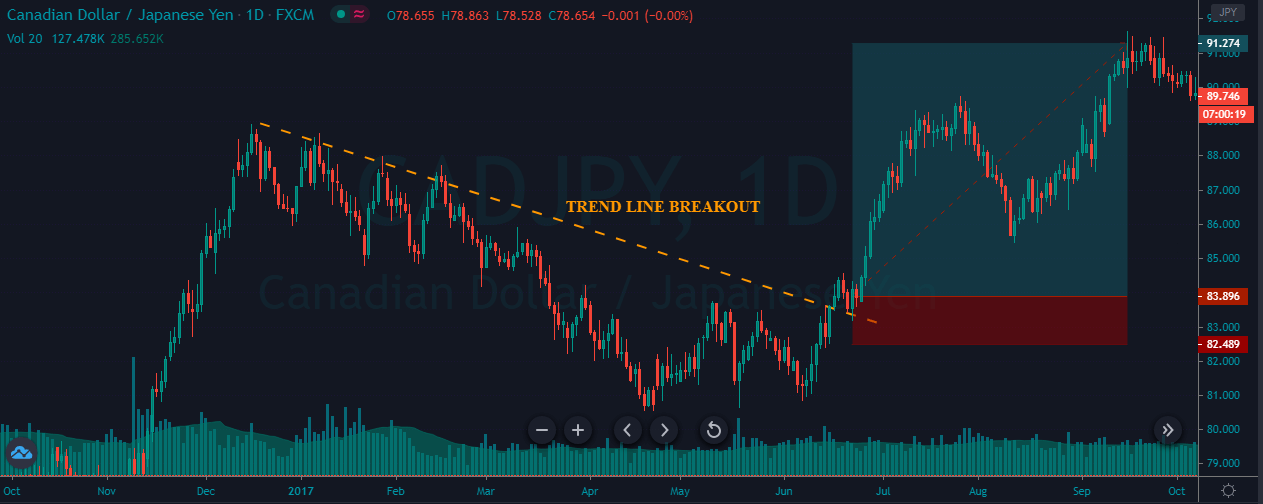
The image below represents a trendline breakout in the CAD/JPY forex pair.
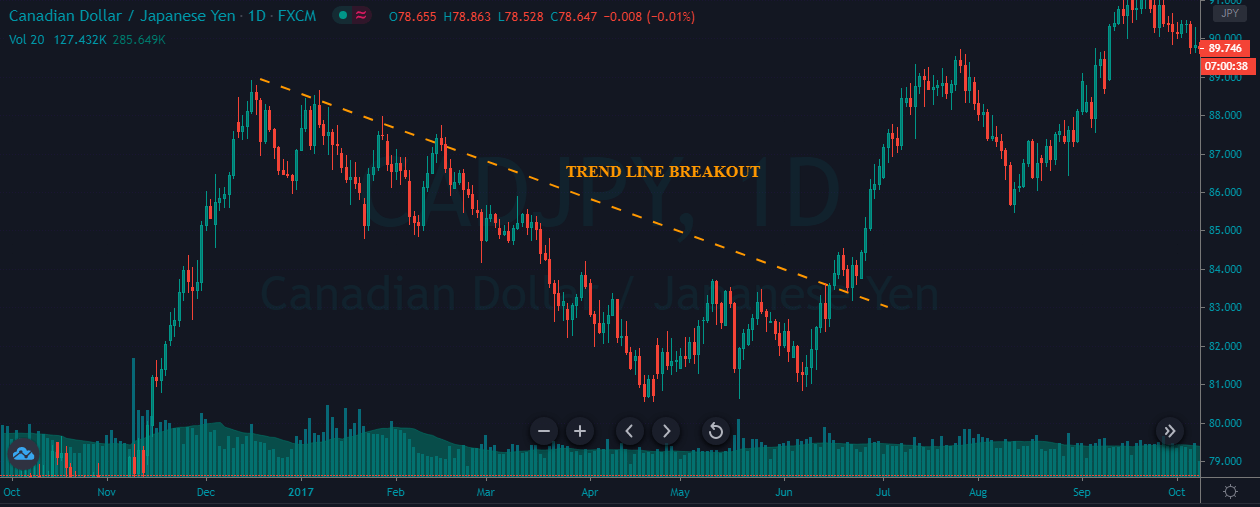
The pair was in a strong uptrend, and during the pullback phase, when the price action broke above the trend line, it indicates that the buyers are ready to lead the market again. The hold above the trendline confirms our buy entry. The original trend was quite strong, so the stop below the trend line was good enough to ride a new trend.
Downward Trendline
Downward trend line connects a swing low to swing high from the highest point in a trend to the lowest point in a trend.
Sell Trade 1
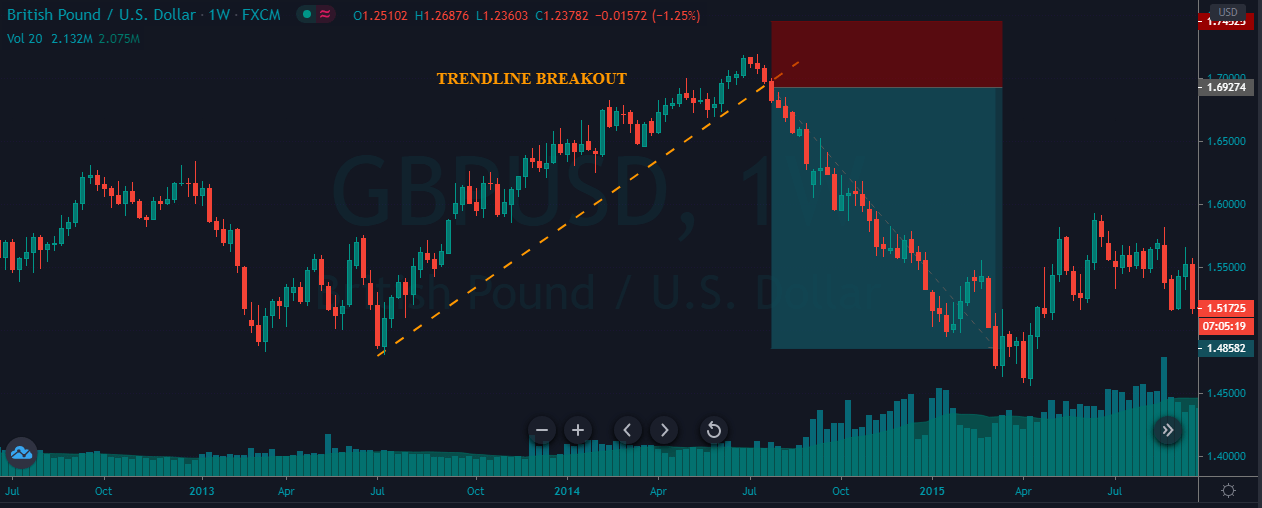
The chart below represents a trendline breakout in the GBP/USD Forex pair.
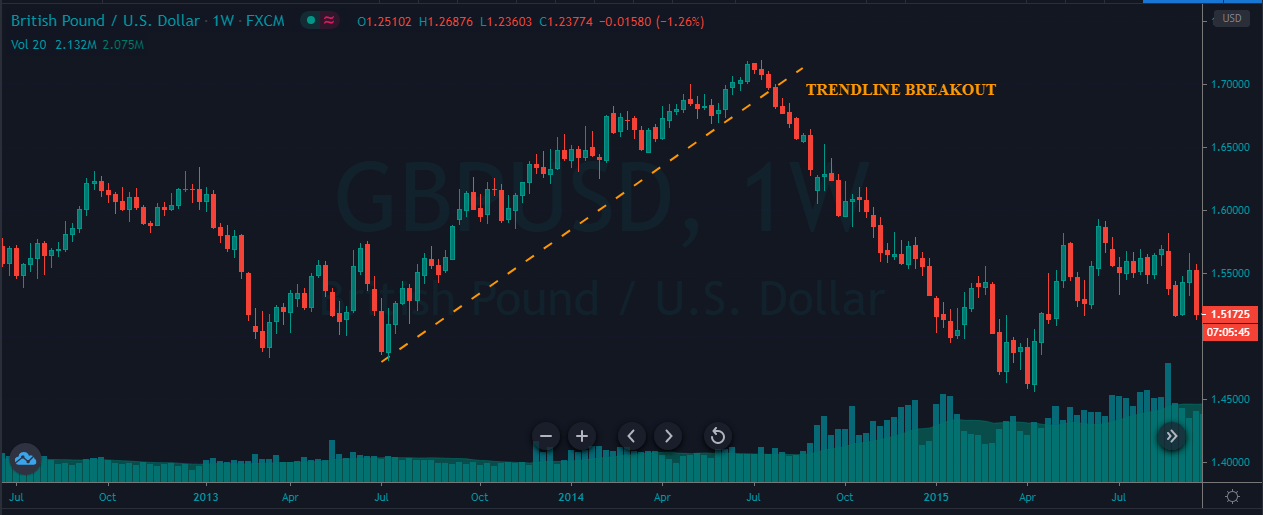
As we can see, the buying trend was quite strong, and the price action closely followed the trendline. A breakout below the trendline is a clear indication for us to go short in this pair.
Sell Trade 2
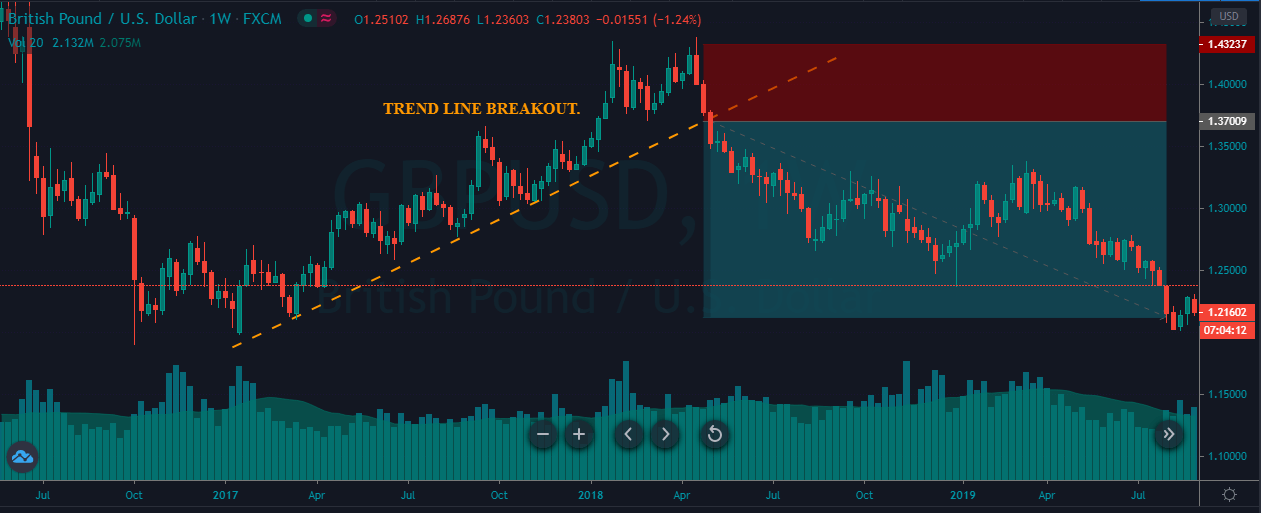
The price chart below represents the breakout of a trend line in the GBP/USD Forex pair.
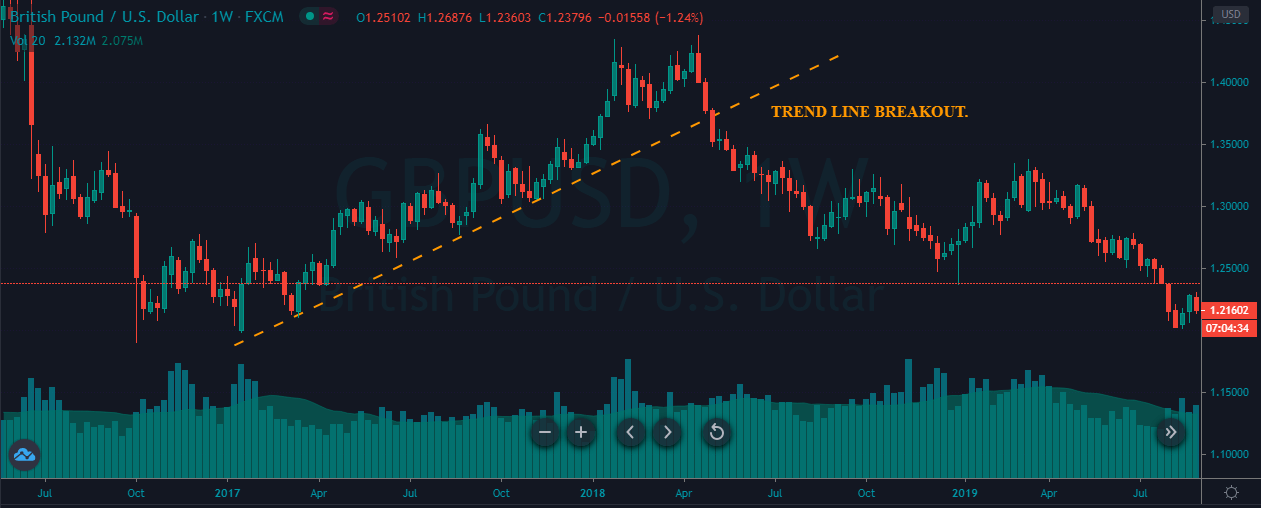
We can see the pullback on a weekly chart, and during the pullback, the price broke below the trendline. This shows that the sellers are desperate to take the price down. After our entry, the price went down and turned sideways. After a few weeks, it again goes down, and we choose to close our trade at the most recent lower low.
This attempt is to give you an understanding of how to trade trendline breakouts in most of the scenarios. In our upcoming lessons, let’s delve deeper into this concept. Cheers!
[wp_quiz id=”83527″]