
The cryptocurrency market ended up mostly in the green, with (of course) a few exceptions. Bitcoin is currently trading for $11,665, which represents an increase of 3,46% on the day. Meanwhile, Ethereum gained 1.6% on the day, while XRP gained 1.41%.

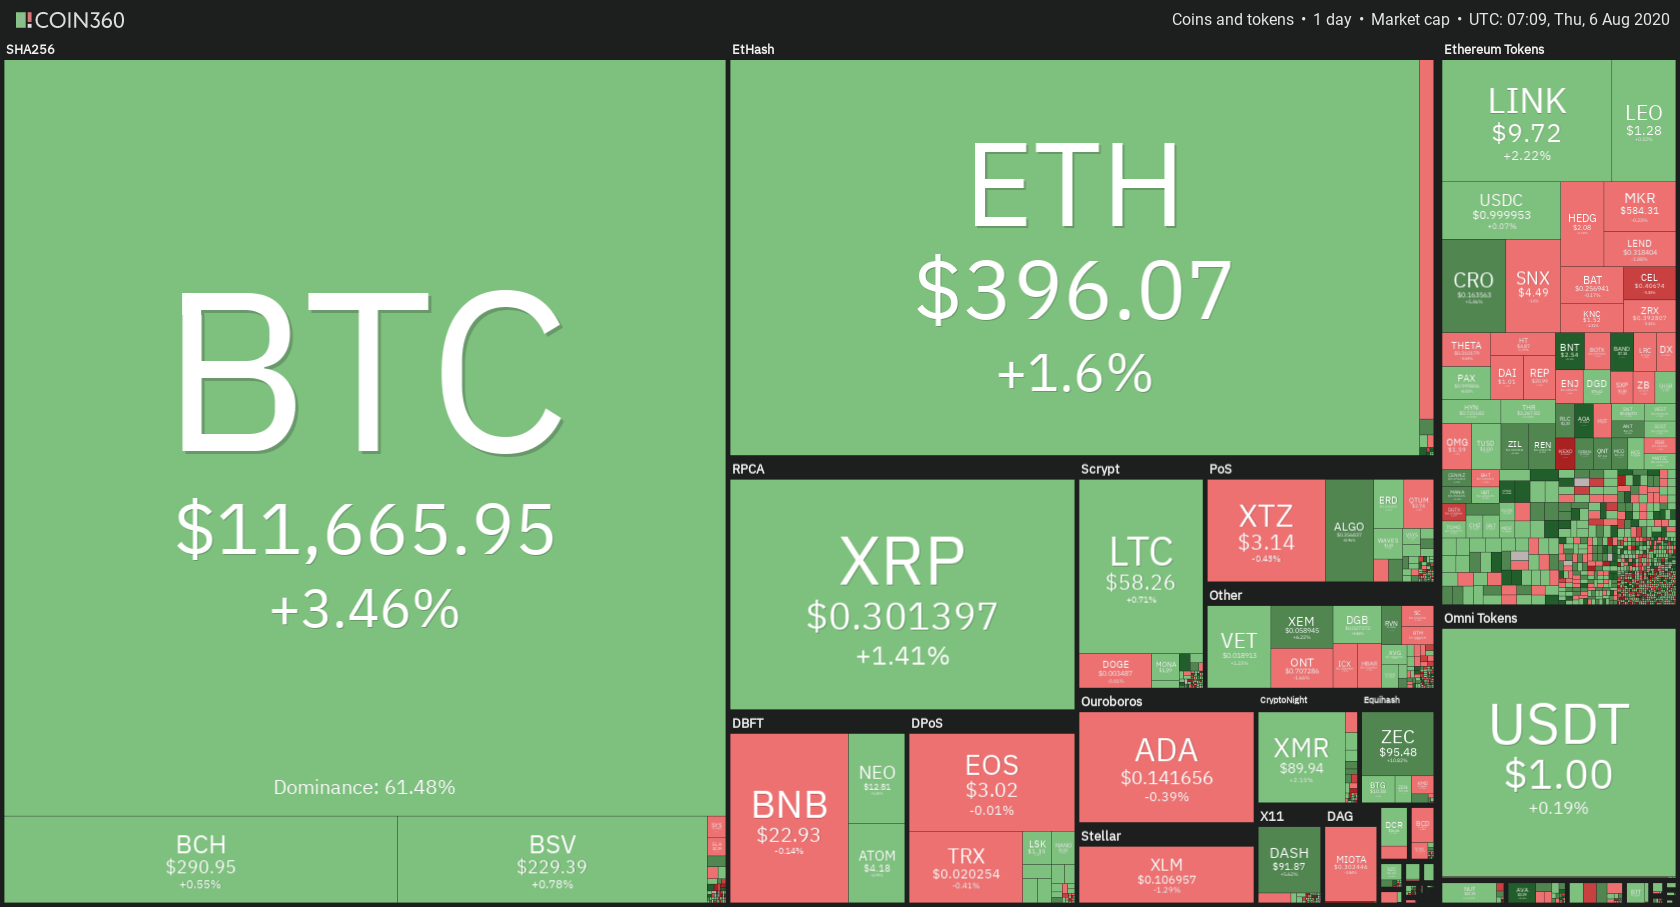
Daily Crypto Sector Heat Map
When talking about top100 cryptocurrencies, Band Protocol gained 36.21% on the day, making it the most prominent daily gainer. Travala.com (24%) and Bancor (22.19%) also did great. On the other hand, Nexohas lost 21.32%, making it the most prominent daily loser. It is followed by The Midas Touch’s loss of 8.47% and THORChain’s loss of 7.70%.

Top 10 24-hour Performers (Click to enlarge)
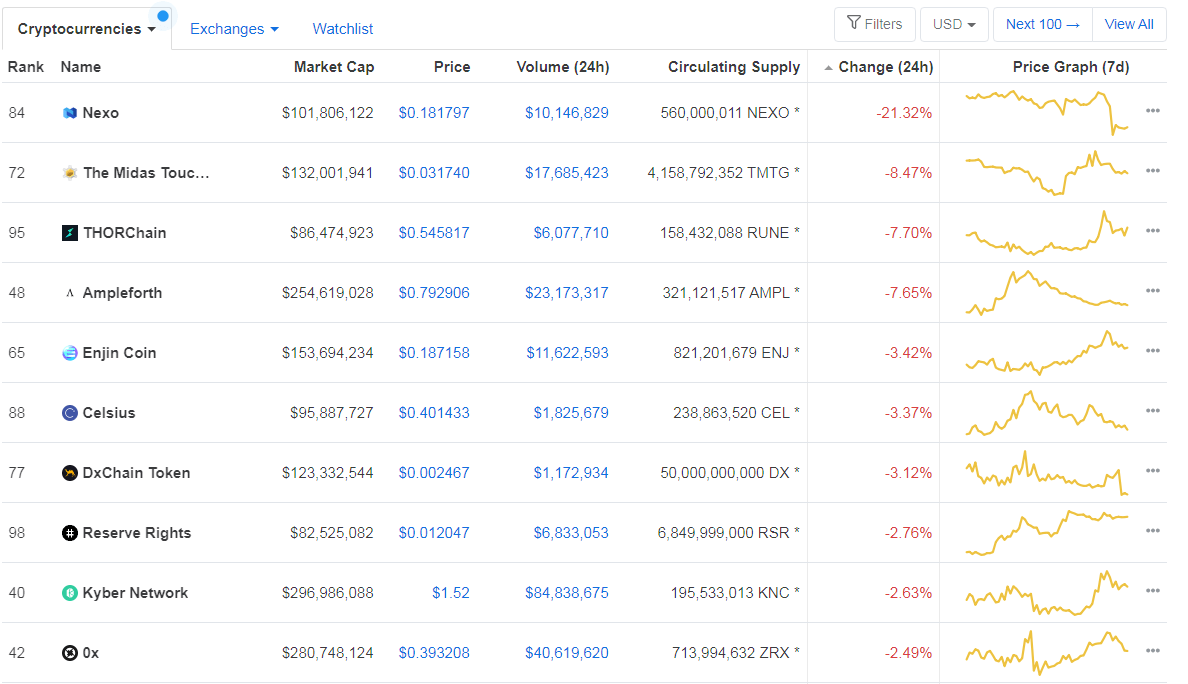
Bottom 10 24-hour Performers (Click to enlarge)
Bitcoin’s dominance level has increased since we last reported, with its value currently at 61.48%. This value represents a 0.31% difference to the upside when compared to yesterday’s value.
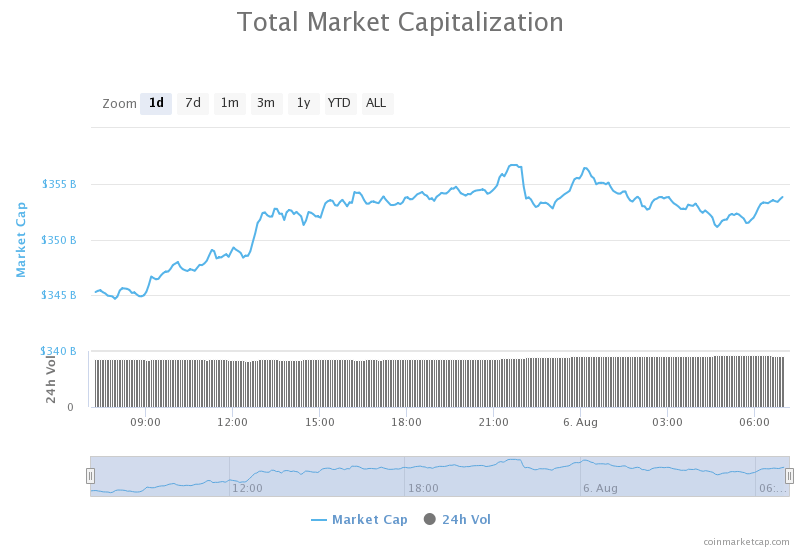
Daily Crypto Market Cap Chart
The cryptocurrency market capitalization has increased since we last reported. Its current value is $353.48 billion, which represents an increase of $12.09 billion when compared to the value it had yesterday.
_______________________________________________________________________
What happened in the past 24 hours?
_______________________________________________________________________
- Bitcoin and S&P 500 No Longer Correlated: Mati Greenspan (Cointelegraph)
- Blockstream’s Adam Back Slams Ethereum as a Ponzi-Scheme (Cointelegraph)
- Band Protocol secures major oracle integration and Coinbase Pro listing (Cryptoslate)
- Crypto lending volumes set record as Ethereum DeFi tokens surge (Cryptoslate)
- Bitcoin CME futures are trading at a $300+ premium; Here’s what this means (Cryptoslate)
- EOS Prepares for Bullish Price Action Despite Stagnating User Growth (Cryptobriefing)
- XRP Prices Jeopardized as Ripple Continues Flooding Market (Cryptobriefing)
- Ethereum Whales Enter Buying Frenzy as ETH 2.0 Mainnet Approaches (Cryptobriefing)
- Ethereum Classic suffers another 51% attack in five days (The Block)
- Bitcoin continues to be the most commonly supported cryptocurrency on darknet markets (The Block)
_______________________________________________________________________
Technical analysis
_______________________________________________________________________
Bitcoin
The largest cryptocurrency by market capitalization continued its move towards the upside after a few days of indecisiveness and consolidation. Bitcoin saw a slight increase in volume, which brought the price above the $11,460 resistance level and up to $11,820. However, the move stopped there (for now), and Bitcoin is currently consolidating above the $11,460 level, testing it as support.
BTC traders should look for an opportunity to make a trade when BTC confirms or fails to confirm its position with $11,460.
BTC/USD 4-hour Chart
Technical factors:
- Price is currently above its 50-period EMA, as well as its 21-period EMA
- Price is near its top B.B
- RSI is elevated (62.37)
- Volume is increasing
Key levels to the upside Key levels to the downside
1: $11,460 1: $11,090
2: $11,630 2: $10,855
3: $12,000 3: $10,505
Ethereum
Ethereum seems to be back on its steady upwards path, which began on July 21. The second-largest cryptocurrency by market cap rose steadily throughout the day, trying to reach past the $415 resistance. While the price did not yet reach this mark, it did increase slightly, supported by the 21 and 50-period moving averages.
Traders should look for a trade opportunity within the range ETH is currently in.
ETH/USD 4-hour Chart
Technical Factors:
- Price is above its 21-period EMA and its 50-period EMA
- Price is slightly above its middle B.B. (20-period SMA)
- RSI is elevated (60.26)
- Descending volume
Key levels to the upside Key levels to the downside
1: $415 1: $362
2: $496 2: $340
3: $302
Ripple
XRP experienced sideways movement on low volume throughout the day. The third-largest cryptocurrency by market capitalization was trading near the top of its triangle formation, unable to break it yet. However, the decreasing volume, as well as the price approaching the 80% mark of the formation, indicate a move which will take XRP out of the triangle formation. While it is too early to speculate, XRP seems to have a better chance of breaking to the upside.
Traders can look for an opportunity to trade when XRP breaks its triangle formation.
XRP/USD 4-hour Chart
Technical factors:
- Price is above its 21-period and 50-period EMA
- Price is below the middle B.B. (20-period SMA)
- RSI is neutral (55.62)
- Low volume
Key levels to the upside Key levels to the downside
1: $0.32 1: $0.285
2: $0.3328 2: $0.266
3: $0.245
Related posts
 Daily Crypto Review, Feb 21 – Morgan Stanley dipping its toes into crypto? Analysts still confused by the price drop
 Daily Crypto Review, July 21 – Mastercard Bullish On Bitcoin; Paxos To Become Paypal’s Bitcoin Custodian
 Daily Crypto Review, July 23 – Ethereum’s Price Skyrockets As Developers Announce Ethereum 2.0 Test Specifications
 Daily Crypto Review, July 24 – US Banks Can Provide Crypto Custody Services; Bitcoin Approaches $10,000
One reply on “Daily Crypto Review, August 6 – ‘Ethereum Is a Ponzi Scheme’ – Adam Back; ETC Suffers Yet Another 51% Attack”
Ethereum is doing so well at the min