The cryptocurrency market mostly traded sideways after major breakthroughs in the past ten days. Bitcoin is currently trading for $10,880, which represents a decrease of 2.76% on the day. Meanwhile, Ethereum lost 3.38% on the day, while XRP gained 2.42%.
Daily Crypto Sector Heat Map
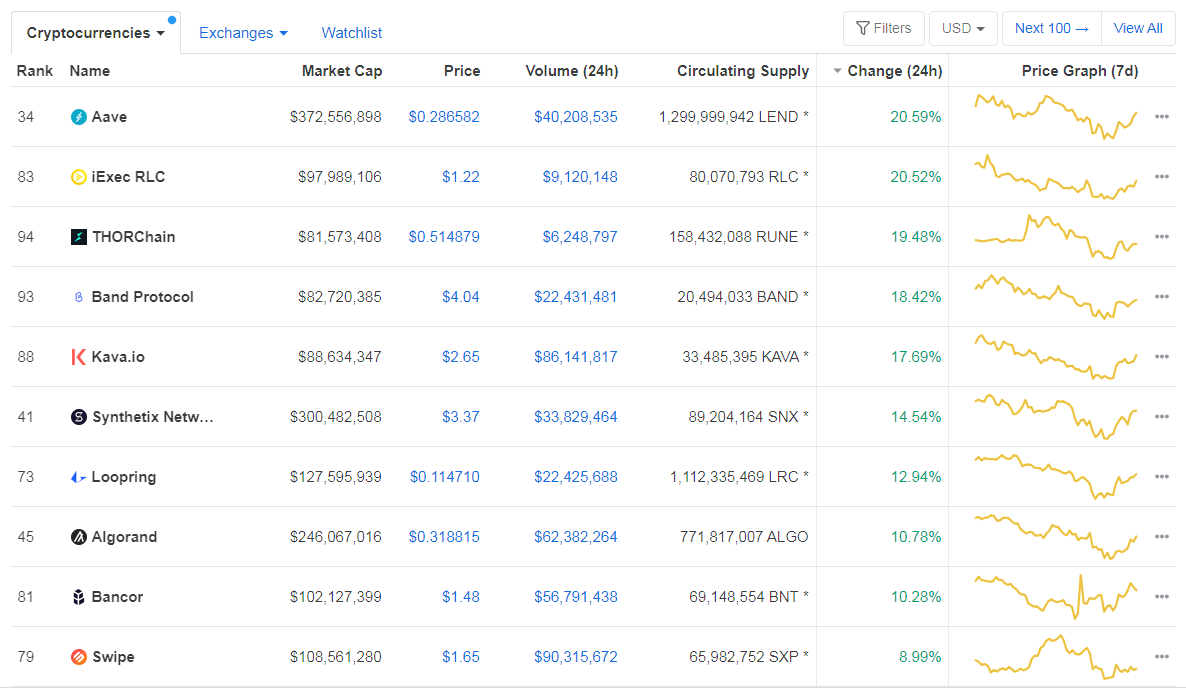
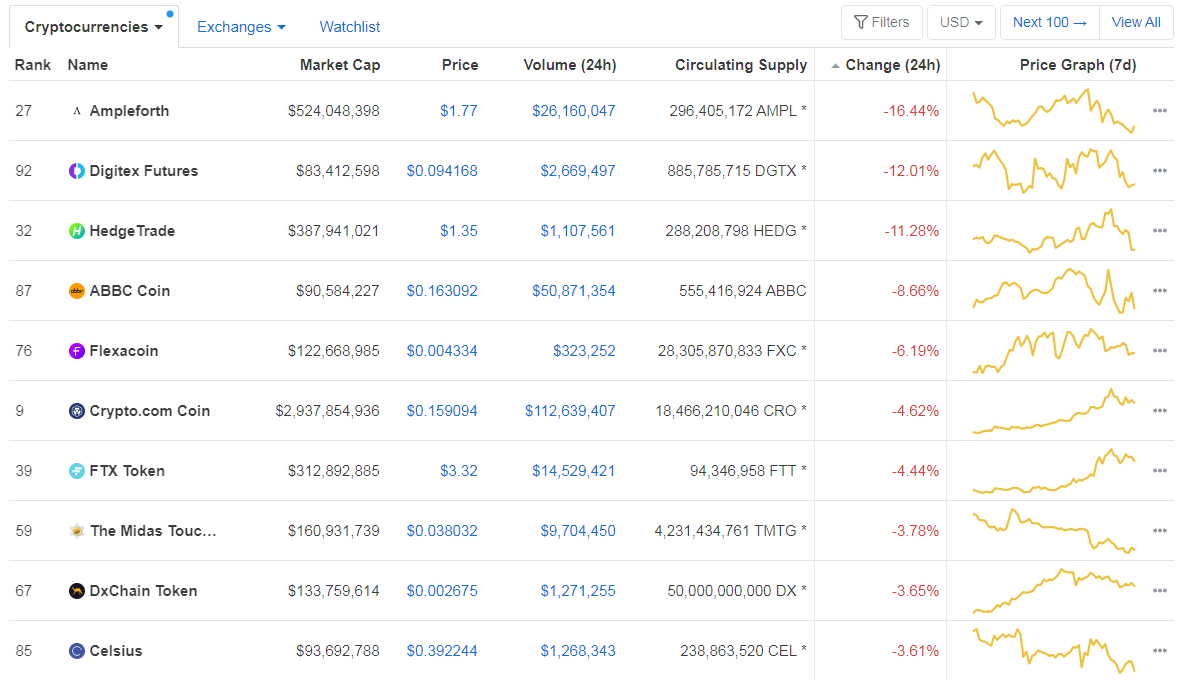
When talking about top100 cryptocurrencies, Aave gained 20.59% on the day, making it the most prominent daily gainer. iExec RLC (20.52%) and THORChain (19.48%) also did great. On the other hand, Ampleforth has lost 16.44%, making it the most prominent daily loser. It is followed by Digitex Futures’ loss of 12.01% and HedgeTrade’s loss of 11.28%.
Top 10 24-hour Performers (Click to enlarge)
Bottom 10 24-hour Performers (Click to enlarge)
Bitcoin’s dominance level decreased since we last reported, with its value currently at 63.31%. This value represents a 1.02% difference to the downside when compared to yesterday’s value.
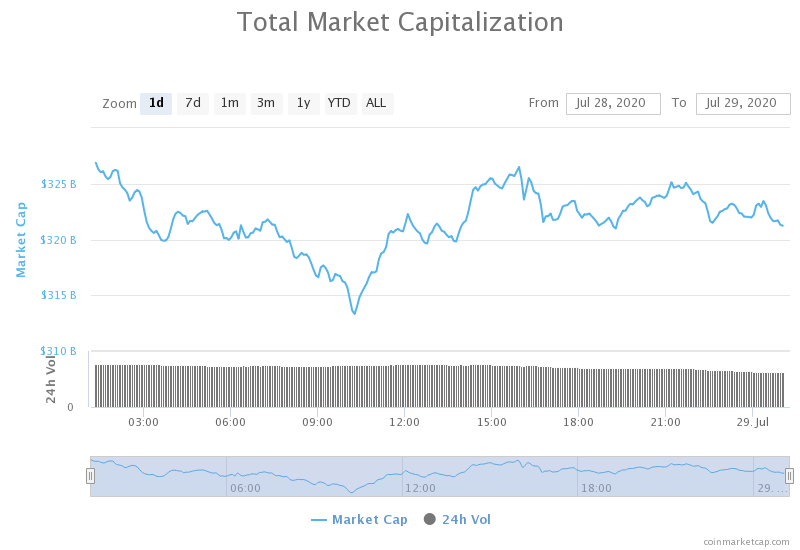
Daily Crypto Market Cap Chart
The cryptocurrency market capitalization skyrocketed and now confirmed its position above the $300 billion mark. Its current value is $320.93 billion, which represents a decrease of $0.06 billion when compared to the value it had yesterday.
_______________________________________________________________________
What happened in the past 24 hours?
_______________________________________________________________________
- Tether Exchange Inflow Reached 8-Month High as Bitcoin Rallied to $11K (Cointelegraph)
- MIT Lightning Creator Unveils First’ Demonstration’ of Bitcoin Scaling Tech (Coindesk)
- DeFi Reinvented the ICO, It Flopped: Assessing the IDO (Cryptobriefing)
- Bitcoin Bears on the Prowl as BTC Options Hit All-Time High (Cryptobriefing)
- Finalized Testnet for ETH 2.0 to Launch on August 4 (Cryptobriefing)
- The new Augur promises to be faster and simpler — and denominated in dollars (The Block)
- A trend of hackers demanding privacy-focused cryptocurrencies as payment may be forming (The Block)
- The future of Robinhood’s crypto products is in doubt amid recent headwinds (The Block)
- Goldman Sachs boosts gold price target, says the U.S. dollar’s reserve status is at risk (The Block)
- Open interest in CME bitcoin futures hits an all-time high of $724 million (The Block)
_______________________________________________________________________
Technical analysis
_______________________________________________________________________
Bitcoin
The largest cryptocurrency by market capitalization had a rather slow day, unlike the past days, which passed in BTC making significant gains. The volume is slowly fading away while the price is trying to find resistance. Bitcoin fell under $11,000 and is currently consolidating above the $10,855 support level. However, it is still unsure if Bitcoin will stay above it or fall under.
BTC traders should look for a trade opportunity when BTC breaks $10,855 to the downside or $11,090 to the upside.
BTC/USD 4-hour Chart
Technical factors:
- Price is currently above its 50-period EMA and its 21-period EMA
- Price is between its top B.B. and its middle B.B (20-period SMA)
- RSI is elevated (69.73
- Volume greatly increased (descending)
Key levels to the upside Key levels to the downside
1: $10,855 1: $10,505
2: $11,090 2: $10,015
3: $11,630 3: $9,870
Ethereum
Ethereum also had a slow day, while its price drop reflected Bitcoin’s drop (percentage-wise). The second-largest cryptocurrency by market capitalization is trying to consolidate around the $315 mark, while its volume is fading. Ethereum has strong support at $302, which might get challenged shortly.
Ethereum traders should look for a trade opportunity after the cryptocurrency is done with consolidating.
ETH/USD 4-hour Chart
Technical Factors:
- Price is above the 50-period EMA and the 21-period EMA
- Price is at the middle B.B. (20-period SMA)
- RSI is elevated (58.66)
- Extremely high volume (descending)
Key levels to the upside Key levels to the downside
1: $340 1: $302
2: $362 2: $289
3: $278
Ripple
Unlike Bitcoin and Ethereum, the third-largest cryptocurrency by market cap had quite a good day, which brought its price above $0.227 and $0.235 resistance levels. XRP made a move, which was sparked by an influx of buyers. The move is still not over, and XRP is fighting to stay above $0.235, though that is unlikely unless the cryptocurrency pushes its price towards the $0.245 level.
XRP traders can look for an opportunity in pullbacks after the bullish move.
XRP/USD 4-hour Chart
Technical factors:
- XRP in a mid-term descending trend (though it broke the trend in the short-term)
- Price above 21-period and the 50-period EMA
- Price is above the top B.B.
- RSI is in the overbought territory (73.69)
- Elevated volume
Key levels to the upside Key levels to the downside
1: $0.235 1: $0.227
2: $0.245 2: $0.214
3: $0.205


One reply on “Daily Crypto Review, July 29 – BTC consolidating under $11,000; XRP Skyrocketing”
Strong push up could be creating a bull flag