
The cryptocurrency market was in the red in the past 24 hours, with most altcoins’ prices falling down over 5%. Bitcoin is currently trading for $11,375, which represents a decrease of 4.05% on the day. Meanwhile, Ethereum lost 4.84% on the day, while XRP lost 7.59%.

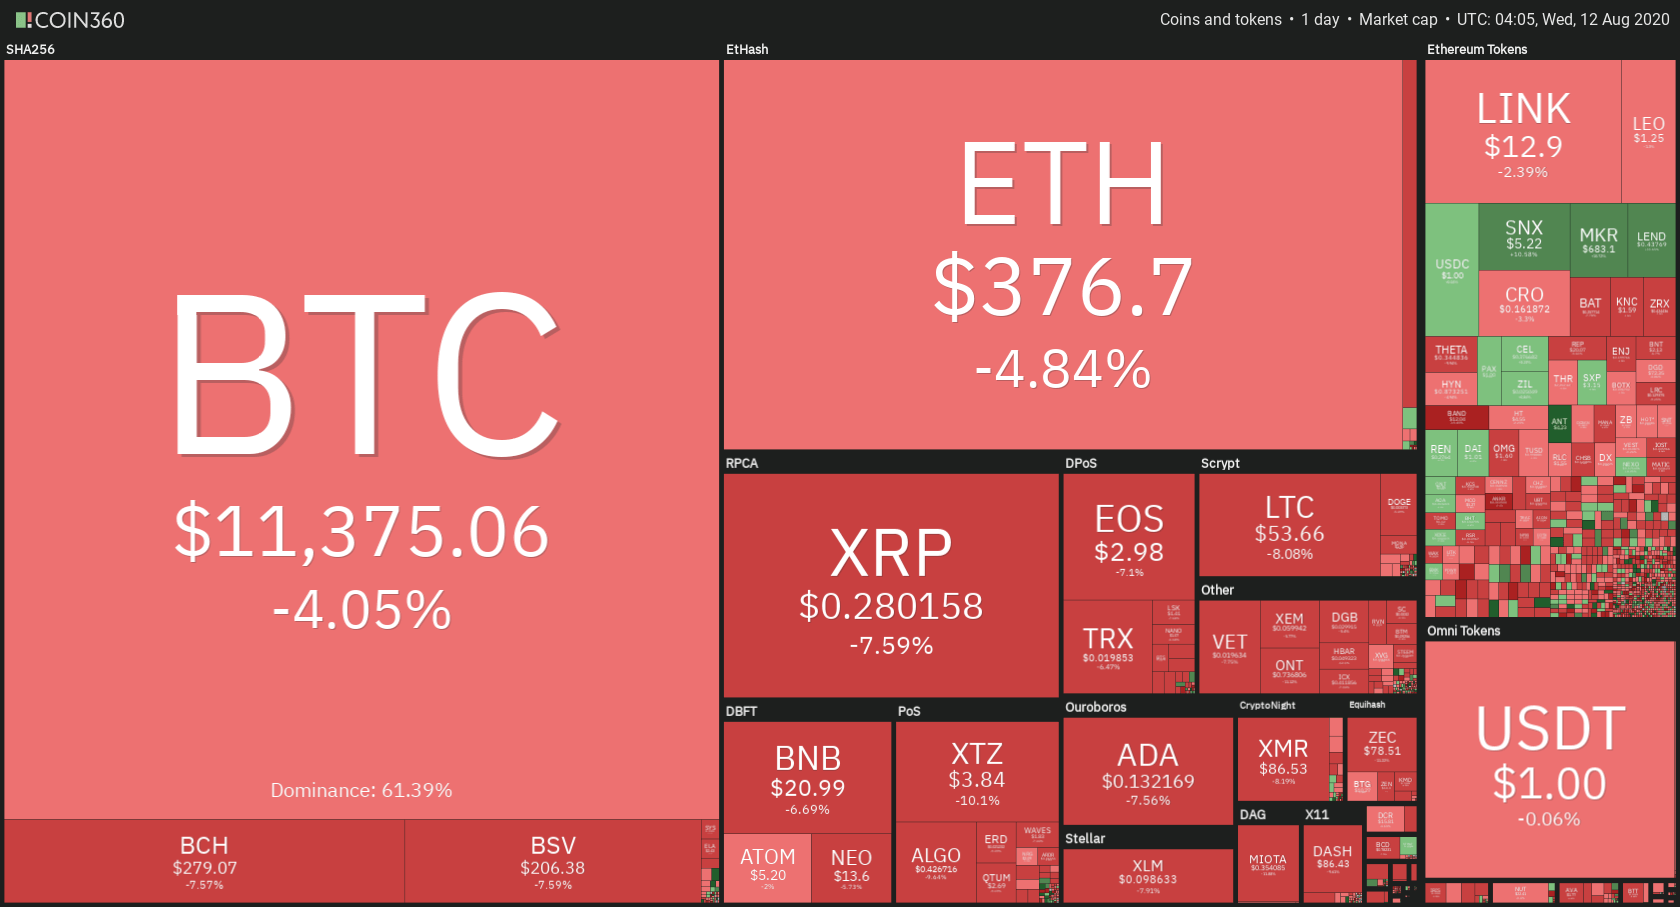
Daily Crypto Sector Heat Map
When talking about top100 cryptocurrencies, Compound gained 31.08% on the day, making it the most prominent daily gainer. Swipe (16.13%) and Maker (12.37%) also did great. On the other hand, Band Protocol lost 16.42%, making it the most prominent daily loser. It is followed by yearn.finance’s loss of 14.86% and Nervos Network’s loss of 14.41%.
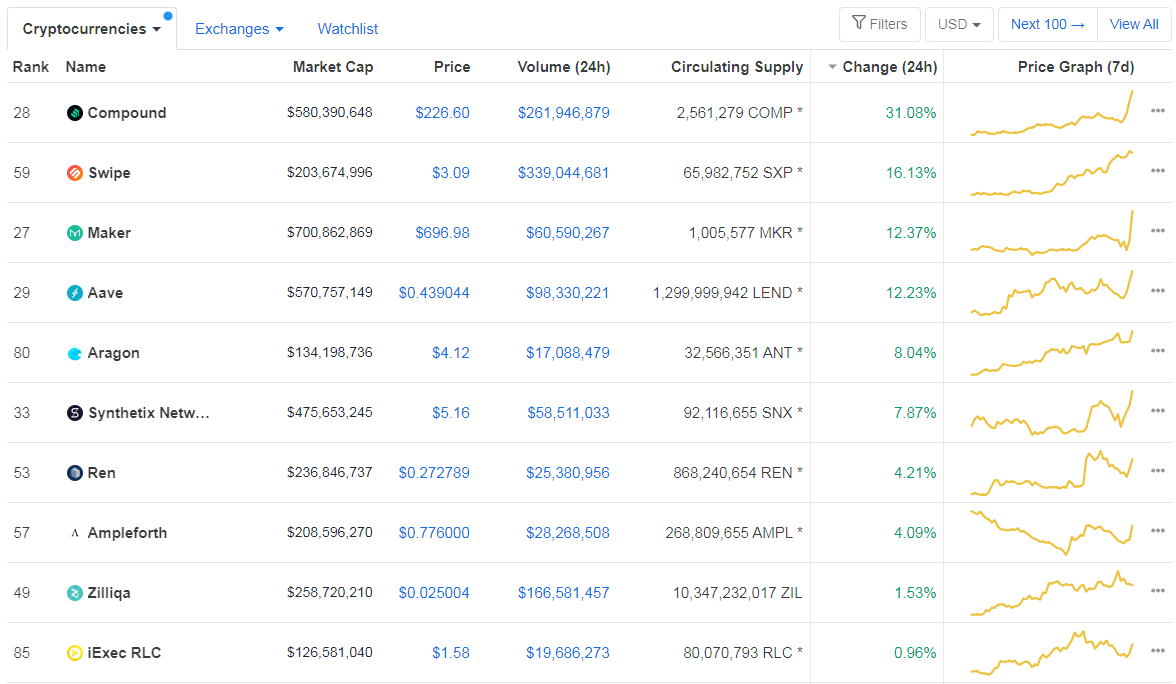
Top 10 24-hour Performers (Click to enlarge)
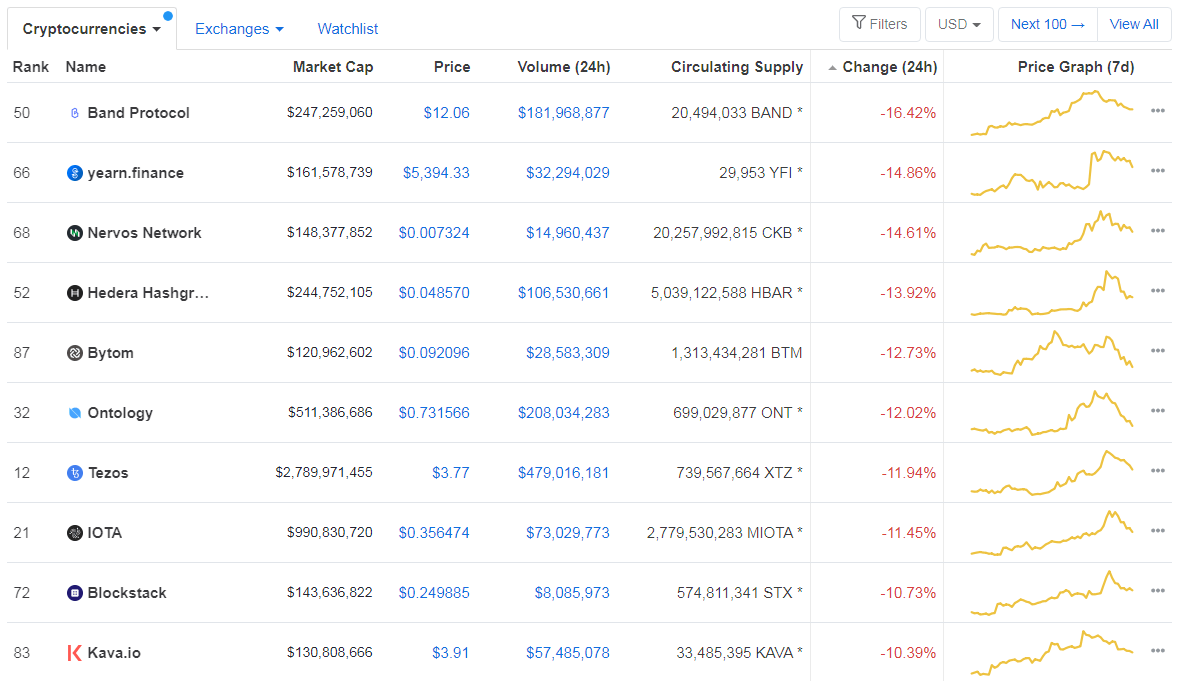
Bottom 10 24-hour Performers (Click to enlarge)
Bitcoin’s dominance level has increased slightly since we last reported, with its value currently at 61.39%. This value represents a 0.17% difference to the upside when compared to yesterday’s value.
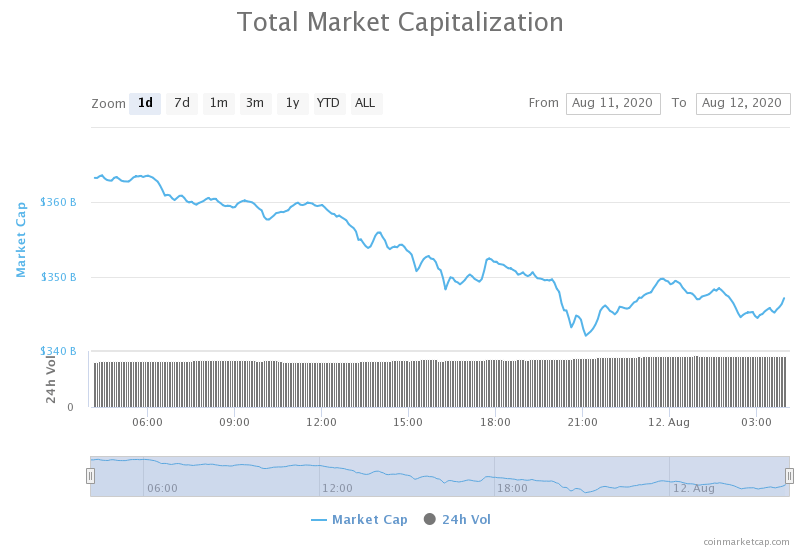
Daily Crypto Market Cap Chart
The cryptocurrency market cap experienced a major decrease in value since we last reported. Its current value is $345.60 billion, which represents an increase of $7.98 billion when compared to yesterday’s value.
_______________________________________________________________________
What happened in the past 24 hours?
_______________________________________________________________________
- The inflation fears that have been fueling gold and bitcoin markets might be overblown (The Block)
- Coinbase exits trade group following entry of upstart rival Binance.US (The Block)
- Coinbase says batching bitcoin transactions has saved clients 75% in fees (The Block)
- Ethereum Whale Pushed ETH Prices to $450 on Uniswap (Cryptobriefing)
- Top VC says that Ethereum and Bitcoin may race each other to $1 trillion valuation (Cryptoslate)
- Crypto investor sentiment hits “extreme greed” levels for first time since 2019 (Cryptoslate)
- India May Be Starting Its Biggest Bitcoin Bull Run Yet (Coindesk)
- MicroStrategy Buys $250M in Bitcoin, Calling the Crypto’ Superior to Cash’ (Coindesk)
- DeFi Token Serum Surges 1500% in 12 Hours After Listing (Cointelegraph)
_______________________________________________________________________
Technical analysis
_______________________________________________________________________
Bitcoin
Bitcoin experienced a large selloff as a result of bulls failing to successfully break the $12,000 mark. The largest cryptocurrency by market cap fell to $11,090 support level before rallying slightly to $11,400 levels. However, Bitcoin might have another bullish move as the RSI is dangerously close to the oversold territory while the volume is high, and since the $11,090 support level held up nicely, Bitcoin confirmed it almost certainly will not go below.
BTC traders should look for an opportunity when BTC makes another move towards the upside and breaks $11,460.
BTC/USD 4-hour Chart
Technical factors:
- Price is currently below its 50-period EMA, as well as its 21-period EMA
- Price is above its lower B.B
- RSI is near the oversold territory (35.52)
- Volume is decreasing from above-average levels
Key levels to the upside Key levels to the downside
1: $11,460 1: $11,090
2: $11,630 2: $10,850
3: $12,000 3: $10,500
Ethereum
Ethereum also experienced a selloff, partly because of not being able to go past $400 and partly because of Bitcoin’s move towards the downside. The price broke the triangle formation to the downside (as we said in the previous article) as there was not enough pressure for it to get past the $415 mark. The second-largest cryptocurrency by market cap tested the $361 support, which held up nicely and did not let ETH fall below. Ethereum is now at the $375 mark and is showing no signs of dropping further below.
Traders should look for a trade opportunity when Ethereum makes a bounce towards the upside or falls below $361.
ETH/USD 4-hour Chart
Technical Factors:
- Price is below its 21-period EMA and its 50-period EMA
- Price is at its bottom B.B.
- RSI is near the oversold territory (33.99)
- Volume is average
Key levels to the upside Key levels to the downside
1: $400 1: $361
2: $415 2: $340
3: $496 3: $302
Ripple
XRP was no different than Bitcoin and Ethereum in terms of the direction of its movement throughout the day, but it did differ in terms of intensity of the move. The third-largest cryptocurrency by market cap lost over 8% of its value at one point, as bears took over the market when XRP couldn’t break $0.31. The price fell to as low as $0.266 but quickly recovered to its current position ($0.278).
Traders can look for an opportunity to trade after XRP breaks $0.285.
XRP/USD 4-hour Chart
Technical factors:
- Price is below its 21-period and 50-period EMA
- Price is slightly above its bottom B.B.
- RSI is near the oversold territory (35.64)
- Low volume (slightly increased)
Key levels to the upside Key levels to the downside
1: $0.285 1: $0.266
2: $0.31 2: $0.245
3: $0.32 3: $0.235
Related posts
 Daily Crypto Review, May 8 – Bitcoin Contesting $10,000 as Halving Nears – What’s Next?
 Daily Crypto Review, May 11 – Bitcoin Hours from its Halving Event; Traders Entering the “Greed” Stage
 Daily Crypto Review, May 12 – Bitcoin Halving Fundamentals and the Crypto Market Price Reaction
 Daily Crypto Review, Sept 18 – Uniswap’s UNI Token Surges Over 100% After Launch; Bitcoin Continues Fighting For $11,000