Description
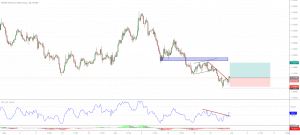
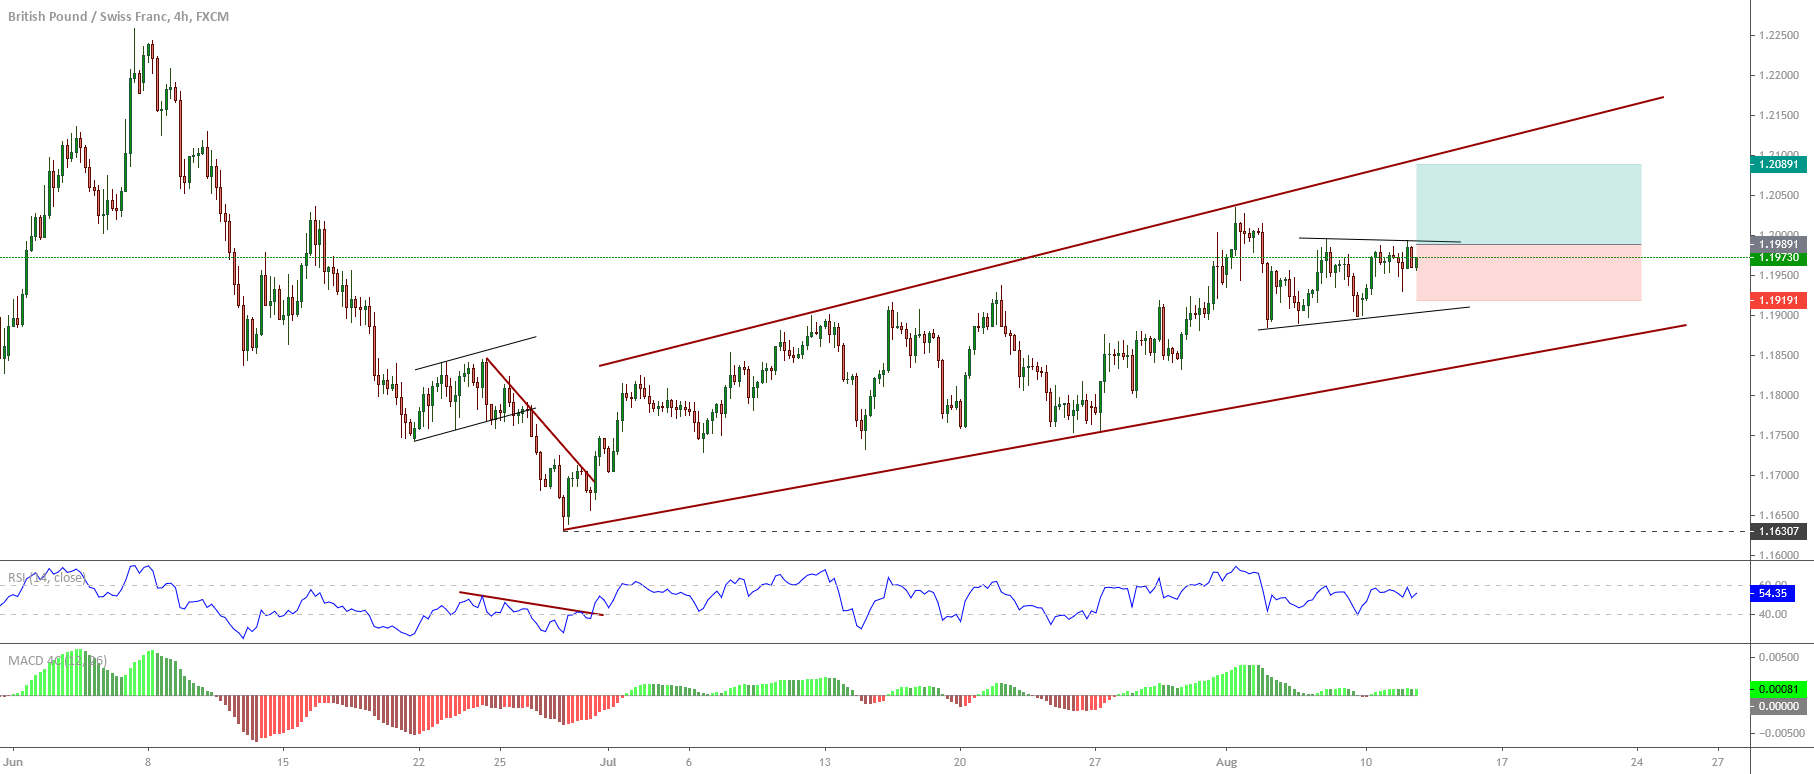
The GBPCHF cross in its 4-hour chart exposes an ascending sequence that began on June 29th when the price found a bottom at 1.16307. The consolidation formation as a triangle pattern could be indicative of more upsides in the following trading sessions.
The price action seems like an expanding formation, which leads us to foresee increasing volatility in the following trading sessions. At the same time, the current consolidation pattern as a triangle pattern that the GBPCHF cross develops since early August makes us expect the cross’s bullish continuation.
On the other hand, both the RSI and the MACD oscillator confirms the bullish bias that the GBPCHF cross maintains.
A bullish position will trigger if the price surpasses the 1.1990 level, with a potential profit target in the level 1.2090, which coincides with the last consolidation zone of June 10th. The bullish scenario will invalidate if the price breaks below 1.1920.
Chart
Trading Plan Summary
- Entry Level: 1.1990
- Protective Stop: 1.1920
- Profit Target: 1.2090
- Risk/Reward Ratio: 1.43
- Position Size: 0.01 lot per $1,000 in trading account.
Check out the latest trading signals on the Forex Academy App for your mobile phone from the Android and iOS App Store.