
The cryptocurrency market ended up in the green today, with Bitcoin establishing its place above $11,000 and most altcoins gaining substantial value. Bitcoin is currently trading for $11,350, which represents an increase of 1.86% on the day. Meanwhile, Ethereum gained 4.8% on the day, while XRP gained 6.87%.

Daily Crypto Sector Heat Map
When talking about top100 cryptocurrencies, MCO gained 41.91% on the day, making it the most prominent daily gainer. Ocean Protocol (28.92%) and Energy Web Token (22.88%) also did great. On the other hand, Ampleforth has lost 12.73%, making it the most prominent daily loser. It is followed by Aave’s loss of 6.32% and Celsius’ loss of 3.80%.

Top 10 24-hour Performers (Click to enlarge)
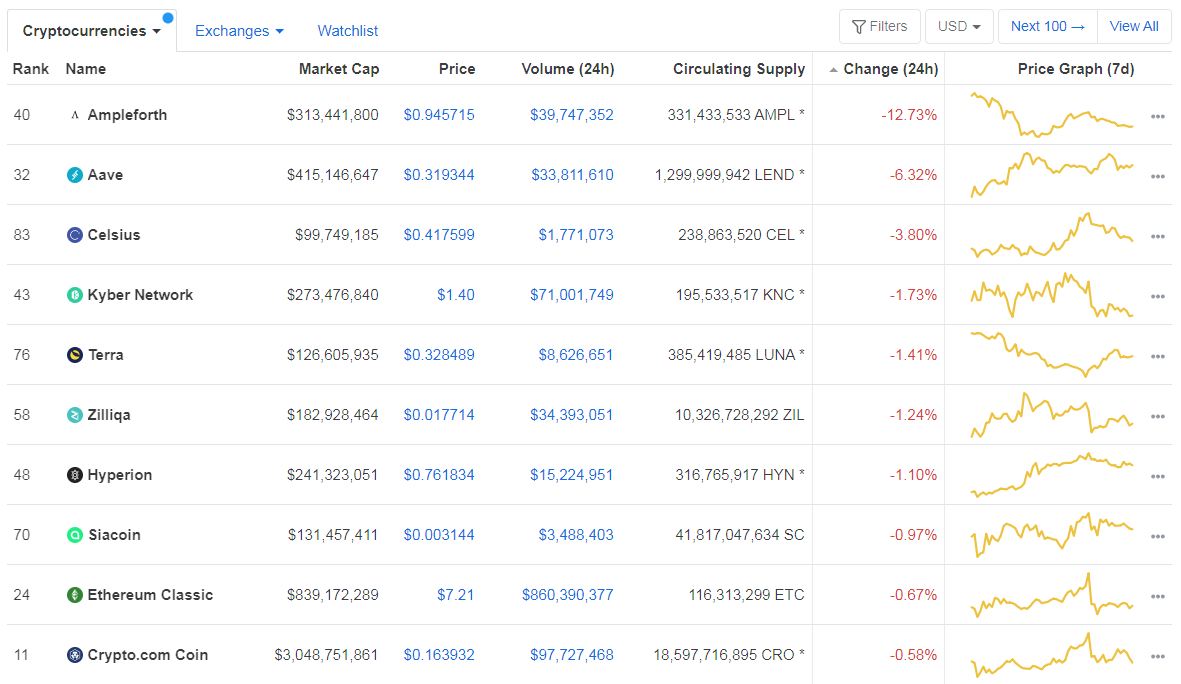
Bottom 10 24-hour Performers (Click to enlarge)
Bitcoin’s dominance level has decreased since we last reported, with its value currently at 60.80%. This value represents a 0.82% difference to the downside when compared to Friday’s value.
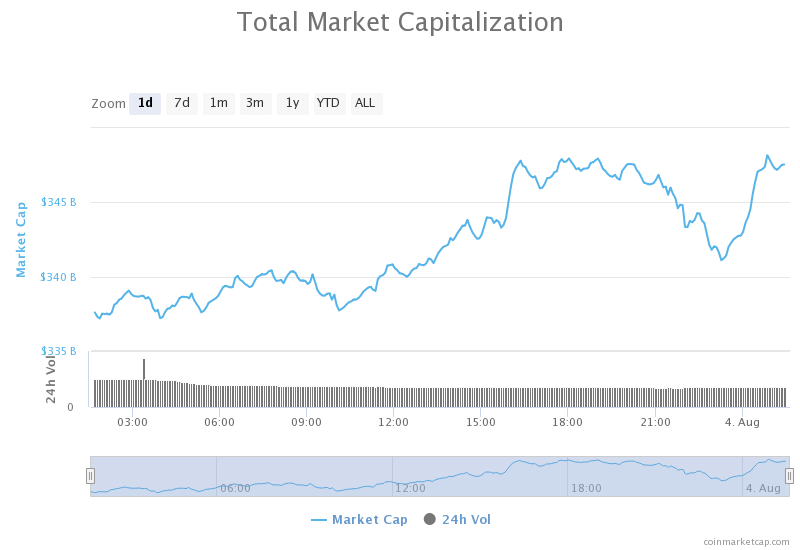
Daily Crypto Market Cap Chart
The cryptocurrency market capitalization has increased since we last reported. Its current value is $347.17 billion, which represents an increase of $9.74 billion when compared to the value it had yesterday.
_______________________________________________________________________
What happened in the past 24 hours?
_______________________________________________________________________
- State-Run Bank in Switzerland to Launch Crypto Services (Cointelegraph)
- Cardano’ Dwarfs’ Tezos After Shelley Hard Fork, Says Security Auditor (Cointelegraph)
- Huobi Hires Former Banking Giant Executive to Lead New DeFi Fund (Coindesk)
- The amount of Ethereum locked in DeFi is up almost 30% in a month (Cryptoslate)
- Aggregated open interest for bitcoin futures hit an all-time high on Saturday (The Block)
- U.S. seizes $6.5 million in bitcoin and tether from ‘Banana Fund’ Ponzi scheme (The Block)
- Ripple reports $32.5 million in over-the-counter XRP sales in Q2 (The Block)
- Binance wants to launch futures trading in the U.S., possibly through buying a licensed firm (The Block)
- Despite Crash, Metrics Show Bitcoin Will Continue Climbing (Cryptobriefing)
- Crypto.com Merges Tokens, MCO Rallies Over 37% (Cryptobriefing)
_______________________________________________________________________
Technical analysis
_______________________________________________________________________
Bitcoin
The largest cryptocurrency by market capitalization confirmed its position above $11,000 in the past 24 hours (at least in the short term) Its price kept slowly going up until it hit a (possibly) new resistance level of $11,460. The price then took a small dive but returned to sideways movements. Bitcoin is in a good spot to create a move that will lead it towards (or above) $12,000 in the near future.
BTC traders should look for an opportunity to make a trade when BTC breaks $11,460 or falls below $11,090.
BTC/USD 4-hour Chart
Technical factors:
- Price is currently above its 50-period EMA, but below its 21-period EMA
- Price is between its bottom B.B. and its middle B.B (20-period SMA)
- RSI is neutral (51.35)
- Volume increased
Key levels to the upside Key levels to the downside
1: $11,630 1: $11,090
2: $12,000 2: $10,855
3: $10,505
Ethereum
Ethereum continued pushing towards the upside, pretty much unaffected by the “flash crash” that brought its price down from $415 to $320. The second-largest cryptocurrency by market capitalization is moving upwards and having the 21-period and 50-period moving averages as support. The price is currently just below $400.
Ethereum traders should look for an opportunity in a pullback, which will most likely happen after the current move towards the upside.
ETH/USD 4-hour Chart
Technical Factors:
- Price is above its 21-period EMA and its 50-period EMA
- Price is currently between its top B.B. and its middle B.B. (20-period SMA)
- RSI is elevated (63.95)
- Above-average volume
Key levels to the upside Key levels to the downside
1: $340 1: $302
2: $362 2: $289
3: $278
Ripple
XRP was also one of the altcoins that made significant progress towards the upside in the past 24 hours. The third-largest cryptocurrency by market cap recovered from the “flash crash” quickly and hurled upwards, reaching past the $0.31 resistance level (now support) once again.
XRP traders can look for an opportunity in the range between $0.31 and $0.32.
XRP/USD 4-hour Chart
Technical factors:
- Price above 21-period and the 50-period EMA
- Price is between the top B.B. and the middle B.B. (20-period SMA)
- RSI is elevated (66.85)
- Elevated volume
Key levels to the upside Key levels to the downside
1: $0.32 1: $0.285
2: $0.3328 2: $0.266
3: $0.245
Related posts
 Daily Crypto Review, Sept 29 – Bitcoin’s Fail to Break $11,000 Causes a Red Day for Crypto: What’s Next?
 Daily Crypto Review, Oct 5 – XRP Skyrockets and Gains Over 9%; Uniswap’s Volume Trumps Coinbase
 Daily Crypto Review, Oct 9 – Bitcoin Close to $11,000: What’s Next?
 Daily Crypto Review, Oct 21 – Bitcoin Above $12,000; Bull Market in Full Swing