
Introduction
A price movement can be considered a breakout when the price clears any critical level on the price chart. These levels can be support/resistance, trend lines, Fibonacci levels, etc. Many professional traders wait for the price to hold above the breakout to take long positions. Conversely, they wait for the price to hold below the breakdown level to take short positions.
When the price confirms that the breakout is valid, volatility tends to increase as the price started to move in the direction of the breakout. The reason why breakout trading is popular among the traders is that it sets the future trend direction. This makes it easier for traders to make consistent profits from the market.
Breakout trading strategy is universal, and we can apply it to the hourly, daily, weekly, or even monthly timeframes. Investors, swing traders, and intraday traders prefer breakout trading the most compared to any other form of trading. The longer price action holds inside the breakout, the stronger breakout we must expect, and also, the longer time the price action moves in that direction.
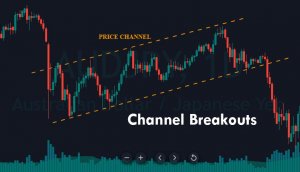
During the consolidation phase, when the price is preparing to break out in any direction, we will notice a couple of price pattern formations such as channels, triangles, flags, etc. These patterns will give us the clues on which side the breakout may occur—using these signals to enter a trade before the breakout is crucial. But if you are a conventional trader, wait for the price to break above or below the price to take the trade.
Trading Various Breakouts
Trend Line Breakout
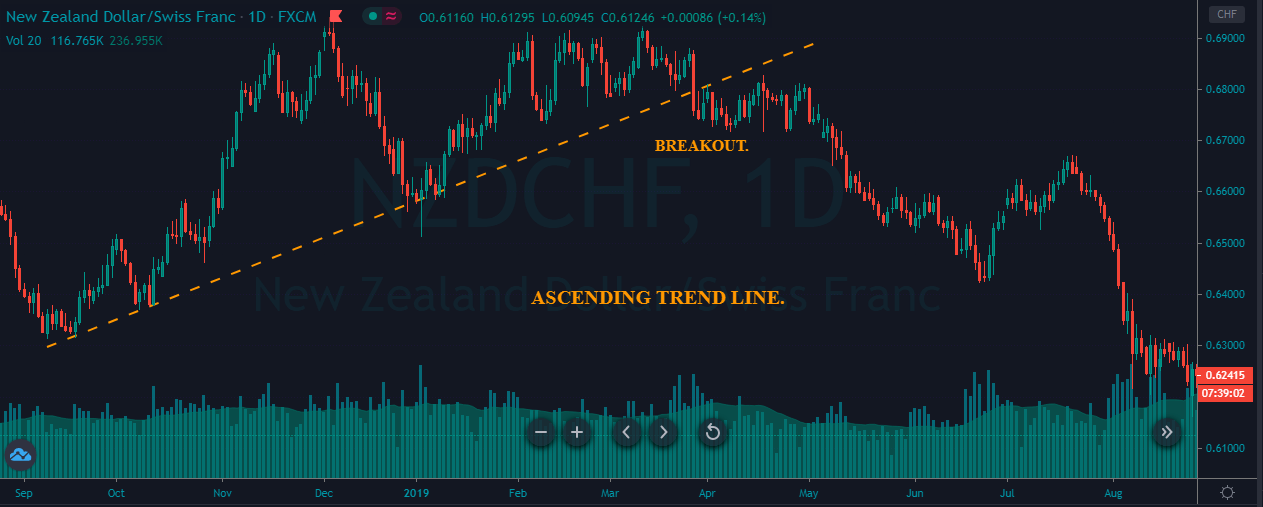
Ascending Trend line Breakout
The below price chart represents an ascending trendline breakout on the NZD/CHF daily Forex chart.
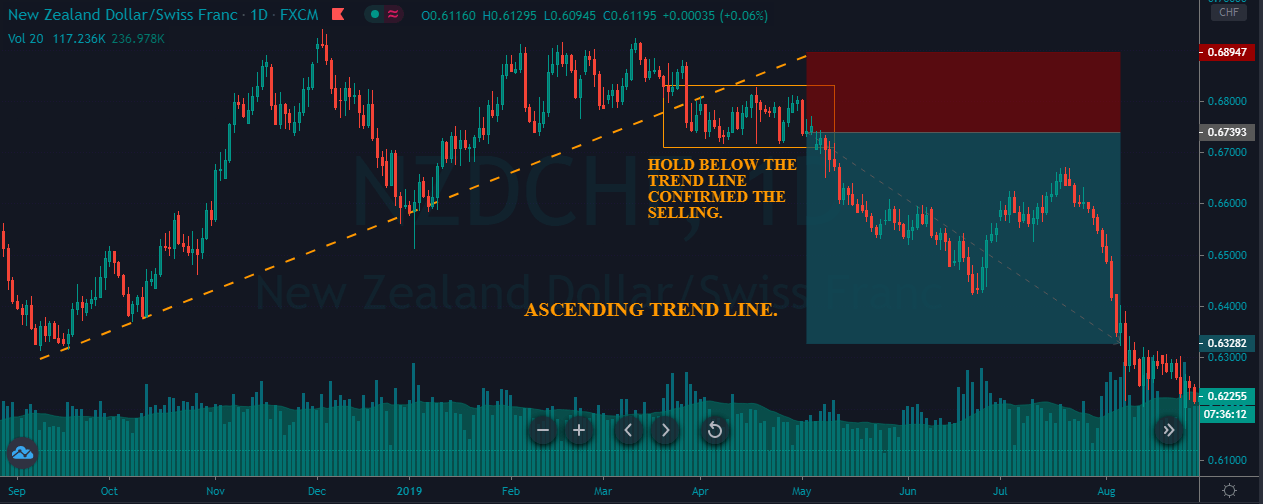
As you can see in the below image, when price action broke below the ascending trend line, it is an indication of sellers stepping into the game. The hold below the trend line confirms the selling entry. We have placed our stop-loss at the previous high and rode the huge downtrend.
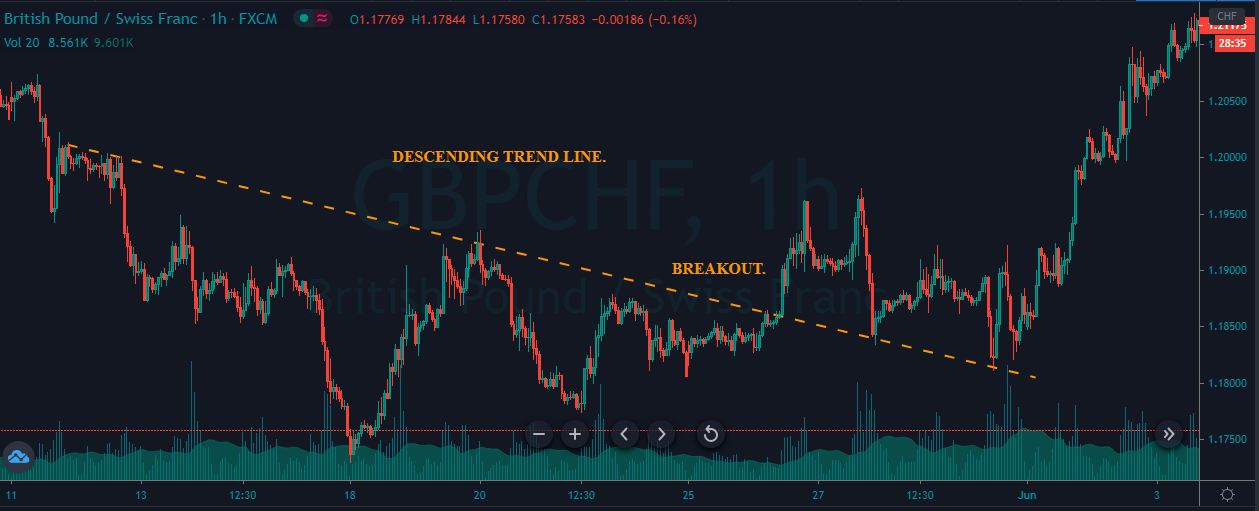
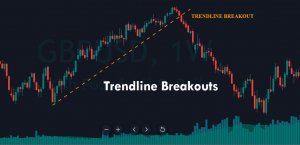
Descending Trend line Breakout
The image below represents the breakout of a descending trend line in the GBP/CHF Forex pair.
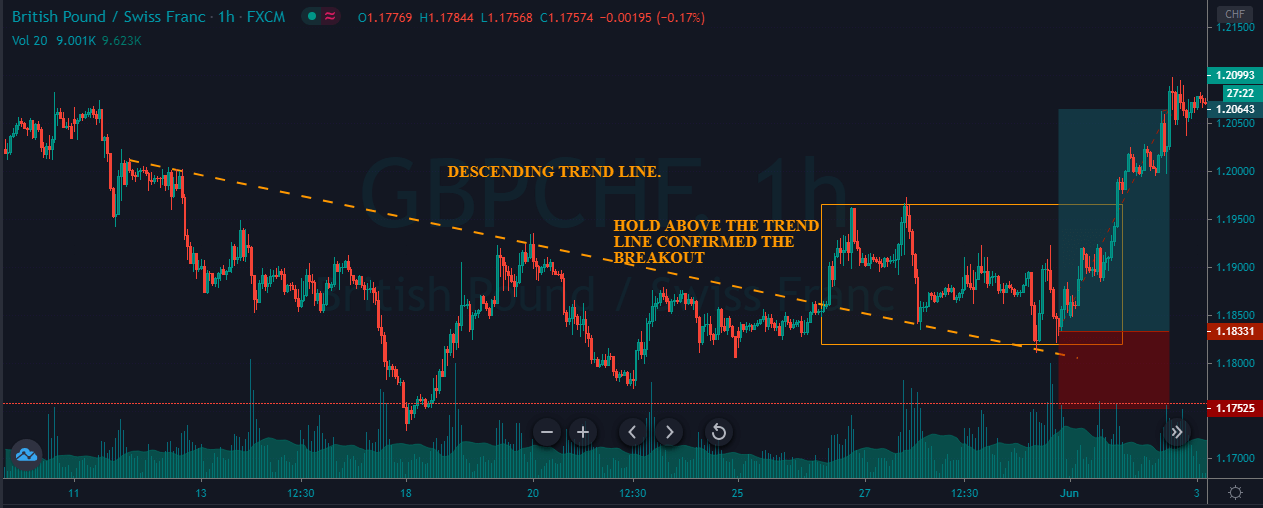
As you can see below, we took a buy entry when price action went above the trend line and started to hold above. The hold confirms that the buyers are in control, and they are ready to make a brand new higher high. After our entry, price action blasted to the north and printed a brand new higher high. We chose to close our trade at the most recent higher high. The stop-loss order placed just below the trend line is safe enough.
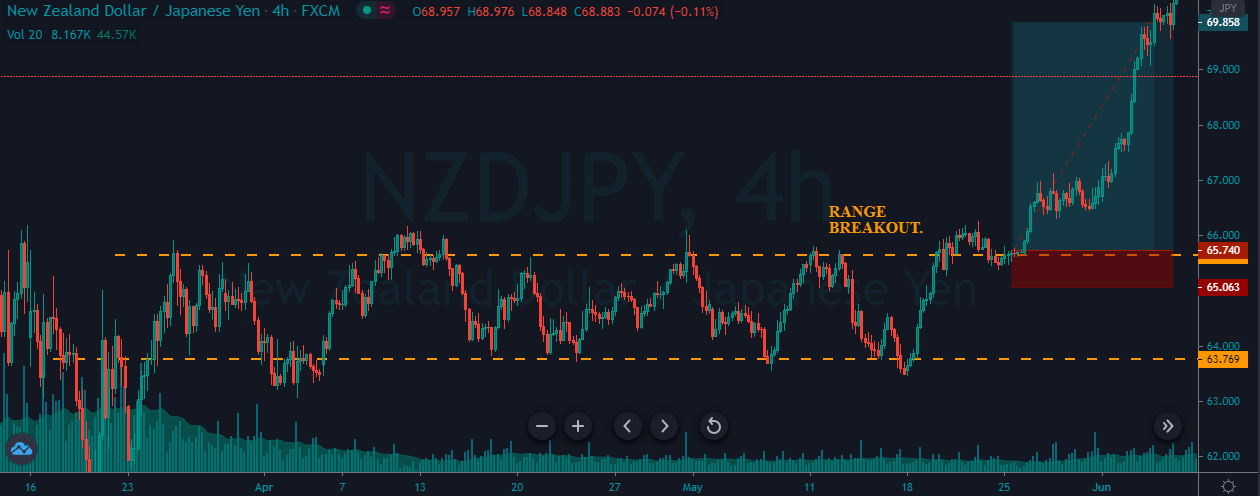
Range Breakout
The price chart below represents a Ranging market in the NZD/JPY Forex pair.
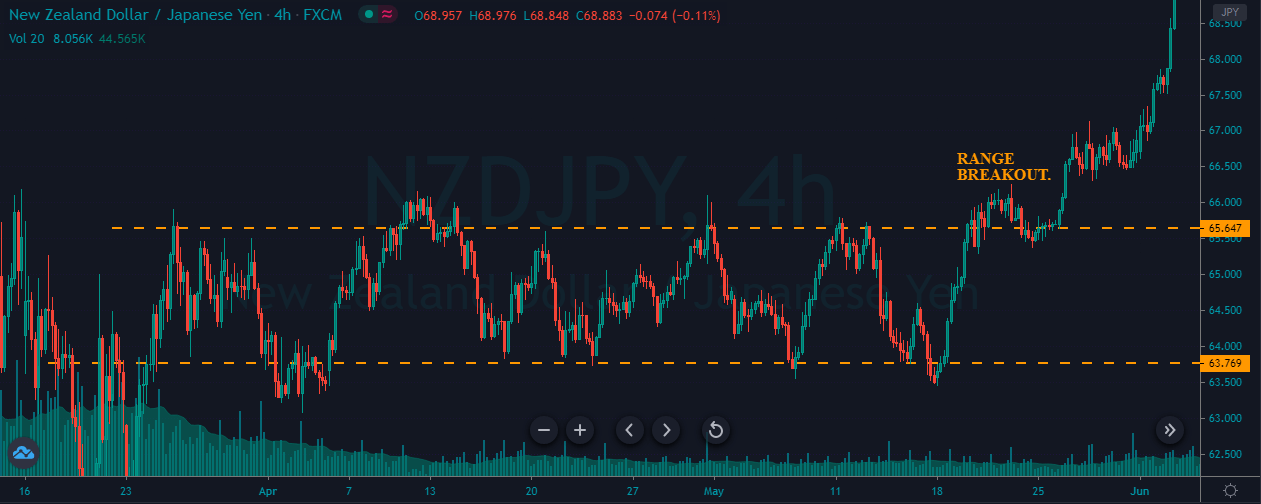
Most of the time, you would have observed traders taking buy/sell trades when the market moves in a range. But in this strategy, let’s trade the market only when the price breaks the range. Just like any other breakout, Range breakout also indicates the winning of one-party over the other.
The hold above the breakout confirms that the range is broken, and it is a good idea to go long. We choose smaller stops because the hold above the range gave additional confirmation.
That’s about breakouts and how to basically trade different breakouts in the market. In the upcoming lessons, we will be going through many of the concepts related to breakouts.

One reply on “141. Understanding The Concept Of Breakout”
This is very helpful. May you please add some concept on how to identify market reversals and market continuation