Categories
Forex Course

93. Introduction to Pivot Points

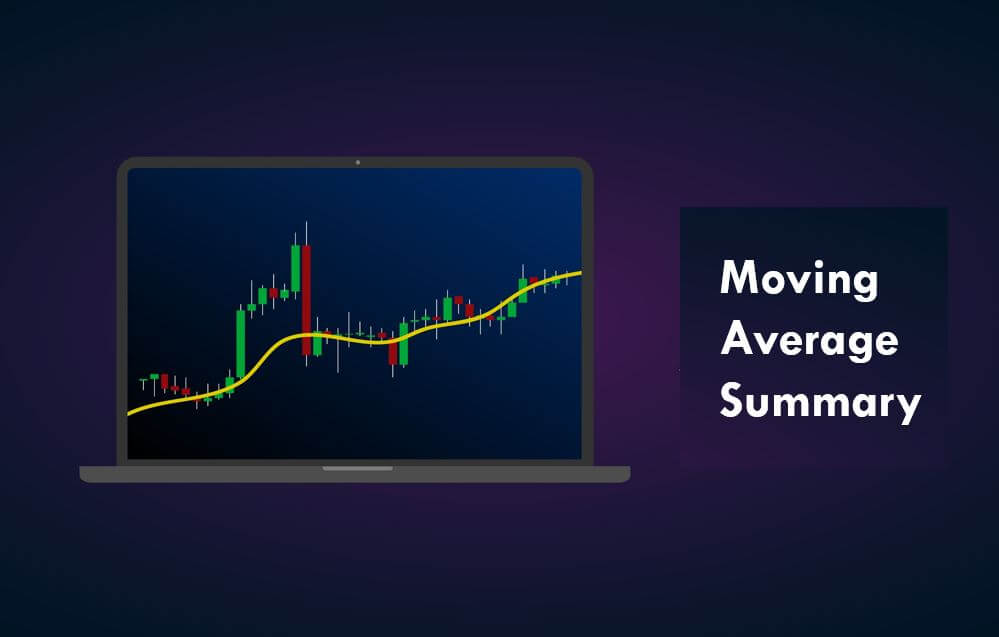
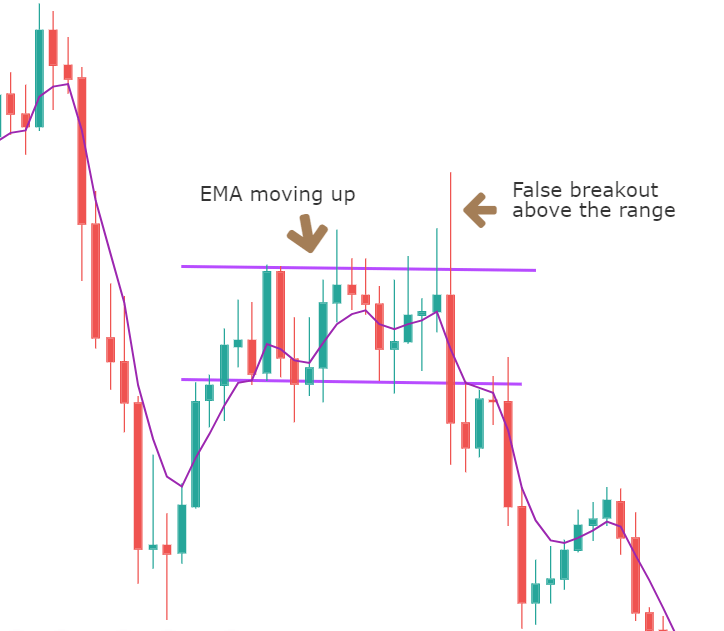
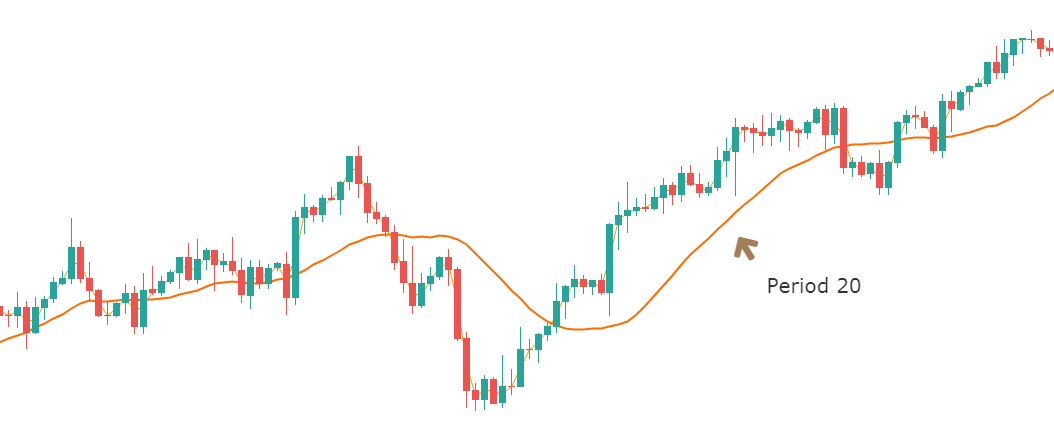
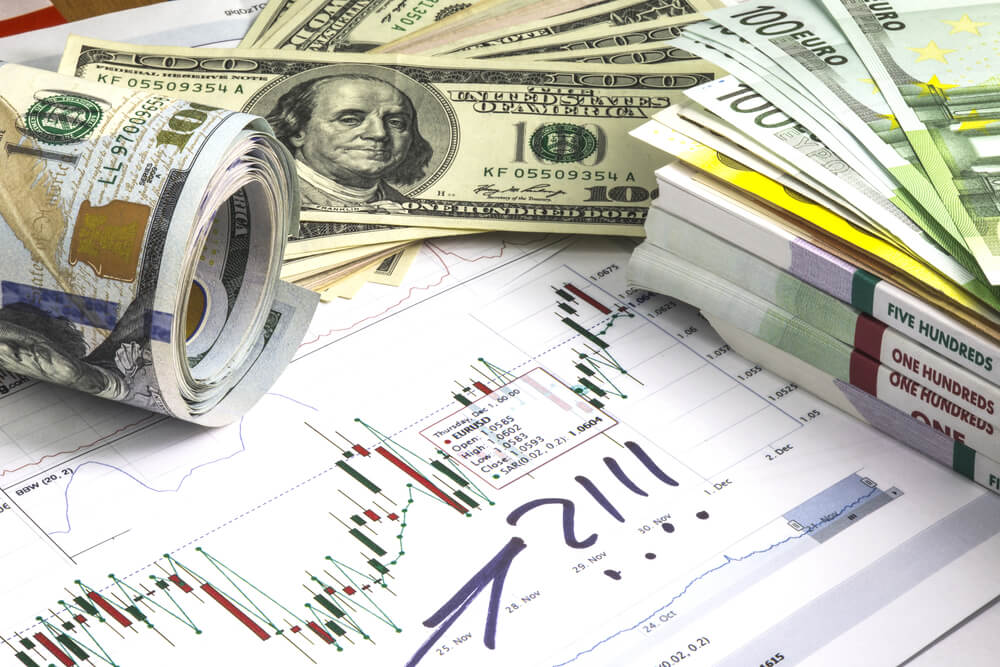
What is a Pivot Point?

The pivot point is a technical indicator that shows the levels typically used to determine the overall trend of the market in different timeframes. These points are essentially used by professional traders to identify support and resistance levels. As a retail trader, one must keep an eye on these levels to identify potential buy/sell signals. To put in simple terms, the pivot points and its corresponding support and resistance levels are places at which markets can possibly change its direction.

The reason this indicator is very enticing is because of its objective. Unlike other technical indicators, there is no decision making involved. The Pivot Points are very similar to the Fibonacci levels. This is because these levels are pretty much self-fulfilling. However, there are some differences in some respects, which shall be discussed in the next section.

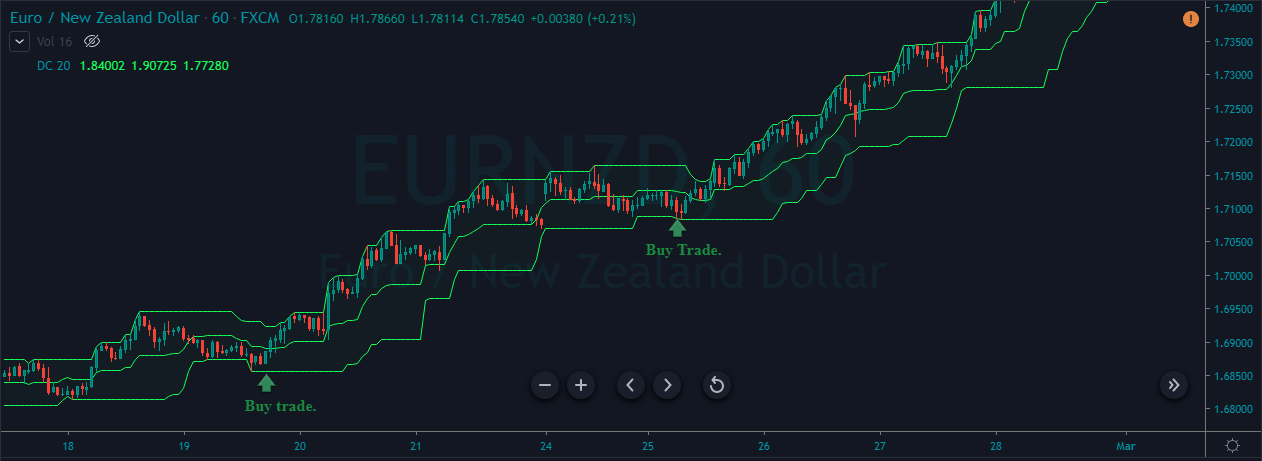
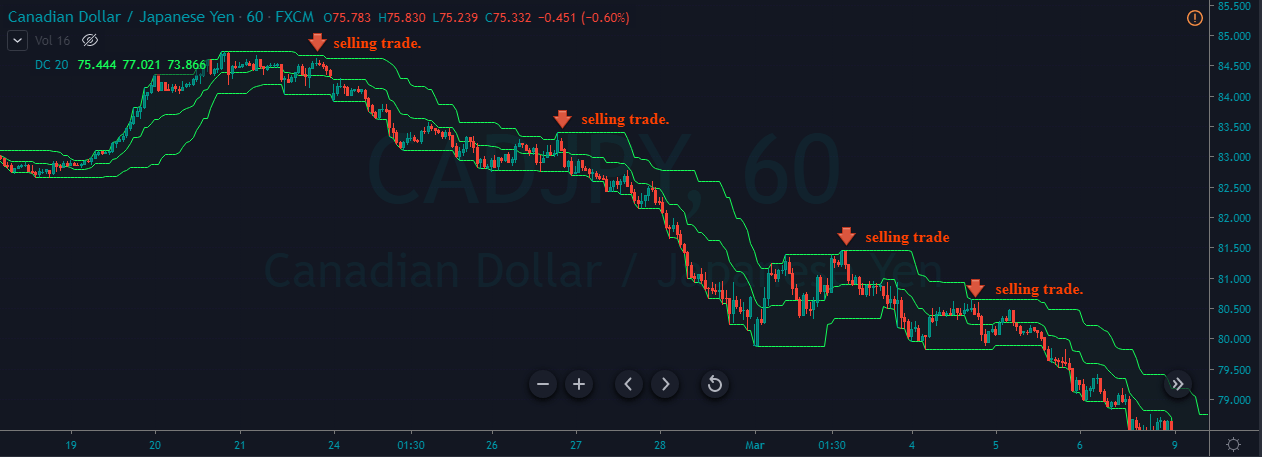
It is important to know that the pivot point indicator is mostly designed for short-term traders who wish to take advantage of small price movements. The technique to trade this is similar to that of trading support and resistance, where we participate in the market on a break or bounce from these levels.

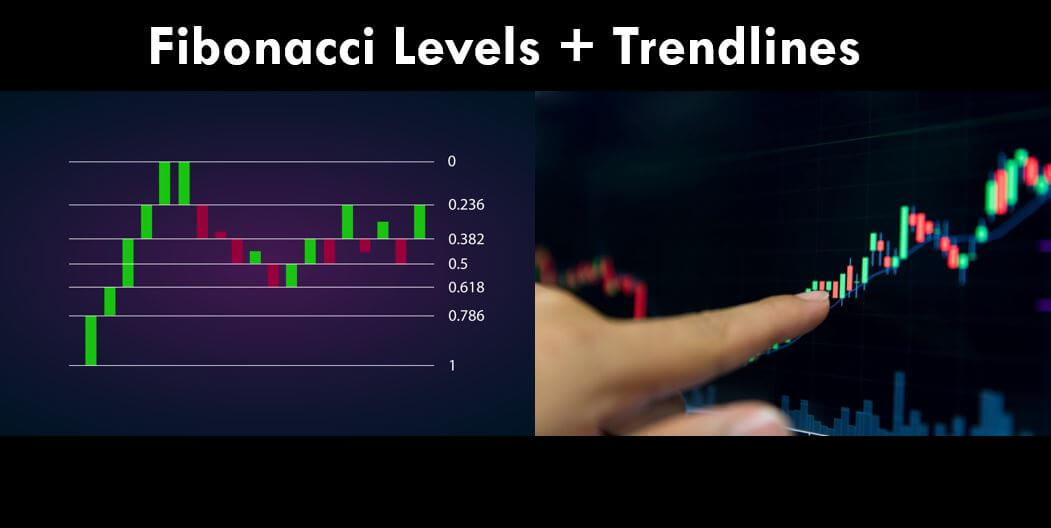
The Difference between Pivot Points and Fibonacci Retracements

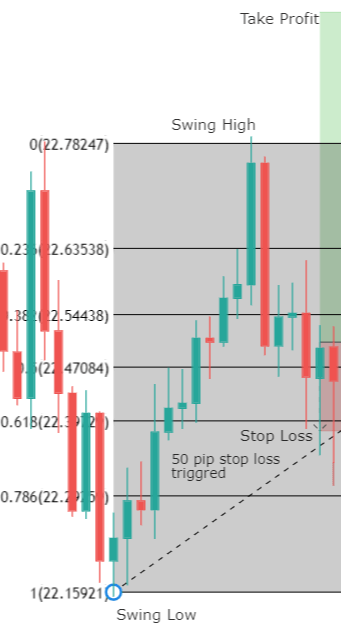
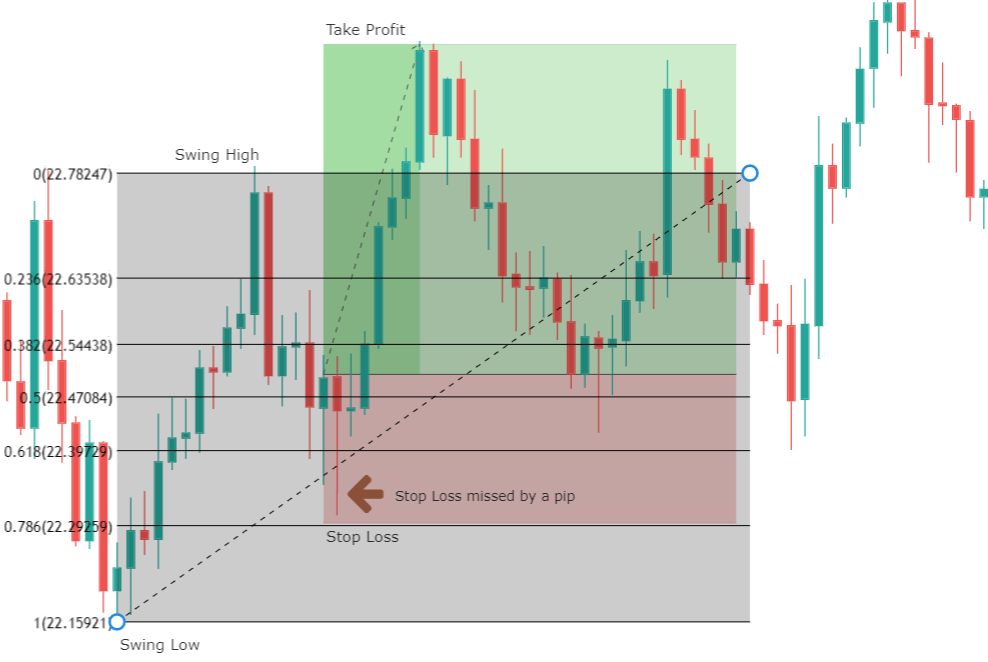
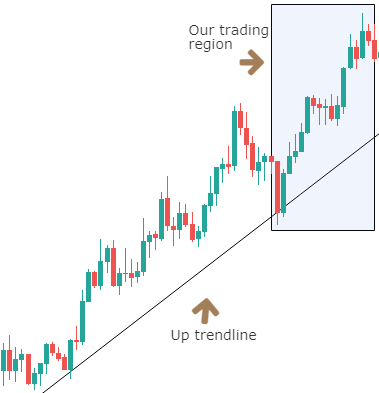
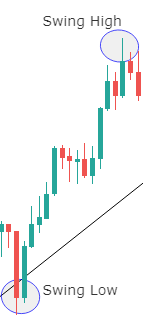
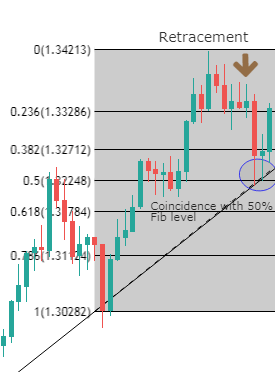
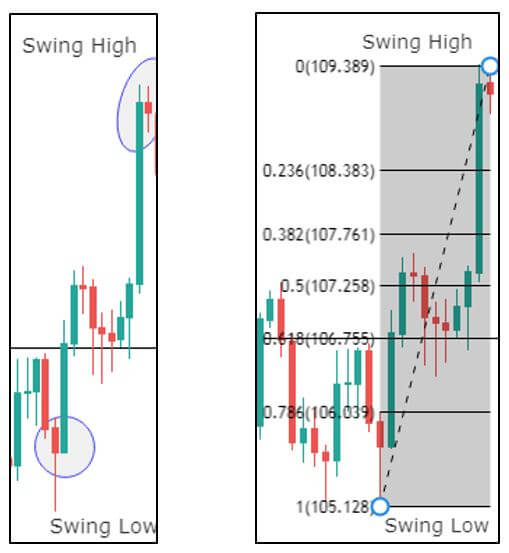
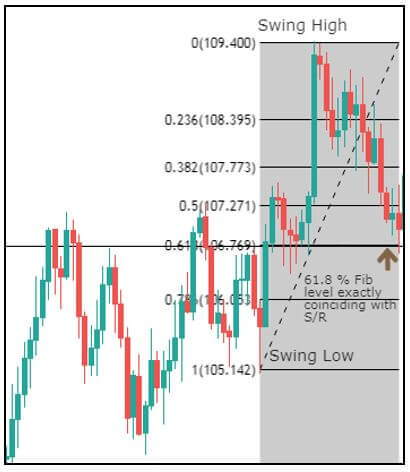
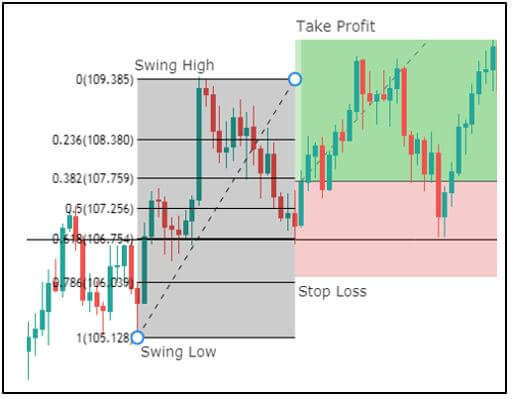
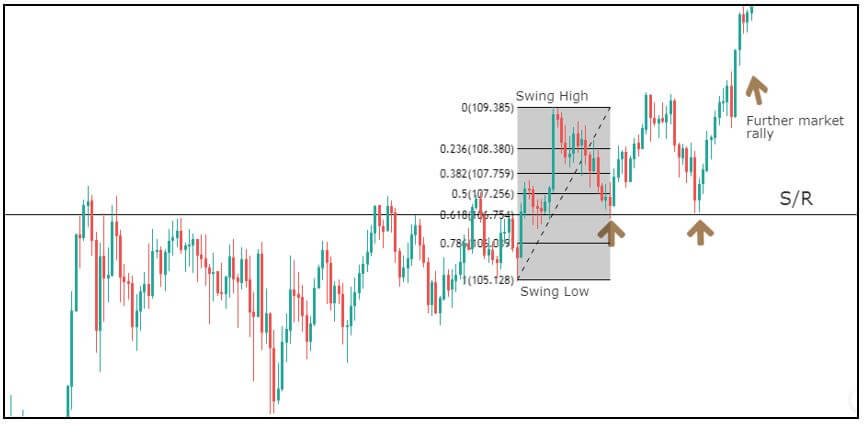
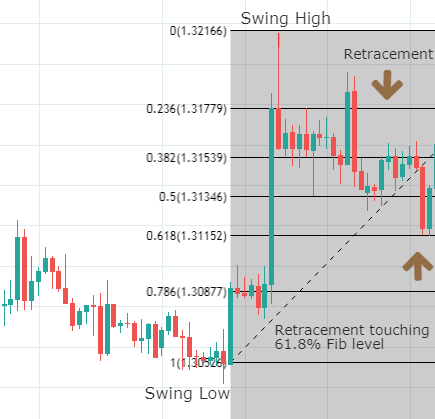
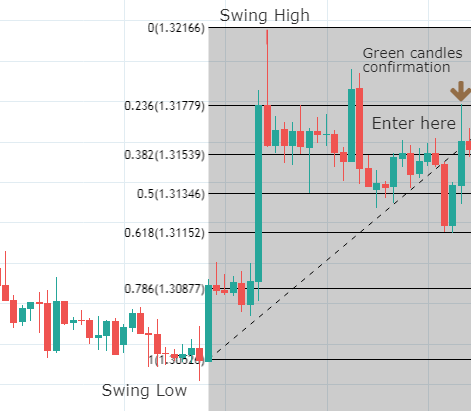
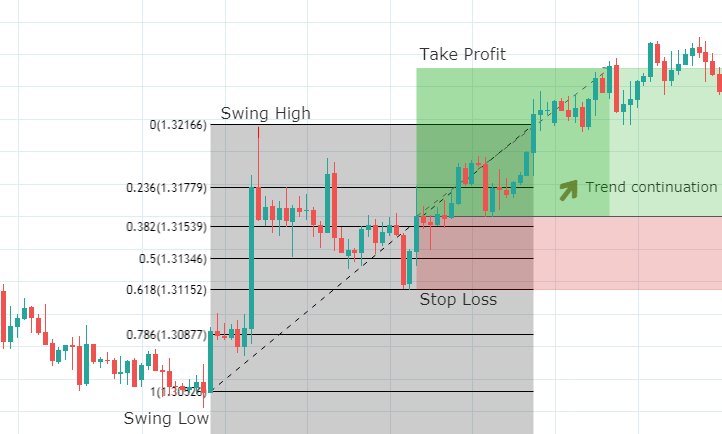
Though Pivot points and Fibonacci retracements are made by drawing horizontal lines to depict potential support and resistance levels, there vary in few aspects. In Fibonacci levels, there is subjectivity involved in picking the swing lows and highs. But, in pivot points, there is no discretion involved.

In Fib retracements, the levels can be constructed by connecting any price points on a chart. Once the levels are determined, the lines are then drawn at percentages of the selected price range. In the case of pivot points, fixed numbers are used instead of percentages. And the fixed values are the high, the low, and the close of the prior day.

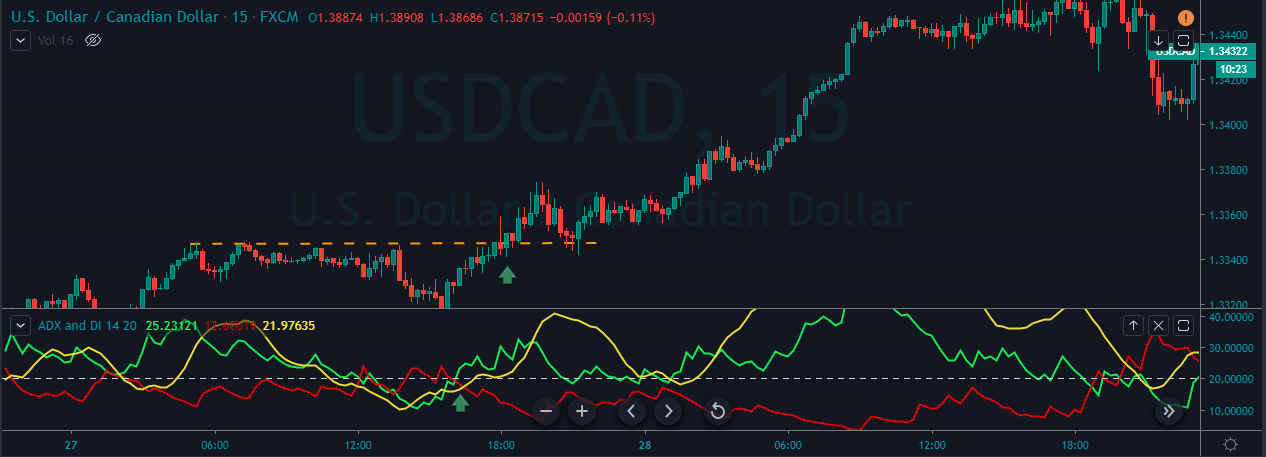
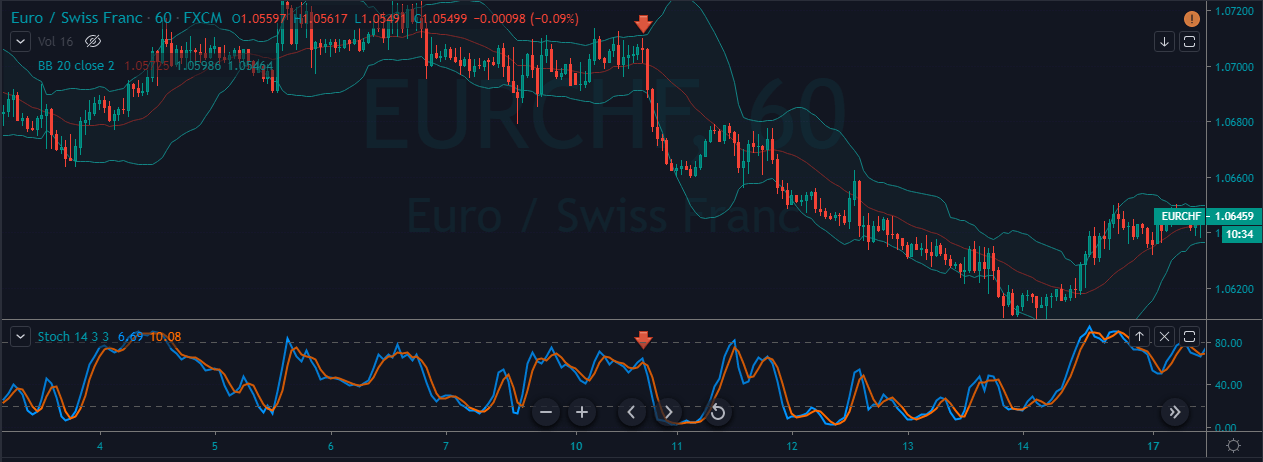
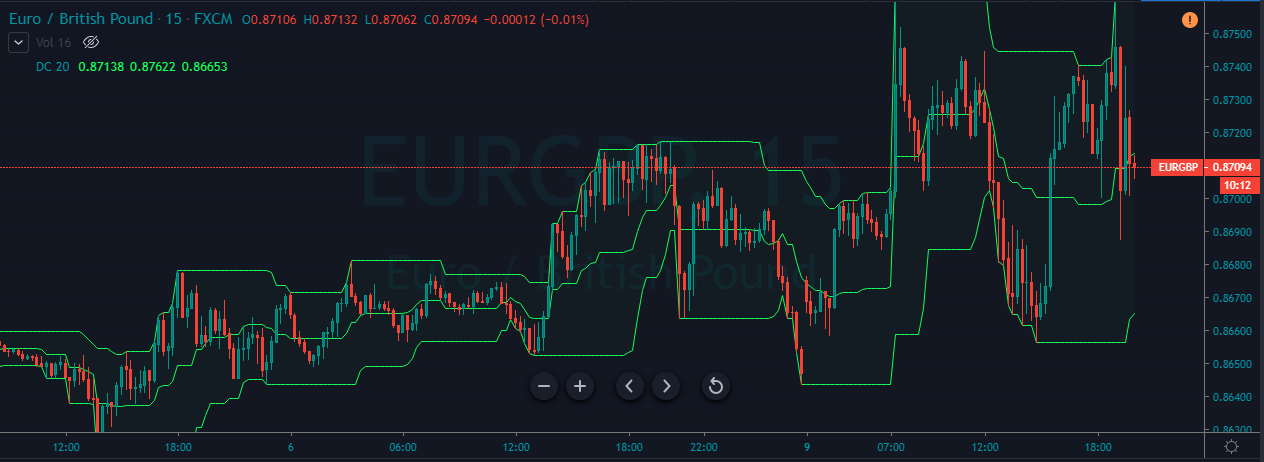
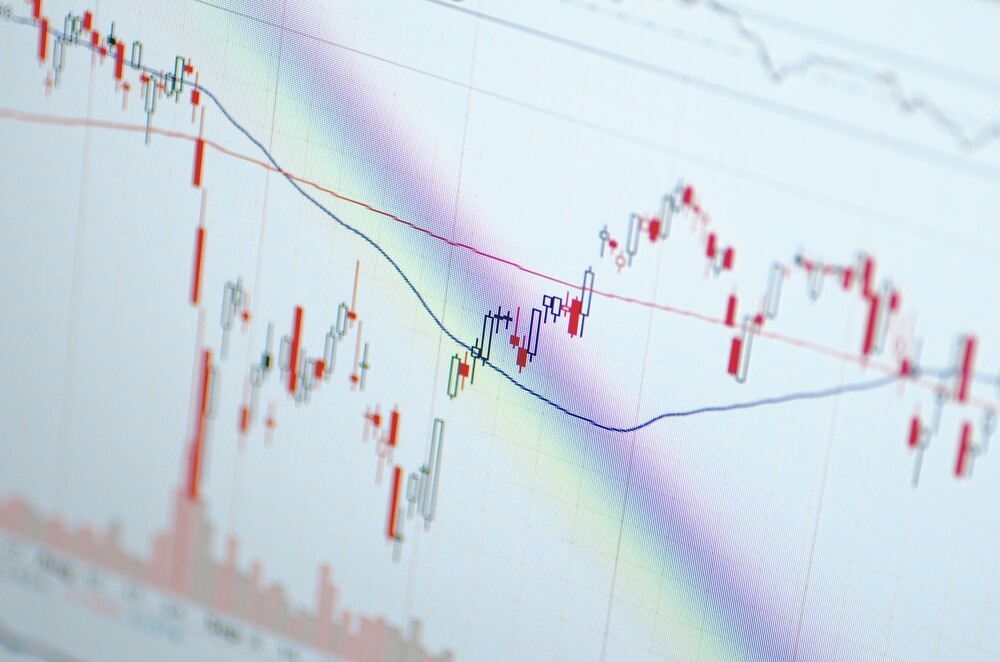
Interpreting Pivot Points

Pivot points indicator is typically used by traders who trade the market using technical analysis. This indicator can be applied to the Stock, Forex, Commodity, Futures as well as the Cryptocurrency market. This indicator is unique from the other indicators because it doesn’t move with the price action.

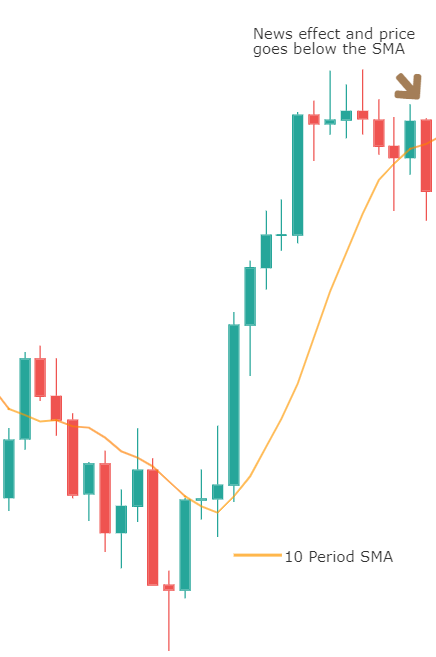
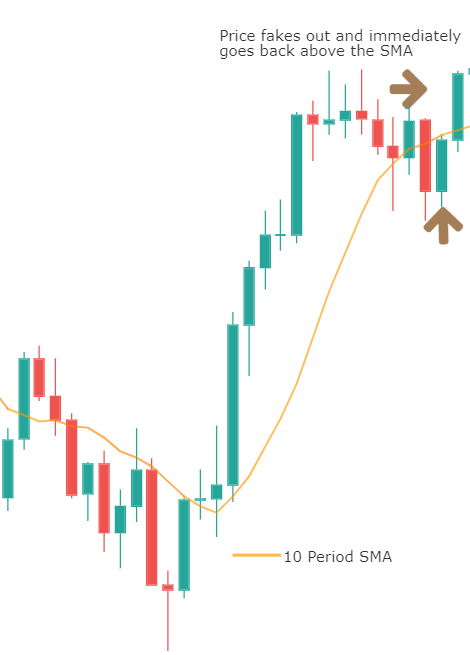
It is static, and the levels drawn remain at the same prices throughout the day. This means that traders can plan their strategy much in advance. For example, in most of the approaches, if the price falls below the pivot point, traders will go short on the security. And similarly, if the price goes above the pivot point, they will look for buying opportunities.

How do Pivot Points look?

When the standard pivot points are applied to the charts, it will look something like this (as shown below).

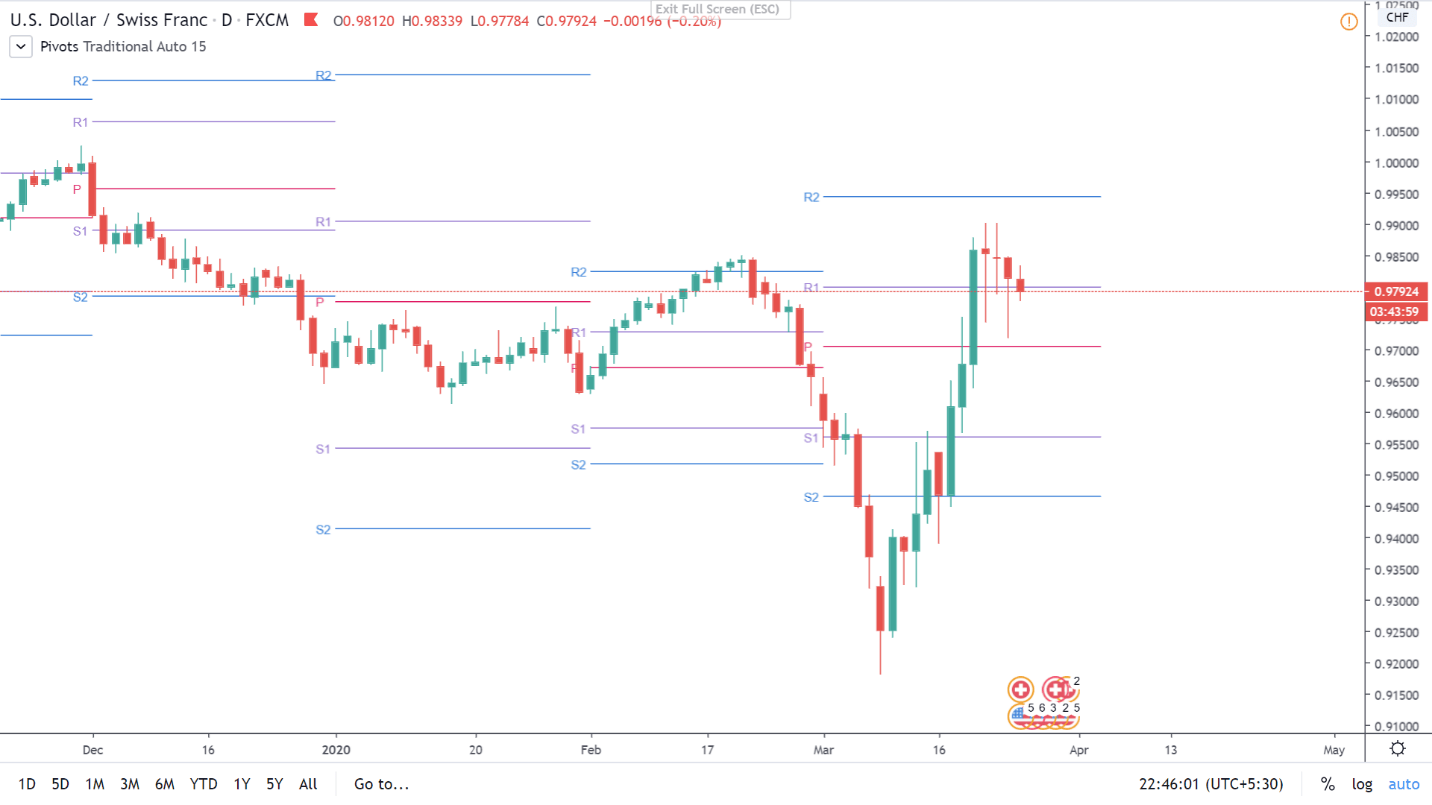
In the above chart, P stands for Pivot Point | stands for Support | stands for Resistance

There are R1, S1, R2, S2, etc. as well, but it shall be explained in the upcoming lessons. Stay tuned!

[wp_quiz id=”69068″]
Categories
Forex Course

Introduction To Forex Course 4.0

Hello People,

As you all know, we have completed Course 3.0 successfully. Thanks a lot for the brilliant response and great job on the quizzes you all have taken. We have covered some of the most critical fundamentals pertaining to technical analysis in course 3.0. Please make sure to practice all the concepts we have discussed in a demo account. Without practice, it is impossible to ace the Forex Market using technical analysis. We have also made a quick navigation guide for Course 3.0 so that it’ll be easier for you to get a quick recap whenever required. You can find that guide in the link below.

Quick Navigation Guide – Forex Academy Course 3.0

With all these learnings in mind, we will be moving on to the Forex Academy Course 4.0. We have discussed most of the basics concerning technical trading in the previous course. Hence, we will be exploring some sophisticated strategies and intermediate to advanced concepts of technical analysis in Course 4.0. It is crucial to have acquired the knowledge of whatever we have studied in the previous course to catch up with these complex concepts. So it is highly recommended to finish the previous course before starting off with this one.

Topics that will be covered in Course 4.0

Forex Chart Patterns & Their Importance

Trading The Most Popular Chart Patterns

Oscillators

Momentum Indicators

Pivot Points & their importance

Each of these topics will have about 7 to 10 course articles with corresponding quizzes. The USP of this course are the writers who prepared TOC and the related content. They are professional technical & price action traders who have a combined experience of 20+ years in the Forex market. So make sure to follow all the concepts that are discussed in this course and practice them well to become a successful Technical Trader. Also, try to answer the quiz questions until you get all the questions right. We wish you all the luck. Cheers!

Categories
Forex Course

89. Identifying Trading Signals Using The ‘ADX’ Indicator

Introduction

The ADX indicator is created by a technical analysis legend, ‘J Welles Wilder.’ ADX (Average Directional Index) shows how strong the market is trending in any direction. This indicator doesn’t have a negative value, so it is not like the oscillators that may fluctuate above and below the price action. The indicator gives a reading that ranges between 0 and 50 levels. Higher the reading goes, stronger the trend is, and lower the reading goes, weaker the trend is.

The ADX Indicator Consists of Three Lines.

  1. The ADX Line.
  2. The DI+ Line. (Plus Directional Movement Index)
  3. The DI – Line. (Minus Directional Movement Index)

The chart above is the visualization of the ADX indicator. We can see the green line (DM+), the Red Line (DM-), and the Yellow Line. (ADX)

Trend Direction and Crossovers

Buy Example

To take a buy trade using this indicator, the first requirement is that the ADX line should be above the 20 level. This indicates that the market is in an uptrend. We go long when the DI+ crosses the DI- from above as it indicates a buy signal.

The chart below is the EUR/AUD Forex pair, where we have identified a buy trade using the ADX indicator. As we can see, the market was in an uptrend, and it is confirmed by the ADX line going above the 20 level. At the same time, we can also see the crossover happening between the DI+ and DI- lines of this indicator. This clearly indicates a buying trade in this pair.

The stop-loss placed below the close of the recent candle is good enough, and we must exit our position when the ADX line (yellow line) goes below the 25 level.

Sell Example

The first requirement to take a seeling position using the ADX indicator is that the ADX line must be below the 20 level. This indicates that the market is in a downtrend. We go short when the DI+ line crosses the DI- line from below as it indicates a sell signal.

The below chart of the GBP/USD Forex pair indicates a sell signal. In a downtrend, when the ADX line (yellow line) goes below the 20 level, it confirms the strength of the downtrend. At the same time, when the DI+ crosses the DI-  from below, it shows that the sellers are ready to resume the downtrend.

Breakout Trading Using The ADX Indicator

This strategy is similar to the crossover strategy that is discussed above. However, we are adding the price action breakout part to it. The idea is to go long when the ADX line is above the 20 level and when the DI+ crosses the DI- line from above. Also, the price action must break above the major resistance level to confirm the buying signal.

As we can see, in the below USD/CAD Forex chart, when the ADX line goes above the 20 level, it indicates that the uptrend is gaining strength. It also means that we can expect a break above the resistance line soon. When the price action broke above the resistance line, we can see the crossover on the ADX indicator. This clearly indicates a buy trade in this currency pair.

We can exit the trades when the opposite signal is triggered. Most of the time, breakout trades travel quite far. So if your goal is to ride longer moves, exit your position when the momentum of the uptrend starts to die or when the price action approaches the major resistance area.

That’s about the ADX indicator and related trading strategies using this indicator. If you have any questions, please let us know in the comments below. Cheers!

[wp_quiz id=”68035″]
Categories
Forex Course

87. Using Ichimoku Cloud To Identify Trading Signals In The Forex Market

Introduction

The Ichimoku Cloud is a Japanese charting method and a trading system developed by Mr. Goichi Hosoda. This indicator consists of many different lines embedded in the price chart. Hence it might look complicated at first and might even make novice traders unforgettable reading the charts. But with enough experience, we can grab all the information presented by the indicator. The indicator consists of five Moving Averages and a cloud formed by two of those averages. The default settings of the indicator are 9, 26, and 52, and these settings are configurable according to the trader preference.

Components of the Ichimoku Cloud

This indicator consists of five lines in total, as discussed. They are a Red Line (Tenken Sen), Blue Line (Kijun Sen), Green Line (Chinoku Span), and Two Orange lines that make the cloud (Senkou Span A and B). Each line of the indicator is a moving average, so we can also look at the Ichimoku cloud indicator as a five moving average indicator.

The Basic Interpretations of the Ichimoku Cloud

When the price is above the cloud, it means the market is in a bullish trend. Contrarily, when the price is below the cloud, it means the market is in a bearish trend. When the price action is in the middle of the trend, it means that the market is in a consolidation phase.

Below is how a Forex price chart looks when the Ichimoku cloud is plotted on it.

Ichimoku Cloud Trading Strategy – Buy

First of all, the price action must be above the cloud as it indicates that the market is in an uptrend. When the Tenken Sen (Red Line) crosses the Kijun Sen (Blue line) from below, it indicates a bullish signal, and we can go long.

Buy Example 1

The image below represents a buying trade in the CAD/JPY Forex pair. We can see that the cloud goes below the price action, and it indicates that the trend is up. Soon after Tenken Sen (Red Line) crosses the Kijun Sen (blue line) below the price action, we know that the pullback is exhausted, and buyers are ready to resume the uptrend.

Buy Example 2

The image below belongs to the Weekly chart of the USD/CHF Forex pair. In Dec 2000, the Ichimoku indicator generated a clear buy signal when the cloud was below the price action, and the crossover of both the lines shows that it’s a perfect moment to go long in this pair.

Ichimoku Cloud Trading Strategy – Sell

The price action must be below the cloud as it indicates that the market is in a downtrend. Go short when the Tenken Sen (Red Line) crosses the Kijun Sen (Blue line) from above as it indicates a sell signal.

Sell Example 1

The below example is from the daily chart. It doesn’t matter which timeframe we trade; this strategy works well on all the timeframes. In the below image, at first, the market was in the consolidation phase. When the cloud goes above the price action, it’s a sign for us to prepare to go short soon in this pair. When the Tenken Sen (Red Line) crosses the Kijun Sen (Blue Line), it indicated that the sellers are now ready to print a new lower low.

Sell Example 2

If you are an investor or a higher timeframe trader, the below example is for you. The Red arrows and the encircled area indicate that the price action is below the cloud. Also, the Tenken Sen (Red Line) crosses the Kijun Sen (Blue line), indicating a sell signal.

The example below we took was from 2016, and the price action continuously goes down for the complete year. We should be patient enough and have control over our emotions to ride longer moves. We have placed the stop-loss above the crossover of two lines and booked the profits when the cloud goes below the price action.

That’s about Ichimoku Cloud and relative trading strategies. There are many other ways through which the signals can be generated using this indicator, but the ones discussed above are the most basic yet reliable ones. Cheers.

[wp_quiz id=”67661″]
Categories
Forex Course

86. Learning To Trade Using The Dependable ‘Stochastic Oscillator’

Introduction

Stochastic is a momentum indicator that was developed in the late 1950s by ‘George Lane.’ This indicator does not follow the volume or price of the underlying instrument; instead, it measures the speed and momentum of the price action. As a result, the indicator changes its direction before the price itself. This makes the Stochastic a leading indicator in the market.
We can change the sensitivity of this indicator to the market movement by adjusting the settings. Stochastic is a bounded indicator which oscillates between the 0 to 100 level. When the indicator reaches the 70-level, it indicates the overbought markets, and when it goes below the 30-level, we can assume that the market is in an oversold condition. The bullish and bearish divergences on the Stochastic indicator help us in anticipating the upcoming price reversals.

Trading Strategies Using The Stochastic Oscillator

Oversold & Oversold Areas

This is the basic yet powerful Stochastic strategy that is widely used by most of the traders. The idea is to go long when the indicator reverses at the oversold area and go short when it reverses at the overbought area. Let’s understand this with an example.

The image below is an NZD/CAD Forex price chart. It represents two buying and one selling opportunity in an uptrend. These trades are solely taken based on the strategy that we discussed above.

We have placed the stop-loss just below the recent candle and close our position when the market gave an opposite signal. The market circumstances don’t matter as this indicator can be used in any situation. The crucial thing is to follow the rules of the indicator very well.

If the indicator generates a buy signal, only take buy entries, and when it says sell, only consider selling opportunities. If we are in a buy trade and if the indicator represents a sell trade, that is the time to close our position. Never be rigid and ignore the indicator signals to hold the position for extended targets. If that happens, we will be on the losing side.

Stochastic Indicator + Bollinger Bands

Bollinger band is a leading indicator, and it consists of two bands, which are above and below the price action. This indicator also has the centerline, which is a Moving Average. The bands of the indicator expand and contracts according to market volatility. They expand if the volatility is more and contract when the volatility is less.

Buy Example

First of all, find an uptrend in any Forex pair. When the price action hits the lower Bollinger Band, see if the Stochastic indicates the oversold market condition. If it does, it means that the sellers now have a hard time to go lower and taking buy entries from here will be a good idea.

As you can see in the below image, the EUR/AUD was in an uptrend. During the pullback phase, the Stochastic reaches the oversold area, and the price action hits the lower Bollinger Band. This is an indication to go long in this pair. As we have activated our trade, the price action blasts to the north. We can close our position when the Stochastic indicator reaches the overbought area. If you want to ride longer moves in the trending market, exit your position at the major resistance area.

Sell Example

First of all, find a downtrend in any Forex pair. When the price action hits the upper Bollinger Band, see if the Stochastic is indicating overbought market conditions. If it does, it means that the buyers now have a hard time to go higher and taking sell entries from here will be a good idea.

The image below is the EUR/CHF Forex pair, and the pair was in an overall downtrend. During the pullback phase, the price action turned sideways. But when the price action hits the upper Bollinger Band and the Stochastic indicator reverses at the overbought area, it is a sign to go short in this pair.

We can place the stop-loss just above the upper Bollinger band, and the take-profit must be at the higher timeframe’s support area. If you are an intraday trader, close your positions when both the indicators give an opposite signal.

That’s about Stochastic indicator and related trading strategies. If you have any doubts, let us know in the comments below. Cheers.

[wp_quiz id=”67442″]
Categories
Forex Course

85. Learning To Trade By Using The ‘True Strength Index’ Indicator

Introduction

The True Strength Index (TSI) is a technical indicator used to analyze the financial markets. ‘William Blau’ developed the indicator in the mid of 1991. If you are interested to know more about William Blau and the technical tools developed by him, we suggest you read his book – ‘Momentum, Direction, and Divergence.’ The True Strength Index abounds between the +100 and -100 levels, and most of the values fall between +25 and -25.

Typically, the price action moves between these levels, and they are considered as overbought and oversold levels. This indicator also warns the weakening of a trend through the divergence and indicates a potential trend changes via centerline. When the indicator goes above the zero-level, it means the indicator is in positive territory, and the buying market is strong. But if the indicator goes below the zero-level, it means that the indicator is in negative territory, and the selling market is strong.

Below is how the price chart looks when the True Strength Index indicator is plotted on it.

True Strength Index Trading Strategies

Traditional Trading Strategy

Buy Example

We must look for buy trades when the crossover of the TSI lines happen at the oversold levels and hold it until the price action reaches the overbought level. The image below represents a buying entry in the AUD/JPY Forex pair. In an uptrend, when the market gives a decent pullback, the TSI indicator reached the oversold area, which means that the sellers are exhausted now and prepare for the buys. Soon after the exhaustion, the crossover happened on the TSI indicator, indicating a buy trade.

Sell Example

Look out for selling opportunities when the crossover happens at the overbought levels and hold it until the price action reaches the oversold level. The below chart represents the sell trade in the AUD/JPY Forex pair. The TSI indicator reached the overbought level when the price action gave enough pullback; the crossover indicates the failure of buyers to move price action higher, and as a result, reversal happened. We can exit our positions at any of the major support levels, or when the indicator gives an opposite signal.

TSI Breakout Strategy

Buy Example

The strategy is to identify a breakout on the price chart. Once the breakout happens, the TSI indicator must be above the zero-line to take the buy trade. We can see that in the below image when the breakout happened on the EUR/CAD Forex pair. After the breakout, we can see that the TSI indicator was also above the zero line, indicating a buy signal in this pair. We can exit our positions at the higher timeframe’s resistance area or exit when the TSI reaches the overbought area.

Sell Example

In a downtrend, find out a sell-side breakout. After the breakout, if the TSI indicator goes below the zero-line, it indicates a sell trade. As we can see in the image below, when the price action broke the trend line, the TSI indicator also breaks below the zero line, which shows that the sellers are ready to print a brand new lower low in this pair.

That’s about TSI and trading strategies related to this indicator. Make sure to try this indicator and these strategies and let us know hoe did your trades go in the comments below. Cheers.

[wp_quiz id=”67291″]
Categories
Forex Course

83. Learning To Trade The Donchain Channel Indicator

Introduction

The Donchain channel indicator is one of the quite popular technical indicators in the market. It is developed by Richard Donchian in the mid-twentieth century. This indicator consists of three moving average lines calculated by the highest high and lowest low of the last ‘n’ period. The upper Donchian band marks the highest price of the security over the ‘n’ period of time, whereas the lower band of the indicator marks the lowest price of a security over the “n” period of time. The area between the upper and lower band represents the Donchian channel.

If the price action is stable, the Donchian channel stays in a narrow range, and in volatile market conditions, the Donchian channel indicator will be wider. In this way, the Donchian channel is a wonderful indicator to assess the volatility of the market. The upper Donchian band indicates the extent of bullish energy, highlighting the price action achieved a new high in a particular period. Whereas the centerline of the indicator identifies the mean reversion price for a particular period. The bottom line identifies the extent of bearish energy, highlighting the lowest price achieved by the sellers in a fight with the buyers.

Below is how the price chart looks once the Donchain Channel indicator is plotted on to it.

Trading Strategies Using The Donchain Channel Indicator

Scalping Strategy

This strategy is made for traders who prefer to make quick bucks from the market. By following this strategy, we can get a couple of trades in a single trading session. The idea is to go long when the price action hits the lower band and go short when the price hit the upper band. The preferred time frame will be a 5- or 3-minute chart.

The image above represents a couple of buying and selling trading opportunities. Scalping is the easiest way to make quick bucks from the market. When we take a buy or sell trade, and if the price action goes five pip against your entry, we suggest you close the trade and wait for the price action to give another trading opportunity. Book the profit when price action hits the opposite band of the indicator.

Donchain Channel To Trade The Trending Market

If the market is in an uptrend, it is advisable to go only for the buy trades, and if it is in a downtrend, only go for sell trades. In this way, we can filter out false trading opportunities, and by following the trend, we can easily hold our position for longer targets.

Buy Trade

The below image represents two buying opportunities that we have identified in the EUR/NZD pair. We can see that the trend was up, and if we take any of those small sell trades, we will end up on the losing side. So on a higher timeframe, it is advisable to trade with the trend. We have captured the whole buying movement in this Forex pair. This is the easiest and safest way to trade the market using this indicator

Sell Trade

The below image represents a couple of selling opportunities in the CAD/JPY Forex pair. We can scale our positions when the market gives an opportunity to do so. Or, we can close our positions when the opposite signal is triggered. Always wait for the desired signal with patience to trade the market.

The advantage of trading with the trend is that whenever the market gives us the trading opportunity, we can easily hit the trade without worrying much. Another advantage of trading with the trend is that we can go with a smaller stop-loss as the price action spikes very less in a trending market.

These are only a few applications of the Donchain Channel Indicator. You can follow our strategy section to learn many advanced applications of this indicator. Stay tuned to learn many more technical indicators. Cheers!

[wp_quiz id=”67024″]
Categories
Forex Course

81. Learn To Trade Using The ‘RSI’ Indicator

Introduction

In our previous article, we have learned how to trade the markets using the Bollinger Bands. We hope you have used that indicator in a demo account and got a hang of it. Now, in this course lesson, let’s learn the identification of trading opportunities using a reliable indicator know as RSI.

RSI is one of the most famous indicators used in the Forex and the Stock market. It stands for the ‘Relative Strength Index’ and is developed by an American technical analyst – J. Welles Wilder. This momentum indicator measures the magnitude of the price change to identify the oversold and overbought market conditions.

The RSI indicator consists of a line graph that oscillates between zero and 100 levels. Traditionally, the market is considered overbought when the indicator goes above the 70-level. Likewise, the market is considered oversold when RSI goes below the 30-level. These traditional levels can be adjusted according to different market situations. But if you are a novice trader, it is advisable to go with the default setting of the RSI.

When the market is in an overbought condition, it indicates a sell signal in the currency pair. Likewise, if the market is in an oversold condition, we can expect a reversal to the buy-side. To confirm the buy and sell signals generated by the oversold and overbought market conditions, it is advisable to also look for centerline crossovers.

When the RSI line goes above the 50-level, it means that the strength of the uptrend is increasing, and it is safe to hold our positions up to the 70-level. When the centerline goes below the 50-level, it indicates the weakening in strength and any open sell position until the 30-level is good to hold.

RSI is one of those indicators which is not overlapped with the price action. It stays below the price charts. Below we can see the snippet of how the RSI would look on the charts. The highlighted light purple region marks the 70 and 30 levels, and the moving line in the middle is the RSI line.

How To Trade Using The RSI Indicator

There are various ways to use the RSI indicator to generate consistent signals from the market. You can use this indicator stand-alone, or you can pair it with other indicators and with candlestick patterns for additional confirmation. In this article, let’s learn the traditional way of using the RSI indicator along with RSI divergence and RSI trendline breakout strategies.

Traditional Overbought/Oversold Strategy

In the traditional way, we just hit the Buy when the RSI indicator gives sharp reversal at the oversold area. Contrarily, we go short when the RSI indicator reverses at the overbought area. The image below represents the Buy and Sell trade in the AUD/CAD Forex pair. We must close our positions when the market triggers the opposite signal. Stop-loss can be placed just below the close of the recent candle.

RSI Divergence Strategy

Divergence is when the price action moves into one direction, and the indicator moves in another direction. It essentially means that the indicator does not agree with the price move, and soon a reversal is expected. In other words, RSI divergence is known as a trend reversal indication.

In the below image, price action prints the RSI divergence twice, and both times the market reversed to the opposite side. When the market gives us a reversal, find any candlestick pattern or any reliable indicator to confirm the trading signal generated.

In the below image, we have identified the market divergence twice, and both the times the market reversed. If traded correctly, this strategy will result in high profitable trades.

Trendline Breakout Strategy

RSI trend line breaks out is a quite popular strategy as it is used by most of the professional traders. In the image below, when price action and the RSI indicator breaks the trend line, we can see the market blasting to the north.

Always remember to strictly go long in an uptrend, and go short in a downtrend while using this strategy. Buying must be done when the market is in an overbought condition, and the selling must be done when the market is in an oversold condition.

If you want to confirm the entry, wait for the price action to hold above the breakout line to know that the breakout is valid. Exit your positions when the RSI reaches the opposite market condition.

That’s about RSI and trading strategies using this indicator. Try using this indicator on a demo account today and experiment with the above-given strategies. Let us know if you have any questions in the comments below. Cheers!

[wp_quiz id=”66690″]
Categories
Forex Course

79. Is Indicator Based Trading For You or Not? (Pros & Cons)

Introduction

In the previous course article, we have briefly discussed the basics of indicator-based trading. We have also understood the different types of indicators. Before considering how to trade using these indicators, let’s see if indicator based trading is for you or not. For that, we will be listing down some of the significant pros and cons involved in indicator-based trading. After going through this article, we will know why we should be using indicators to trade the markets and what we should be cautious about while using these indicators.

Pros of using Technical Indicators

Simplification

As discussed in the previous course article, Indicators mainly present the existing price and volume data on the price charts. For novice traders who have less knowledge of reading this data, can take the help of indicators to understand the price charts in a more precise way. Also, indicators act as a great tool to identify market strength.

For instance, using the Moving Average indicator, the direction of the trend can be found. By using the stochastic indicator, overbought and oversold areas can be found. These cannot be easily identified by the novice traders if not for these indicators.

Swift Decision Making

Since you aren’t entirely aware of most of the indicators, we would like to give you an example of the indicators we have learned till now. If you remember trading Fibonacci levels, we have taken our entries right after the price bounces after touching the respective Fib levels. It is impossible to make such swift decisions in the absence of these indicators. Hence we can say that indicator based trading allows us to make quick decisions comparatively.

Confirmation Tool

Indicators act like an excellent confirmation tool for experienced traders as well. For example, a technical trader identifies a candlestick pattern and wants to take trades based on that pattern. To confirm if the signal provided by the pattern is accurate or not, he can take the help of any technical indicator like RSI or Stochastic. If the indicator supports the signal provided by the pattern, the trader can confidently make trades.

Combination Capability  

Indicators can be combined to understand the market more clearly. For instance, Moving Averages can be combined with Fibonacci levels, and Stochastic can be combined with many other reliable indicators to generate accurate signals. If we wish to, we can even add an end number of indicators, but these additions should able to simplify the price chart rather than making it more complex.

Cons of using Technical Indicators

Unawareness of the complete picture

Novice traders who get used to trading with these indicators can never get an entire background on what’s happening behind the charts. If they get used to this, they can never become a professional technical trader. Also, they won’t be able to identify if the signal generated by the indicator is accurate or not. Hence, it is always crucial to understand why the indicator is moving the way it is so that we can make better trading decisions.

Not for pure price action traders

Price action trading is also a part of technical trading. It is purely based on the price movements of the asset alone. So price action traders might find indicator based trading a bit redundant because they know why the price is moving the way it is moving. Hence we can say that indicators don’t add more value to pure price action traders.

Lag Issue

By now, we know that there are lagging indicators that portray what has already happened in the market. These indicators do add significant value to indicator based trading, but they can’t be completely used to take the trades.

Final Word

These are some of the pros and cons involved in using indicators for trading the markets. So the answer to the question ‘If the Indicator based trading is for you or not?’ is yes. It is for you. But we have to be cautious and understand the entire picture instead of blindly following the indicators. In the upcoming articles, we will start learning how to take trades using various reliable indicators in the market. Cheers!

Categories
Forex Course

78. Brief Introduction To Technical Indicators & Indicator Trading

Introduction

In the past two sections of this course, we have discussed two of the most important tools in Technical Analysis – Fibonacci & Moving Averages. These two are discussed in an elaborated way because you might be using them in conjunction with many of the other reliable indicators in the market. They can be used standalone not just to take trades but also for different other purposes. For instance, Moving Averages can be used to identify the direction of the trend. Likewise, Fibonacci Levels can be used to test the reliability of any support and resistance level.

Since we have completed learning these crucial tools, it’s time for us to extend our learning to understand specific technical tools known as indicators and oscillators. There are many indicators and oscillators in the market. Some are reliable, and some are not. So in the next few course lessons, we will be discussing some of the most credible and reliable indicators. In this lesson, let’s first understand what an Indicator basically is and why it is important to use them in technical analysis.

What is an Indicator?

An indicator is a tool that is used by technical traders and investors to understand the price charts and market conditions. The important purpose of any indicator is to interpret the existing data and accurately forecast the market direction. These indicators are built on various mathematical calculations by market experts.

These days, with the advent of technology, hundreds of indicators can easily be accessed. They are available on most of the charting platforms that we currently use, like MT4 & TradingView. Many of the reliable indicators we have today are a result of extensive research and back-testing. Any technical indicator considers a lot of important data like historical price and volume to predict the future price of an asset.

Indicators are an integral part of technical analysis, and the number of traders who just rely on indicators to take trades is pretty high. Typically, most of the indicators overlay on the price charts to predict the market trend. However, there are indicators that position themselves below the price chart to make users understand the overbought and oversold market conditions.

Oscillators are nothing but range-bound indicators. Which means, an oscillator can range from 0 to100 levels (0 being the floor and 100 being the roof). Essentially, if the price of an asset is at 0, it represents oversold conditions. Likewise, if the asset’s price is at 100, it represents overbought conditions.

Two Types of Indicators

Indicators are classified into two different types – Leading Indicators & Lagging Indicators. As the names pretty much suggest, leading indicators are those that predict the future price direction of any given currency pair. Essentially, these indicators precede the price action and predict the price.

Leading Indicator Examples: RSI (Relative Strength Index), Stochastic Indicator, & Williams %R.

Contrarily, lagging indicators act more like a confirmation tool. They follow the price action and help traders to understand the complex price charts better. One of the best use cases of a lagging indicator could be while testing the trend. We can confirm the trend along with its strength using a lagging indicator.

Lagging Indicator Examples: MACD (Moving Average Convergence & Divergence) & Bollinger Bands.

That’s about a brief introduction to Indicators and Indicator trading. In the next lesson, let’s understand the pros and cons involved in Indicator trading. Once that is done, we can start learning some of the most reliable indicators and how to trade the markets using them. Cheers.

[wp_quiz id=”66227″]

Categories
Forex Course

77. Moving Averages – Detailed Summary

Introduction

In the past few course articles, we have learned a lot about Moving Averages, their purpose, and various applications of this trading tool. So we just wanted to summarize everything we have discussed until now related to Moving Averages. This article will act as a quick guide for you to recall and remember the concepts better.

What Is A Moving Average?

A moving average is a tool that is used by the traders to identify the direction of the trend. It smoothens the price fluctuations by eliminating the temporary noise in the market. This will eventually help us in identifying the actual trend of the market. There are two types of moving averages, and both of them have different purposes. They are Simple Moving Average and Exponential Moving Average. There are different athematic calculations behind these averages, and we don’t have to know about them in detail. However, if you are interested in knowing, you can find the formula behind the averages here.

The length plays a significant role in the usage of a Moving Average. Lenght is nothing but the predetermined period of the moving average. Smaller MAs always reacts swiftly to the price movements where are longer MAs respond slowly to the price. For example, a 10-period MA always reacts quickly compared to a 20 or 30 period moving average.

SMA vs. EMA

Both SMA and EMA have their own applications to them. They can also be combined to produce more reliable trading signals. But those are sophisticated strategies that are used by some of the experienced traders. The basic approach is that the SMA should be used to protect yourself from the fake-outs that are produced by the market. We might miss out on the opportunity of being a part of the early trend, but we will be safe.

Contrarily, Exponential Moving Average quickly predicts the trend and help us in being a part of the early trend. However, it carries the risk of not identifying the fake-outs. Hence one must use these MAs depending on the market situations. We have also discussed the ways through which we can identify the market trend and taking trades using moving averages.

Applying the Moving Average Indicator On The Price Charts

With the advent of technology, most of the Forex charting platforms these days provide advanced MA indicators. MT4 has all of the moving average indicators by default. However, if you want to download a customized MT4 indicator, you can download it here. If you are a TradingView user, you can plot different period MAs on the price charts just by accessing the toolbar and choosing the MA indicator. You can change the period setting before plotting the MA on the charts.

Conclusion

Moving Average is one of the most basic technical tools but is sturdy. The usefulness of this indicator is increased when we use different period moving averages on the same chart. Also, this indicator can be combined with various other technical indicators to improve the reliability of our signals. If you have been following our strategy series, you would have seen us combining moving averages with other technical tools to filter out fake trading signals. That’s about the basics of moving averages and their applications. In the upcoming lessons, we will be learning about various indicators and their use cases. So stay tuned! Cheers.

Categories
Forex Course

76. Using Moving Average As Dynamic Support & Resistance

Introduction

In the previous article, we saw how moving averages could be used to find potential trade setups that are essentially based on trend reversal. The next fascinating use of the moving average is that they act as crucial Support and Resistance levels. We know the importance of Support and Resistance levels in technical analysis, and we learned how many indicators can be paired with these levels to generate potential trades.

But in the case of moving averages, this indicator itself acts as a potential support and resistance areas. We need to remember that these levels keep changing as and when the market changes its direction. That is why these levels are known as dynamic support and resistance levels. In this article, let’s understand this concept clearly.

In the below chart, we can see that the market repeatedly takes support at 50-Period EMA and then continues its uptrend.

From the above chart, we can also notice that the price at times is going below the EMA before bouncing off. Also, some times, the price is not precisely touching the EMA. In some cases, it is also possible that the market can just crash downwards without respecting our EMA line.

To overcome this problem, we should plot more than one EMA on the chart and then buy or sell once the price is in the middle of the two moving averages. We can also refer to this as the ‘trading zone.’ Let us see how the above chart will look after plotting another EMA on it.

After plotting 100-period EMA on the chart, we can see the price entering the areas between two MAs before going up and does not even touch the second MA. This means moving averages should never be used as single line support and resistance levels; rather, it is a ‘zone’ from where the market has a high chance of reacting.

When we use the concept of ‘zones,’ we get a clear idea of where to put the ‘stop-loss’ and ‘target.’ For example, the ‘stop-loss’ can be placed below the second MA, and ‘target’ could be the new higher high. When we have such a wide area for our ‘stop-loss,’ there is less chance of us getting stopped out before the trade performs in our favor.

Role Reversal of moving averages as Support and Resistance

Now that we know how moving averages act as support and resistance levels, we need to check if follows all the rules of S&R. One of the most significant rules of S&R is support turning Resistance and vice versa. We shall see if MAs follow that.

Below is a chart that shows how the moving average turns into Resistance after it was previously behaving as support. The yellow-colored arrow marks the point where the price broke through and crashed. Later, it started acting as a dynamic resistance level.

Conclusion

Using moving averages as support and resistance levels can be highly profitable when done with proper trade management. Intraday traders mostly use this technique as they fear of getting stopped out due to spikes. The best part of this application of the moving average is that they’re dynamic, which means we just need to plot them and leave it on the chart. We don’t have to keep looking back to spot support and resistance levels. In the next article, we will summarize all that we have learned about the moving averages. Cheers.

[wp_quiz id=”65911″]
Categories
Forex Course

75. Using Moving Average Crossovers To Take Trades

Introduction

In the previous article, we learned how to use the moving average for determining the direction trend. The Moving Average lines not only helps us in identifying the direction of the market but also tells us when a trend is about to end and potentially reverse. In today’s lesson, we will see how the moving averages can be used to enter trades at the reversal of a trend.

The principle of the strategy is to discover the crossover of the two moving averages on the chart. When the moving averages crossover, it is a sign of market reversal halting the existing trend. So at this point, we need to find a suitable ‘entry.’

Moving Average Crossover Strategy

Let us consider an example to explain the above-discussed strategy. Below, we have a daily chart of USD/CHF on which we have plotted the two moving averages (10-Period & 20-period). We can see the market being in a strong downtrend, and it is also confirmed by the two moving averages, where the ‘faster’ MA is below the ‘slower’ MA.

The next step is to find the overlap of ‘faster’ MA with the ‘slower’ MA from above, which is also known as the crossover of MAs. Once the crossover happens, there is a higher chance of the trend reversing. The below chart shows precisely how the crossover takes place, which means the trend can potentially reverse anytime now.

But, we shouldn’t be directly going long soon after the crossover. We need to confirm the trend reversal. A ‘higher low’ after the crossover validates the trend reversal, and this could be the perfect setup for going ‘long’ in this currency pair.

The below chart shows the ‘higher low,’ which is formed exactly after the crossover. Therefore, we now have confirmation from the market, so we can take some risk-free positions.

As we can see, in the below chart, the trade goes in our favor and hits our initial target. However, aggressive traders can aim for a higher ‘take-profit‘ as the new uptrend can reverse the entire downtrend, which is seen on the left-hand side. The reversal is also confirmed by moving averages where the ‘faster’ MA is above the ‘slower’ MA. The stop-loss for this trade is placed below the identified ‘higher low’ with a take-profit at a new high or significant S&R area.

Conclusion

The crossover strategy works beautifully in both volatile and trending markets, but they do not work that well in ranging markets. This is because the crossover takes place multiple times in the ranging market, and this leads to confusion about the market direction. To find high probability trades, one can also combine the strategy with other technical indicators to get additional confirmation of the trend reversal. In the next article, we shall see how moving averages can act as key support and resistance levels.

[wp_quiz id=”65842″]
Categories
Forex Course

74. Using Moving Averages To Identify The Trend

Introduction

In the previous lessons, we have understood the two types of Moving Averages and the difference between them. We have also seen which Moving Average should be used in different market conditions and the one that must be preferred most of the time. From this crouse lesson, let’s explore the real-time applications of Moving Averages and how we can find accurate trades using this indicator.

One of the simplest, yet important use of Moving Average is to determine the direction of the trend. This can be done by plotting the indicator on the chart and then deciding the position of candlesticks with respect to the line of Moving Average.

The ideal way of identifying a trend using MA is this – If the price action tends to stay above the moving average line, it usually signals an uptrend. Likewise, if the price action remains below the moving average line, it indicates a downtrend.

This approach of establishing the trend is too simplistic and also has a significant drawback. Let us understand that with the help of an example.

Below is the EUR/USD price chart, and we have added a 10-period MA line to it. According to the rules of MA, since the price is above the MA, we should be going ‘long’ in this currency pair.

Due to a news event, price drops suddenly and closes below the MA (in the below chart). So, this changes our plan, which means now we should be thinking of going ‘short’ in the currency pair. But before we do that, let us see what happens to the price in the next few candles.

The below image shows that the price fakes out and does not continue its downward trend. Hence, if we would have gone short, that would have resulted in the price hitting our stop-loss resulting in a loss. Let’s understand the problem with this setup.

The strategy mentioned above is right, but the problem is that we are using a single period MA line stand-alone and not combining it with any other indicator. The best way to use MA for determining a trend is by plotting an extra Moving Average line on the charts instead of just one. It will give us a clearer idea if the pair is trending up or down depending on the sequence of the MAs.

The best way is to check if the ‘faster’ moving average is above the ‘slower’ moving average for an uptrend, and vice versa for a downtrend. In the below chart, we can see that the ‘faster’ SMA is above the ‘slower’ SMA, and this shows the strength of the uptrend. Also, the fake-outs that happen because of news releases will also have less impact on the indication given by the Moving Averages. Combining this knowledge with trendlines can help us decide if we have to go ‘long’ or ‘short’ in the currency pair.

Conclusion

Moving Averages can be useful for establishing the direction of a trend, but it should never be used stand-alone. If not other indicators, additional moving averages itself can be combined with an existing moving average to decide the direction of the trend. In the next article, we will be discussing how we can enter a trade using moving averages and profit from this indicator.

[wp_quiz id=”65733″]
Categories
Forex Course

73. Simple vs. Exponential Moving Average

Introduction

After having a fair amount of discussion concerning Simple and Exponential Moving Averages, a question that may arise is, which one to use when? Whether SMA gives accurate trading signals, or is it the EMA that is more accurate and reliable than SMA? Let’s try answering these questions in this article.

We mentioned in the previous article that the EMA responds to price action more quickly. So, if we want to determine a short-term trend, EMA is the best way to go. It can undoubtedly help us in catching the early move of a trend and, in fact, profit from it by taking suitable positions in the market. The downside of the EMA is that it gives us the wrong signals during the consolidation periods of the market.

Since the EMA responds very quickly to price movements, we might think that the price has broken out of the range while it could just be a spike. The EMA proves to be too fast, and this is not desirable in such market scenarios.

In the below chart, we see that the market starts to ‘range’ after a retracement of the big downward move. Due to this, the EMA starts moving up, indicating a buy signal. Later, when the last but one candle of the range breaks out above the range, traders might think that the market has reversed, as this is also confirmed by the EMA. In the very next candle, the price makes a long wick at the top of the candle, and the EMA takes a sharp turn on the downside. This is one of the examples where the EMA can give us false signals.

The opposite is true with Simple Moving Average (SMA).

The SMA should be used when we want the moving average to be smooth and respond to price action slower than the real price movement. This characteristic is particularly useful when we are trading longer trading frames, such as daily or weekly. Since SMA responds slowly to price movement, it can possibly save us from such fake outs.

The below chart represents the weekly chart of a Forex currency pair where we can see the SMA moving up even after the occurrence of the spike. Hence the SMA gives an idea of the overall trend by filtering out spikes.

Conclusion

The SMA should be used when we want to protect ourselves from fake-outs and predict the price movement in the longer term. By using SMA, we might miss the opportunity of getting in on the trend early. On the other hand, the EMA is quick to predict the trend, and thus we can be a part of the initial move of the trend. But it carries the risk of getting preoccupied with fake-outs.

The answer to the above question (which one is better?) is that it really depends on the type of trader we are. Our risk appetite, trading time frame, and strategy will influence the type of moving average we should choose. In the upcoming lessons, we will learn how to use moving averages to determine the trend and take a trade. Stay Tuned.

[wp_quiz id=”65651″]
Categories
Forex Course

72. Understanding Exponential Moving Average

Introduction

In the previous course lesson, we understood the first type of Moving Average, which is SMA. We also saw how spikes could distort the SMA. The solution to this distortion is the Exponential Moving Average (EMA); so, let’s discuss this type of MA in our lesson today.

The EMA gives more weightage to the recent change in prices and does not give much importance to previous data. Learning how to calculate and plot EMA on the chart will provide us with a clear understanding of which Moving Average should be used at different times of the market.

We shall take an example to explain the definition of EMA. This example will also show how the EMA overcomes a significant limitation of the SMA. In the below figure, we have plotted a 10-period SMA on the daily chart of a currency pair. Here we have chosen the USD/CHF currency pair as an example.

Since we are calculating the 10 ‘period’ SMA, we need first to note down the closing prices of the last ten periods days. The prices are as follows:

0.97806,0.97986,0.97528,0.97336,0.97536,0.97461,0.97536,0.97829,0.98156,0.97636.

The next step is to add the above-given numbers together and then divide the result by 10. This equals to 9.76804 / 10 = 0.97680. Therefore, the SMA for the last 10 days is 0.97680. The end of the orange SMA line in the above chart points exactly to the price 0.97860.

Now let us consider a case where, on the sixth day, dollar drops drastically due to a news event that was bad for the US economy. If the sixth candle drops to a price around 0.97000 (closing of all other remaining the same) due to the news release, the new SMA will now be calculated as follows:

(0.97806 + 0.97986 + 0.97528 + 0.97336 + 0.97536 + 0.97000 + 0.97536 + 0.97829 + 
0.98156 + 0.97636) / 10 = 0.97654

The resultant SMA is lower than the SMA we had obtained in the previous step. This means when the price dropped on Day 6, it created a notion that the trend is going to reverse, but in reality, it was just a one-time event that was caused by news. We need a mechanism that will filter out these spikes so that we don’t get the wrong idea. This is where EMA comes to our help.

Taking the above example, EMA gives more stress on the recent price movements, such as the closing prices of the last four candles. This means the spike that happened on the sixth day will be of less value and wouldn’t have much effect on the moving average. It is always a smart and better idea to focus on what traders are doing recently rather than what happened long ago. Always remember that the past data is of less significance to us.

The below chart shows the difference between the two moving averages when they are plotted simultaneously.

Notice that the purple line (10-period EMA) appears to be closer to the candles than the orange line (10-period SMA). This means the EMA is more accurate in representing the recent price action, and now we know why. So, the bottom line is to pay attention to the last few candles rather than candles of last week or last month.

Conclusion

That’s about the two types moving averages with their own advantages. The EMA is a better option to use when you are swing trading as it gives precise analysis than SMA due to the reasons mentioned above. EMA, too cannot be used standalone and should be paired with a trading strategy. In the next article, we will discuss the pros and cons of using SMA and EMA.

[wp_quiz id=”65573″]
Categories
Forex Course

71. Basics Of Simple Moving Average

Introduction

In the previous lesson, we understood the definition of Moving Average, their importance, and the significance of ‘length’ in MAs. We also learned the correct way of choosing the ‘length’ while using Moving Averages. In the upcoming articles, we shall see and understand the different types of moving averages. Let’s start off by learning the first type – Simple Moving Average (SMA).

Simple Moving Average

The SMA is a very simple Moving Average that is calculated by the summation of the last ‘n’ period’s closing prices and then by ‘n.’

Let us understand the above formula with an example.

When we plot 10 ‘period’ SMA on a 1-hour chart, we add the closing prices of the last 10 hours, and then divide it by 10. Similarly to plot a 5 ‘period’ SMA on a 4-hour chart, we need to add the closing prices of the candles in the last 20 hours and then divide that number by 5. These calculations are coded and embedded in the form of indicators. These indicators will be available in almost all of the trading platforms. All we need to do is to pick the indicator from the tools bar and plot them on the charts by selecting the appropriate period and timeframe.

In the below chart, we have potted three different SMAs on the chart. This chart represents the 1-hour time frame of a currency pair. As we see, longer the period of SMA, more it lags behind the price. This explains the reason why the 60 ‘period’ SMA is farther away from the 30 ‘period’ SMA; because the 60-period SMA adds up the last 60 periods and divides it by 60 as mentioned above.

When the period of an SMA is large, it reacts slowly to the price movement. Essential, SMA shows the overall sentiment of the market at any given point in time. However, SMA should always be used to find the direction of the market in the near future but not take trades based on this information alone.

Instead of looking at the current price of the market, we need to have a broader view and predict the direction of the future price movement. Using SMA, we can say if the market is in an uptrend, downtrend, or if it is moving sideways.

One major drawback of SMAs is that they are vulnerable to spikes. So, during the calculations, the prices of the currency pair, which is of no significance (high or low of spike), will be added up and shown by the SMA line. The reason behind less significance to the prices of spikes is because they give false signals, and we might think a new trend is developing, but in reality, it is just a failure of the price.

The below figure shows how the SMA would be when there are too many spikes in the chart. As we can see, the 10 ‘period’ SMA is not uniform and is not able to show the direction of the market in the occurrence of spikes.

Conclusion

The SMA should be plotted to know the market trend when it is not clear. It can also be used to forecast the price movement in the near future. It is very important to combine this indicator with a trading strategy as it can never produce the results when used standalone. In the next lesson, we shall introduce another type of moving average and see how it can solve the issues we face with SMA.

[wp_quiz id=”65345″]
Categories
Forex Course

70 – Introduction To Moving Averages

Introduction

After understanding various applications of the Fibonacci indicator, it’s time to learn about the next best indicator in technical analysis – Moving Average. MA is one of the most popular indicators in the technical trading community. This indicator, just like the Fibonacci Indicator, has a lot of applications and is commonly used by traders for different reasons.

A moving average smoothens the price movements and its fluctuations by eliminating the ‘noise’ in the market. By doing this, MAs shows us the actual underlying trend. A moving average is computed by taking the average closing price of a currency for the last ‘X’ number of candles. There are many moving averages depending on the number of periods (candles) considered.

Below is how a 5-Period Moving Average looks on the price chart.

One of the primary applications of the Moving Average indicator is to predict future price movements with high accuracy. As we can see in the above chart, the slope of the line determines the potential direction of the market. In this case, it is a clear uptrend.

Every Moving Average has its own level of smoothness. This essentially means how quickly the MA line reacts to the change in price. To make a Moving Average smoother, we can easily do so by choosing the average closing prices of many candles. In simpler words, higher the number of periods chosen, smoother is the Moving Average.

Selecting the appropriate ‘Length’ (Period) of a Moving Average

The ‘length’ of the Moving Average affects how this indicator would look on the chart. When we choose an MA with a shorter length, only a few data points will be included in the calculation of that MA. This results in the line overlapping with almost every candlestick.

The below chart gives a clear idea of a small ‘length’ Moving Average.

The advantage of a smaller length moving average is that every price will have an influence on the line. However, when a moving average of small ‘length’ is chosen, it reduces the usefulness of it, and one might not get an insight into the overall trend.

The longer the length of the moving average, the more data points it ll have. This means every single price movement will not have a significant effect on the MA line. The below chart gives a clear idea of a long ‘length’ moving average.

On the flip side, if too many data points are included, large and vital price fluctuations will never be considered making the MA too smooth. Hence we won’t be able to detect any kind of trend.

Both situations of choosing ‘lengths’ can make it difficult for users to predict the direction of the market in the near future. For this reason, it is crucial to choose the optimal ‘length’ of the Moving Average, and that should be based on our trading time frame and not any random number.

Conclusion

Moving Averages generate important trading signals and especially when two MAs are paired with each other. They give both trend continuation and reversal signals with risk-free trade entries. A simple way of reading the MA line is as follows – A rising MA indicates that the underlying currency pair is in an uptrend. Likewise, a declining MA means that the currency pair is in a downtrend.

In the next article, we will be learning two critical types of moving averages – Simple Moving Average and Exponential Moving Average, along with their applications on the charts. Stay Tuned!

[wp_quiz id=”65304″]
Categories
Forex Course

69. Fibonacci Trading – Detailed Summary

Introduction

In the past eight lessons, we have learned many things about Fibonacci levels and ratios. We have understood various applications of these levels and identified many ways through which we can profit from these levels. In this article, we are going to summarize all the learnings related to Fibonacci. This article acts as a quick recap of what we have understood until now.

Taking a Trade Using Fibonacci Levels

Entering a trade using the Fibonacci levels is pretty straight forward. We have to wait for the price to retrace and reach the appropriate Fib levels. In an uptrend, these Fib levels are 50% and 61.8%. In a downtrend, these levels are 50% and 38.2%. Hence, both 61.8% & 38.2% are known as Golden Fib ratios. Once the price reaches these levels, you can enter a trade after getting a confirmation. A detailed explanation of this can be found in this article.

Pairing Fibonacci Levels With Other Technical Tools

Fibonacci levels can be used stand-alone to enter a trade. But it is always recommended to use other technical tools to be extra sure about your trades. This is because the Fib levels are not foolproof. That means the price may not respect these Fib levels 100% of the time. More about this can be understood here.

So, to be extra affirmative on what you are doing, make sure to combine the fib levels with other reliable indicators. Some of the tools we used to explain this concept are Support & Resistance levels, Trendlines, Candlestick Patterns, etc.

Using Fibonacci Levels For Risk Management

Not just for entires, Fibonacci levels can also be used for managing and exiting a trade. We know how important risk management is in trading. These levels will help us in managing risk and maximizing profit if used correctly. What we are trying to tell here is that Fib levels act as a perfect tool to place our Stop-Loss and Take-Proft orders accurately.

Fibonacci extensions must be used to decide the placement of various Take-Profit levels. To place accurate Stop-Loss, just used the Fib level, which is below the point of entry in an uptrend. Likewise, use the Fib level, which is above the point of entry in a downtrend. For a more detailed explanation, you can refer to the below articles.

Stop-Loss | Take-Profit

Downloading The Fibonacci Indicator

Fibonacci indicators these days are very well designed and readily available in the market for free. Almost all of the trading platforms are equipped with a Fibonacci indicator that can be accessed on to the charts with just a click. If you are using the TradingView platform, a comprehensive Fibonacci indicator is present in the left side panel. If you are a MetaTrader user, there are some default Fib indicators, but the best one is the Auto Fib, which can be downloaded here.

Other Applications Of Fibonacci Levels

The applications of the Fibonacci levels are not confined to the ones discussed above. There are many other places where these ratios & levels are used for various other reasons. For instance, to confirm almost all of the Harmonic patterns, we use Fibonacci levels. An example of one such article can be found here. In this example, we have confirmed the formation of the Butterfly pattern on the price charts by using Fibonacci levels alone. So every technical trader needs to know and learn how to use these levels to have the edge over financial markets.

That’s about Fibonacci levels. If you have any doubts, let us know in the comments below. In the upcoming course lessons, we will be discussing more technical tools like Moving Averages, Indicators, Oscillators, etc. Hence, stay tuned for more informative content.

Categories
Forex Course

68. Using Fibonacci Retracements To Place Appropriate Stop-Loss

Introduction

Until now, we have paired the Fibonacci levels with various technical tools to find appropriate trading opportunities. Some of them include support/resistance, trendlines, and even candlestick patterns. In the previous lesson, we also saw how to place appropriate ‘take-profit’ orders to maximize our profits. The uses of the Fibonacci levels do not end here. There is another incredible application of these levels, and that is to find the appropriate ‘stop-loss’ levels. ‘

As a trader, one should always use the ‘Stop-Loss’ orde as they are critical to avoid the risk of bearing huge losses. In some adverse situations, if this order is not used, it would result in a complete drain of trading capital where we can have the risk of losing everything in a single trade. Placing an appropriate stop-loss ensures that we do not expose ourselves to the unbearable risk.

However, placing the stop-loss order randomly might expose us to the risk of getting stopped out very early. So the proper placement of this order is crucial, and it can be hard for traders who aren’t experienced enough. So the Fibonacci tool can be a great help for us in determining accurate stop-loss levels.

Using Fibonacci Levels To Place Appropriate Stop-Loss Orders

In the below chart, we see a big initial move to the upside on which the Fibonacci levels are plotted using the Swing low and Swing high. Using the ‘Fibonacci strategy,’ we can notice a retracement that has reacted fairly well from the 61.8% Fib level, and now if the next candle is green, this could be a confirmation for us to go ‘long.’

We notice in the below chart that the next candle appears to be Green, and now with that confirmation, we can place our ‘buy’ trades with appropriate ‘stop-loss’ and ‘take profit.’ The traditional way of using a stop-loss order is to place it 50 pips away from the point of entry. Most of the novice traders use this method even today. This is said to be a layman’s approach with no suitable reasoning. When we use such methods, there is a high chance of we getting stopped out before the trade moves in our favor.

The below chart shows that how placing a 50 pip stop-loss can prove to be dangerous. We can see the stop-loss getting triggered by the immediate next candle after the entry was made.

Now let’s see how to place the stop-loss order using Fibonacci levels. The strategy is to place the stop-loss at the Fib level, which is below the Fib level from where the retracement reacts and gives a confirmation candle. Taking the above example, since the retracement touched the 61.8% Fib ratio and gave a confirmation candle, the stop-loss will be placed at the 78.6% Fib ratio. This seems to be very simple, yet most traders are not aware of this.

In the above chart, we can see how the price just misses our stop-loss placed at the 78.6 Fib level and later directly went to our take-profit. This shows the precision of stop-loss placement, which was established using the Fibonacci levels.

Conclusion

We must understand that stop-loss determination is a crucial step and has to be calculated mathematically using any reliable technical indicators. Indicators like Fibonacci have a mathematical approach in determining these levels. Make sure to use these levels before going to place your stop-loss levels next and let us know how they have worked for you. Cheers!

[wp_quiz id=”64961″]
Categories
Forex Course

66. Pairing The Fibonacci Levels With Trendlines

Introduction

In the previous articles, we learned how Fibonacci retracements give extra confirmations while trading the support & resistance levels. We also know that Fibonacci levels can be used as a confirmation tool to trade many candlestick patterns as well. Now we shall extend this discussion and understand how Fibonacci retracements can be traded using the trendlines.

Trendlines are a crucial part of technical analysis. They are primarily used to identify trends, be it up or down. Trendlines being such an important part of trading, when combined with the Fibonacci indicator, can produce trades that have the highest probability of winning. So let us see how this can be done.

Combining Fibonacci Levels & Trendlines

In the below chart, we have, firstly, identified an uptrend and drew a supporting trendline to it. The next step is to plot Fibonacci on the chart by identifying a swing low and a swing high. The marked area shows where all our trading is going to take place and the region in which we will find our swing low and swing high.

The traditional way of selecting a swing low is when the point intersects with the trendline, just as we have done in this case (below image). The swing high will be the point where the market halts and reverses for a while.

In the below chart, we have used the chosen a swing low and swing high to plot our Fibonacci indicator. In order to combine the Fibonacci with trendline, we must wait to see if the retracement from the swing high touches the 50% or 61.8% Fib level. After touching any of these levels, if the market gives a confirmation candle, it could be a perfect setup to go long. The retracement, in this case, touches the 50% level, which coincides exactly with the upward trendline. The next and final step is to look for a confirmation candle, if any.

We have gotten a confirmation sign from the market after the second green candle closes above the 23.6% Fib level (below image). Hence traders can now take risk-free positions on the ‘long’ side of the market with a stop-loss below the 61.8% Fib level and with an aggressive target above the recent high. This trade results in a risk to reward ratio of 1.5.

We should not forget that if the retracement does not take support at the 50% or 61.8% Fib level and goes further down, breaking all the levels, it could be a potential reversal sign. Thus the retracement that is coinciding with the trendline and reacting from 50% or 61.8% Fib level is the thumb of the rule of this strategy.

The above is a more widened image of the chart shows that the market continues to trend upwards, crossing our ‘take-profit‘ area. To take advantage of the market’s trending nature, we can place a trailing stop-loss order to maximize our profits.

Conclusion

When trends start to develop in the market, one should start looking for ways to go ‘long’ or ‘short’ by using necessary technical indicators that give a better chance of a profitable trade. The Fibonacci indicator is one such powerful tool to help traders find potential entry points. We hope you understood this concept clearly. Let us know if you have any questions in the comments below. Do not forget to take the quiz before you go. Cheers!

[wp_quiz id=”64779″]
Categories
Forex Course

64. Trading Support & Resistance Levels Using Fibonacci Levels

Introduction

In the previous lessons, we understood how to use the Fibonacci tool to trade the pullback of a trend. We have also learnt how these Fib levels are not foolproof. Now, in this lesson, let’s extend this discussion to see how the Fibonacci tool can be used in conjunction with Support and Resistance – arguably the most critical levels on a price chart.

Support is the area where the price rejects to go down and bounce back further. This area acts as a floor where the price gets stopped. Resistance is the opposite of Support. At this level, the price finds it very hard to go up as it acts as a ceiling. The general idea is to buy at the Support and sell at Resistance. But blindly buying and selling at these levels carry huge risk as there is no guarantee that these levels will work each time.

So let’s use Fibonacci levels to determine the working of these S&R levels. Basically, we are combining both Support Resistance and Fib levels to increase the accuracy of trading signals generated. Let’s get started.

In the below chart, we have identified a strong resistance area, and now we must wait to see if it creates an area of Support after breaching the Resistance. It is always advisable to buy at ‘resistance turned support.’ Also, if the price has broken a strong resistance with multiple touches, there is a higher chance of it turning into Support. At the marked region below, we can see the price breaking the strong resistance area.

In the marked regions below, we can see the price retracing after breaking the Resistance. So in order to combine this support resistance level with Fib levels, we must identify the swing low and a swing high. As we can see below, we have also plotted the Fibonacci levels on the chart using a Fib indicator.

Ideally, if we get a retracement at the 61.8% Fib level and a confirmation candle, we can confidently enter for a buy. If the market does not react at any of the Fib levels, this could be a sign that the Support is no longer strong, and it can be broken.

As per the theory of Support and Resistance, the market must react at the previous Resistance and bounce off. From the below chart, it is clear that the retracement has reached our S/R line, which is exactly coinciding with the 61.8 Fib level. Now it is a clear indication for us to go long once we see a confirmation candle.

In the below chart, we can see that the price has exactly bounced off from the 61.8% Fib level and printed a bullish candle giving us a confirmation sign. Right after the confirmation candle, we can place our buy trade with a stop-loss at 78.6% Fib level and take-profit anywhere near the high.

Further, in the below chart, we can see the market making higher highs breaking the previous resistance levels. From this trade, we learn that, when Fibonacci is used near S/R as a confirmation tool, it increases the odds of that level performing. The price will surely take Support at the Fib levels and continue its trend.

One can notice that the ‘buy’ happens precisely at the 61.8% Fib level near Resistance turned support line. The market continues to take Support at this level until, eventually, it breakouts on the upside. This shows the power of the Fibonacci indicator when combined with S&R levels.

There are many other credible indicators that are reliable and can be combined with S&R levels. But Fibonacci is one of the most used ones by the traders across the world.

[wp_quiz id=”64461″]
Categories
Forex Course

62. Using Fibonacci Retracements To Enter A Trade

Introduction

In the previous article, we understood the definition of Fibonacci and how the Fibonacci levels are derived. Now we shall see how to use these levels to enter a trade and formulate a trading strategy around it.

The strategy we are going to discuss can be used not just in the Forex market. It can also be used in different other markets such as Stocks, Commodities, Cryptocurrencies, and ETFs. This is essentially a trend trading strategy that takes advantage of a pullback in a trend. The Fibonacci levels later prove to be critical areas of support and resistance that most traders keep a close watch on. Let’s get started with the strategy.

Step 1: Identify an initial big move. We are going to trade its retracement.

A trend helps the traders to identify the direction of the market and to determine where the market will head further. A big price movement indicates that the market has reversed from its original direction and will possibly continue further in that direction.

In this example, we have identified a big move on the upside, and we shall see how to trade its retracement to join the trend. Let’s use Fibonacci levels to enter the trend at the right time.


Step 2: Use the Fibonacci tool and plot the levels on the chart

After placing Fibonacci levels on the chart, we need to wait for a retracement and see where it touches the Fib levels. The most desirable condition is when the price bounces off after touching the 50% or 61.8% fib ratio. These ratios are also known as Golden Fib ratios. In the below chart, we can see the formation of a bullish candle as soon as the Red candle reaching the 61.8% level.

In an uptrend, always make sure to plot the Fib levels from Swing Low to Swing High. Likewise, in a downtrend plot, the Fib levels on the chart from Swing High to Swing Low.

Step 3: Enter only after confirmation 

Typically, traders are taught to place their buy orders as soon as the price reaches the 61.8% level. Do not do that. Only place the trades after the appearance of at least a couple of bullish candles. In the below chart, the formation of a green candle at 61.8% gives us an additional confirmation that the trend is going to continue after the retracement. Traders can also confirm this buy signal by using reliable technical indicators. This is how the chart would look at the time of entering the trade.

Step 4: Take-Profit and Stop-Loss placement

It is important to place accurate Stop-Loss and Take-Profit orders to mitigate the risk and maximize profits. In this strategy, stop-loss is placed just below the 61.8% Fib level. If the price breaks this Fib level, the uptrend gets invalidated, and we can expect the beginning of a downtrend.

We can place the take-profit order at the nearest’ high’ of the uptrend and trail the stop-loss until it is triggered. The minimum risk to reward of this trade is 1:1, which is not bad. But since it is a continuation of the trend, we can wait until it makes a new high and take profits there. This will result in a 1:2 risk to reward trade.

Below is how the setup of the final trade looks like.

We can clearly see the price respecting the Fibonacci levels, and the trade here went exactly the way we predicted.

Conclusion

Fibonacci retracements are a part of the trend trading strategy that most traders observe during an uptrend. Traders try to make low-risk entries in the direction of the trend using these Fibonacci levels. It is believed that the price is highly likely to bounce from the Fibonacci levels back in the direction of the initial trend. These Fib levels can also be used on multiple time frames. When this tool is combined with other technical indicators, we can predict the outcome of the trade with a greater degree of accuracy.

[wp_quiz id=”63028″]
Categories
Forex Course

60. Introduction To Fibonacci Trading

Introduction

We have completed learning most of the basics related to candlesticks and its patters in the previous lessons. In the upcoming articles, let’s upgrade our technical trading skills by learning Fibonacci Trading. This field of study deals with trading the price charts using Fibonacci levels and ratios. In this article, we will briefly talk about what this Fibonacci trading is all about.

Fibonacci levels and ratios were devised by a famous Italian mathematician, ‘Leonardo Fibonacci.’ This Italian number theorist introduced various mathematical concepts that we use in the modern world, such as square roots, math word problems, and number sequencing.

Leonardo Pisano Fibonacci 

Picture Source – Thoughtco

He found out a series of numbers that created ratios. The ratios described the natural proportion of things in the universe. The ratios are derived from the following number series: 0, 1, 1, 2, 3, 5, 8, 13, 21, 34, 55, 89, 144. This number series always starts at 0 and then adding 0+1 to get 1, which is the third number. Then, adding, the second and third numbers to get 2, which is the fourth number and so on.

The Fibonacci ratios are generated by dividing a Fibonacci number to its succeeding Fibonacci number. For instance, both 34 & 55 are Fibonacci numbers, and when we divide 34 with 55, we get 0.618, which is a Fibonacci Ratio. We also call them as Fibonacci Retracements. If we calculate the ratios between two alternative numbers, we get Fibonacci Extensions. For example, when we divide 34 by 89, it will be equal to 0.382, which is a Fibonacci Extension. Below, we have mentioned a few Fibonacci Retracement and Extention values for your reference.

Fibonacci Retracements - 0.236, 0.382, 0.500, 0.618, 0.764 etc.

Fibonacci Extensions - 0, 0.382, 0.618, 1.000, 1.382, 1.618 etc.

Many theories say that once the market makes a big move in one direction, the price will retrace or return partly to the previous Fibonacci retracement levels before resuming in the original direction. Hence traders use Fibonacci retracement points as potential support and resistance levels.

Many traders watch for these levels and place buy and sell orders at these prices to enter or place stops. Traders also use Fibonacci extension levels as profit-taking zones. In order to apply Fibonacci levels on the charts, we need to identify Swing highs and Swing low points, which will be discussed in the upcoming articles.

Fibonacci trading is one of the major branches of Technical Analysis. So it becomes compulsory for every trader to learn what this is all about. In the 21st century, almost all of the brokers provide charting software where we can find Fibonacci tools like indicators and Fibonacci calculators, which makes this aspect of trading very simple and easy.

[wp_quiz id=”62566″]
Categories
Forex Course

55. Learning The Dual Candlestick Patterns – Part 2 (Reversal)

Introduction

In the previous lesson, we learned Continuous Dual Candlestick Patterns by taking examples of the two most traded patterns. In this lesson, we will see how to generate trading signals using Dual Candlestick reversal patterns. We will mainly look at the two widely used dual candlestick patterns – Engulfing and Dark Cloud Cover patterns. As the names suggest, both of these patterns consist of two candlesticks, and when we see them on a price chart, we should be anticipating a trend reversal shortly.

Engulfing Candlestick Pattern 

Engulfing is a two-candle trend reversal pattern. It got its name from the fact that the second candle completely engulfs the first candle, irrespective of its size. There are both Bullish Engulfing and Bearish Engulfing patterns. A Bullish Engulfing can be identified when a small (preferably) red candle of the downtrend is followed by a large green candle that overpowers the previous candle entirely. Vice-versa for a Bearish Engulfing Pattern.

Below is the picture of how the Bullish Engulfing pattern looks like on a chart.

Criteria for the pattern

  • The body of the second candle should be at least twice the size of the first candle.
  • Even though it is a dual-candlestick pattern, Bullish Engulfing gives the best reversal signals when the bullish candle engulfs the bodies of four or more previous candlesticks.
  • It is better if the Engulfing candle does not have any upper wicks. This shows the buying interest among investors and increases the likelihood of Green candles in the following days.

The Bullish Engulfing Pattern is a powerful reversal pattern that has the potential to reverse the current downtrend and turn it into an uptrend. Hence, traders always look out for this pattern and take big positions in the market by adding to their ‘long’ positions.

Dark Cloud Cover Candlestick pattern

The Dark Cloud Cover pattern is a bearish reversal candlestick pattern that is formed from two candles. In this pattern, the Red candle opens above the close of the prior candle and then closes below the midpoint of the previous green candle.

This pattern implies that buyers are trying to push the price higher, but sellers finally take over and push the price sharply down. A shift in momentum causes the trend to reverse, and this marks the beginning of a new downtrend.

Below is an image of the Dark Cloud Cover pattern that makes a reversal of the trend.

Criteria for the pattern

  1. The first requirement is to have an uptrend that is clearly visible on any chart.
  2. The second candle should be a gap up that, by the end of the day, comes down and closes as a bearish candle.
  3. The bearish candle needs to close below the midpoint of the previous bullish candle.

Traders usually wait for confirmation before taking aggressive short positions in the underlying Forex pair. The confirmation is just another Red candle following the first Red candle. On the close of the third candle, traders sell the currency and exit on the following days as the price continues to decline. They place stop-loss just above the high of the bearish candle.

Conclusion

The Engulfing pattern is a bullish reversal pattern, which is one of the easiest patterns to identify and trade. Talking about the bearish reversal Dark Cloud Cover pattern, it has the potential to identify the lower lows and lower highs, which is very rewarding on the downside. This was about the Dual Candlestick reversal patterns. Please explore more patterns of this kind to increase your exposure. In the next lesson, we will talk about the triple candlestick patterns and their types. Cheers!

[wp_quiz id=”60890″]
Categories
Forex Course Forex Daily Topic

Introduction To Forex Course 3.0

Hola Readers! We have successfully completed the first two courses and received an amazing response for both of them. We can’t thank you enough for that. Also, we hope these first two courses have helped you in understanding the most fundamentals basics of the Forex market. It is very important to know these basics in order to succeed in the Forex market. We have made a quick navigation guide for both the courses just for you to access the articles easily.

You can find them here the guides for – Course 1.0 | Course 2.0

With all these basics in mind, we will be moving on to our new course, which is a bit different than the other two courses. We are saying this because the first two courses are more inclined towards information and theory. But Course 3.0 is all about Technical Analysis. Hence most part of it deals with the practical applications that are involved rather than just theory. The quizzes and everything remain as is, but a lot more effort from your side is required to ace the knowledge that we are going to provide in the lessons.

Having said that, Technical Analysis has the most logical approach to the prediction of price movement than the Fundamental & Sentimental Analysis. There are a lot of components within the technical analysis, and some of them include Price-Action trading, technical tools such as Indicators & Oscillators, Volume based trading, etc. In this course, we will be going through all of them in detail.

Topics that will be covered in this course 

Everything About Candlesticks

Support & Resistance Levels

Moving Averages

Popular Indicators & Oscillators

Fibonacci Trading

In each of the topics, there will be about 7 – 10 article lessons where complete information is provided related to the topics. Quizzes will be available for each of the articles like before.

We are proud to present this course to you as it is prepared by some of the top technical traders with great expertise in this field. Aren’t you excited? We wish you all the best in studying and learning the concepts with at most interest. Cheers!

Categories
Forex Course Guides

Forex Course 2.0 – Complete Guide

Hello there,

We hope you guys are following the course well. We have done with Course 2.0, and we quickly want to sum up the concepts we have discussed in this course. Also, this article will act as a guide for you in finding any particular articles or for a quick overall revision. Basically, this is a quick navigation guide of Forex Course 2.0.

We have started this course by understanding one of the most important parts of the Forex Industry – Brokers. We also learned the different types of brokers, tips to pick the right broker, and whom to stay away from. We have also understood the different types of analysis that are used by retail traders like us to forecast the price of a currency in the Forex Market. Below is the link for each of the lessons we have published.

Brief History and Introduction to The Forex Brokers – Link

Types 0f Brokers in the Foreign Exchange Market – Link 

Two Types of ‘No Dealing Desk’ Brokers – Link

Understanding the Concept of Spreads in Forex – Link

Two Different Types Of Spreads In The Forex Market – Link

Picking A Genuine Forex Broker 101 – Link

How to stay away from the Forex Bucket Shops – Link

Steps Involved In Opening A Forex Trading Account – Link

Analyzing The Forex Market – Fundamental Analysis – Link

Analyzing the Forex Market – Technical Analysis – Link

Analyzing the Forex Market – Sentimental Analysis – Link

Which is the best way to analyze the market? – Link

So with that, we have ended our course 2.0. The upcoming course 3.0 is the most valuable course we will be providing at Forex Academy. The entire course is going to deal with the Technical Analysis right from the fundamentals. This course is designed by the top price action traders in the industry, and we are super excited to start rolling out this course for our readers. Are you excited too? Stay tuned!

We hope you find this comprehensive guide useful. Let us know if you have any questions regarding Course 2.0 in the comments below. Cheers!

Categories
Forex Course

47. Which is the best way to analyze the market?

Introduction

Now with the knowledge of three type analysis, let us determine the best type of analysis suitable for you.

Before that, let’s brush up through the previous lessons.

✨ Fundamental Analysis – This is a technique to analyze the market by considering the factors which affect the supply and demand of security (currency). Some of the fundamental indicators include interest rates, inflation, GDP, money supply, manufacturing PMI, etc.

✨ Technical Analysis – It is the analysis of the market by understanding the historical price movements of the currency. In other words, it is the study of price movements using technical tools like candlestick patterns and indicators.

✨ Sentimental Analysis – This type of analysis involves understanding the real essence of trading. Here, we get into the shoes of the bug players and determine if they’re buying or selling.

Out of these three, which do you think can help you find success in trading? Well, as a matter of fact, once can succeed in trading only if they have the knowledge of all these three types of analysis. Let us understand with an example of the hurdles that can come your way if you focus only on one type of analysis.

Let’s say a trader named Tim trade only on technical analysis, and he found a good buying opportunity on EUR/USD. But, after he hits the buy, he sees the market falling straight down 100 pips against him due to some news he wasn’t unaware of. This situation brings in emotions in him by which he ends up closing the trade. However, later in the day, he observes that the market ends up going in the direction he predicted.

Here, though his analysis was right, the obstacles like news and emotions took over the technical analysis and put him in a loss. Hence, from this, we can conclude that technical analysis, fundamental analysis, and sentimental analysis are interdependent on each other.

How to structure your analysis?

Above, we have discussed how crucial and dependent all three types of analysis are. However, there are traders in the industry who have expertise only in a kind of analysis but still manage to grow their accounts significantly. Below are some of the tips on how one must structure their analysis, considering they specialize in technical analysis.

  • Before you begin to analyze the market, determine if there is any upcoming news on the currency, you’re looking to trade. And it is recommended to stay away from the currency pairs which have fundamental news coming in.
  • Once you determine the currency pair you’re going to trade, you can begin your technical analysis on that pair.
  • And most importantly, before you place the trade, you must have a complete plan on all the situations that can possibly occur when you’re in the trade, including position sizing, stop-loss levels, and profit-taking levels.  Because, once you enter the trade, emotions take over technical analysis which can make you take incorrect trading decisions.

Therefore, following these three simple steps can drastically bring a change in the way you analyze the markets. Cheers.

[wp_quiz id=”57535″]
Categories
Forex Course

46. Analyzing the Forex Market: Sentimental Analysis

Introduction

Have you come across the saying that 95% of the traders lose money in Forex, and only a handful of 5% succeed? As a matter of fact, this statement is entirely true. Though trading in the Forex market is no different from doing business in the real market, most of the Forex traders find it challenging to succeed in trading. This is because, in the real world business, there is hardly any relation between business and emotions, whereas, the Forex market is closely related to human psychology.

Many traders trade based only on fundamental analysis or technical analysis and ignore the existence of the sentiment involved in trading. This is the reason we have the concept of 95% and 5%.

Why is there sentiment entailed in trading?

To answer this particular question, we’ll have to understand the core basics of trading.

Firstly, what is trading? Trading, according to the textbooks, is the process of buying and selling of products. Or in simple terms, it is the process where a seller sells his products to a buyer, or a buyer buys products from a seller.

Now, the point one must note here is that to buy or sell a product, both parties (buyer and seller) are obligatory. Without a buyer, the existence of a seller is useless, and without a seller, the presence of a buyer is pointless.

And this above concept is the answer to the above question. Let us understand how.

There is an end number of traders trading the Forex market. The logic for buying and selling is the same as the real-world market. That is, a trade cannot be completed without the presence of both parties. For example, if you want to buy a currency pair, then you mandatorily need a seller to sell it to you. And if there are no sellers in the market to sell it at your desired price, then your buy order will remain pending (incomplete).

Broadly speaking, traders can be segregated into two types. The first set of traders includes large banks, hedge funds, mutual funds, and big-time investors who move the market. And the second set comprises small retail traders who do not have the capability (enough capital) to drive the market.

How do big players always win?

Big players are the ones who always win in the market. And they make this possible by bringing in emotions in trading. Let us understand this with an example.

Let’s say a currency pair is in an uptrend from a month. At this point in time, what do you think the whole world is thinking? As obvious as it gets, most retail traders are looking at it as a buy. Now, since everyone (big players and retail traders) are looking to buy, there is no seller to sell it to them. This situation, in turn, creates loads of pending orders in the market. So, the masterminds (big players) start to become the sellers in the market to the retail buyers. And this continuous selling by the big players causes the market to drop pretty drastically.

Seeing this drastic fall in the market, all retail traders who were buying get stopped out, and the rest begin to look it as a sell. And once the retail traders start to sell, the big players buy it from these sellers (retail traders). Hence, from this, the market again starts to head north. This is how big players bring in emotion in the minds of the public, manipulate them in the market.

Finally, we can conclude by saying psychology plays a major rule when it comes to trading in the Forex market. And the sentimental analysis is all about learning more about psychological trading. So in our further lessons, we will be discussing a lot more on these topics.

[wp_quiz id=”57167″]
Categories
Forex Course

45. Analyzing the Forex Market – Technical Analysis

A way to analyze the markets other than fundamental analysis is technical analysis. In this lesson, we shall exactly understand what technical analysis is, and also the different techniques to analyze the market using technical analysis.

What Is Technical Analysis?

In simple terms, technical analysis can be defined as the study of price movements.

Unlike fundamental analysis, where people study the factors which affect the supply and demand of the market, technical analysis involves the study of the historical price movements and the present market condition.

Why should Technical Analysis be used?

Let us answer this question by bringing up an analogy.

The first thing one must understand about the market is that the forex market business is no different from a real-life business.

For instance, let’s say there’s a car dealer and they have been selling one particular car for six months by varying the prices every month. And an illustration of the sales report is given below.

Now, from the above table, can you predict what could be priced in the near future? If yes, then you can consider yourself as a technical analyst, as this is what technical analysts do.

Consider the above table. We can see that initially, the car was priced at $20,000, and 9,000 units of the car were sold. Next month, the owner price reduced by $1,000, and the sales increased by 1,000 units. Seeing this demand in the car, the owner increases the price to $25,000. But, this time the sales drop down to 1,000 units. So, the car owner reduces the price back to $19,000. And he observes that the sales increase from 1,000 to 10,000. Later, he again raises the price to $26,000.

Now, by analyzing the past price movements, we can predict with a high probability that the price will reduce yet again, as the previous time the price came to $25,000, the price dropped drastically. Thus, looking at the price of the car in June, we can see that the price did fall to $15,000.

Therefore, the above example, in a nutshell, is referred to as Technical Analysis.

Switching back to the Forex market, the analysis is done similarly. The only difference being the Forex market involves the trading of currency pairs, and the real market consists of the buying and selling of products.

Hence, from this, we can conclude that a market moves as per the historical price movements. The above example is just to give you a gist of how technical analysis work. There are many more complex ways to accurately predict the market using technical analysis. Price Action traders do their technical analysis using different types of charts (like candlesticks, bars, lines, area, etc.), timeframes, and indicators.

Hence, this brings us to the end of this lesson. In the lessons coming forward, we shall be discussing tons of stuff related to technical analysis. So, stay tuned.

[wp_quiz id=”56618″]
Categories
Forex Course

42. How to stay away from the Forex Bucket Shops

Introduction

With a significant increase in the demand for retail traders to trade in the Forex market, tons of forex brokers have established their businesses to profit from their clients. This might seem like an advantage for traders as they have a variety of options to choose a broker. However, this is not the case.

In the world of forex brokers, there exist both genuine and fraudulent brokers. And these fraudulent brokers are referred to as bucket shops. These brokers have a frequent practice of misquoting and requoting and slippage, which favors only them.

Back in the day, as there was no internet, it was not possible for traders to know the actual price of the currency or security every moment. So, the clients used to place trades via phone. But, there were brokers who used to put the clients’ phone orders on slips and drop them into a bucket instead of officially executing them. Later, these orders were unofficially executed against the bucket shop operates, known as bucketeers.

These bucketeers usually did not disclose the real price of the currency, which was being traded in the market. They used to tell their clients that the price didn’t move in their favor, even if it actually did. But with the introduction of the internet and the improvement in the regulation of forex brokers, these scams have considerably reduced.

However, unfortunately, there still are these brokers out in the market. So, we’re here help to protect you from these scams. Things one must always keep a track of when trading with a broker are as follows:

✨ Constantly compare the price movement

Many traders trade based only on the prices mentioned by the brokers on their trading platform, which is quite dangerous. Currently, on the internet, there are many web portals that show the price feeds every tick. Hence, one must always keep track of the price feeds from several third-parties to confirm if the prices shown by the broker are real or not.

✨ Have a Trading Journal

Developing the habit of keeping a detailed journal of all the trades and transactions is extremely vital for a professional trader. Because if a trader feels that the broker has cheated them, they will need evidence to prove the genuineness in the filed case. And the simplest way to keep track of it is by taking a screenshot of every transaction they make. This can act as an excellent backup when they are cheated by a broker.

✨ Filing a legal action

Sometimes the disputes between the clients and brokers are not settled completely. So, this is when a trader must take legal action. If any conflict is unsettled, Forex traders can approach either the Commodity Futures Trading Commission (CFTC) or the National Futures Associations (NFA).

The CFTC has something called Reparation programs that provide an unbiased forum to handle and resolve customer’s complaints. You can click here to access the program.

Hence, by considering all these factors, one can stay away from being trapped by the fraudulent brokers in the industry.

[wp_quiz id=”56298″]
Categories
Forex Course

40. Two Different Types Of Spreads In The Forex Market

In the last lesson, we clearly talked about what Spread in forex is and also how it is calculated. In this lesson, we will dig up a little more on the concept of spreads and understand its types.

In Forex, the spread is of two types:

  • Fixed spread
  • Variable/Floating spread

Fixed spreads are typically offered by Dealing Desk brokers, whereas, Variable spreads are offered by No Dealing Desk brokers. Let’s understand both in detail.

Fixed Spreads in Forex

As the name pretty much suggests, Fixed spreads remain the same regardless of the condition of the market. Be it a volatile or non-volatile market, the spread always stays the same.

As mentioned, these spreads are usually offered by Market Makers type of brokers.

Dealing Desk brokers buy a large number of positions from their liquidity providers and then offer these positions to traders (clients). Since the brokers will own these positions, they can control and display the prices to their clients with a fixed spread.

Why choose Fixed Spreads?

  • Fixed spreads do not require a large capital to trade. So, fixed spread brokers offer an alternative for traders who don’t have much cash to begin with.
  • “Fixed” spread itself is an advantage. Fixed spreads make it easy to calculate the transaction costs. And since spreads always remain constant, you will exactly know how much amount you will be paying to the broker for each trade.

Variable Spreads in Forex

Again, as the name suggests, Variable spreads are the spreads that are constantly changing, just like the exchange rates. That is, as and when the bid and ask price changes, the difference between the two changes. This, therefore, changes the spread as well.

This type of spread is offered by Non-Dealing Desk brokers. These brokers obtain the prices from multiple liquidity providers and directly pass on these prices to the traders without the involvement of a dealing desk. This means that NDD brokers do not have control over the spreads. It all depends on the market’s supply and demand and its overall volatility.

As a typical tendency of the market, when there is an economic event, the spreads widen. And same is the case when the market volatility drops.

Advantages of Variable spreads

  • Variable spreads diminish the experience of requotes, where requote is the difference in the price you hit the buy/sell and the price when your order reached the broker. However, this doesn’t mean that you won’t experience slippage.
  • Variable spreads provide transparent pricing, as you will be getting the prices from multiple liquidity providers, which in turn means better prices due to high competition.

If you’re wondering which type of spread you must choose? Well, it completely depends on the type of trader you are. For example, traders with small accounts who trade occasionally can go with a broker that offers fixed spread, whereas, a trader who wants fast execution and also wants to avoid requotes, can look for brokers offering variable spreads.

[wp_quiz id=”54986″]
Categories
Forex Course

38. Two Types of ‘No Dealing Desk’ Brokers

Introduction

In the previous lesson, we have discussed the two major classifications of forex brokers – Dealing Desk and No Dealing Desk. In this lesson, we will dig a little deeper and understand the types of No Dealing Desk brokers.

No Dealing Desk brokers can be classified into two types:

  • ECN brokers
  • STP brokers

What is an ECN broker?

An ECN broker is a forex broker expert that uses electronic communication networks to provide clients with direct access to other participants in the exchange market. Also, since these brokers consolidate prices from several other market participants, they usually offer their clients tighter bid/ask spreads. However, this tight spread is compensated by a small fixed commission charged by the brokers.

ECN brokers are NDD brokers, who do not pass the clients’ orders to market movers. Instead, they find participants in a trade electronically and then pass the orders to liquidity providers.

Understanding ECNs

As the name suggests, ECNs provide a network for buyers and sellers to participate and execute trades in the market electronically. These brokers make this possible by providing access to information on the orders being entered by the participants, and by facilitating the execution of these orders.

This network is designed to match the Buy and Sell orders currently traded in the exchange. And when the price requested by the client is not available, it provides the highest bid and lowest ask in the market.

What is an STP broker?

STP brokers, or Straight Through Processing brokers, are the ones who pass the clients’ orders directly to their liquidity providers. As discussed, the liquidity providers include banks, hedge funds, investment banks, etc. In this system, no intermediary or such will be involved in the execution of the order. Hence, the unavailability of the Dealing Desk makes the broker’s electronic trading platform Straight Through Processing (STP).

Moreover, with the absence of an intermediary (Dealing Desk), the brokers will be able to process orders of the clients much faster and without any delays.

Looking it the other way, STP brokers benefit from having many liquidity providers, because an increase in the number of liquidity providers increases the chances of the orders being filled for their clients.

Additionally, each time a client places a trade through an STP platform, the STP broker will make a profit. As STP brokers do not take the opposite of the clients’ trade, they add a minimal extra spread when quoting a bid/ask rate. And this small markup to the spread is passed to the clients via its electronic platform.

This completes the lesson on different types of No Dealing Desk brokers. Take the quiz below to know if you have got the concepts right.

[wp_quiz id=”54414″]
Categories
Forex Course

37. Types Of Brokers in the Foreign Exchange Market

Introduction

If you can recall, we have discussed a bit about Forex brokers in course 1.0. Here is the link for that article. There we have discussed the brief history and introduction to brokers. We recommend you to have a quick look at that article to get a better understanding of Forex brokers. In this article, let’s discuss the two different types of brokers.

Forex brokers can be mainly be classified into two types:

  • Dealing Desks (DD)
  • No Dealing Desks (NDD)

What is a Dealing Desk broker?

Dealing Desk brokers are the Forex brokers who make money through spreads. Also, they are the ones who provide liquidity to the clients. Hence, these brokers are also referred to as Market Makers. The specialty of these brokers is that they can literally make the market for their clients. This is because they usually take the other side of the clients’ trade. So does this mean that brokers take every price the client requests? Well, that’s not the case. They set both sell or buy quote, which is offered to the clients.

While trading with Dealing Desk brokers, the clients cannot see the real interbank market rates. However, as there is always stiff competition between brokers, the rates provided by the Dealing Desk brokers are close or sometimes the same as the interbank rates. Hence, the exchange rates are not a matter of concern.

Working of Dealing Desk brokers

Comprehending the working of Dealing Desk brokers is quite simple. Let’s say that a trader wants to buy one standard lot (100,000 units) of USD/CAD with a Dealing Desk broker. Once the request for a buy is sent to the brokers, the following are the scenarios that take place.

Firstly, to fill the order, the broker will try to match the order with their other clients who are willing to sell at that price. If they do not find any sell order, they route the trade to its liquidity providers, a sizeable entity who is always on the go to buy or sell a financial asset.

However, still, if there are no matching orders, they end up taking the opposite of the trader’s trade.

What is a No Dealing Desk broker?

As the name pretty much suggests, these are the set of brokers who do pass their clients’ orders through a Dealing Desk. Meaning, they do not take the opposite trade of their clients. To put it in simple words, No Dealing Desk brokers act like bridge builders. They simply link two different trading parties.

Since these brokers connect the clients directly through the Interbank Market (Banks, Hedge Funds, Mutual Funds, etc.) they usually charge some commission from the clients, or they slightly increase the spreads.

This completes the lesson on types of brokers. And in the next lesson, we shall do a comparison between these two brokers to give you an idea of which broker one must choose. Don’t forget to take the quiz below before you go.

[wp_quiz id=”53810″]
Categories
Forex Course Forex Course Guides

Forex Course 1.0 – Complete Guide

Hello Readers!

If you have been following us lately, you must have known that providing quality trading education is the number one motto for us at Forex Academy. With this being our principal mission, we have rolled out an in-house course that covers every single thing about Forex Trading. We want to primarily thank you all for the amazing response we have got on the first part of that course. This will only motivate us to provide more quality content.

This piece of article will help you in finding any particular concepts or for a quick overall revision. Basically this is a quick navigation guide of Forex Course 1.0.

  1. Introduction To The Forex Market – Link
  2. Currency Pairs – Link
  3. Mechanism Of Buying And Selling – Link
  4. Liquidity of The Forex Market – Link
  5. Different Ways Of Trading – Link
  6. How Does Profit & Loss Take Place – Link
  7. Right Currency Pair To Buy & Sell – Link
  8. The Concept Of ‘Pip’ – Link
  9. Lots & Its Different Types – Link
  10. Various Order Types – Link
  11. First Step In Your Trading Journey – Link
  12. General Myths About Forex – Link
  13. Different Trading Sessions – Link
  14. Tokyo Session – Link
  15. London Session – Link
  16. New York Session – Link
  17. Best Time To Trade The Forex Market – Link
  18. Forex market’s hierarchy – Link
  19. Forex Market Movers – Link
  20. Perks Of Trading Forex – Link
  21. Stock Market & The Forex Market – Link
  22. Margin Trading Fundamentals – Link
  23. Balance & Rollover – Link
  24. Unrealized P/L and Realized P/L – Link
  25. Margin Requirement & Required Margin – Link
  26. Used Margin and Equity – Link
  27. Free Margin – Link
  28. Margin Level – Link
  29. Margin Call & Margin Call Level – Link
  30. Stop Out Level In Margin Trading – Link
  31. Refresher – Margin Trading – Link
  32. Leverage & Margin – Link

We hope you find this comprehensive guide useful. Let us know if you have any questions regarding Course 1.0 in the comments below. Cheers!

Categories
Forex Course

33. Understanding Leverage & Its Relationship With Margin

Leverage

There is a close relationship between the Leverage and Margin. That is, both go hand in hand. In simple terms, the margin is used to create leverage. The meaning of leverage is similar to the margin. It is a facility provided by brokers, which allows a trader to take larger positions by investing a lesser amount than required.

Margin is expressed in percentage, while Leverage is expressed as a ratio

Leverage is the ratio between the capital a trader has in their account to the amount of capital he/she can trade. And this ratio is expressed in the form “X:1,” where X is the amount of leverage.

Expressing Margin in terms of Leverage

If a trader wishes to purchase one mini lot of a currency, they don’t need $1,000 in their account balance. Instead, they will need only a small percentage of the position size. And this percentage is referred to as Margin Requirement.

This same percentage in terms of a ratio is termed as Leverage.

For example, let’s say John wants to buy 100,000 units of USD/CAD. If the Margin Requirement is 1%, John will require only $1,000 to take this trade. That is, the Leverage for this trade would be 100:1.

Calculating the Leverage

Leverage is calculated using the below formula

Leverage = 1 / Margin Requirement

Considering the above the example,

Leverage = 1 / 0.01

Leverage = 100

Hence, the leverage will be 100:1.

Similarly, if the Margin Requirement is 2%, the Leverage will be 50:1.

Conversely, using Leverage, we can obtain the Margin Requirement as well.

Margin Requirement = 1 / Leverage 

For example, if the Leverage is 500:1, the Margin Requirement  = 1 / 500 = 0.002

Hence, the Margin Requirement when Leverage is 500:1 will be 0.002 or 0.2%.

Mostly, Margin and Leverage have an inverse relationship.

Forex Margin and Stock Margin

Forex margin and Stock (Securities) margin are two completely different terms, though both are from the same trading industry.

In the Stock market, the margin is the amount a trader borrows from their broker to purchase a stock. Basically, it is like borrowing funds as a loan from their broker.

Whereas in the Forex market, the meaning of margin is different. Here, as we know, it is the amount of money a trader will have to keep aside with the broker as a deposit to open a margin position.

Hence, to sum it up, we can consider margin either as a loan provided by the brokers or as collateral collected by the respective brokerage firm.

[wp_quiz id=”52027″]
Categories
Forex Course

31. The Concept Of Margin Call & Margin Call Level

Introduction

By now, you would have known that risk management is the most crucial factor of consideration while trading in a margin account. The trader is not solely responsible for their risk, but brokers, too, have some features that directly or indirectly try reducing the risk of the traders. In the previous lesson, we understood what margin level was. And in this lesson, we shall be putting more meaning to it by introducing another term which is correlated with margin level. The margin term, which will be discussed in this lesson is ‘Margin Call Level.’ So, without any further talks, let’s get our feet wet with this topic.

Margin Call Level

Margin Call Level, as the name suggests, is a specific level in Margin Level when the broker warns the trader that their positions are at risk. It is a threshold level when the broker alerts the trader that some of their trades can be forced to close.

As mentioned, the Margin Call Level is closely related to Margin Level. Hence, Margin Call Level is expressed in terms of percentage.

Example

Let’s say the Margin Call Level set by the broker is 100%. So, if an account’s Margin Level falls below 100%, then it is said that the account has hit the Margin Call Level.

Margin Call

Margin Call and Margin Call Level is pretty much the same thing. Margin Call is simply a different version of the Margin Call Level. If Margin Call Level is a specific ‘level’ set by the broker, Margin Call is a ‘call’ or ‘notification’ given by the broker. So, when an account’s Margin Level falls below the Margin Call Level, the account holder will receive a call or notification from the broker notifying the same.

This above explanation was the simple exterior working of Margin Call. If we were to see the internal working of it, one would receive a Margin Call when the Equity value becomes less than the Used Margin. That is when the floating loss becomes larger than the Used Margin.

Now, let’s get this concept cemented by considering an example.

Assume that a trader has deposited $1,000 in his account. Also, he went short on EURUSD for 10,000. The required margin for this trade was $300. Considering this to be the only running trade, the Used Margin will be $300 (same as the Required Margin).

Let’s say the trade is performing well, and the current unrealized P/L is $100. The Equity at this point of time will be,

Equity = Account Balance + Floating P/L = $1,000 + $100 = $1,100

Now, since the trade is running in profit, the Margin Level will obviously be above the Margin Call Level.

Later, let’s say the trade is going into the negative to -$700. The Equity now will turn out to be $300 ($1,000 – $700).

With these values, let’s find out the Margin Level.

Margin Level = (Equity / Used Margin) x 100% = ($300 / $300) x 100% = 100%

Assuming that the Margin Call Level set by the broker is 100%, the trader will now receive a Margin Call as the current Margin Level is at 100%.

Now, wondering what will happen if the Margin Level falls significantly below the Margin Call Level? The answer to this shall be discussed in the next lesson. Make sure to take the quiz below before you go.

[wp_quiz id=”51027″]
Categories
Forex Course

29. Other Important Margin Trading Terminologies – Free Margin

Introduction

In the previous lesson, the concept of used margin and equity was discussed. Apart from having their importance, these terms prove to be significant to understand other terms as well. And in this lesson, we will be dealing with a term that has a close relation with used margin and equity.

Just to brush things up, the used margin is basically the total amount of money that is used up by the broker for all the positions. In other words, it is simply the sum of the required margin for all the trades. And equity, on the other hand, is the sum of the account balance and the unrealized P/L. Now that these definitions are clear let’s understand what free margin is.

Free Margin

Free margin is the difference between the Equity and the Used margin. That is, Free margin is the amount that is available for the trader to take new positions. It is basically the complemented version of the Used Margin. Used margin is the margin that is locked by the broker for taking positions, while free margin is the margin that can be utilized to open new positions. Free margin is also referred to as available margin, usable margin, and usable maintenance margin.

Calculation of Free Margin

As already mentioned, the Free margin is calculated by finding the difference between Equity and Used margin.

Free Margin = Equity – Used Margin

In the previous lesson, it was discussed that equity changes continuously when any positions are open. Now, since Equity is one of the factors that determine the Free margin, the free margin also keeps constantly changing when positions are running.

So, when a trade is performing well, the floating P/L increases, which in turn increases the Equity as well as the Free margin. And conversely, the Free margin decreases when the floating P/L decreases.

Now that the formula is clear let’s understand it better with some examples.

Let’s say a trader has deposited $1,000 to their account and currently has no positions open yet. So, the account balance at this point would be $1,000. The Equity will be the same as the account balance as the floating P/L is $0. Since no trades are open, there is no margin used. From this, the free margin is calculated as:

Free Margin = Equity + Used Margin = $1,000 + $0 = $1,000

Thus, it can be concluded that Balance, Equity, and Free margin is the same when no positions are open.

Now, let’s say the trader went short 10,000 units on EUR/USD. Consider the required margin to be $150. Also, assume that the trade is running in a profit of $30.

Equity= Account balance + Floating P/L = $1,000 + $30 = $1,030

The used margin will be equal to $150 (required margin) as there is only one position open.

Free margin = Equity – Used margin = $1,030 – $150 = $880

We hope you understood what Free margin refers to in a margin account. In the coming lessons, we will be discussing the Margin level, Margin call level, and Stop out level. Check your learnings by taking up the below quiz.

[wp_quiz id=”50694″]
Categories
Forex Course

28. What Should You Know About Used Margin and Equity

Introduction

In the previous lesson, three terms related to margin was discussed. There is another term called used margin, which comes under the same roof of the margin requirement and required margin. And in the lesson, this term shall be discussed in detail. Apart from that, this lesson shall touch base on the concept of Equity in margin trading.

Before diving directly into the topic, let’s first brush up the previously discussed terms as they form the base for this lesson. To Start off with the Required Margin, it is basically the units of currency that is needed to open a position. Note that this is not the actual amount of the position size but the amount after applying the Margin Requirement to the required margin.

Used Margin

The Used margin is the term that is very similar to the required margin. In fact, the used margin is the required margin. However, there is a thin line difference between the two.

The Used margin is the amount that is blocked by the broker when positions are open on a trader’s account. This definition might seem the same as that of the required margin. The difference is that the required margin talks about one single trade, while the used margin considers the sum of the required margin of all the trades. This is the amount that is ‘used’ by the broker when the trade is open and cannot be utilized for taking new positions. However, once the positions are closed, this used margin is unblocked and returned to the account balance.

Example

Let’s say a trader has $1,000 in his account and wishes to open trades on EUR/USD and USD/CHF.

Let’s assume he is willing to go short 10,000 units on USD/CHF and long 1,000 units on EUR/USD. Let’s keep the margin requirement for USD/CHF and EUR/USD to 2%, respectively. Before going into the calculation of the used margin, the required margin is calculated as follows:

USD/CHF

Required margin = Notional Value x Margin Requirement = $10,000 x 0.02 = $200

EUR/USD

Required margin = Notional Value x Margin requirement = $1,000 x 0.02 = $20

Therefore, when positions on both trades are opened, the used margin turns out to be $220*.

*Used margin = $200 + $20 = $220

Equity

Equity is a variable term that represents the current value of the account balance. Equity constantly changes when traders have their positions running. This proves to be an important term because it determines how many more positions can be taken on this account.

Calculation of Equity

The calculation of Equity is simple. It is the algebraic sum of the account balance and the unrealized P/L. When there are no positions open, the Equity will be the same as the account balance as the unrealized P/L is 0. And when there are any running positions, the Equity will be determined by both account balance and unrealized P/L.

Equity = Account Balance + Floating P/L

From this, it can be inferred that, when trades are running in the positive, the Equity rises, and when they’re in the negative, the Equity drops.

Thus, this completes the lesson on Used Margin and Equity. In the next lesson, some advanced term on margin shall be introduced. Don’t forget to take the below quiz before you move on.

[wp_quiz id=”50341″]
Categories
Forex Course

27. Understanding Margin Amount, Margin Requirement, and Required Margin

Introduction

In the previous two lessons, the basic terms in a margin account were discussed. And this lesson shall talk about the concept of Margin in detail. Precisely, this chapter of the course will deal with Margin, Margin Requirement, and Required Margin, as these three terms are very crucial when it comes to handling a margin account.

Margin, Margin Requirement, and Required Margin are closely related to each other.    Margin, the used term in margin trading, is the amount one needs to possess to open a position. And Margin Requirement and Required Margin are terms which mean the same but differ in notation. Now, let’s dive right into the topic and understand each one of the terms in detail.

Margin Amount

It is the amount that is used up or blocked by the broker to open and maintain a position in the forex. An important point to be noted here is that capital blocked is usually not the same as the lot size traded. Hence, the Margin Amount can be related to deposit or collateral that is payable to be the broker. However, this amount differs based on the number of lots traded.

The margin amount is blocked from the account balance when a trade is opened and is freed to the account balance when the trade is closed.

Margin Requirement

Margin Requirement describes what percentage of the position size is required to open a position. For example, if the Margin Requirement for a trade is 3%, then 3% of the position size is to be produced by the trader to open the position. So, when brokers mention that Margin in terms of percentage, then they are referring to Margin Requirement.

Required Margin

Required Margin is simply the Margin Requirement expressed in terms of units of currency. For example, if the margin requirement is 1% to take a position worth $10,000, then the Required Margin for the same will be $100.

Calculation of Required Margin

Since Required Margin is closely related to the Margin Requirement, the Required Margin is the product of Margin Requirement and the Notional Value.

Required Margin = Margin Requirement x Notional Value

Summary

Let’s sum up all the terms by taking an example. Let’s say a trader has $1,000 in his trading account. This amount can be read as a balance, as well. Let’s say he wishes to go long 10,000 units on EURUSD. Also, let’s assume that 2% of the position size value is required to open a trade.

The Notional value, Margin Requirement, Required Margin can be calculated as follows:

Assuming an account dominated in the USD, the Notional value turns out to be $10,000. Similarly, the Margin Requirement will be 2%, and the Required Margin will be $200*.

*(Required Margin = $10,000 x 2%)

When the trade is placed, $200 is blocked by the broker as “margin.” And once the position is closed, the complete margin amount (deposit) will be added back to your account balance, given that the trader did not make a loss.

This brings us to the end of this lesson. Let’s see if you can get all the below questions right!

[wp_quiz id=”49837″]
Categories
Forex Course

26. Margin Terminologies – Unrealized P/L and Realized P/L

Introduction

In the previous lesson, the concept of balance was discussed. And in this lesson, two more terms shall be opened up, namely, unrealized P/L and realized P/L. First up, P/L is an abbreviation for Profit/Loss. Many assume that there is only one type of P/L, but this is not true. Not just in forex, in other markets as well, there exists both unrealized and realized P/L. Now, let’s begin with understanding each term with the help of examples.

Unrealized P/L

Unrealized P/L, as the name clearly suggests, is the profit or loss running in a trade that is not closed. The profit/loss in unrealized P/L constantly changes as the prices keep changing. Hence, this type of P/L is also referred to as Floating P/L.

The Unrealized P/L is calculated as follows:

Unrealized P/L = Position size x (CMP – Entry price)  [Long]

Unrealized P/L = Position size x (Entry price – CMP)  [Short]

(CMP – Currency Market Price)

This above formula gives the value in terms of pips. The value in terms of currency can be calculated by multiplying it with the pip value of the currency pair.

Example Unrealized P/L or Floating P/L

Let’s assume a trader bought 10,000 units of EURUSD at 1.4100. After a while, the price rises to 1.5000. If the trade is still running, the floating P/L can be determined, as shown.

Since this is a long trade, the following formula is applied.

Unrealized P/L = Position size x (CMP – Entry price)

= 10,000 x (1.6100 – 1.5000)

= 10,000 x (0.11)

Unrealized P/L = 1,100 pips

Hence, the trade is currently running at a profit of 1,100 pips.

Now, if the pip value for a mini lot for EURUSD is $1, the profit sums up to $1,100 (1,100 x $1).

Now, bringing the concept of balance into the picture, the balance for unrealized P/L will not get affected though the trade is in profit or loss. However, once the trade is closed, the balance does get updated.

Realized P/L

Realized P/L is the profit or loss in a trade when it closed. Realized P/L is more significant than the unrealized P/L because this is the one that brings a change to the account balance.

The realized P/L can be calculated using the below formula:

Realized P/L = Position size x (Closing price – Entry price)  [Long]

Realized P/L = Position size x (Entry price – Closing price)  [Short]

Example – Realized P/L

Let’s say a trader went long on EURUSD with 10,000 units at 1.1000. The price drops down to 1.0000. Since the current market price is lower than the entry price, it can be ascertained that the trade is running in a loss, i.e., the unrealized P/L would be negative. Later, the price jumps up to 1.2000. At this point, the trader closes the trade. Since the trade is now closed, the realized P/L can be calculated as follows.

Realized P/L = Position size x (Closing price – Entry price)

= 10,000 x (1.2000 – 1.1000)

Realized P/L = 1,000 pips

In terms of currency value, the realized P/L will be $1,000 (1,000 pips x $1). And this time, the balance will be updated as well.

Hence, this begins us to the end of this lesson. In the next lesson, another important margin terminology shall be discussed. Before you go, make sure to take the below quiz to know if you have got the concepts right.

[wp_quiz id=”49571″]
Categories
Forex Course

24. Fundamentals Of Margin Trading

Introduction

Margin, which allows for Leverage trading, is one of the crucial reasons why most of the traders prefer trading Forex. It is an aggressive form of trading where traders take more risk while expecting an additional reward. Here, traders increase their bet by borrowing funds usually from their brokers. Thereby leverage trading allows a trader to trade with more funds than they actually have in their account. Leverage trading exists in the stock market, as well. The internal working of margin in both the markets is not quite the same, but the overall concept is the same.

Leverages is typically represented in ratios or with an ”X” next to it. For instance, the notation of two times leverage would be 2:1 or 2x. There are several other terminologies such as balance, realized and unrealized P/L, used margin, equity, etc. which are involved in margin trading. And to trade in a margin account, having knowledge about these terms is vital. So, in this lesson, some basic concepts and working of the margin trading shall be discussed.

Margin Account

A margin account, also referred to as a leverage account, is a trading account offered by a forex broker, which lets their clients trade large quantities without investing the total required amount. In a margin account, the forex broker acts like a loan lender who lends cash to its customers for taking positions in the market.

How does margin trading work?

Let us assume that a trader has deposited some amount into his account. The broker sets a margin percentage for the client. This margin percentage typically is between 1-2%. In forex, it is not the case that this account balance is used for taking a position. But, it is used up by the brokers as security deposits. Here, if the broker sets a margin percentage to 1%, then 1% of the trade value is utilized by the broker as a security deposit. So, a trader takes a position worth $100,000, then only $1,000 is used up, and the broker lends the rest 99% of the amount. This is the basic working of a margin account. There are many other terms involved in it, which shall be discussed in the subsequent lessons.

Benefits and Shortcomings of Leverage Trading

Initially, margin trading might seem very beneficial. To an extent, this is true, but there are disadvantages to it as well. Below are some of the advantages and disadvantages of margin trading.

Advantages

🟢 Ability to multiply a trader’s trade size

With margin trading, minimal capital is no more an issue because one can take larger positions even with a smaller investment.

🟢 Significant short-term gains

As margin accounts allow traders to take bigger positions, one can grow their account balance exponentially, even in the short-term.

Disadvantages

🔴 High risk

The market has two directions. So, though a trader trades on a margin, it does not mean that the trade will perform in their forecasted direction. A trader can make high profits and can even lose a significant amount of money. Hence, trading with margin involves high risk. And it is not recommended for novice traders.

🔴 The requirement of the minimum account balance

Trading in a margin account requires the user to maintain the minimum balance specified by the broker. If a user fails to maintain the minimum balance, then the trader is forced to close their positions.

This concludes the introduction of margin trading. In the next lesson, the terminologies involved in margin trading shall be discussed.

[wp_quiz id=”49218″]
Categories
Forex Course

23. A Brief Comparison Between The Stock Market & The Forex Market

Introduction

The Stock market and the Forex market are the most widely traded markets in the world. Many traders who enter the universe of trading are often in a dilemma on which market to trade on. Though both markets involve trading instruments, there are many differences between these two. In this lesson, we shall get insights on the different features of both markets and then come to a conclusion on which is the market has got the upper hand.

Market timings

The forex market is open for 24/5. This proves to be a considerable advantage, as traders can trade anytime during the trading hours according to their schedule. While this is not the case with the stock market because they’re open only for 7-9 hours in a day. So, the stock market timings can be helpful only to full-time traders.

Facility to buy and sell short

As already discussed in the previous lesson, there is no directional bias in the forex market. The process and working for buying and selling is the same. Hence, a trader can participate during any condition of the market.  In the case of the stock market, there are few restrictions on short selling a stock. Though the facility for short selling is available, the procedure is not as simple as buying a stock.

Leverage/Margin

Leverage is the facility provided by the brokers to take larger positions with smaller capital. Leverage is one of the reasons why small retail traders take part in the market. Now, comparing the leverage in the stock market with the forex market, the difference is quite significant. In the stock market, maximum leverage for a day trader is up to 4:1 and for a positional trader, it is up to 2:1. Coming to the forex market, the leverage is commonly around 100:1. In fact, in some brokerages, it goes up to 500:1 as well. However, it cannot be concluded that it is better to choose the forex market over the stock market. This is because, as the leverage increases, the risk involved in the trade also increases.

Dividends

Dividends are basically perks given by companies if an investor invests in their company. Investing in a stock that provides dividends to their customers can be considered as a risk-free business. This is because, even if the stock underperforms in the market, you are usually assured of dividend income. But, in the forex market, there is no concept of dividends as such. Hence, this market is for the ones who are willing to take the risk.

Diversification

Many traders look for diversifying their portfolio. In the US stock market, there are around 2,800 stocks listed on the NYSE and 3,100 on the NASDAQ. And these stocks are put into different sectors. The sectors have their specific features and perform differently from other sectors. Hence, the stock market is an ideal market for the ones looking to diversify their investments.

Conclusion

In considerations of the above features of the stock market and the forex market, it is quite hard to stay biased. In the initial features, the forex market proves to be a better market, and when it comes to dividends and diversification, the stock market is the clear winner. Hence, from this, we can conclude, ‘the best market’ is a variable factor. It all depends on the type of trader a person is.

[wp_quiz id=”49036″]
Categories
Forex Course

21. Who Are The Forex Market Movers?

Introduction

In the previous lesson, we discussed how the forex market is structured. Now, it is time to take this topic a little deeper. In this article, let’s understand the Forex market movers. The participants of the market during the late 20th century were quite less. But, as time passed by, the number of participants grew exponentially. The big players got bigger, and the small retail traders found their way into the market. And at present, the forex market is no less than an ocean.

The participants of the Forex market

The Forex is approximately a $5 trillion market. This kind of liquidity comes from several types of traders. Some of them come with large pockets, some with medium-sized capital and the rest to make a quick buck. Now, let’s get an insight into all of these participants.

Central Banks

Central Banks play a crucial role in the Forex market. The interest rate policies of the Central Banks influence the exchange rates to a large extent. They are also responsible for Forex fixing. They take action in the Forex market to stabilize and pump in the competitiveness of that country’s economy. Moreover, they participate in the currency exchange to manage the country’s foreign exchange reserves.

Commercial Banks

Many assume that commercial banks come under the central banks’ category. However, this isn’t true. The commercial banks are the most active participants in the FX market. They’ve got the biggest pockets out there and trade with considerably large quantities of lots. Due to this, they partially determine the exchange rates of the currencies as well. About 100 to 200 banks around the world assumed to ‘make’ the market. The commercial banks facilitate the services to the retail clients for conducting foreign commerce and making an international investment. The commercial banks include large, medium, and small-sized banks, and as a whole, these banks are referred to as the interbank market.

Foreign Exchange Brokers

Forex brokers also have their significance in the market. They are agents who facilitate trading between two parties. Note that these brokers are just matchmakers and are not really involved in determining the exchange rates of currencies. Brokers constantly keep an eye on the exchange rates and try matching the price of buyers and sellers to execute a trade.

Multi-National Companies

The MNCs are major participants in the FX markets, who do not come from the banking side. These companies usually participate in the forward or the futures markets. Their participation comes from the cash flow between different countries. MNCs typically set up contracts to pay or receive a fixed amount of foreign currency in the future date.

Retailers

The exponentially growing market in the Forex is the retail market. The retailers include smaller speculators and investors. Speculators, unlike the participants mentioned above, are not in genuine need of foreign currencies. Their motive from the market is simple. They buy or sell with a hope that the price will move in their favor and can end up with a profit. They get their orders placed by brokers who act as an intermediary between buyers and sellers. The power of retailers to move the market is minimal because their contribution to the volume traded in Forex is less than 6% of the total Forex volume.

These are the different participants who make up the entire Forex market. In the upcoming lesson, we shall open up more about the Forex brokers. Don’t forget to take the below quiz to check your learnings.

[wp_quiz id=”48275″]
Categories
Forex Course

18. What Should You Know About Trading The New York Session

Introduction

After the Asian and the London session, the big fishes enter into the market, i.e., the New York market. When London’s session is halfway through its trading, the New York markets make an entry into the market. Precisely, the New York session begins at 8:00 AM EST. This session is also referred to as the North American session. The liquidity during this session is pretty high.

As we have discussed the average pip movement in the Tokyo session and the London session, let us compare the pip movement by considering all the three sessions. The London session tops the table, which is then followed by the New York session and, finally, the Tokyo session.

Average Pip Movement

London session > New York session > Tokyo session

Now, let us see the average pip movement for some of the extensively traded currencies in the market.

How to trade the New York session

The New York session opens at 8:00 AM EST, which is during the London session. That is, there is an overlap between the two sessions. Since the world’s two largest markets are trading in the forex market, one can expect a high volume of orders flowing into the markets. Hence, this is an ideal time to enter the market as the spreads are quite low during this phase of time.

During the New York session, the economic news begins to drop. And as a matter of fact, 85% of the news is related to the US Dollar. So, news traders can keep a close watch on all the US Dollar pairs as the news typically moves the market drastically.

During the market open, the liquidity of the market is excellent, but as the noon approaches, it begins to drop. That is, during lunch hours, the market goes into a consolidation phase.

Another interesting fact to consider is, the market loses its momentum on Friday afternoon as the weekend begins for the Asian and the European markets. Hence, it is not a good idea to trade on Friday afternoons. Apart from momentum, it is possible for the markets to reverse its direction as the traders might look to square their positions off.

Which pairs should you have on your watchlist

The liquidity during the start of the session is excellent, as the London markets are open as well. So, during this time, you can choose to trade any pair. However, it is recommended to concentrate more on the major and minor currency pairs.

Several news events come in during this session. So, a news trader can take advantage of them, although a novice trader should stay away from pairs affected by such events, as it requires abilities unrelated to technical analysis.

Therefore, all in all, the New York session is a session that can be profitable for all types of traders. The volatility of the market during this session stands in between the London session and the Asian session. Hence, if you’re a novice trader, it is a good idea to start off with the New York session.

We have completed this short tutorial in the New York session. And in the next lesson, we shall go more precisely into when exactly to trade the Forex market. Let’s see if you have understood this lesson correctly by answering the questions below.

[wp_quiz id=”47122″]
Categories
Forex Course

17. What Is The Best Time To Trade The Forex Market?

Introduction

The Forex market is open 24 hours daily and is traded from Monday to Friday. This feature makes it feasible for traders all around the world to trade it. However, it is not quite ideal to trade anytime in Forex. There are specific times of the day and week that offer greater liquidity. These are the times when the professional traders step into the market as well. So, let’s dive right into the topic.

The preferable time to enter the forex market

Liquidity and volatility are the two vital factors a trader must consider before choosing the best time to trade. Because, with the absence of liquidity and volatility, it is not possible to grab big moves in the market. Hence, one must look out for the times when there is a high volume of trading happening in Forex.

As far as liquidity is concerned, liquidity is excellent (as well as volatility) when two sessions overlap. During these times, the volume of orders double, making significant movements on major pairs. Hence, getting in-depth knowledge about how pairs behave during session overlaps is very important.

The overlapping sessions

The Tokyo-London Overlap

During the Asian session, there is not much movement in the market. But, when the London market opens, the Tokyo markets are still running. Hence the volume during the overlap time segment increases as both the markets are actively traded. Having said that, most of the volume comes from London, which ends up suppressing the Tokyo market. Hence, trading this overlap session is highly recommended.

The London-New York session

The London market and the New York market alone bring in considerable volatility. And when both these markets combine, the liquidity rises significantly. Hence, this becomes the ideal time to trade the forex market. Moreover, due to the high liquidity, the spreads during this time are incredibly tight.

Now that we’re clear with the preferable time to trade the markets let us discuss the preferred weekdays to engage in trading.

What are the days of the week best to trade?

Let us answer this question by considering the average pip movement of currencies pairs on all trading days of the week.

From the above table, we can ascertain that the pip movement on Monday is lesser when compared from Tuesday – Friday. Also, on Friday, once the afternoon sets off, the liquidity reduces considerably. Hence, to get the best from the Forex pairs, it is best to work during the middle of the week and near the time of the market openings.

This brings us to the end of this lesson. To get a recap of the above lesson, you can take up the quiz given below.

[wp_quiz id=”47251″]
Categories
Forex Course

16. Trading The London Session

Introduction 

The London session, also referred to as the European session, is the session where a significantly high amount of trading happens. The London session opens at 3:00 AM EST and is rigorously traded for eight hours straight.

There are several big financial institutions in Europe. So, the trading volume in the FX market during this session is extremely high. Due to this, many retail traders also show massive participation during this session. Hence, the London session was named the forex capital of the world.

There are thousands of transactions every minute during this session. As per sources, 30% of all forex transactions are executed during the European session.

In the previous lesson, we saw the average pip movement in the Tokyo session for some majorly traded currencies. The average there came to around 53. Now, coming to the London session, the average is much higher than the Tokyo session. The number stands at 72. During this session, the FX majors, as well as minors, tend to move by large amounts.

The below table gives you an idea of the average pip movement for some intensively traded currencies.

More about the London Session

As mentioned, London is considered as the Forex capital of the world. The majority of the volume in the market comes during the London session. Hence, there is high liquidity during this session.

The London session opens during the closing time of the Asian market. During the Asian session, the market usually goes through a consolidation phase. But, when London opens its shops, the consolidation comes to an end, and the market begins to move in a trend state. However, during the middle of this session, the market slows down and begins to consolidate. This could perhaps be due to the fact that the traders are waiting for the New York market to open. It has also been observed that the market reverses its direction at the end of the session. This could mean that the large players are booking their profits.

As far as trading in this lesson is concerned, this is the ideal session for the trend traders. A trend trader can analyze the markets during the Asian session and gear up to take trades when the London market opens.

The best currencies to trade during the London session

It is clear from the table that we can trade any pair in the market. There is sufficient liquidity in most of the currency pairs. Specifically speaking, one can keep a close eye on pairs such as EURUSD, GBPUSD, USDCHF, USDCHF, GBPJPY, EURJPY, etc. Moreover, as there is a heavy volume of trading in these pairs, the spreads here are very tight.

Thus, this brings us to the end of this lesson. In the next lesson, we shall discuss the New York session. For now, test your learning by taking up the quiz below.

[wp_quiz id=”46939″]
Categories
Forex Course

15. All About Trading The Tokyo Session!

Introduction

Japan’s capital Tokyo, is the most majorly traded market in the Asian continent. That is, in Asia, the highest volume comes from the Tokyo market. In fact, it is considered the financial capital of Asia. Moreover, it is the third-largest trading center in the world.

The Tokyo session, also referred to as the Asia session, opens at 8:00 PM EST and is traded until 5:00 AM EST. In terms of Japan’s local time, the trading happens between 9:00 AM to 6:00 PM. As ‘Yen’ is the currency of Japan, 16.50% of all the Yen transactions take place during this time. And as far as all currency transactions are concerned, the value lies at 21%.

The one that matters the most during any session is the pip movement in different pairs. Below is a table which represents the average pip movement for some of the major currency pair.

Now, the average of the above currency pairs turns out to be around 53 pips. This number is less when compared to the New York session and the London session.

Some facts about trading the Tokyo session

During this session, the market is seen to fade away its momentum. That is, the market is seen to be quite flat. In technical terms, the market usually goes through a consolidation state. This session might not be the ideal session for the ones looking for large pip movement. However, this session can be great for scalpers.

Tokyo market typically is known to correct the overbuying and selling in the New York session. The market makes drastic moves during the NY session and comes to slows down its pace during the Tokyo session. Therefore, the liquidity during this session is quite feeble.

It is not just the central banks and hedge funds that move the market. Since Japan is the largest exporter in the world, a large number of transactions come from the exporters as well.

Also, the Bank of Japan is an active participant in the forex market during the Tokyo session. This is because it intervenes the curb appreciation in the Yen regularly.

Which currency pairs should you focus on?

The market conditions and situations tend to change from time to time, so it becomes uncertain to predict the exact movement of pairs. However, if we were to consider the average rates, we can keep an eye on the news from countries like Australia, New Zealand, China, and Japan. The news from these countries comes during the Tokyo session or just before its open. And the news usually pumps up the volatility and liquidity of the market. Hence, one can have a focus on AUD, NZD, and JPY pairs.

When the Tokyo session comes to an end, the London markets open, which causes overlap between the two sessions. So, to be part of the significant movements, keep an eye on GBP, EUR, and CHF along with AUD, NZD, JPY, and USD.

This is a brief review of the Tokyo session. We shall discuss the other sessions as well in the upcoming lessons. Take the below quiz to know if you have learned the concepts right.

[wp_quiz id=”46800″]
Categories
Forex Course

13. General Myths In The Forex Market Every Trader Must Be Aware Of

Introduction

Forex is the market for trading currency pairs. It is a real business that happens over the internet. However, many new traders do not take it seriously and often associate it with gambling. And this misconception still exists in the minds of people. Hence, it is necessary to fade these thoughts away as it could lead to significant losses in the long term.

Having that said, in this lesson, we shall discuss some of the myths and facts about the forex market, which are vital for traders to know.

Myths about the Forex Market

Forex is a get-rich-quick scheme

Many traders enter into this market with the assumption that they can make quick profits consistently. They start off with a small capital do make quite a good amount of money. This entices them, and they begin to maximize their lot sizes. In the end, they lose all of their profits, including their capital in just one trade. So, do not ever enter the forex market, considering it to be a game of gambling as it can completely blow away your account within no time.

Professional traders have an accuracy of 100% profitability

Whosoever be the trader, when they trade in the forex market, it is almost impossible to have only profitable trades. This is because; sometimes, there are events that happen to occur without the knowledge of the trader. And during these times, there is a high probability for the trade to go against your direction. So, the consistency of a successful trader is around 80-90%.

Stop-losses are purposefully triggered by the broker

Many traders believe that their stop-losses are hunted by their broker. But, this is just a misconception in the minds of people. Note that brokers have absolutely nothing to do with your stop-loss. It is the market itself that hunts for your stop-loss.

There exists ‘THE best strategy’ in trading

Many novice traders, in fact, all novice traders, go in search of the best strategy to trade. But, the truth is that the best strategy is not an absolute term. There are a countless number of strategies out there, and it all depends on you on how you adapt to it. Hence, there the concept of  ‘best strategy’ is just a myth.

You need to have a financial degree to trade in forex

Well, a great fact to know about the forex market is that you do not need any degree to qualify to trade. However, as we always say, education is definitely required for you to succeed in the market even though it is not a formal one.

The price movements in the forex market are entirely random

Even though the forex market is extremely hard to predict, the price movements are not entirely random. There are different ways through which a trader can assess the conditions of these prices. With the help of Technical Analysis or statistical (quant) methods, a trader can moderately anticipate the price action of currency pairs and thereby they can have an edge in the market.

This brings us to the end of this lesson. We hope we’ve cleared out some of the misconceptions you had about the forex market. To have a recap to this lesson, we have a quiz set up for you below.

[wp_quiz id=”46291″]
Categories
Forex Course

10. Understanding Lots & Different Types Involved

Introduction

In the stock market, securities are traded in a number of shares. Similarly, in the Forex market, currencies are traded in units of the currency. And these units are combines into different tradable sizes, and they are called as ‘Lots.’ Hence, to buy and sell currency pairs, you must trade in the form of lots. There are different lot sizes depending on the number of units you trade. For example, 10,000 units are referred to as a mini lot and 100,000 units as a standard lot. Now, in this lesson, we shall understand other lot sizes along with some examples.

What is a lot in Forex?

A lot in Forex is the number of units of a currency pair. Note that one unit is not equal to one lot. Instead, a collection of units of a currency pairs make a lot. And depending on the number of units that are involved in making up a lot, there are different lot sizes in the market.

Different Types of Lots in Forex

Depending on the number of units, we can classify Lots in four types.

Standard Lot

The size of this lot is 1 and is made up of 1000,000 units of a currency pair. So, buying 100,000 units of EURUSD is as good as saying you have bought 1 lot of EURUSD.

Mini Lot

In terms of lot size, the quantity of ‘lots’ in a mini lot is 0.1. And one mini lot consists of 10,000 units of a currency pair.

Micro Lot

The quantity of lots in a micro lot is 0.01. And this lot is made up of 1,000 units. So, buying is 1 micro lot means, buying 0.01 lots or 1,000 units.

Nano Lot

0.001 lots make up one nano lot, and it consists of 100 units of a currency pair.

Now, let us take some examples and clear out the differences in these types.

Examples

E.g., 1: Buying 5 standard lots.

Lot size distribution = 5 * 1 standard lot

Number of units = 5 * 100,000 = 500,000 units

E.g., 2: Selling 1.5 standard lots

Lot size distribution = 1 * 1 standard lot + 5 * mini lots

Number of units = 1.5 * 100,000 = 150,000

E.g., 3: Buying 3.2 mini lots

Lot size distribution = 3 mini lots + 2 micro lots

Number of units = 3.2 * 10,000 = 32,000

Leverage trading

You must have seen brokers who let traders trade with as low as $100. In fact, they let you trade mini lots with it. Now, you must be wondering how one can trade 10,000 units with just $100 in their account. Well, this is facilitated by the brokers as they offer to trade with ‘leverage.’

In leverage trading, brokers let you take positions larger than the capital you possess. And as far as the mechanism of this is concerned, a broker lends you with the required money to take a position. And for this, they keep some amount of your capital as deposits. This deposit stays with them until your trade is open. When the trade is closed, the complete deposit is returned back to you. Leverage, also referred to as margin, is usually measured in ratios or in percentages. A detailed explanation of this shall be discussed in further lessons.

Hence, this completes the lesson on Forex lots and its types. And below is a quiz to help you check if you have grasped the concept better.

[wp_quiz id=”45130″]