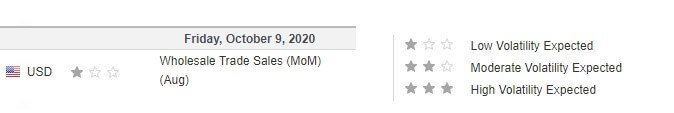
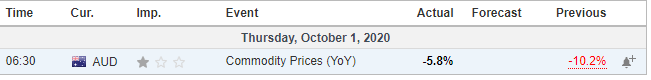
Eyes will remain on the series of Manufacturing PMI figures from the Eurozone, UK, Canada, and the U.S. Although it is a low impact event, it may help determine the market sentiment today. The U.S. Fed Chair Powell will be in highlight as he is due to testify on the CARES Act before the Committee on Banking, Housing, and Urban Affairs, in Washington DC. Lastly, the ECB President Lagarde is also due to speak at an online event hosted by the Atlantic Council; however, it is now expected to significantly influence the Euro.
Economic Events to Watch Today
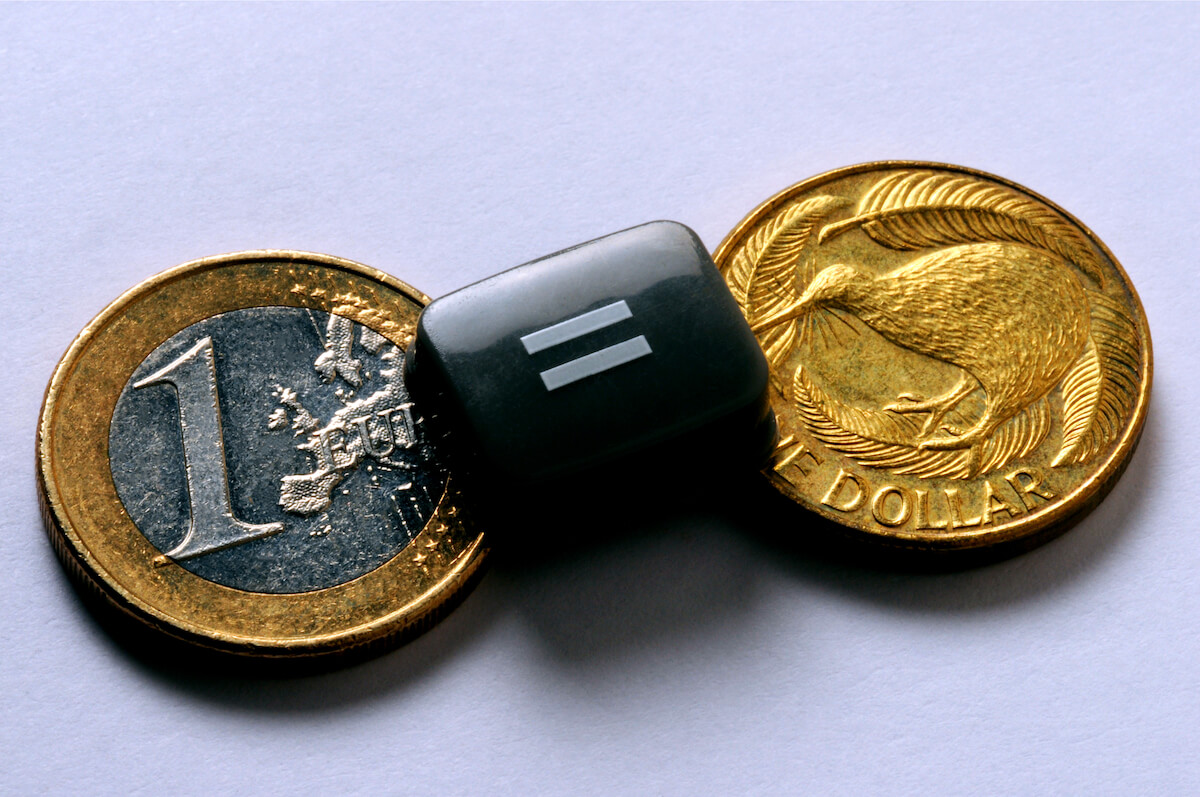
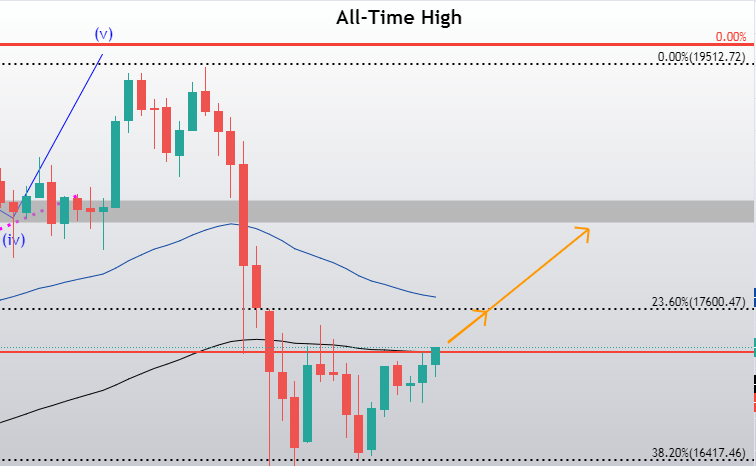
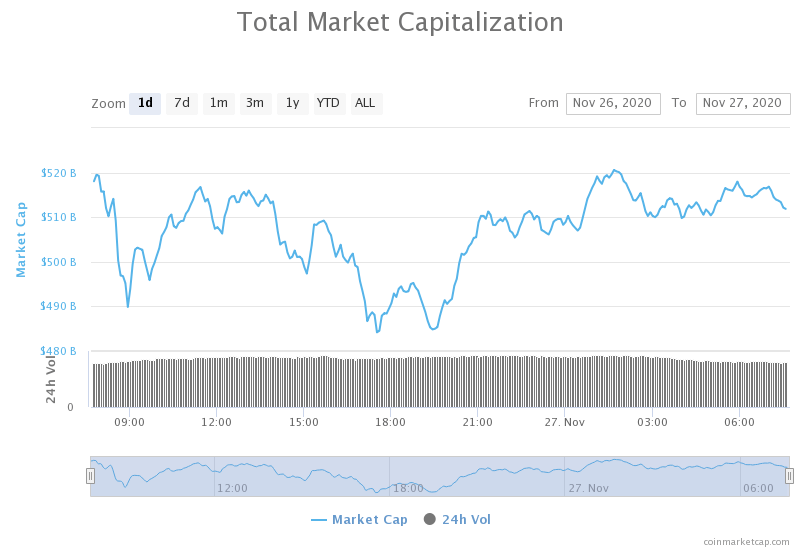
EUR/USD – Daily Analysis
The EUR/USD closed at 1.19547 after placing a high of 1.20030 and a low of 1.19235. The currency pair EUR/USD surpassed the 1.20000 level on Monday amid the rising risk sentiment in the market and decreasing U.S. dollar; however, the pair started to lose its gains and ended up posting losses for the day.
The EUR/USD pair continued its bullish movement in the early trading session on Monday as the risk sentiment improved with more positive news from the coronavirus vaccine side. Pfizer has sent the first mass shipment of its vaccine to Chicago on Monday. Whereas, Moderna has applied for emergency use authorization of its vaccine from the US FDA on Monday. Both these latest reports from the vaccine side added further strength in the risk sentiment as it showed progress in steps that would eventually lead to global economic recovery.
The improved risk sentiment because of optimism regarding vaccine and economic recovery gave strength to riskier assets like EUR/USD pair on Monday.
Meanwhile, the U.S. dollar’s weakness also played an essential role in raising the currency pair EUR/USD above the 1.2000 level. The U.S. dollar was weak across the board due to the latest announcement that Congress has started its brief session to pass the next stimulus package for coronavirus.
Furthermore, both sides’ macroeconomic data were also in favor of pushing the currency pair EUR/USD near its mid-August high level on Monday. From the European Union side, The German Prelim CPI for November came in as -0.8% against the forecasted -0.7% and weighed on the single currency Euro. At 13:00 GMT, Spanish Flash CPI for the year came in as -0.8% against the forecasted -0.9% and supported Euro. At 15:00 GMT, the Italian Prelim CPI for November came in as -0.1%against the forecasted -0.2% and supported the single currency Euro.
On the U.S. dollar front, At 19:45 GMT, the Chicago PMI for November dropped to 58.2 against the anticipated 59.4 and weighed on the U.S. dollar. At 20:00 GMT, the Pending Home Sales for October fell to -1.1% against the estimated 1.1% and weighed on the U.S. dollar. However, the gains in the EUR/USD pair failed to remain till the end of the trading day and started to reverse in late trading hours amid the concerns of coronavirus pandemic in Europe. The outlook for the largest economy in the Eurozone, Germany, became increasingly uncertain due to the rising number of coronavirus cases surpassed above 1 Million.
Daily Technical Levels
Support Resistance
1.1962 1.1976
1.1954 1.1982
1.1948 1.1991
Pivot point: 1.1968
EUR/USD– Trading Tip
The market’s technical side remains mostly unchanged on the back of a limited number of economic events on the calendar. The EUR/USD pair is trading with a bullish bias at the 1.1955 area, facing immediate resistance at the 1.2000 area. Closing of candles above the 1.1915 support level suggests odds of bullish bias in the EUR/USD as this level is extended by an ascending triangle breakout pattern. On the lower side, the EUR/USD may find support at the 1.1912 and the 1.1865 areas; however, bullish bias remains stable over the 1.1912 level.
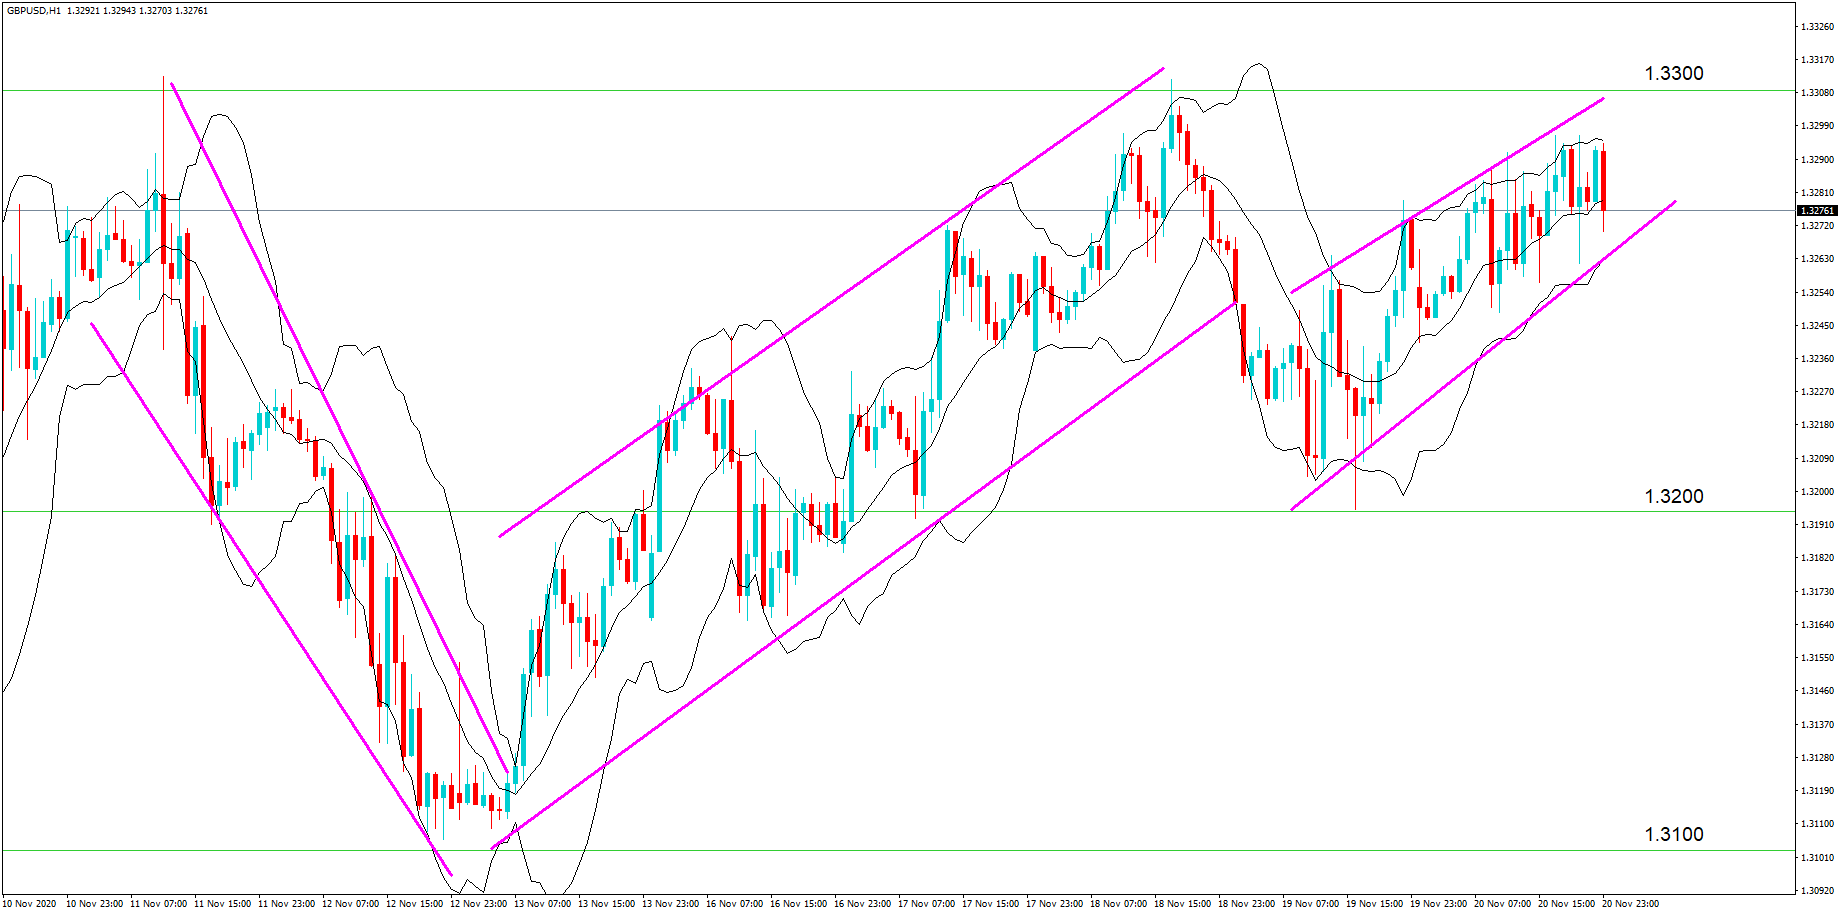
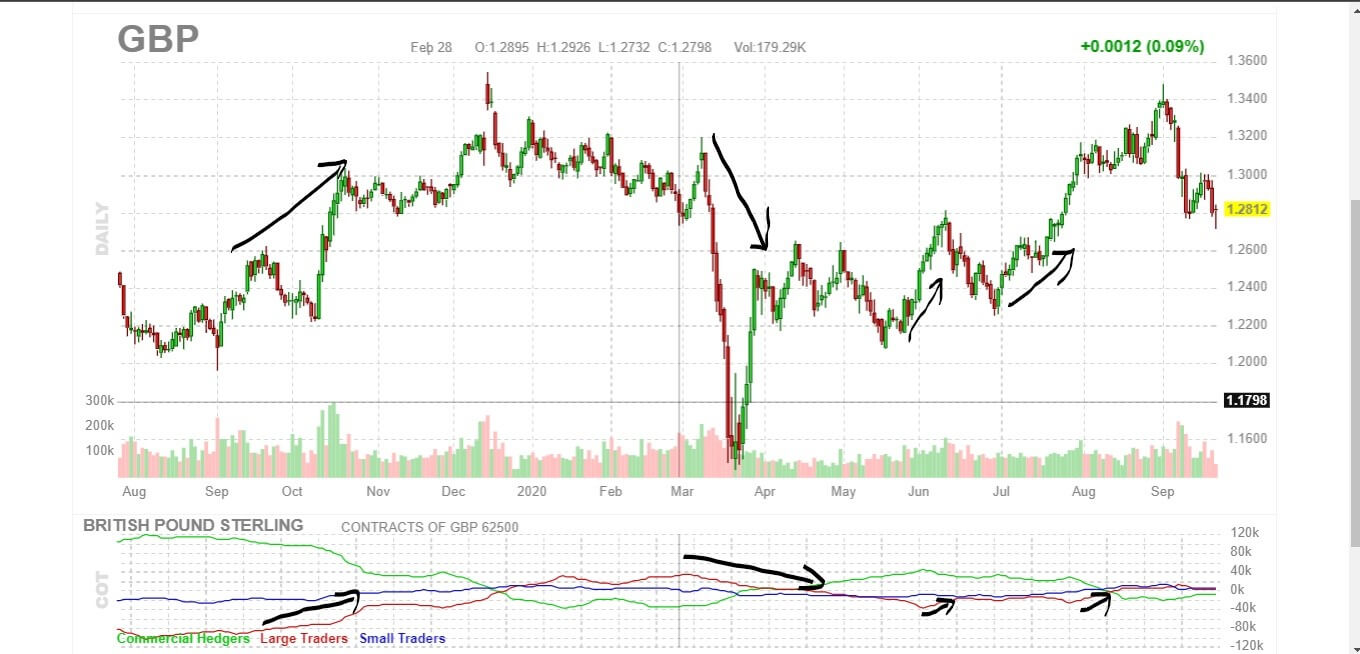
GBP/USD – Daily Analysis
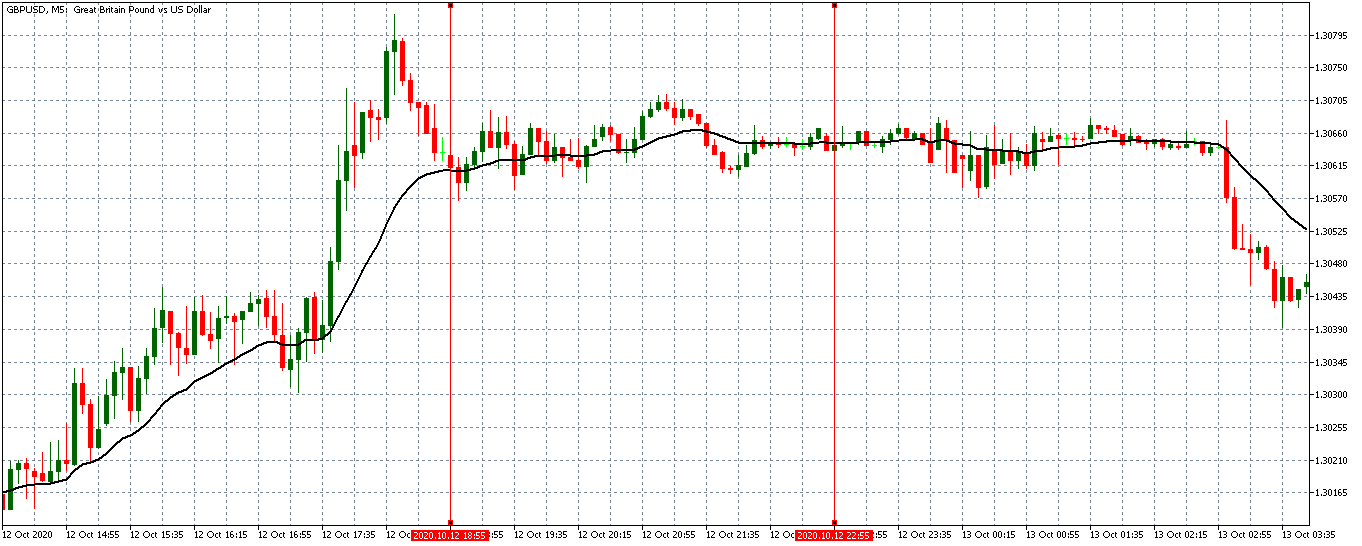
The GBP/USD closed at 1.33229 after placing a high of 1.33856 and a low of 1.32911. The GBP/USD pair tried to rise and post gains for Monday but failed to do so and continued its bearish streak for the third consecutive day. The rise in GBP/USD pair in the earlier trading session on Monday was due to the hopes that there was little progress in Brexit talks between U.K. and E.U. to settle disputes on several issues, including the fishing quotas.
The rise in British Pound was due to the latest comments from French European Affairs Minister Clement Beaune. On Monday, he said that he hoped to see an agreement in the next few days and called on negotiators to leap required. He acknowledged that two sticking issues, U.K. fishing waters and the so-called level-playing field for business, are still unresolved.
As both sides have already warned each other that the time was running out, a French presidency official said on Monday that Britain should clarify its positions and consult to find a Brexit deal on its association with the European Union. He added that the E.U. also has the interest to fight for, to give fair competition for its businesses and fishermen. He said that the Union has made a clear and balanced offer for a future partnership with Britain and that the E.U. will not accept a substandard deal that would not respect the E.U.’s interests.
On the other hand, Boris Johnson’s officials believed that the Brexit trade deal could be reached within days if both sides continue working in good faith to resolve fishing rights’ big obstacle. The U.K.’s Foreign Secretary Dominic Raab called on the E.U. to recognize that regaining control over British waters was the question of sovereignty for Britain. He said that talks were going good and he believed a deal on fish might be achievable during the final week of talks.
These optimistic and hopeful comments from both sides added strength to the GBP/USD pair on Monday during the early trading session. Still, the currency pair failed to maintain its gains and started to decline and post losses for the day despite the broad-based U.S. dollar weakness due to insufficient macroeconomic data on the day.
On the U.S. dollar front, at 19:45 GMT, the Chicago PMI for November fell to 58.2 against the estimated 59.4 and weighed on the U.S. dollar. At 20:00 GMT, the Pending Home Sales for October also declined to -1.1% against the projected 1.1% and weighed on the U.S. dollar that capped further losses in GBP/USD pair.
From the Britain side, at 14:30 GMT, the M4 Money Supply for October from Britain was dropped to 0.6% against the forecasted 1.0% and weighed on British Pound and added further losses in GBP/USD pair. The Net Lending to Individuals for October also declined to 3.7B against the expected 4.7B and weighed on British Pound and supported the bearish momentum in GBP/USD pair. At 14:32 GMT, Mortgage Approvals for October raised to 98K against the anticipated 85K and supported British Pound and capped further losses in the currency pair.
Meanwhile, the GBP/USD pair’s bearish trend was continued for the third consecutive day because of the rising fears that the U.K. and E.U. will end up having no-deal at the end of the transition period that is due on December 31. Only a month has left behind to resolve both parties’ issues, and none of them has shown any lenience. If both sides failed to reach a deal by the end of the deadline, then the U.K. will be forced to trade with the E.U. under the World Trade Organization terms that will not be good for both sides.
Daily Technical Levels
Support Resistance
1.3316 1.3342
1.3301 1.3353
1.3290 1.3368
Pivot point: 1.3327
GBP/USD– Trading Tip
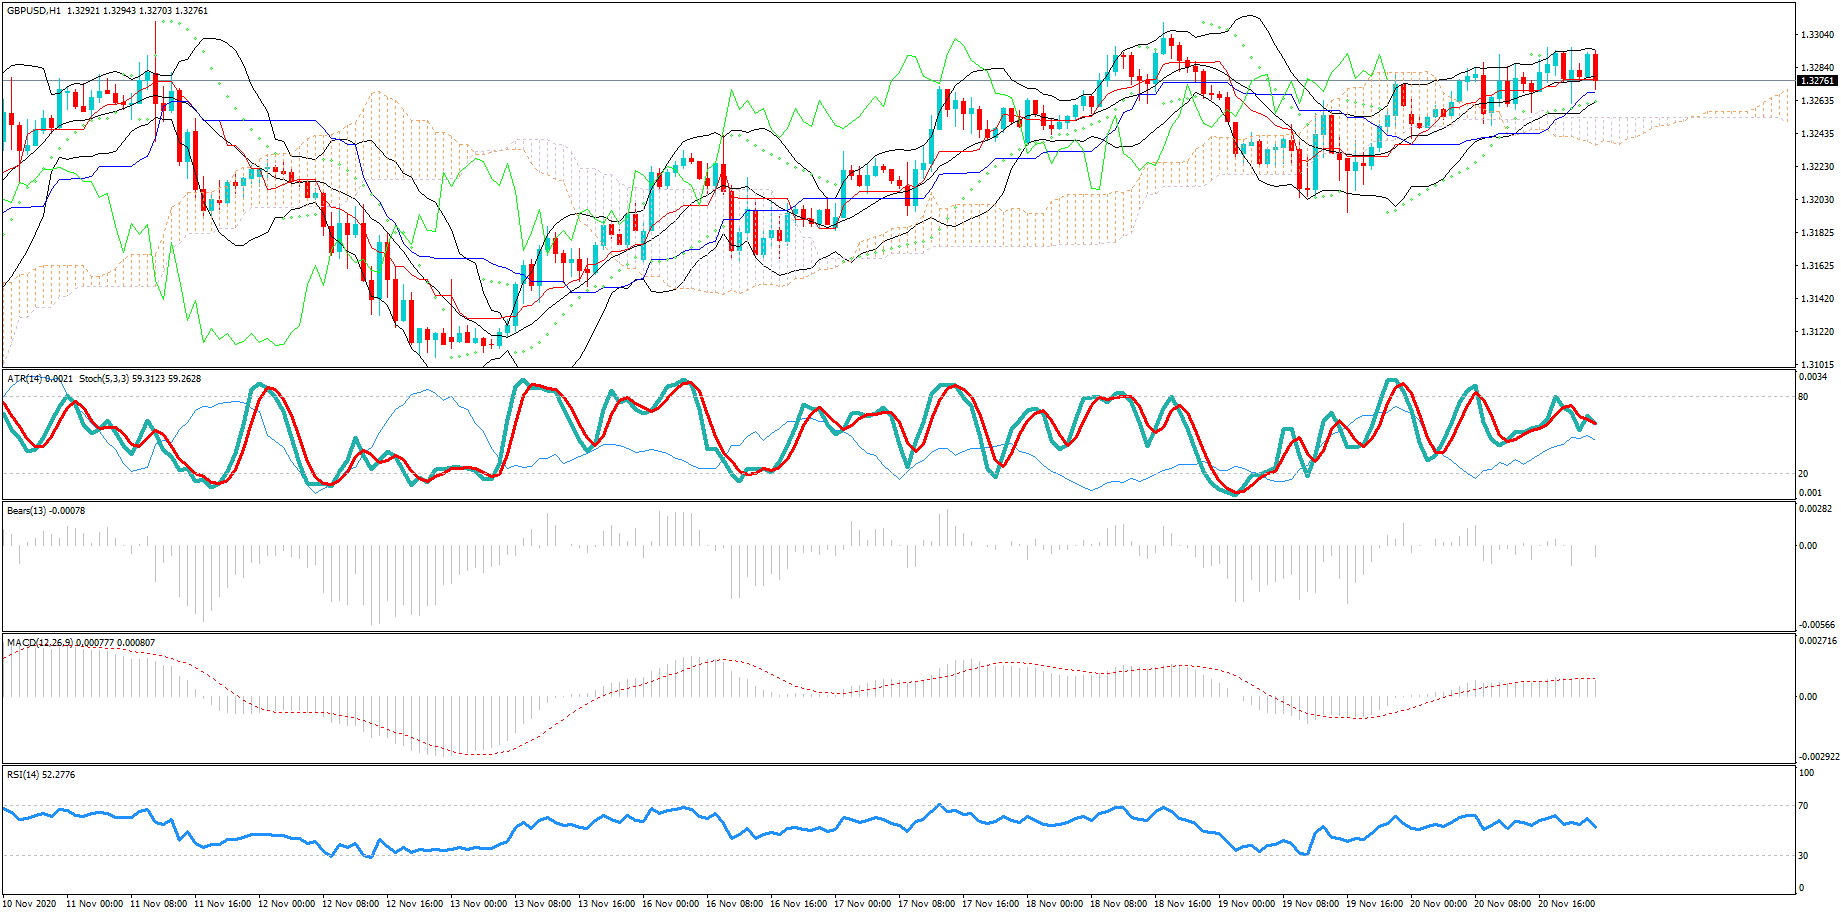
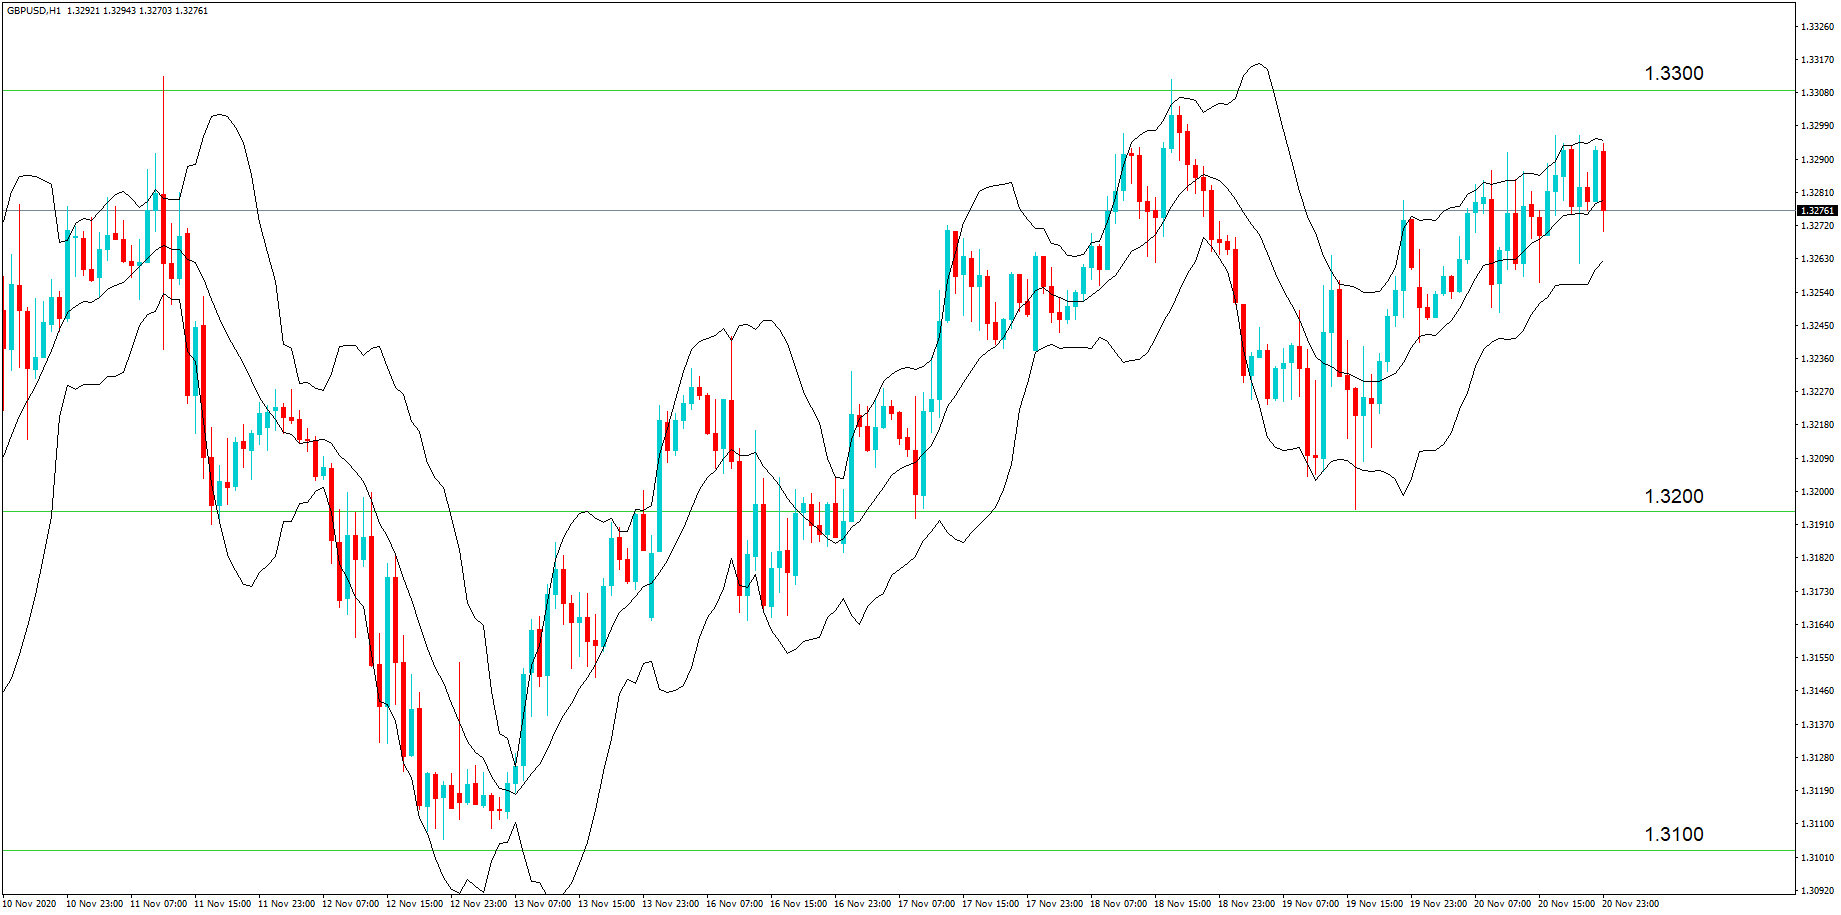
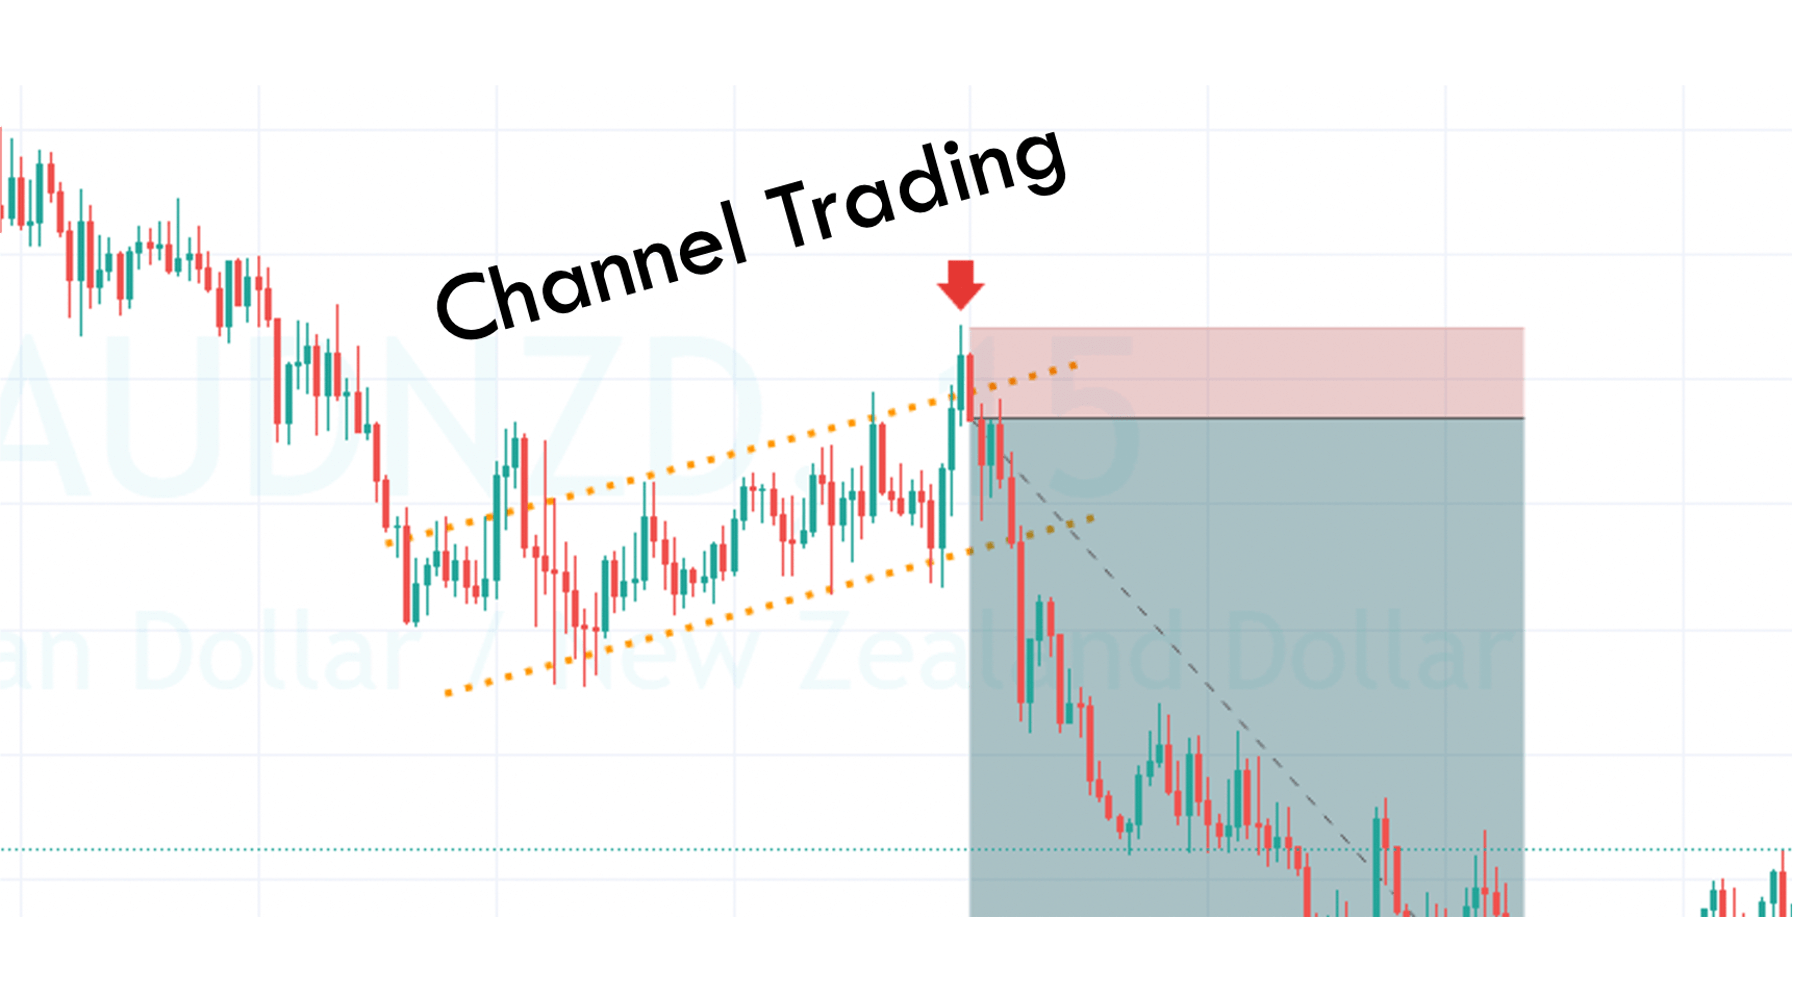
The GBP/USD is trading sideways, within a narrow trading range of 1.3397 – 1.3304. The market is likely to exhibit choppy sessions until this narrow trading range gets violated. On the higher side, the GBP/USD is facing a triple top level at the 1.3397 level; however, the bullish breakout of the 1.3397 level can trigger a buying trend until the 1.3454 level. On the lower side, the Cable is supported over 1.3350 level, supported by an upward channel on the four hourly charts. The MACD suggests a buying trend, and we should look for a buy trade over the 1.3325 level or 1.3400 level today.
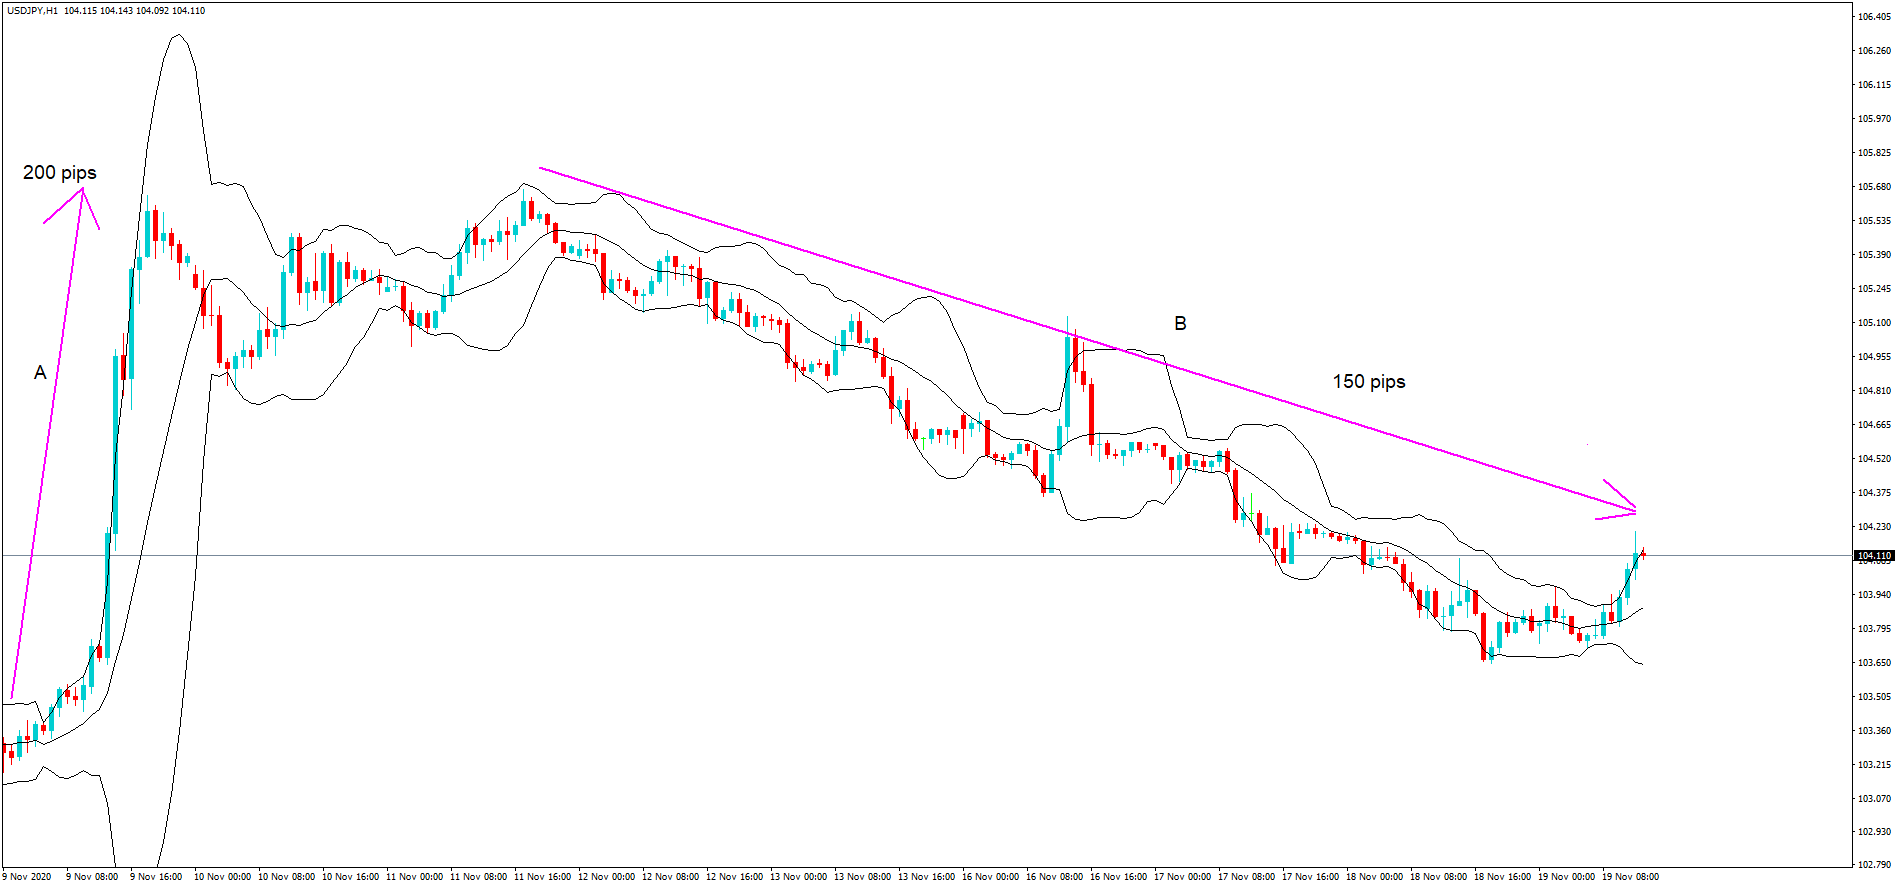
USD/JPY – Daily Analysis
The USD/JPY pair was closed at 104.289 after placing a high of 104.384 and a low of 103.830. After placing losses for two consecutive days, the USD/JPY pair rose on Monday as the U.S. dollar rebounds.
The broad-based U.S. dollar weakness in the early trading session pushed the USD/JPY pair lower after the hopes for the U.S. stimulus measure raised. However, Wall Street’s main indexes’ poor performance allowed the U.S. dollar to remain firm against its peers. The Dow Jones Industrial Average and the S&P 500 indexes lost about 1.2% and 0.78% respectively on Monday, which added strength to the U.S. dollar and pushed the USD/JPY pair higher.
Meanwhile, on Monday, US Health Secretary Alex Azar said that Americans could get their first shot of coronavirus vaccine before Christmas if all thing went well. These comments from Azar added further strength in risk-sentiment and weighed on the safe metal Japanese Yen that added gains in USD/JPY pair. Furthermore, on Monday, Moderna applied for emergency authorization with the U.S. Food and Drug Administration to start using its vaccine to reduce the effect of coronavirus. Pfizer and BioNtech, which has already filed for similar FDA approval earlier this month, sent the first mass shipment of its COVID-19 vaccine to Chicago through United Airlines on Friday. This positive news from the drug companies added optimism in the market and weighed on the safe-haven Japanese Yen that added further gains in the USD/JPY pair.
On the data front, at 04:50 GMT, the Prelim Industrial Production for October from Japan raised to 3.8% against the forecasted 2.3% and supported the Japanese Yen that capped further gains in the USD/JPY pair. The Retail Sales for the year from Japan stayed the same as expected by 6.4%. At 10:00 GMT, the Housing Starts for the year came from Japan came in as -8.3% against the forecasted -9.0% and supported the Japanese Yen.
On the U.S. dollar front, at 19:45 GMT, the Chicago PMI for November declined to 58.2 against the expected 59.4 and weighed on the U.S. dollar that capped further gains in the USD/JPY pair. At 20:00 GMT, the Pending Home Sales for October fell to -1.1% against the estimated 1.1% and weighed on the U.S. dollar that capped further gains in the USD/JPY pair.
Another factor involved in the risk sentiment that supported the upward momentum of the USD/JPY pair on Monday was the start of a brief session of Congress over the issue of a second stimulus bill for the coronavirus pandemic. The Democrats and Republicans were under dispute over the size of the stimulus package, and now that the Presidency has shifted from Republicans to Democrats after the victory of Joe Biden, it could be expected that a massive stimulus is on its way that would curb the effects of COVID-19 and support the risk sentiment of the market. The improved risk demand added pressure on the safe-haven Japanese yen and supported the USD/JPY pair on Monday. Another factor involved in the gains of the US/JPY pair was Pfizer’s vaccine’s shipment to Chicago on Monday, along with the latest application by Moderna to FDA for emergency use authorization of its vaccine.
Daily Technical Levels
Support Resistance
104.03 104.16
103.97 104.23
103.91 104.29
Pivot point: 104.10
USD/JPY – Trading Tips
The USD/JPY is trading with a sideways trading range of 104.475, holding below an immediate resistance level of 104.478. On the lower side, the safe-haven currency pair may find support at the 103.719 level. The pair seems to disrupt the resistance level of 104.478, and if this happens, the USD/JPY may soar until the next resistance area of 105.030 level. The MACD and RSI support the buying trend, but we should only take buying positions over the 104.500 level today. Good luck!


