On Monday, the market continues to trade sideways due to a lack of high impact economic events. Last week, the current account balance from the U.S. showed a deficit of 104B against the expected 101B deficit and weighed on the U.S. dollar, which dragged the currency pair USD/JPY on the downside. In his speech on Friday, Fed Chair Jerome Powell suggested and demanded from Congress to ramp up the federal relief spending program. According to Powell, the government should aid the states and provide more unemployment benefits along with the public health measures to keep the economy afloat.
Economic Events to Watch Today
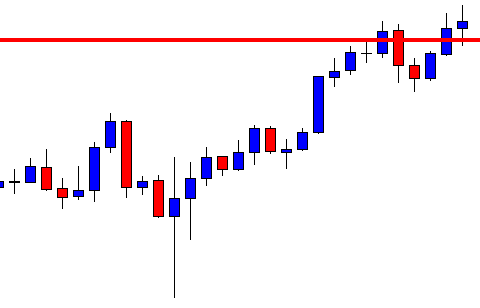
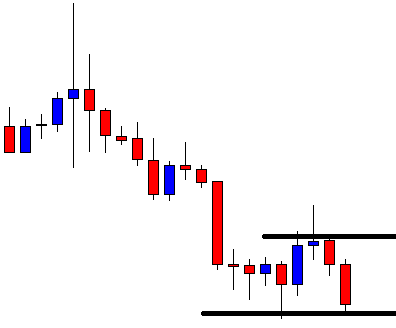
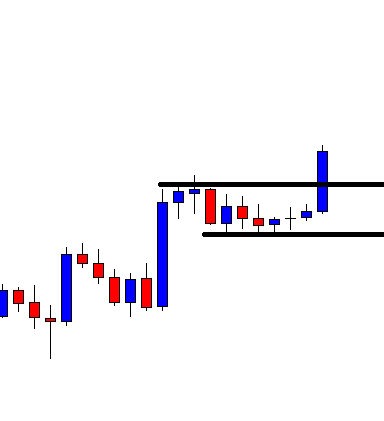
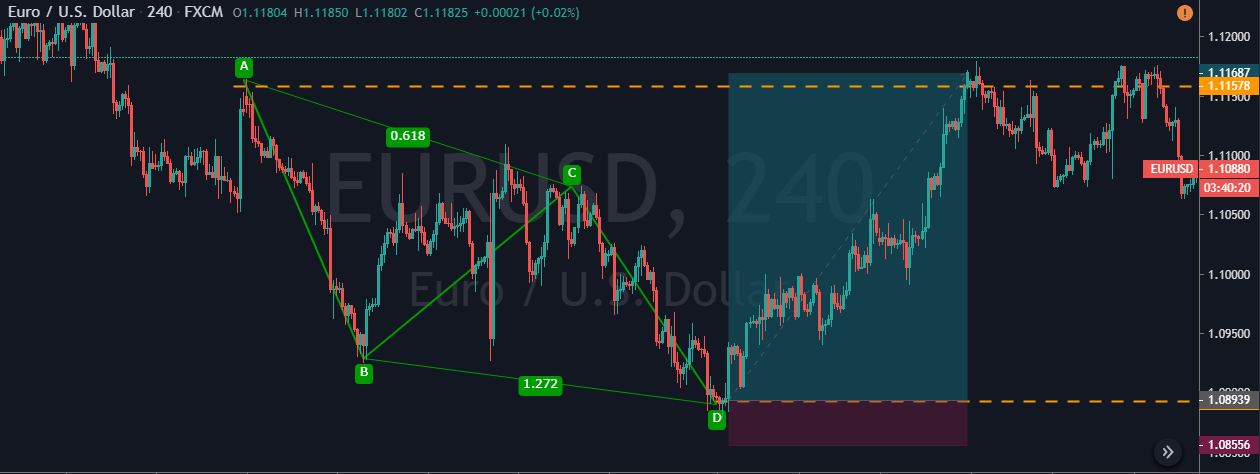
EUR/USD – Daily Analysis
The EUR/USD closed at 1.11766 after placing a high of 1.12541 and a low of 1.11679. Overall the movement of EUR/USD remained bearish throughout the day. On Friday, the EUR/USD pair extended its losses and followed its previous day’s bearish trend for the 4th consecutive day and posted losses for the second consecutive week. The pair’s prices moved to 13th day lowest level on the back of risk-off market sentiment after the increased fears of the second wave of coronavirus and intensified US-China tussles.
The risk-off market sentiment was caused by the rising fears of renewed lockdown restrictions throughout the world after several reported infectious cases continuously increased. As well as, the US-China conflicts showed signs of cooling down and weighed on risk sentiment, which ultimately dragged the EUR/USD pair downward.
Meanwhile, E.U. leaders held a virtual summit via video conference on Friday to discuss and finalize the coronavirus recovery plan. However, the video summit failed to strike a compromise on the proposed rescue fund, and the decision remained pending until the next budgetary talks in July.
The European Commission President, Ursula von der Leyen, said that member states had severe differences on many items but agreed on the desire to strike a deal ASAP. This weighed severely on the single currency Euro; hence, the pair EUR/USD moved downward.
Friday’s summit was just the starting point for the talks on European Commission’s $2 trillion (1.85 T euros) budget proposal. The new 750 billion euros plan was also included in the budget, which was launched to help the European economy after COVID 19 crisis. The scheme was set to provide loans of worth 250 B euros and grants to E.U. member states worth 500 B euros. A credit would finance this all that the European Commission would take from international financial markets.
Furthermore, Leyen also urged rich nations to share any future coronavirus vaccine with the poorer neighbors. She said as she launched the Brussels pandemic strategy that member states would work together to find a vaccine without competition and also suggested other world powers to do the same.
On the data front, the German Purchasing Price Index (PPI) for May was released at 11:00 GMT, which showed a decline of 0.4% against the expected decline by 0.3% and weighed on Euro. At 13:00 GMT, the Current Account Balance from the European Union showed a surplus of 14.4B in April. The weaker than expected data from the Eurozone weighed on EUR and dragged the pair EUR/USD further on the down track on Friday. On the other hand, China and E.U. top leaders are set to hold an annual summit on Monday, which will be a crucial factor to look at next week.
Daily Support and Resistance
- R3 1.1224
- R2 1.1211
- R1 1.1193
Pivot Point 1.1181
- S1 1.1163
- S2 1.1151
- S3 1.1133
EUR/USD– Trading Tip
The EUR/USD pair is trading with a slightly bullish bias at 1.1207, but the overall trend still seems bearish. On the hourly chart, the 50 periods EMA is likely to weigh on the EUR/USD pair and may keep it in a selling zone below 1.1209 today. The support is likely to be found around the 1.1170 level. Besides, the leading indicators are mixed; for example, the RSI is suggesting a selling bias, while the MACD is indicating a bullish bias. On the higher side, a bullish breakout of the 1.1208 level can extend bullish bias until 1.1254 level today. Let us look for buying trades over 1.1170 and selling below the same today.
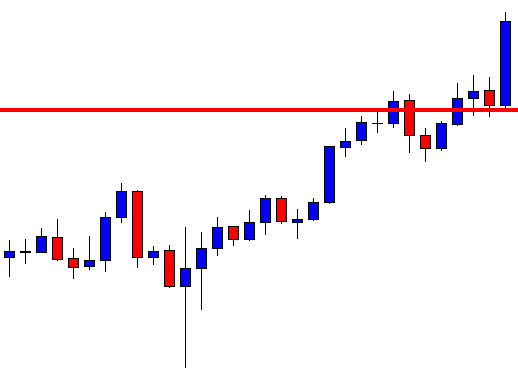
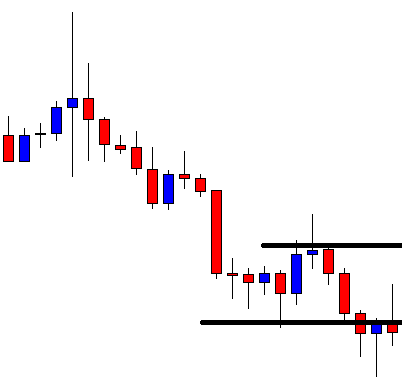
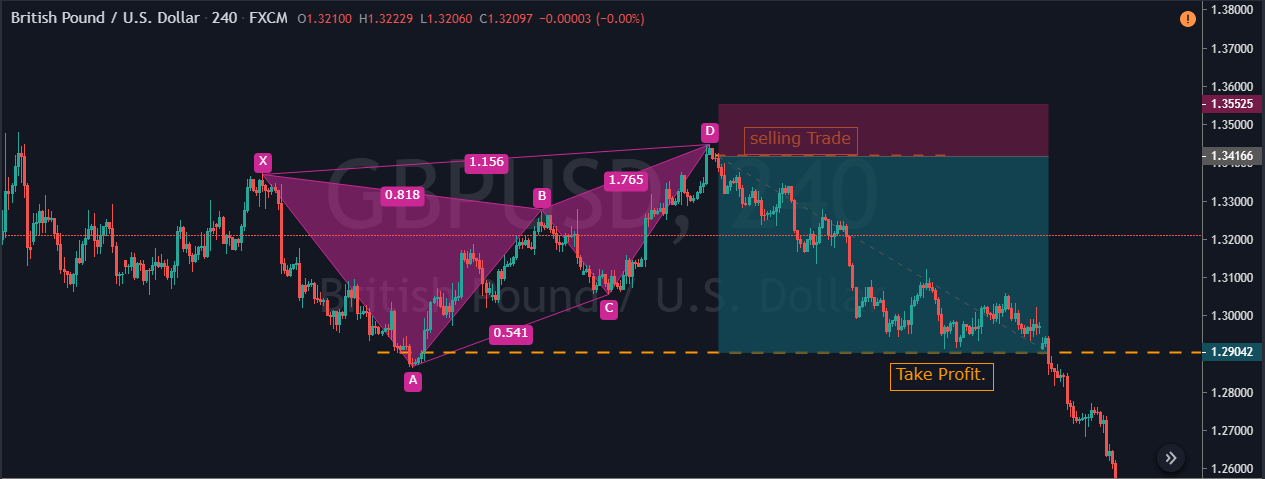
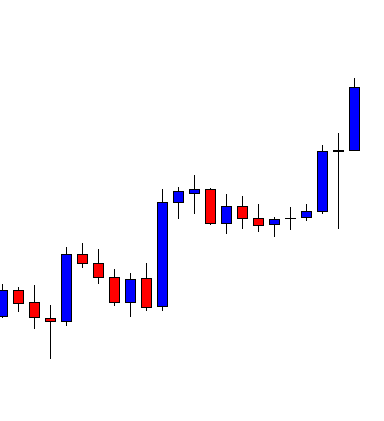
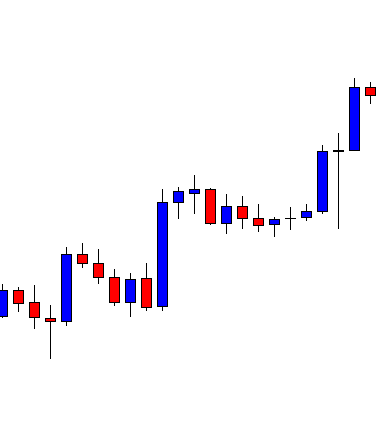
GBP/USD – Daily Analysis
The GBP/USD closed at 1.23511 after placing a high of 1.24559 and a low of 1.23439. Overall the movement of GBP/USD pair continued to be bearish throughout the day. The GBP/USD pair dropped for the 4th consecutive day on Friday and posted losses on the back of the increased risk-off market sentiment, insufficient BoE support, and rising coronavirus concerns. The Pound suffered back-to-back weekly losses as the risks of no-deal Brexit and the potential second wave of coronavirus will eventually offset the monetary stimulus of BoE.
Investors start selling British Pound on the view that the recent stimulus of Bank of England might not be sufficient to overcome the economic crisis as the number of infected cases increased day by day in an environment of potential no-deal Brexit. After an uptick in the reported coronavirus cases from the U.S. & China, the U.S. dollar gained and exerted a negative impact on GBP/USD pair on Friday. However, risks to no-deal Brexit played an essential role in the downward movement of the GBP/USD pair.
The PM Boris Johnson has repeatedly ruled out the extension to the Brexit transition period despite the coronavirus crisis. The talks between Brussels & London have been compromised due to the pandemic, and this fact cannot be denied. However, Johnson has still denied calling for an extension in the transition period. This has left only two options on the table, either strike a deal with possible compromises or go for a no-deal Brexit on December 31. Both parties have been disputing over two basis points, one is fishing access, and the other is the level playing field.
Meanwhile, at 11:00 GMT, the Retail Sales in May from Great Britain surged to 12.0% from the forecasted 6.3% and supported British Pound. The Public Sector Net Borrowing was increased to 54.5B from the expected 49.3B and weighed on British Pound that also dragged the GBP/USD pair further.
Daily Support and Resistance
- R3 1.2378
- R2 1.2369
- R1 1.2357
Pivot Point 1.2348
- S1 1.2337
- S2 1.2327
- S3 1.2316
GBP/USD– Trading Tip
On Monday, the GBP/USD is trading is showing a slight bullish correction to trade at 1.2409 level. However, it is holding right below 50 periods EMA which is likely to extend resistance around 1.2415 level. On the downside, the GBP/USD may find support around the value of around 1.2340, and the continuation of a selling trade can lead Sterling prices to be further lower until 1.2278 level. The MACD and RSI are holding around in a buying zone right now. Therefore, we cannot simply open a sell trade here. Let us wait for taking sell trades below 1.2348 level.
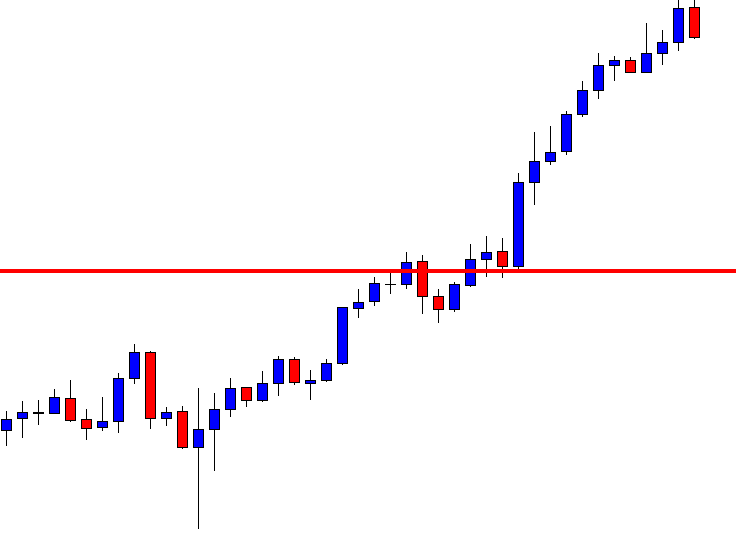
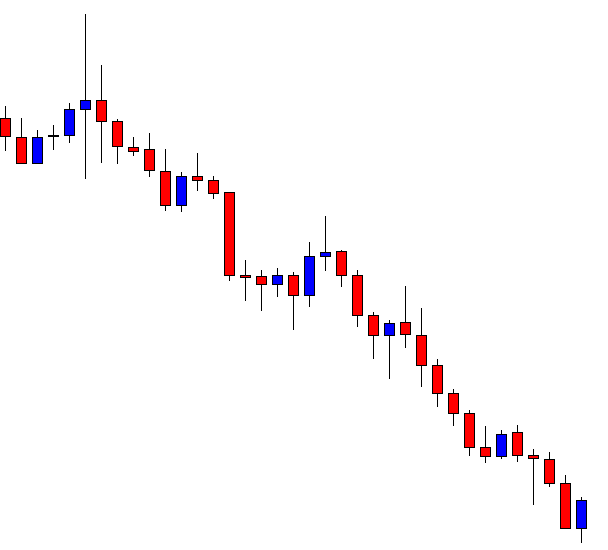
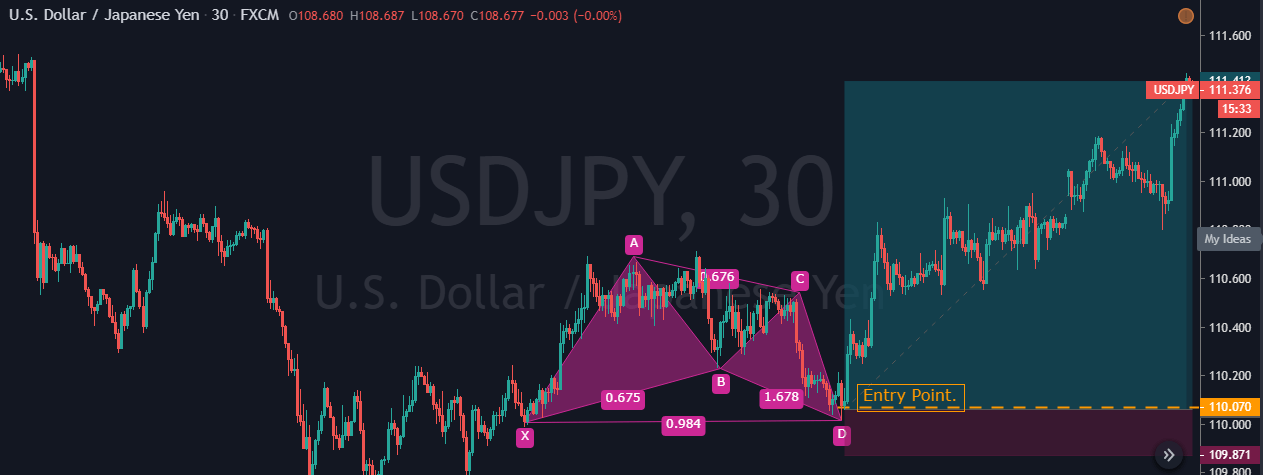
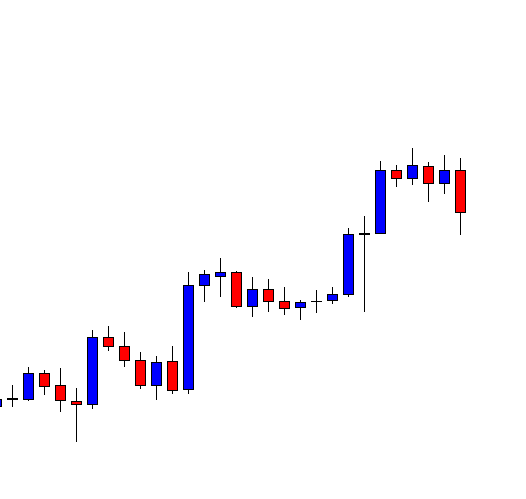
USD/JPY – Daily Analysis
The USD/JPY pair was closed at 106.863 after placing a high of 107.056 and a low 106.764. Overall the movement of USD/JPY remained bearish throughout the day. The USD/JPY posted losses for the 3rd consecutive day of Friday Bank of Japan kept policy steady this week after increasing stimulus in March & April. The bank also issued its April’s monetary policy meeting minutes on Friday. According to the latest minutes issued by Bank of Japan, the governor Haruhiko Kuroda said that inflation would persist well below its 2% target for years to come.
At 4:30 GMT, the National Core Consumer Price Index for the year showed that nationwide CPI, which includes oil but excludes volatile fresh food prices, fell 0.2% in May from the expected fall of 0.1% and weighed on Japanese Yen. The Core Consumer prices from Japan fell for the second straight month during May, reinforced deflation expectations. It also raised challenges for policymakers who were battling the coronavirus pandemic to revive the economy.
Decreased CPI will make the job of BoJ more complicated in respect of restoring growth and inflation during the pandemic as the nation had seen the worst economic slowdown since the war. Many board members of BoJ warned that monetary support from banks in coordination with the government was needed to prevent Japan from returning to deflation. On Friday, in its meeting of April 27, BOJ eased policy further and informed a rise in buying corporate bonds and commercial paper. BoJ also promises to buy an unlimited JCBs. Japan also lifted all coronavirus related restrictions on domestic travel on Friday as the PM Shinzo Abe called people to go for sightseen and attend events to help Japan’s economy to recover.
On the other hand, the current account balance from the U.S. showed a deficit of 104B against the expected 101B deficit and weighed on the U.S. dollar, which dragged the currency pair USD/JPY on the downside.
In his speech on Friday, Fed Chair Jerome Powell suggested and demanded from Congress to ramp up the federal relief spending program. According to Powell, the government should aid the states and provide more unemployment benefits along with the public health measures to keep the economy afloat.
Powell stressed that the economic recovery from the pandemic crisis will be challenging and that there would be no quick fix. He provided a cautionary stance over the U.S. economic outlook, which exerted a negative impact on the U.S. dollar and dragged the pair further.
Daily Support and Resistance
- R3 107.13
- R2 107.05
- R1 106.94
Pivot Point 106.85
- S1 106.74
- S2 106.65
- S3 106.54
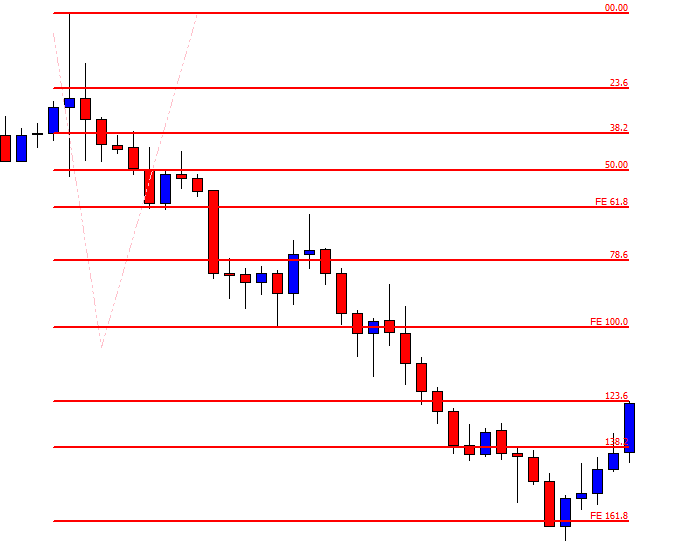
USD/JPY – Trading Tips
On Monday, the USD/JPY is trading at 106.914 level as it continues trading sideways in a wide trading range of 107.620 – 106.630. It failed to break above an immediate resistance level of 107.580. This level is working as resistance for USD/JPY, and the 50 periods EMA is also prolonging strong resistance at 107.580 zones while immediate support lingers nearby 106.600. The USDJPY bearish trend can trigger a sell-off unto the next support level of the 106.017 level today. Let’s wait for the USD/JPY to test the 107.650 level before entering a sell in the USD/JPY.
Good luck!