The U.S. dollar, which behaves like a safe-haven asset during political uncertainty & market turmoil, rose to a one-week high against the basket of 6 currencies, but it started to erase its daily gains in late London Session. Tensions between U.S. &China have increased since the coronavirus outbreak, over which both countries have exchanged accusations of cover-ups and lack of transparency with the world. The signs for easing tensions between the two biggest economies of the world are decreasing day by day and have created an uncertain environment in the market weighing on the market.
Economic Events to Watch Today
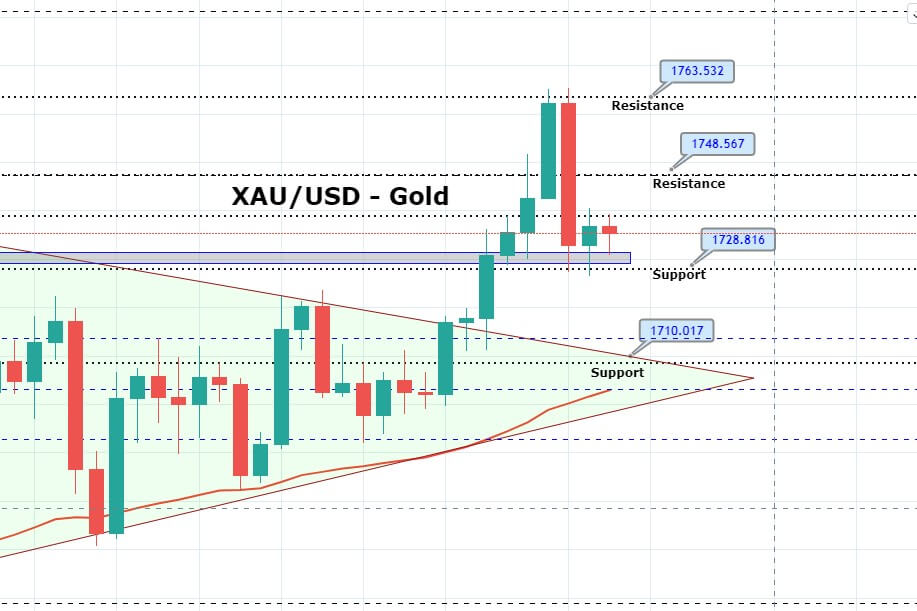
EUR/USD – Daily Analysis
The EUR/USD pair was closed at 1.08964 after placing a high of 1.09144 and a low of 1.08702. Overall, the EUR/USD pair showed a null movement on Monday as the open and closed levels were almost the same.
On Monday, the EUR/USD pair moved in a tight range between 1.087 to 1.089 while managed to cut earlier losses and touched 1.091 level. The upbeat movement in the previous trading session on Monday for the pair was due to the German IFO Business Climate, which came in favor of EUR for May.
At 11:00 GMT, the German Final GDP for the quarter came in line with the expectations of -2.2% and had null-effect on the currency pair. However, at 13:00 GMT, the German IFO Business Climate, which measures the business conditions and expectations from Eurozone, was released as 79.5 against the expectations of 78.3 and April’s 74.2. The Index rebounded from the expectations and recovered from its worst decline in April on the reopening of Europe’s largest economy, which boosted corporate hopes.
At 17:56 GMT, the Belgian NBB Business Climate was dropped by 34.4 points against the expected decline of 29.7 and April’s 36.1. The more than expected decline in Belgian Business Climate weighed on EUR currency and dragged down the pair EUR/USD in late sessions.
In the meantime, the pair kept looking at U.S. dynamics for near term directions with the latest US-China & Hong Kong conflict which has reduced the importance of coronavirus development as the primary driver of global price action.
In this time, when investors are cautious about adding to their equity holdings because of the uncertain conditions of the post-lockdown world, Germany’s IFO institute survey for May granted some relief to them.
The lockdown measures introduced in mid-March have put the global economy on track for a recession this year. In recent weeks, the world’s market has only been held up due to the stimulus measures taken by central banks.
EUR remained steady on Monday near 1.09 level and recovered from earlier losses, as the focus of market participants shifted to the proposal the European Commission will release on Wednesday.
On Wednesday, the European Central Bank’s president Christine Lagarde will speak, and traders will be looking at it for fresh bids along with the EMU’s Consumer Confidence & Advanced Inflation data from Eurozone. On Tuesday, Consumer Confidence by the Conference Board is due to release. The Claims & Durable Goods Orders will be published on Thursday later this week.
Daily Support and Resistance
- R3 1.0965
- R2 1.094
- R1 1.092
Pivot Point 1.0895
- S1 1.0875
- S2 1.085
- S3 1.0829
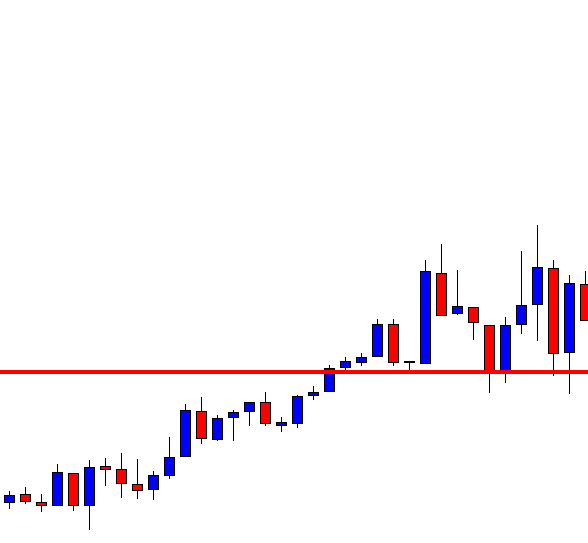
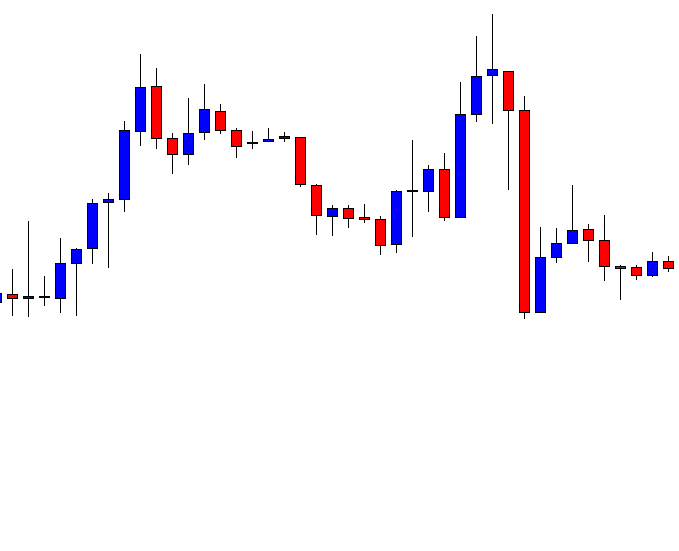
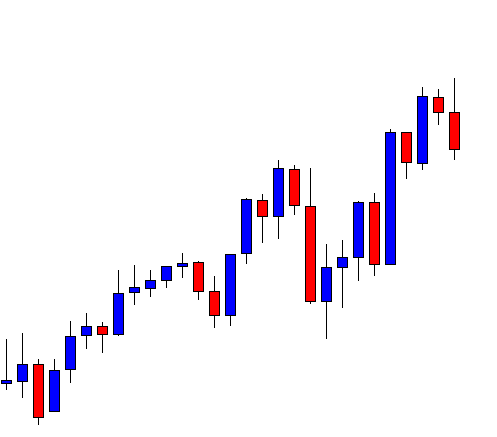
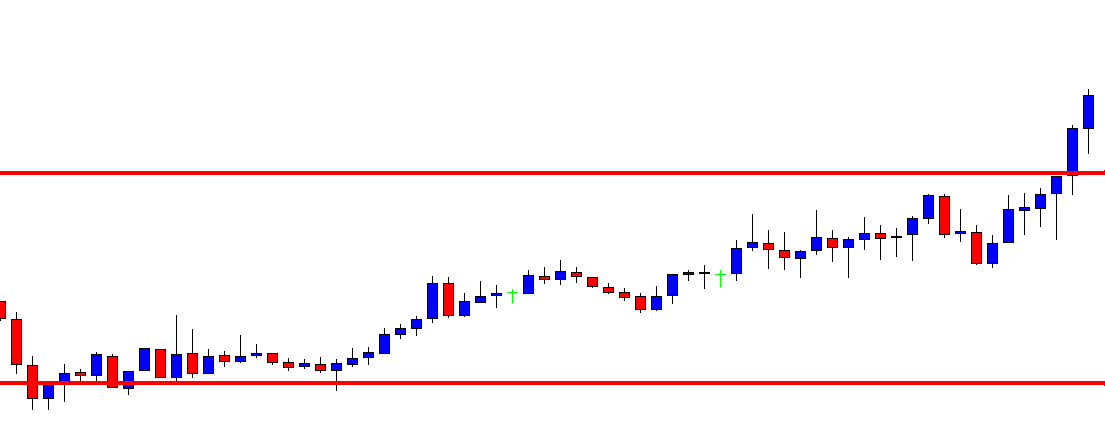
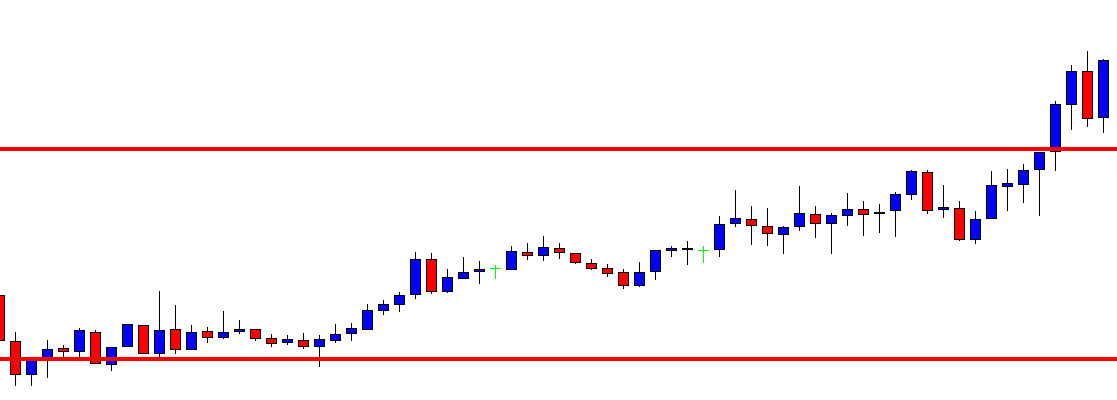
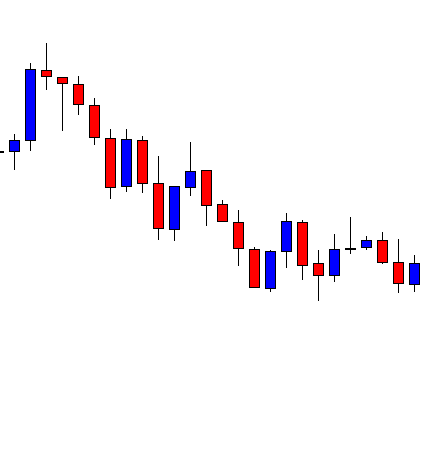
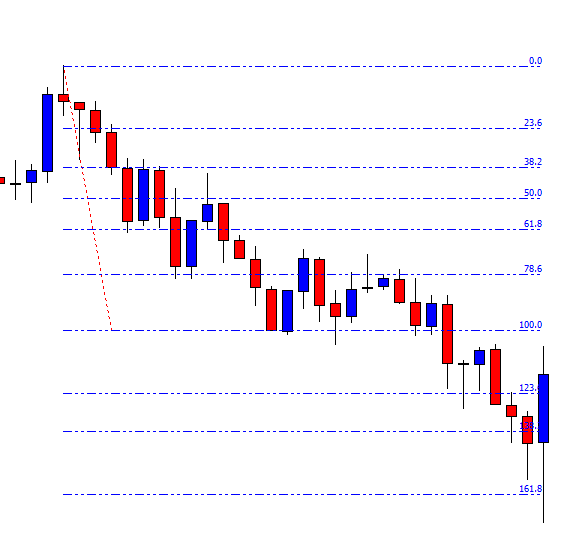
EUR/USD– Trading Tip
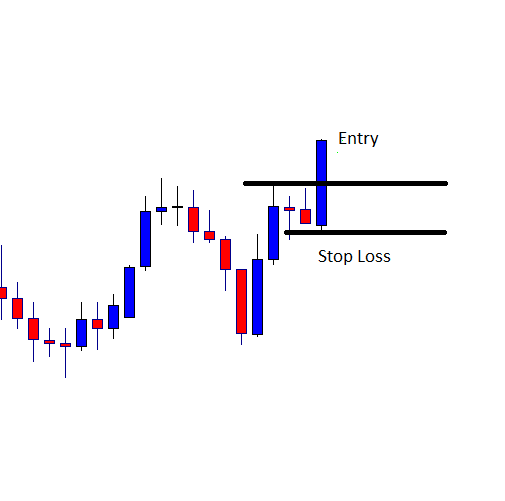
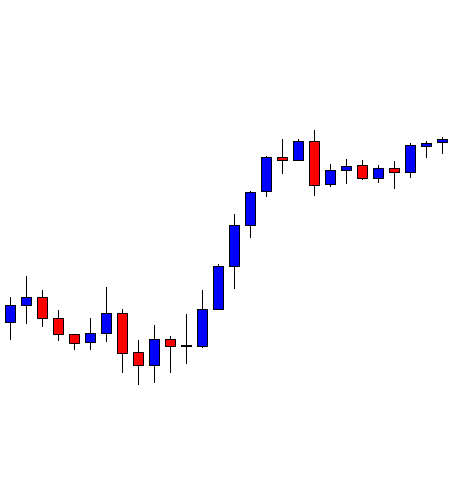
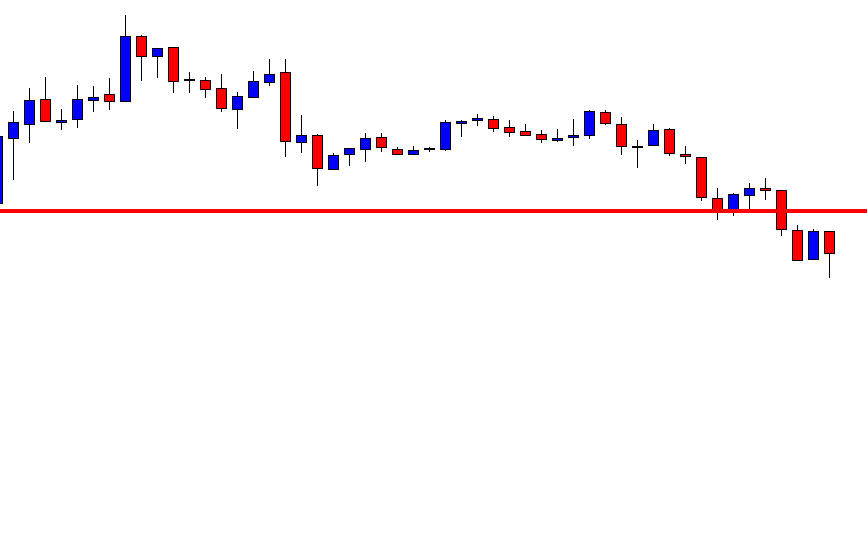
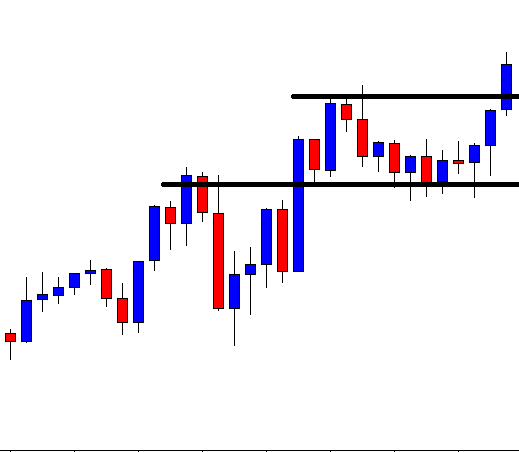
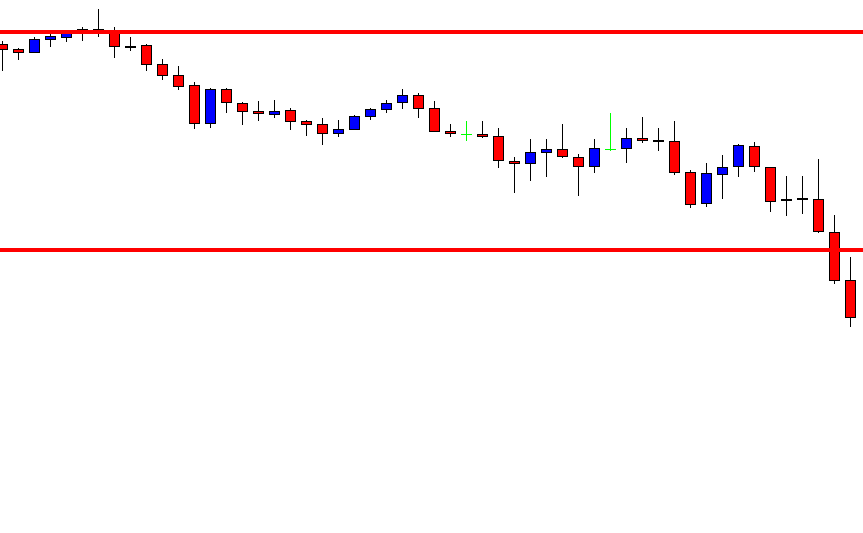
The EUR/USD pair is on a bullish run, trading over 1.0914 level, having violated the horizontal resistance level of 1.0914 level. Above 1.0914, we may see the EUR/USD prices heading further higher towards the next resistance area of 1.0590. The EUR/USD pair had completed 50% Fibonacci retracement at 1.0885 and has bounced off over this level. For now, the pair is holding over 50 EMA, which is also suggesting the chances of a bullish trend continuation. We should consider taking buying positions over 1.0894 today while selling should be preferred only below this level.
GBP/USD – Daily Analysis
The GBP/USD pair was closed at 1.21752 after placing a high of 1.22034 and a low of 1.21637. Overall the movement of GBP/USD pair remained flat throughout the day. The GBP/USD pair remained flat and moved on a consolidating range on Monday as investors were cautious about the relaxation of lockdown measures, which gave a push to equities while ding the U.S. dollar demand.
On Monday, the Prime Minister of the U.K. instructed officials to draw up plans to reduce the involvement of Huawei Technologies Co in the U.K.’s fifth-generation mobile networks in the wake of the COVID 19 outbreak.
Johnson gave his officials instructions to draw up plans for reducing China’s involvement in the 5G infrastructure of the U.K. to a scale of zero by 2023. It looks like China’s pandemic handling has triggered calls from U.K.’s PM to rethink having closer ties with China.
In January, the U.K.’s government decided to give Huawei a limited role in 5G wireless networks and fiber. PM Johnson has amicable ties with U.S. President Donald Trump, and it looks like Johnson has taken this step to improve his relationship with the U.S.
Furthermore, on Brexit front, the trade negotiations between E.U. & U.K. have been negative for Sterling throughout the session and will likely remain the same in the coming days. The chances for hard-Brexit have increased as the UK-EU transition period is coming closer day by day, and there are no signs of any deal happening sooner. However, calls to extend the transition period have made due to pandemic; this decision will have to be made by June 30. But PM Johnson and negotiating team from the U.K. has so far been unequivocal that no extension would be made.
Johnson had articulated the Brexit deal with a clear timeline and has promised not to make any changes or compromise or bow to pressure for an extension. The deadline to call for an extension is coming up next month, and this has exerted downside pressure on GBP.
In the absence of any macroeconomic data from the U.K. and U.S. side due to bank holiday, the pair GBP/USD remained flat on Monday and continued its previous moves.
Daily Support and Resistance
- R3 1.225
- R2 1.2227
- R1 1.2209
Pivot Point 1.2186
- S1 1.2167
- S2 1.2145
- S3 1.2126
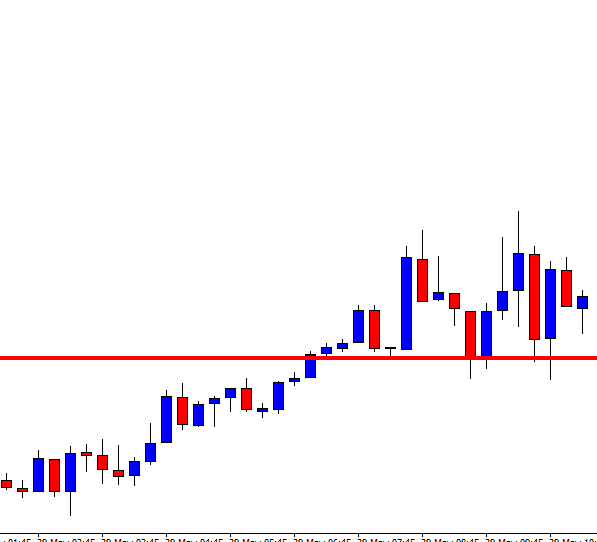
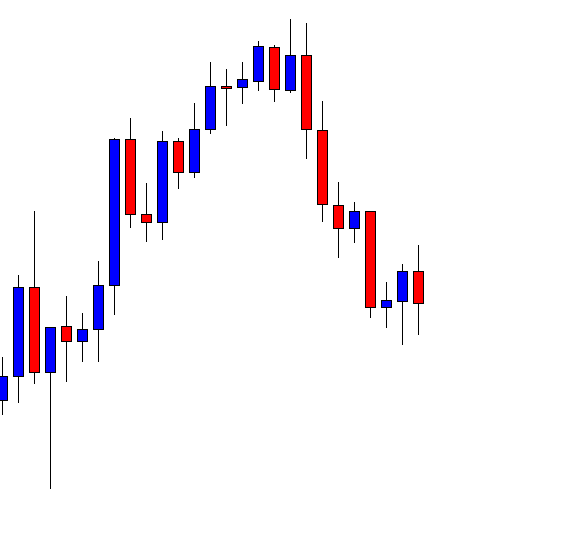
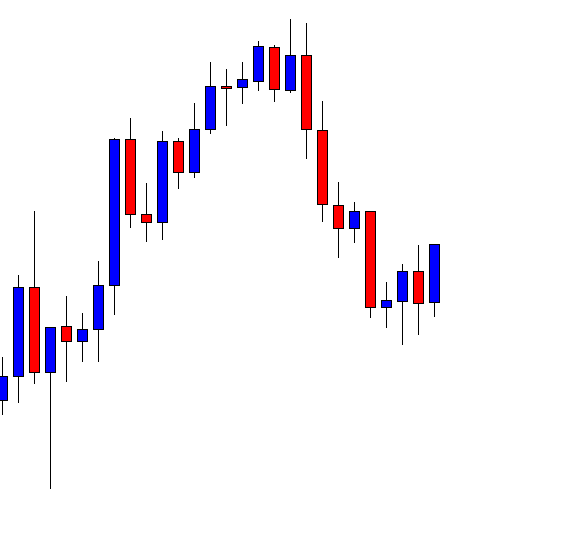
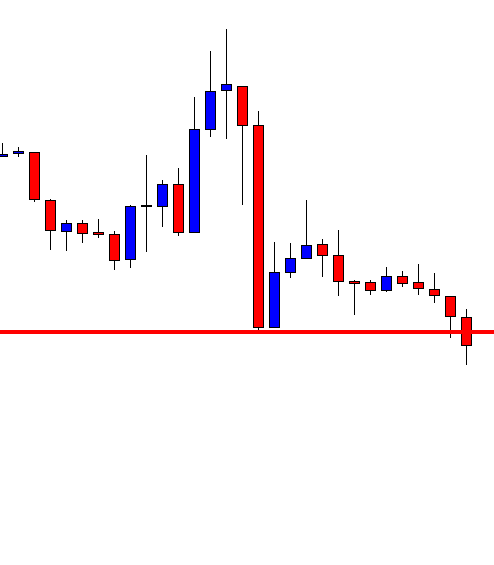
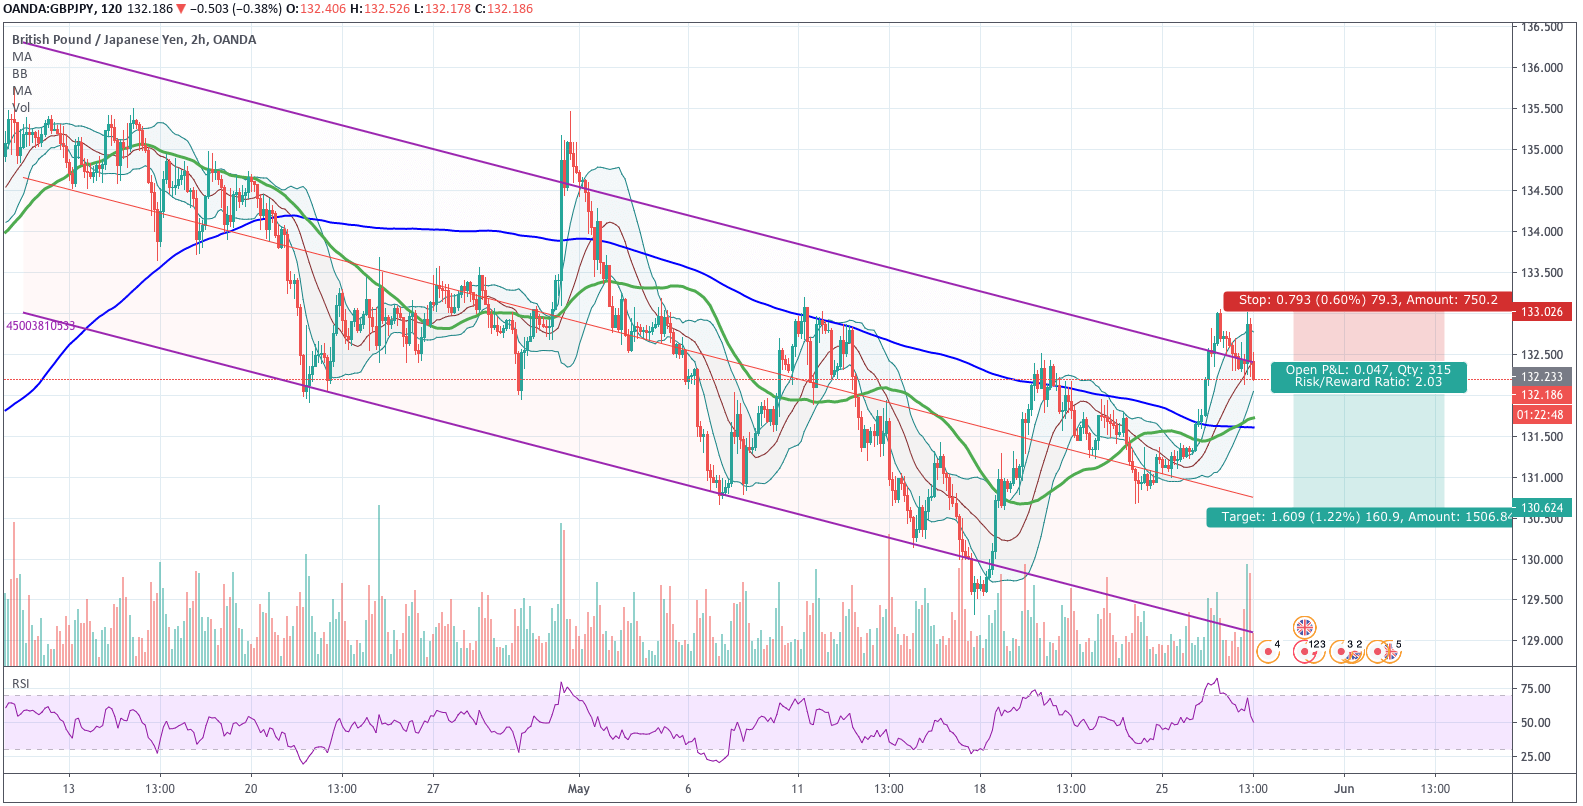
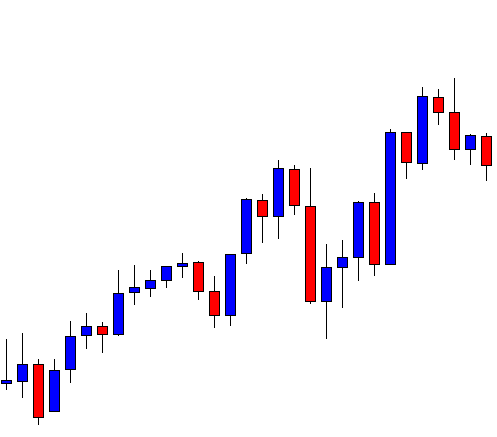
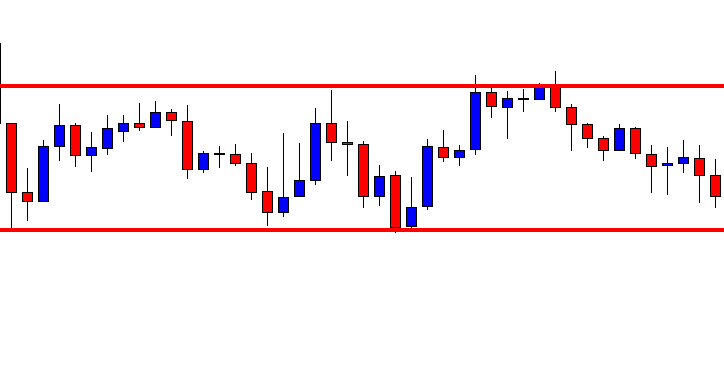
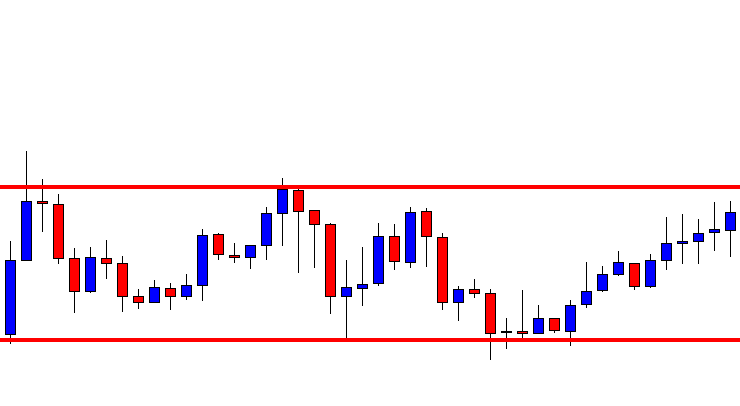
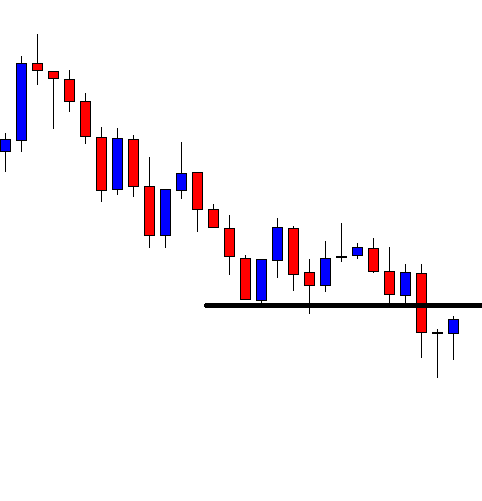
GBP/USD– Trading Tip
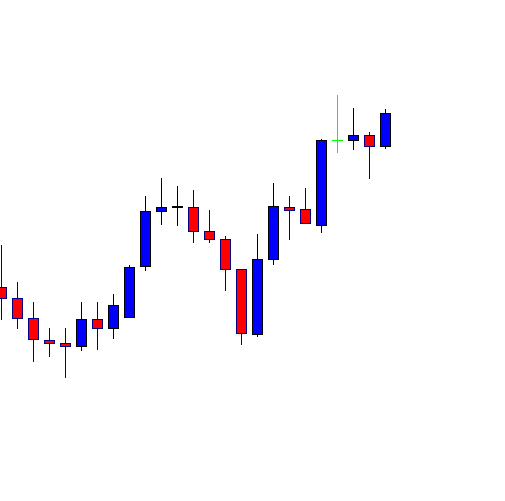
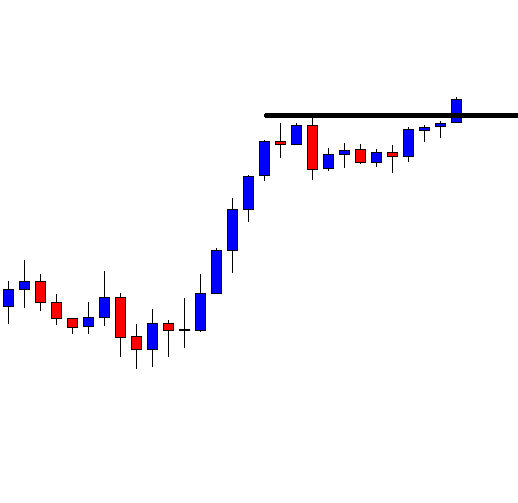
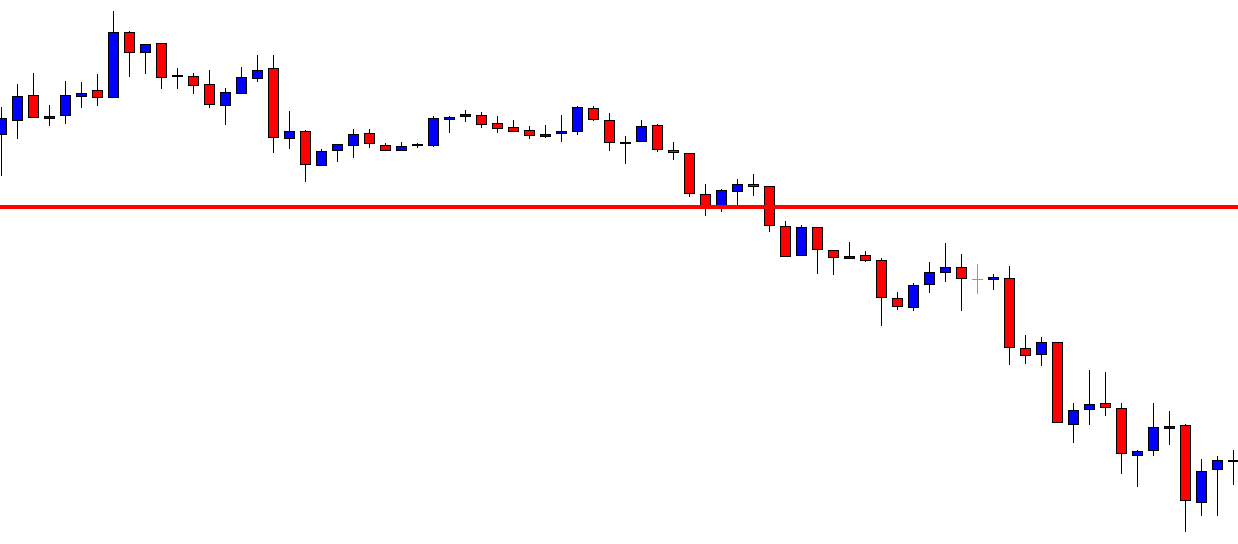
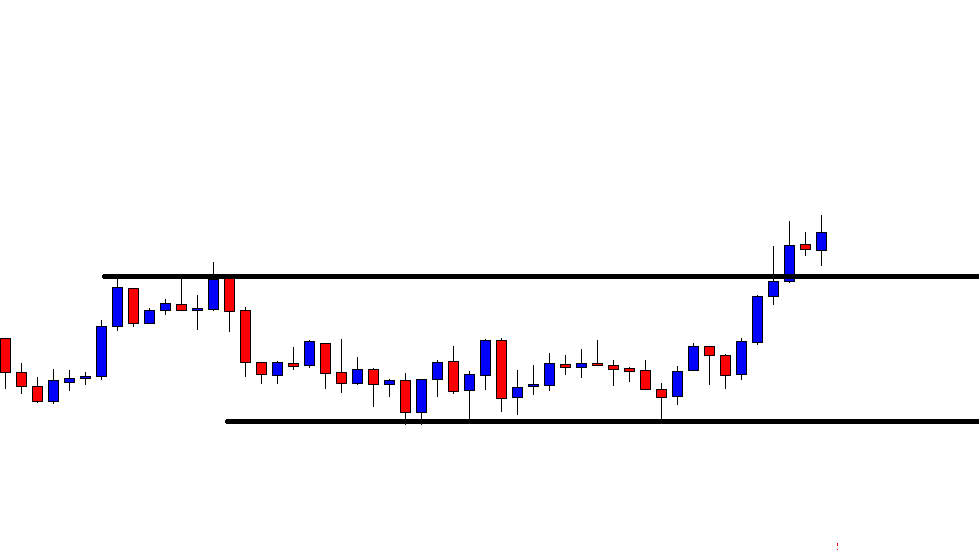
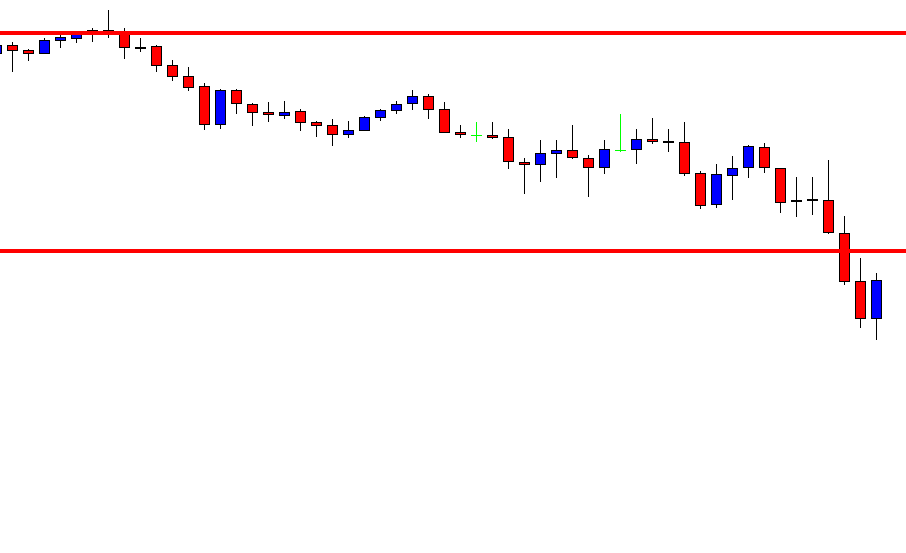
On Tuesday, the GBP/USD prices continue to trade in line with our previous forecast as the sideways trading range remains intact. The overall trading range remains 1.2170 – 1.2270. In the 4 hour timeframe, we can see a symmetric triangle pattern, which is exhibiting indecision among traders. On the downside, the GBP may gain support against the U.S. dollar around 1.2170 level, and violation of this level may extend selling until the next support area of 1.2080. Consider taking buying trades over 1.2186 and selling below the same level today.
USD/JPY – Daily Analysis
The USD/JPY pair was closed at 107.704 after placing a high of 107.780 and a low of 107.556. Overall the movement of the USD/JPY pair remained bullish throughout the day. The USD/JPY pair fluctuated in a tight range of 15 pips because of the absence of American traders for Memorial Day.
On Monday, Japanese Prime Minister Shinzo Abe lifted the coronavirus state of emergency in Tokyo and other areas. The nationwide end of restrictions and reopening of businesses were to take effect as of Monday.
The Japanese PM also introduced a new plan for a new stimulus package to support the businesses and Japan’s economy hit by the COVID-19 pandemic. Abe said that Japan has managed to bring the epidemic under control, and the exit from it was in sight. However, this announcement from Abe had little to no impact on JPY’s movement against its rival currencies.
Meanwhile, on the US-China relation front, China’s move to impose a new security law on Hong Kong has escalated concerns about the stability of the city and global trade prospects, which upset the United States and thus, US-Sino relation worsen even more.
The U.S. dollar, which behaves like a safe-haven asset during political uncertainty & market turmoil, rose to a one-week high against the six currencies. Still, it started to erase its daily gains in the late London Session. Tensions between U.S. &China have increased since the coronavirus outbreak, over which both countries have exchanged accusations of cover-ups and lack of transparency with the world. The signs for easing tensions between the two biggest economies of the world are decreasing day by day and have created an uncertain environment in the market weighing on the market.
Furthermore, the USD/JPY pair moved very little on Monday amid thin trading conditions. At the same time, the U.S. dollar Index remained flat near 99.80 level throughout the day as investors showed no interest in the greenback. Moreover, the market participants will be looking at the release of the Corporate Service Price Index and All Industry Activity Index from Japan on Tuesday. From the American side, the Fed National Activity Index and New Homme Sales & C.B. Consumer Confidence data will be under consideration.
Daily Support and Resistance
- R3 108.03
- R2 107.91
- R1 107.8
Pivot Point 107.68
- S1 107.57
- S2 107.45
- S3 107.35
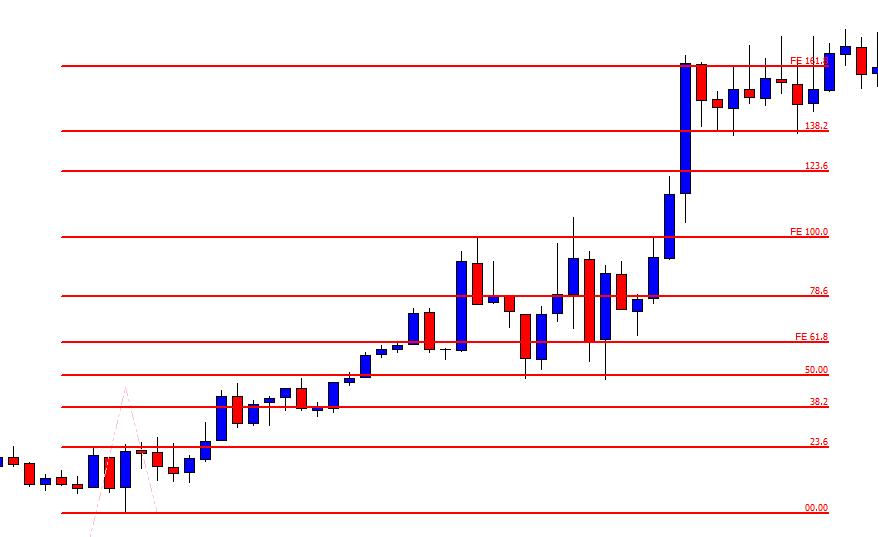
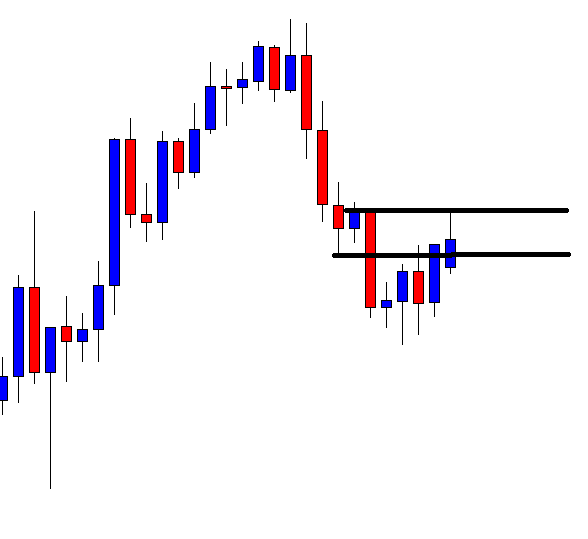
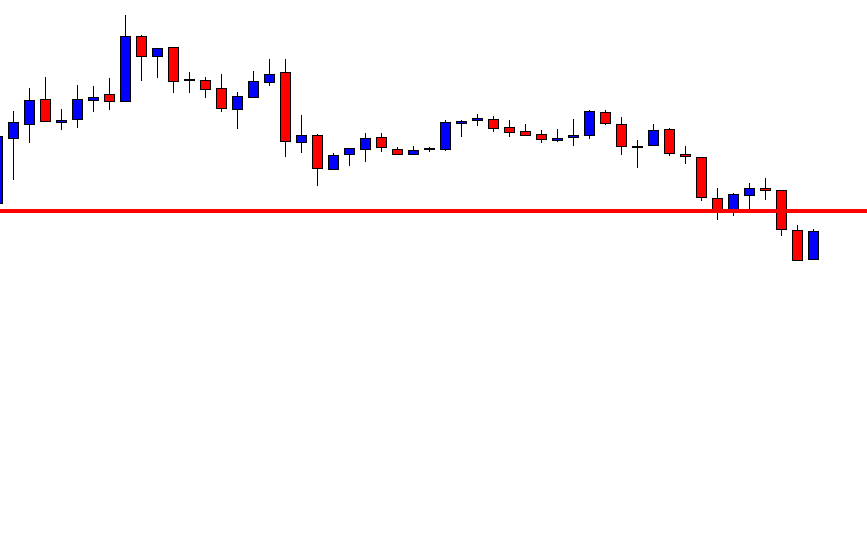
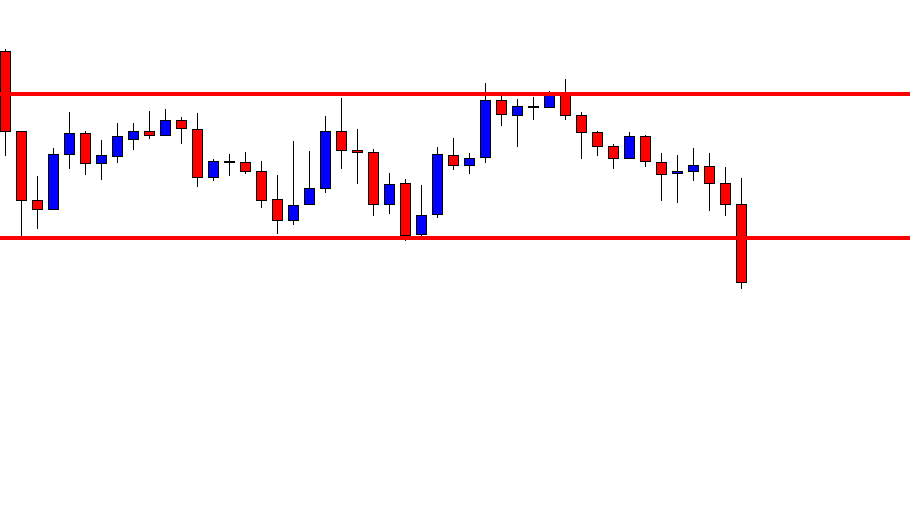
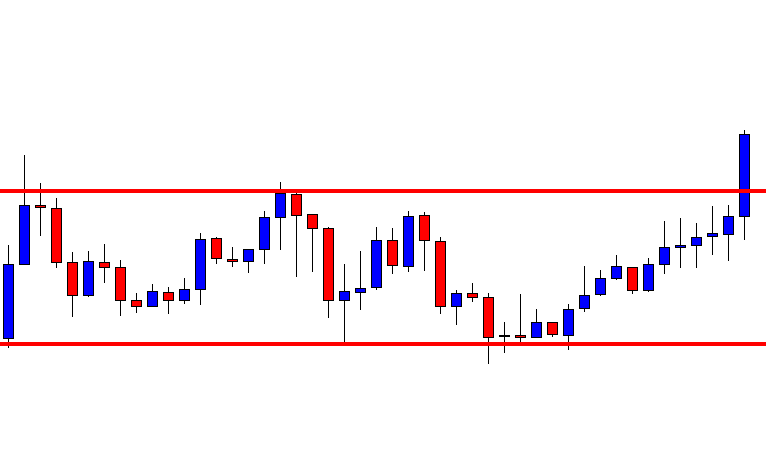
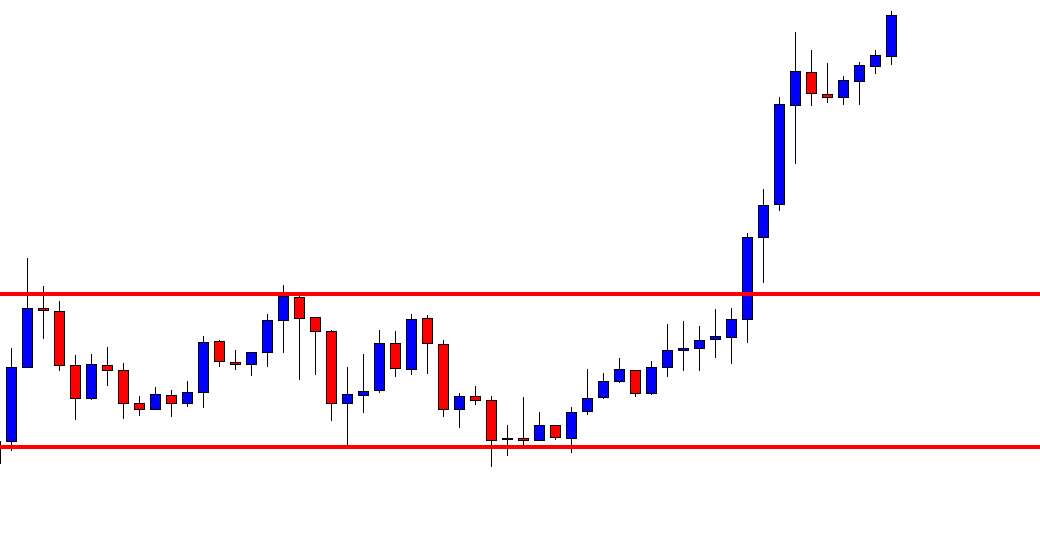
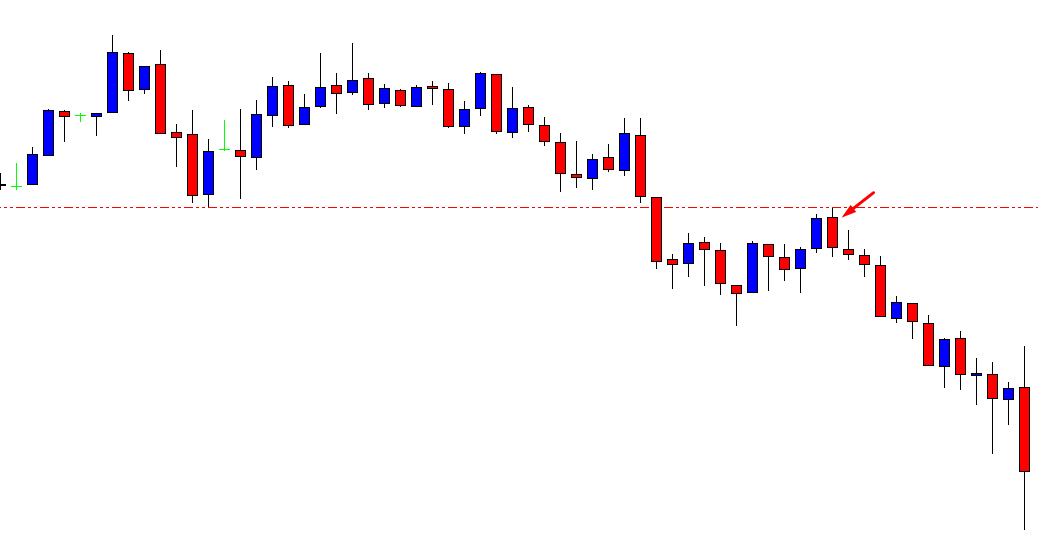
USD/JPY – Trading Tips
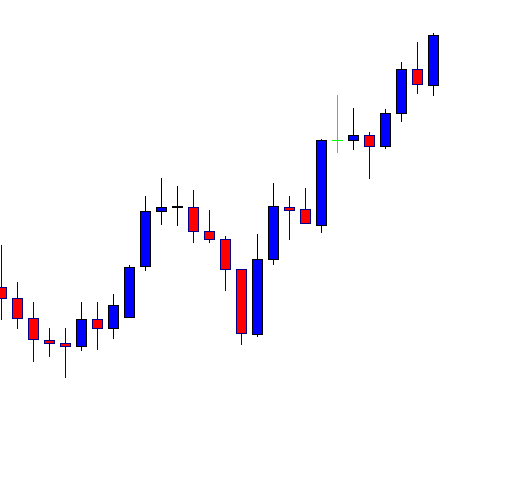
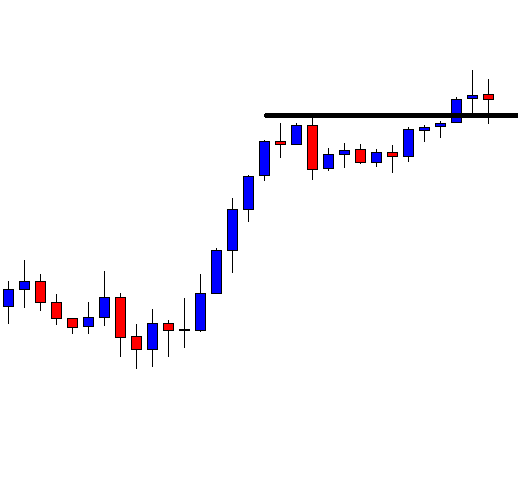
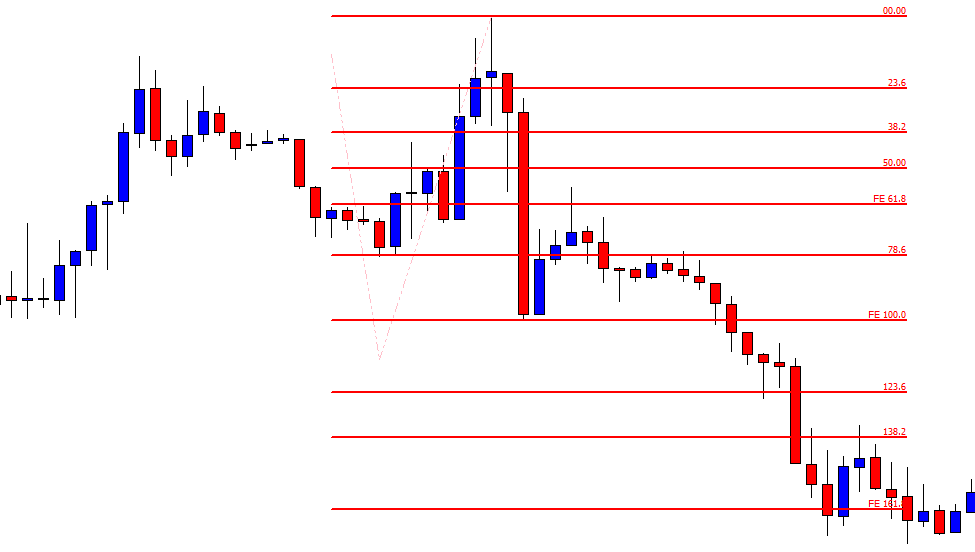
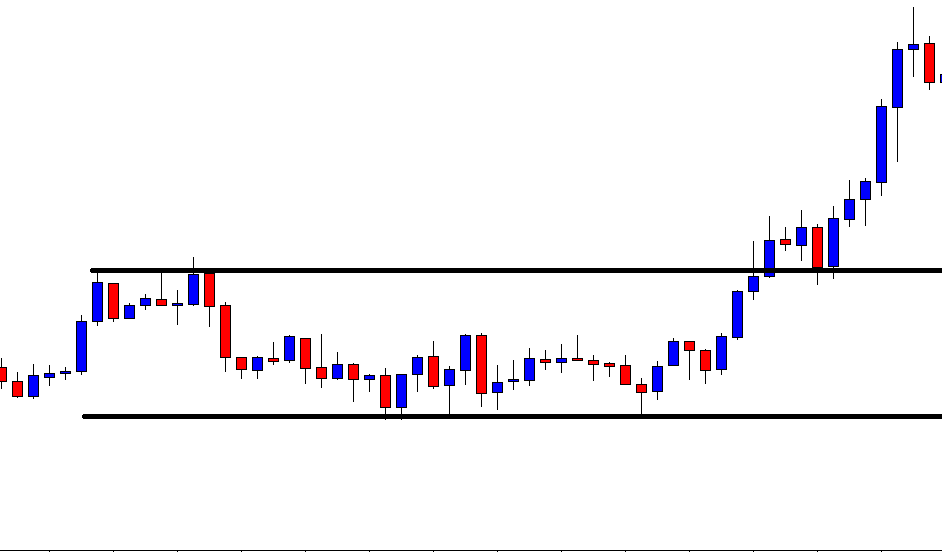
On Tuesday, the USD/JPY continues following the same technical setups that we spoke about on a previous day. The pair is still trading choppy, but it’s peaking out of tight trading range of 107.630 – 107.350. Above 107.650 level, we may see USD/JPY prices heading towards the next resistance level of 108.130. The ascending triangle pattern was already violated, and the upward trendline is expected to keep the USD/JPY supported around 107.350. Breakout of USD/JPY support area of 107.35 can lead the USD/JPY prices towards 106.850. So let’s consider taking buying trades over 107.68 today.
All the best for today!