Introduction
The BAT is a harmonic pattern that appears in both up and downtrend. This pattern occurs when the trend temporarily reverses its direction and before continuing on its original course. As soon as this pattern ends, the markets resume it’s original direction, giving us an opportunity to enter the trade.
The Characteristics of the BAT Pattern
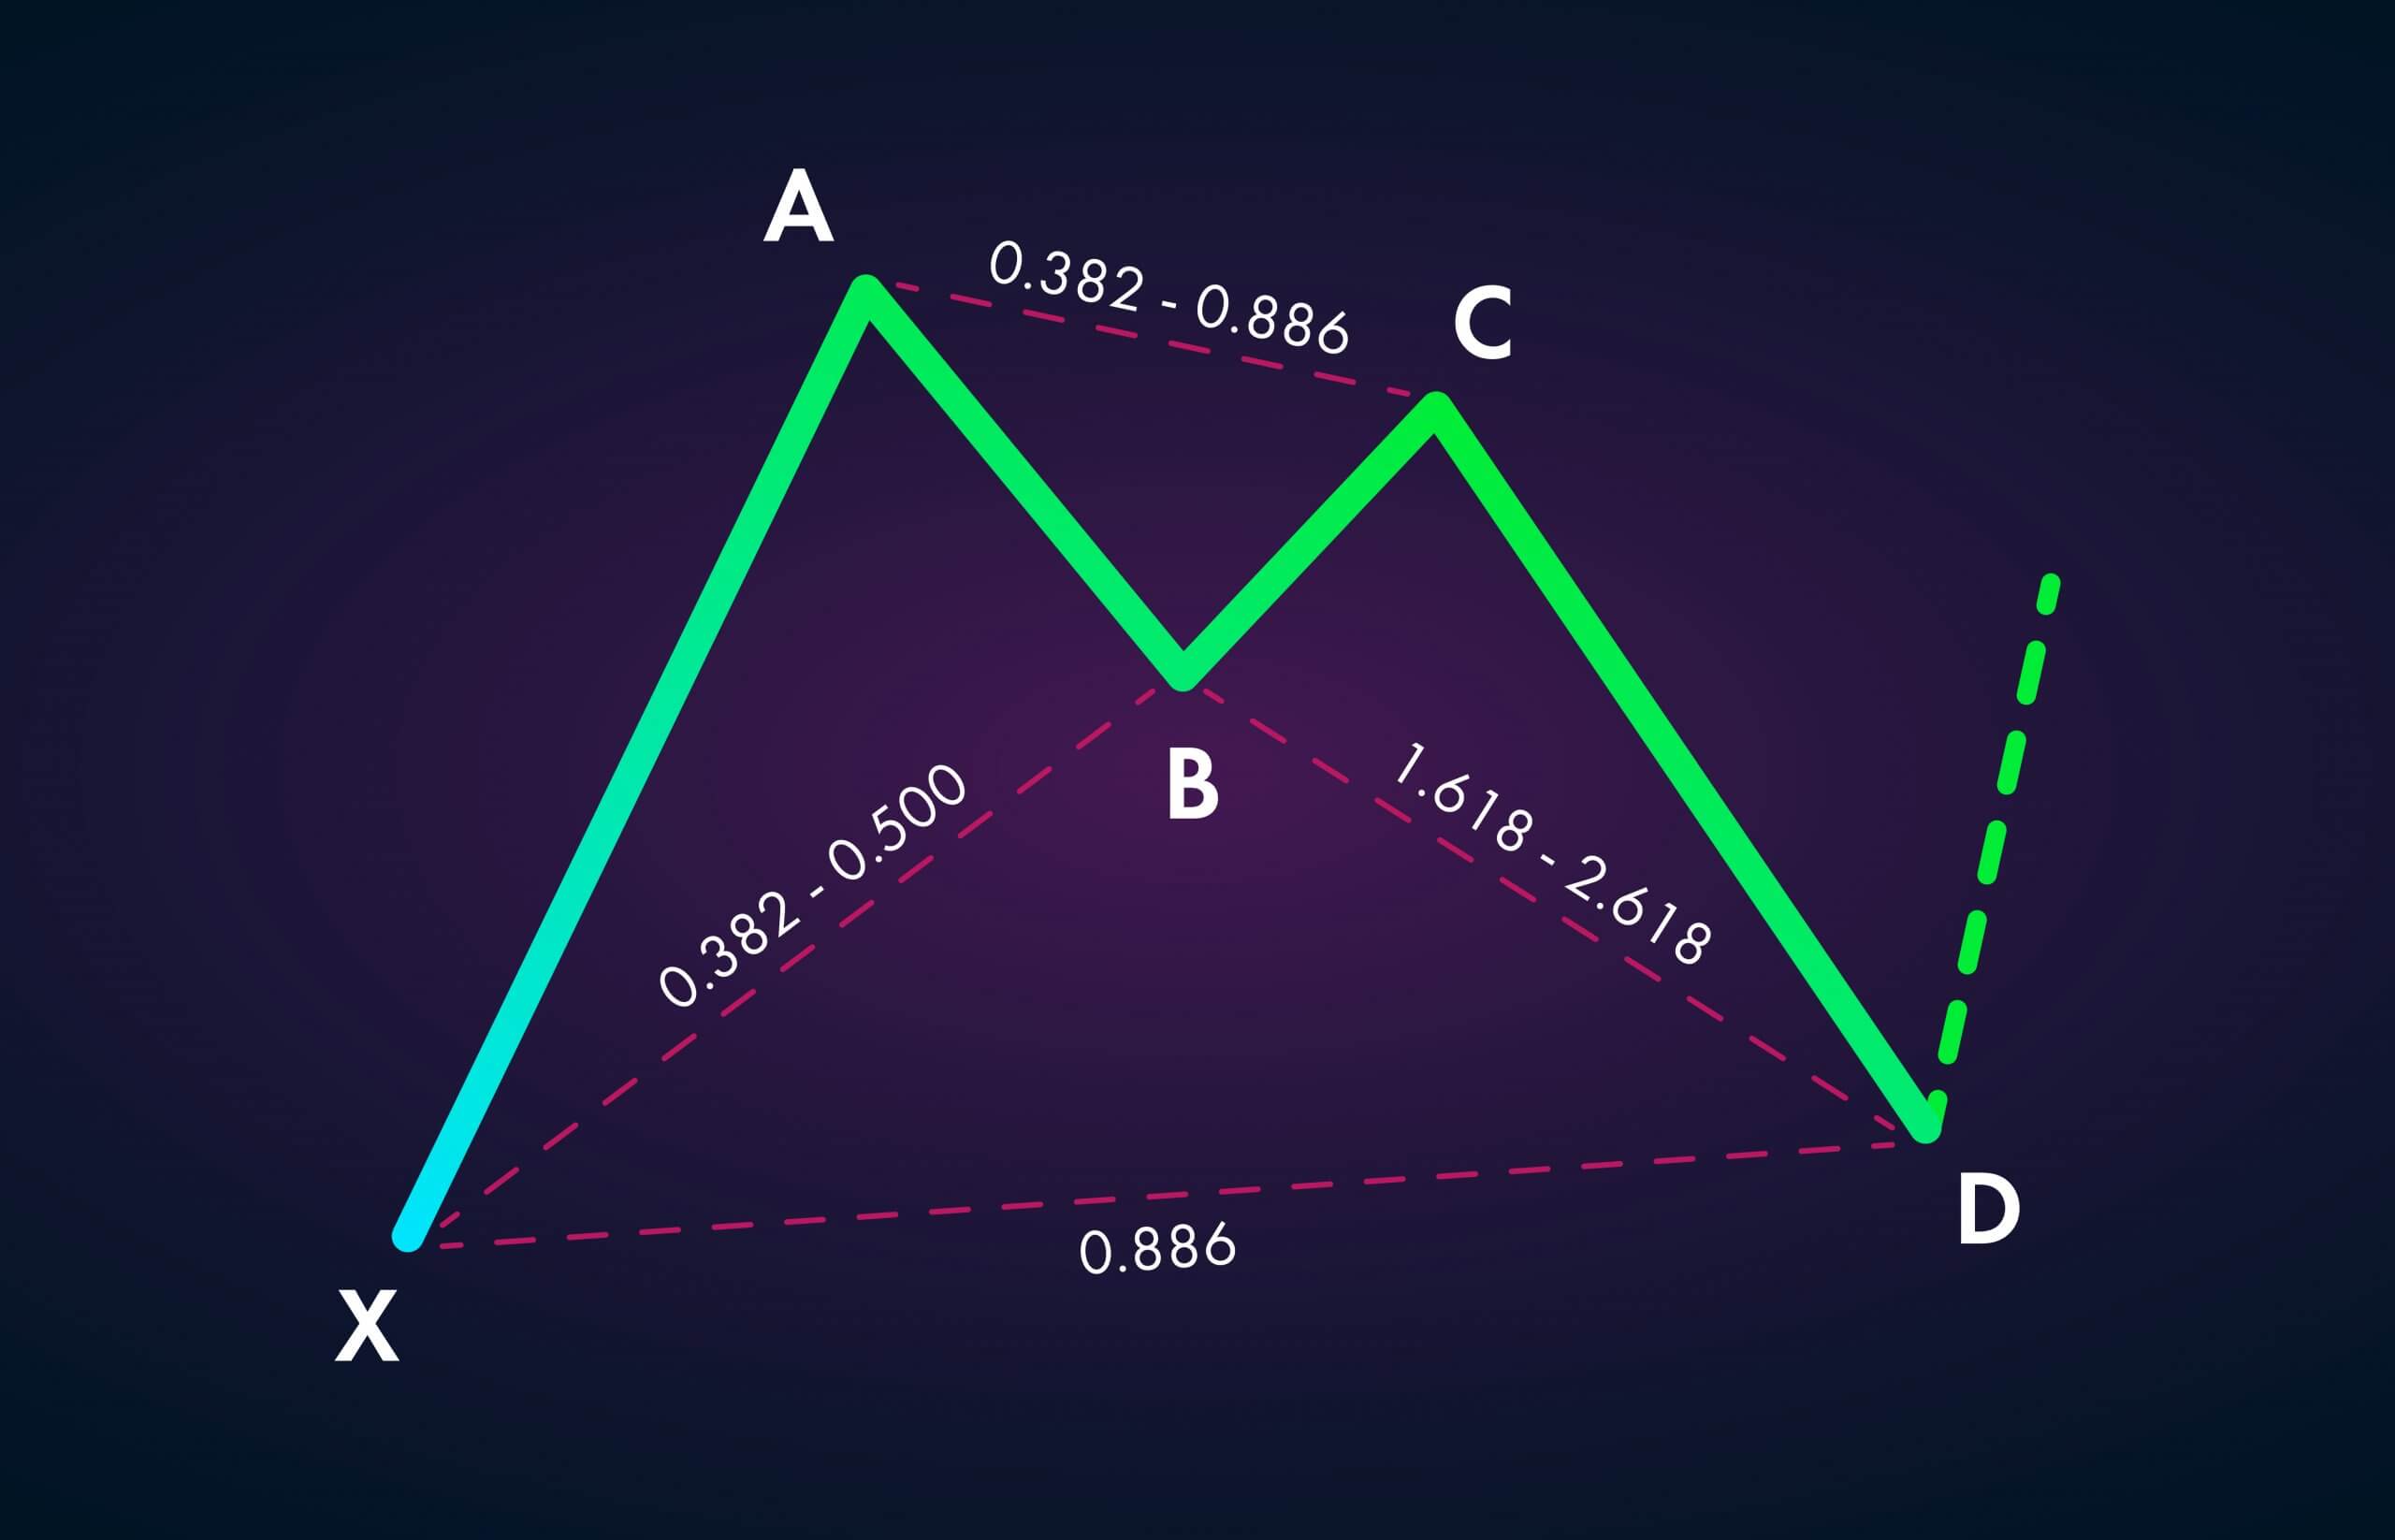
X-A – In its bullish version, the first leg forms when the price rises sharply from the point X to point A.
A-B – The AB leg retraces back between the 38.2% and 50% Fibonacci levels to the distance covered by XA leg.
B-C – For BC leg, price changes its direction again and retrace anything between the 38.2% and 88.6% of the distance covered by the AB leg.
C-D – The CD leg is the final and most important part of the pattern. If this leg goes wrong, then the pattern can be considered invalid. We can go long when the CD leg has achieved 88.6% retracement of the XA leg.
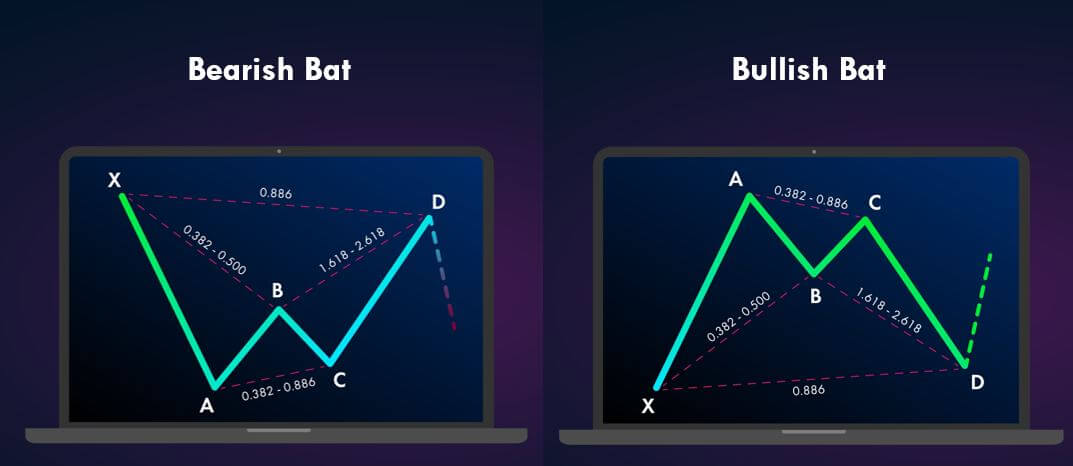
Below is how both Bearish and Bullish Harmonic Bat pattern would look like when Fib levels are applied to it.
Trading the Bullish Bat pattern
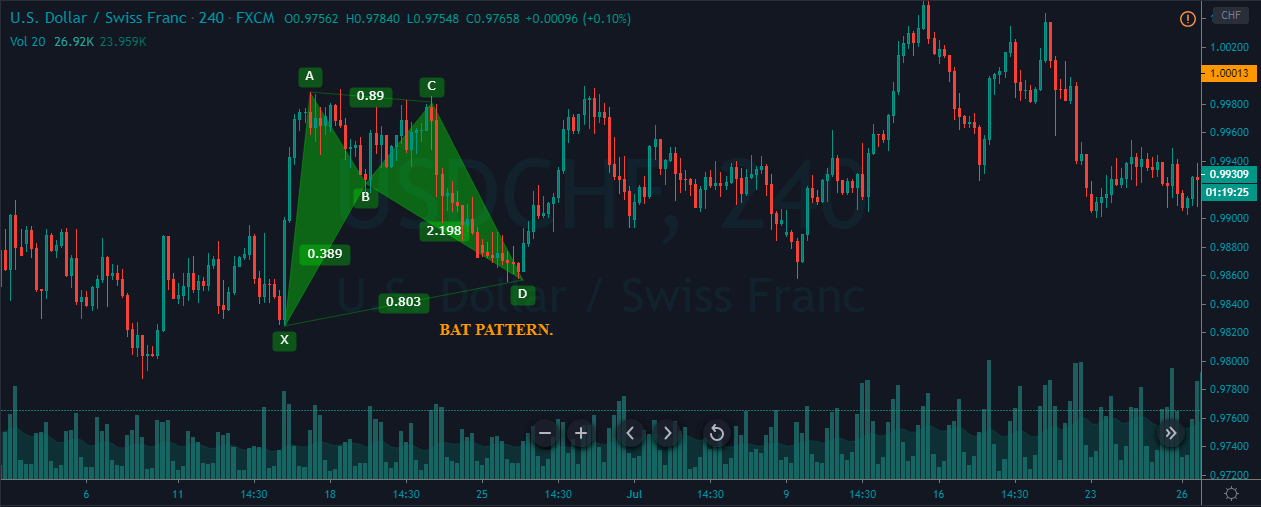
The below price chart represents the formation of a Bullish BAT pattern on the USD/CHF forex price chart.
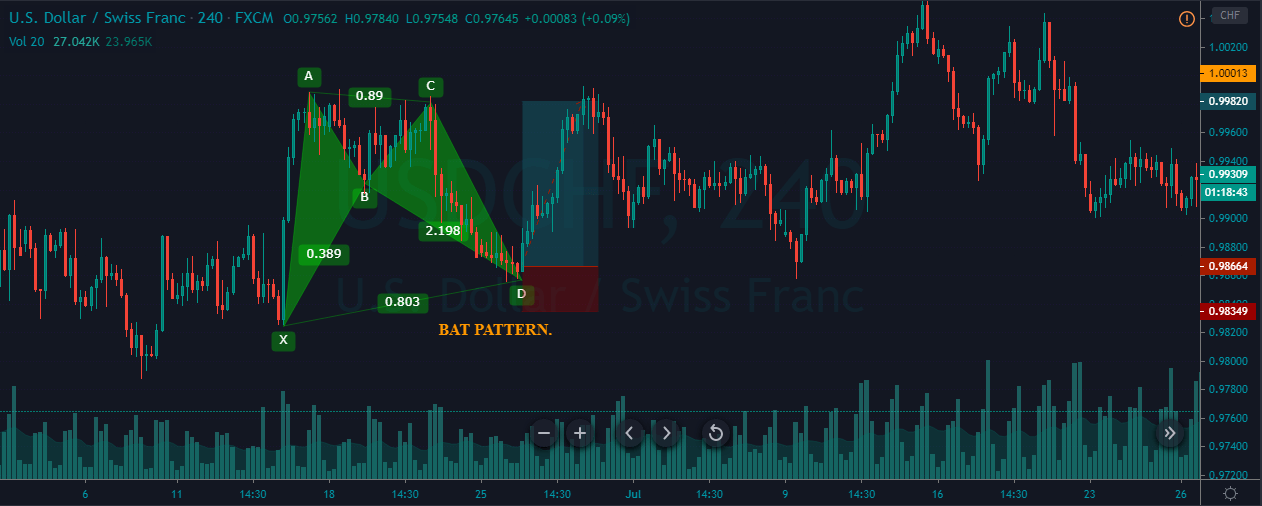
The below image represents our entry and exit while trading the Bullish Bat pattern. At first, we can see the price action printing the XA leg on the chart. Followed by that, the counter-trend AB move has retraced to 38.2% Fib level of the XA move. The BC leg followed the trend and retraced back to 88.6% of the AB leg. The last leg was the CD leg, which reached the 88.6% Fib level of the XA move. The trade activation was at point D, and the stop-loss is placed little below the D point. To place the take-profit order, we chose point A, and we can see how that placement is respected.
Trading the Bearish Bat pattern
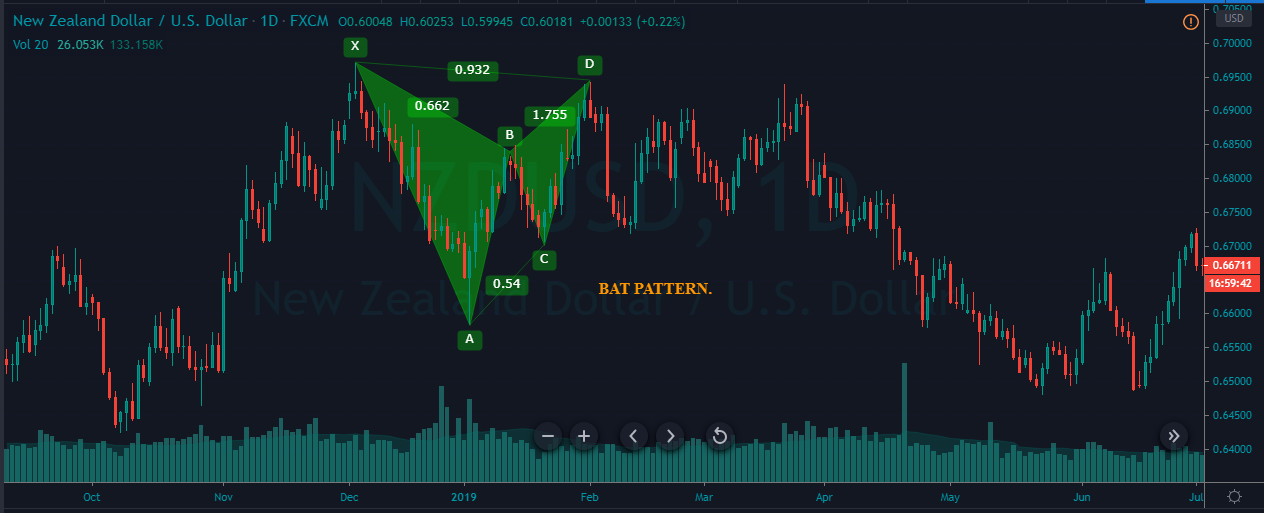
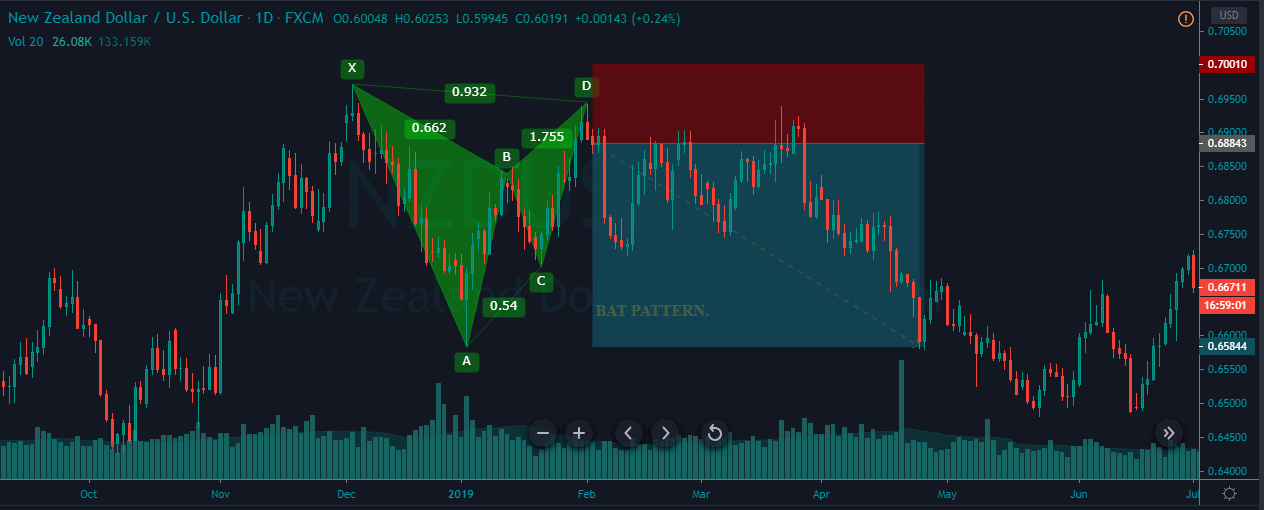
The image below represents the formation of a bearish bat pattern on the NZD/USD Forex price chart.
The formation of the pattern starts with the first leg at point X, and it ends at point A. The second leg AB was counter-trend, and it retraced back to 38.2% of the XA leg. The BC leg goes down, and even that retraced 38.2% of the AB leg. The last leg was the CD move, and if this leg doesn’t follow the rules, we shouldn’t consider the pattern valid. The CD leg goes up, and it retraces to 88.6% fib level. Hence, we can consider the pattern formed as valid. We have activated the trade at point D, and the stops were placed above point D. We have placed two take-profit orders – the first one was at point C, and the next one was at point A.
Conclusion
Bat is one of the most credible Harmonic patterns in the market. As the pattern ends at point D, our trade immediately resumes and often provides an excellent risk to reward ratio trades. Once you master trading the bullish pattern, the bearish one can easily be traded. The Bat is also considered one of the most reliable harmonic patterns; So whenever you identify this pattern, it is advisable to go big. Cheers!
[wp_quiz id=”77106″]
