Categories
Forex Basics

Push Past These Common Forex Problems to Find Success

Forex trading is a field where your success depends largely on your own actions – with little practice and unrealistic goals, you are likely to fail, while hard work and determination can put you on the fast track to success. Still, reported numbers of those that give up on trading fall somewhere in the 70% – 90% percentile. This might make trading sound difficult, but the truth is that many of the reasons why others quit can be avoided quite easily. 

Reason #1: It’s Too Hard

Some people make trading sound easy. For those that have been doing it for a long time, it feels more natural and it’s easier to make the right split-second decisions. Beginners need to realize that starting out can be difficult, however, no matter how easy your colleagues or advertisements online make it seem. This doesn’t mean that you have to be very intelligent to trade, only that it takes a large investment of time to learn everything you need to know. From there, you also need to keep up with the news and continue to do research from time to time.

Some people give up once they realize how much they need to learn because they are looking for an easy way to make money. Don’t make the mistake of thinking that you can sign up for a trading account and make money quickly if you don’t feel like putting in the effort. Trading is a real way that you can make money from home, but it is not a way to get rich quickly without effort. 

Reason #2: Unrealistic Expectations

Maybe someone quit their job under the notion that trading would become their new source of income. Or you might need to make a certain amount of money within a given timeframe. Whatever the reason, some people start out with high expectations or make the mistake of setting the exact monetary goals they want to reach by a certain date. This can set you up for failure because it’s difficult to predict exactly how much you could make while trading thanks to all of the different factors that affect the market.

Your money goals also need to keep your initial deposit in mind – if you’re hoping to make a living trading, you’ll need to deposit at least a few thousand dollars. You can’t come in expecting to make a living off of a $100 deposit. When people set these goals and can’t meet them, they tend to become discouraged and move on to the next thing. Remember that setting goals is important, but you should focus on the short-term as well and think about improving yourself as a trader in the beginning. These healthy goals will make a better impact on your profits and your brain will thank you for the dopamine reward when you manage to reach your realistic goals. 

Reason #3: Their Balance Hits Zero

We all enter the field of trading to make money, but things don’t always go as planned. Beginners are more likely to make avoidable mistakes, like risking too much on each trade, setting their leverage too high, forgetting to exit a trade, or being oblivious to trading psychology. If these things lead to a blown account, it can be difficult to bring themselves to invest more money because their new mindset tells them that they just aren’t good at trading or that it isn’t profitable. If this happens to you, don’t give up. It’s just a sign that you need to spend more time researching and practicing before you try again. Try opening a demo account if you haven’t already or taking trading quizzes to really test your knowledge if you’re apprehensive about making a second deposit. 

Categories
Forex Videos

Forex Trading Algorithms Part 3-Converting Trading Strategy To EA’s & Elements Of Computer Language!


Trading Algorithms – The Elements of a Computer Language – Part I


A computer language is a formal language to convert our ideas into a language understandable by a computer. Along with computing history, languages have evolved from plain ones and zeroes to assembly language and up to the high-level languages we have today.

Assembly language

Assembly language is a direct link to the computer’s CPU. Every assembly instruction of the instruction set is linked to a specific instruction code to the CPU.  

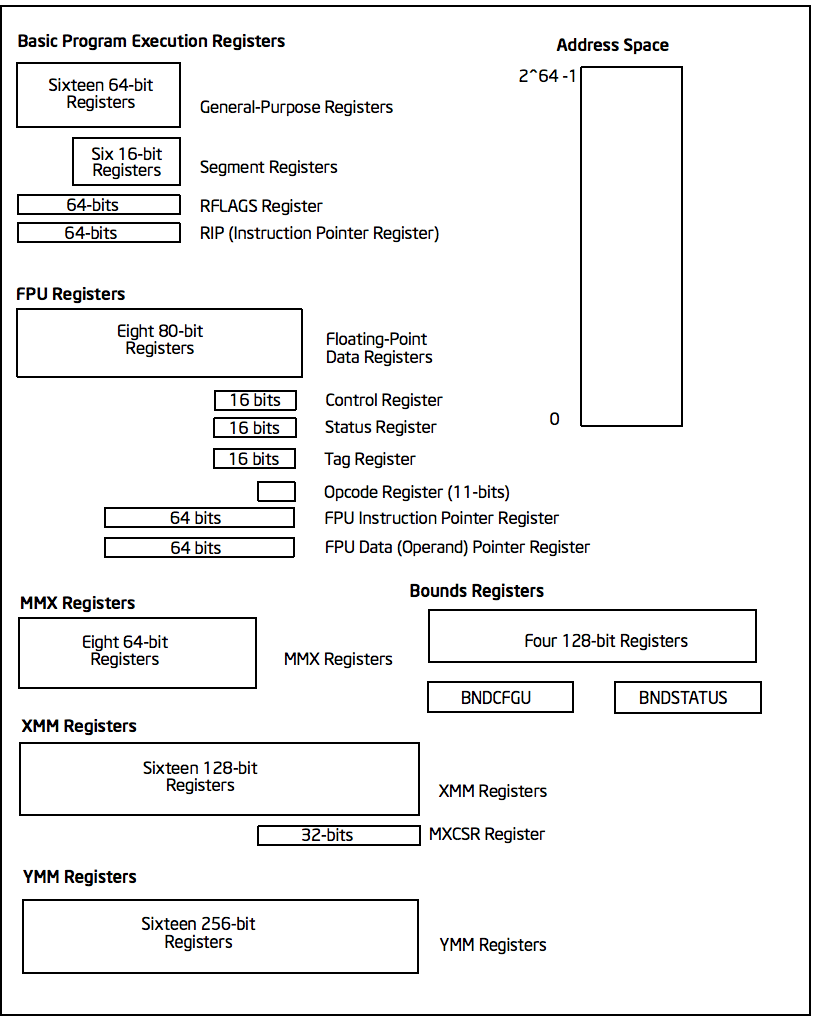
Fig 1. The basic structure of an X86 CPU. Source cs.lmu.edu

The CPU characteristics are reflected in the instruction set. For instance, an X86 CPU has eight floating-point 80-bit registers, sixteen 64-bit registers, and six 16-bit registers. Registers are ultrafast memories for the CPU use. Thus every register has assembly instructions to load, add, subtract, and move values using them. 

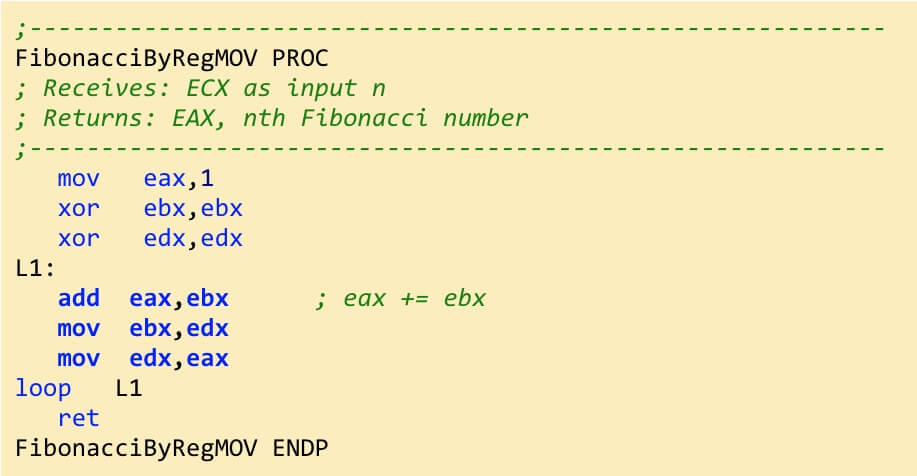
Fig 2- Example of assembly language

source codeproject.com

A computer program developed in assembly language is highly efficient, but it is a nightmare for the developer when the project is large. Therefore, high-level languages have been created for the benefit of computer scientists.

The Elements of a high-level language

A modern computer language is a combination of efficient high-level data structures, elegant and easy-to-understand syntax, and an extensive library of functions to allow fast application development.

Numbers

A computer application usually receives inputs in the form of numbers. These come in two styles: integer and floating-point. Usually, they are linked to a name called “variable.” That name is used so that we can use different names for the many sources of information. For instance, a bar of market data is composed of Open, High, Low, and Close. We could assign each category the corresponding name in our program.

Integers correspond to a mathematical integer. An integer does not hold decimals. For instance, an integer division of 3/2 is 1. integers are usually used as counters or pointers to larger objects, such as lists or arrays.

A floating-point number is allowed to have decimals. Thus a 3/2 division is equal to 1.5. All OHLC market data comes in floating-point format.

Strings

A string is a data type to store written information made of characters. Strings are used as labels and to present information in a human-understandable form. Recently, strings are used as input in sentiment-analysis functions. Sentiment analysis 

Boolean

Boolean types represent true/false values. A true or false value is the result of a question or “if” statement. It can also be assigned directly to a variable, such as in

buyCondition = EURUSD.Close[0] > 1.151

In this case, buyCondition is False for EURUSD closes below 1.151, and is True when the close value is higher than 1.151.

Lists 

We usually do not deal with a single number. If we want to compute a 20-period moving average of the USDJPY pair’s Close, we would need its last 20 closes. To store these values, the language uses lists (or arrays in C++). A list is an ordered collection of values or other types of information, such as strings.

Since Lists are ordered, we can refer to a particular element in the list using an index. For instance, if we were to retrieve the candlestick Close two bars ago of the USDJPY, we would ask for USDJPY.Close[2]

Sets

A Set is an unordered collection of elements. Sets do not allow duplication of elements. That means it eliminates duplicate entries. Not all languages have built-in Sets, although it can be made through programming if needed.

Dictionaries

Dictionaries are a useful data type that maps a key to a value. For instance, in Python 

tel = {‘Joe’: 554 098 111, ‘Jane’: 660 413 901} 

is a telephone structure. To retrieve Joe’s phone, we would write:

mytel = tel[‘Joe’]

with mytel holding 554 098 111

As with sets, not all high-level languages have built-in dictionaries, but a savvy programmer is able to create one.


In the next video of this series, we will explain the elements for flow control.


Categories
Forex Service Review

Earn More from Forex Using these Popular Stock Screeners

In the USA, the most profitable values can be in the biotech industry and in infrastructure companies. In Russia, they can be the financial, telecommunications, and retail sectors. At the same time, energy, oil, gas, and mechanical engineering are also promising, but their greatest growth took place in 2016 where the index sector reached 100%.

The situation with investments in the EU is not very clear: analysts of Goldman Sachs suggest that the most trusted will be the European indices and the German economy. They believe the Stoxx Europe 600 can more than double the growth compared to the S&P 500 and bring the investor a return of 8-10% per year. Analysts recommend that investors form portfolios to choose companies, which are included in the DAX index.

On the other hand, the elections in Germany and France, the uncertainty over the final Brexit agreements in the United Kingdom, and the various structural problems in the European banking system (particularly in Italy and Deutsche Bank) could impede economic growth in the EU. The interest of investors in China may be attracted by high-tech companies in the field of intellectual and electronic development. They also predict the rise in the consumer goods sectors. However, given the possible war between the US and China, the Chinese export-based economy may continue to fall.

So we’ve talked about specific industries that are suitable for investors, but how can we choose companies, what values are worth buying, since there are many in the world? Then, an agent specialized in the selection of actions can be of help.

How to Best Manage a Stock Screener & Popular Services

A stock screener is a service that allows you to choose a company whose shares are listed on a stock exchange. Company lists and their data are constantly updated in a screener, you just need to adjust the parameters we want and you can have selected a list of companies that meet your conditions.

The basic principles of a screener are as follows:

-There is no perfect screener because information about companies cannot be updated instantly. What’s more, it is recommended to use several screeners. They are usually customized for the bag of a certain country.

-Users of screeners for the USA or European exchanges must have knowledge of English.

-We do not recommend following the principle “the more filters, the better.” It is important to use them in order of preference. Screener filters can be compared with the use of filters in Forex market indicators: where a filter is not sufficient, however, 10 filters are too many because they can distract you from the main task. It is vital to have knowledge of how they should be selected as the right option for the trader strategy.

-A screener is able to analyze the story so it is recommended for long-term strategies; they are not good for volatile markets and intraday strategies.

Below we offer a list of some of the interesting and easy-to-use screeners, which provide a large number of filters.

1. Google Finance Stock Screener

This is one of the simplest and easiest-to-use screeners. It contains information on almost every major in the world. From the menu at the top is possible to select your country, the economic sector you want, and the stock market. In the basic version, the system shows the company, sorted by four criteria. However, by clicking “Add criteria”, you can see the required filters and their parameters.

Parameters of some filters:

  • Market Cap – company market capitalization.
  • P/E Ratio – the share price ratio per share.
  • Div yield – the amount of dividends paid per year.
  • Last Price – current value price of the company.
  • Average Volume – equity liquidity.

Take, for example, MB exchange and see a list of securities with dividends above 10%: According to this screener, out of 500 securities traded in MB, dividends from only 12 companies exceeded 10.18%. The only drawback of this screener is the possibility of some technical failures. We need to know that this screener was designed for professional use, and can also be used for a summary review of the company list.

2. Finviz.com

This is one of the best analysis sites, true to the US stock market. Traders use their analytics to determine the market trend; the “screener” section is an additional trading tool. Check only three American bags, but with more filters in the companies than Google Finance Stock Screener. The truth is that if we analyze the exchanges of the USA in Google Finance Stock Screener, we will see more than 600 companies, while with the Finviz.com screener over 1,000 only for the three US exchanges. In turn, this screener will review 190 companies in European markets, while Google Finance Stock Screener shows values of more than 400 only in Italy. No data on Russian securities.

The site also has separate sections containing analysis information:

Maps: They show values along with sectors and subsectors, which are shown as separate squares, where each asset is a rectangle. The larger the rectangle, the greater the company’s capitalization. When you put the cursor on an asset (rectangle) you will see the price change. The color green means price on the rise; the color red the price lowers.

Groups: In this section are shown the changes that arise in the sectors, countries, industries, and past periods.

Futures and Forex sections show prices in certain markets.

We can say that the Finviz.com screener is a very useful screener especially for the American market; however, it has perhaps too much information.

3. Screener.finance.yahoo.com

This screener is one of the most used among all screeners but is focused only on US markets. The title of the site page offers the user one of more than 10 sections: more profitable and more losses in stocks of the day, devalued values…

Each section is composed of a list of companies with certain parameters called P/E, which is the correlation between the price of shares and the earnings for each, changes that occur daily in the price with relative and absolute dimensions. To receive detailed quote information from each company, go to Search for a required Ticker.

Traders have different opinions about this screener. In many forums (for example Smartlab) you get a high rating. But also, it is very difficult to come to understand your operating principles. For example, there is no description in the filter parameters (which is good for those who only start working in the bag). A choice of filters is insufficient to work with. However, it is a matter of taste.

4. Stock-Watcher

This screener is first in the search system if you search for “Stock Screener”. It also focuses exclusively on US markets.

Filters are divided into several submenus:

Main parameters: price, the volume of securities traded per day, sectors, countries, indices, etc.;

Technical filters: changes in the previous value during the current session, price range during a session, over different periods, etc.;

Basic filters: the relationship between the share price and the profits produced by each share, the totality of shares that are in circulation in the market, etc. There are also the best buy and sell price filters, signals, etc. Some settings (monitoring or chart adjustment) are available only after registration.

The quotes on the site are updated every 15 minutes (according to the website), the site also has graphs showing the history of the price quote. For example, click on the screener section, search for “Electronic Equipment” in the list of industries and go to the AAPL Ticker. You’ll see the “Apple” quote history.

Note, however, that you can make some technical failures by adjusting filters, or incorrect tracking, and the absence of descriptive details of the tickers in the company list.

Conclusion

A stock screener is an additional tool that provides analysis information, such as, for example, an economic calendar or a map with pivot points. They help quickly find company values, which find investor targets and provide comparative characteristics of financial assets, allowing a trader to:

  • Save time;
  • Find attractive values in the market around the world;
  • Compare the performance of different companies and industries.

We know that there is no perfect screener, at the same time, data from various screeners that are due to a specific country or industry can provide an overview of the trend and decide which screener shows more useful information. We can say that there are not screeners that provide information in MB and there is no need for it because there are not many securities to trade intraday in the stock market.

Categories
Forex Videos

Forex Trading Algorithms Part 2 Converting Trading Strategy To EA’s! From Ideas To Code!


Trading Algorithms -From Ideas to code


As we have already said, computers are dumb. We need to explain to them everything. Moreover, digital computers are binary. They only understand ones and zeroes. Nothing else. 

Compilers and interpreters

To make our lives easier, we have created interpreters and compilers, able to translate our ideas into binary. Basically, both do the same job. Compilers produce a binary file that a computer can later execute, whereas interpreters translate each instruction as it comes in real-time.

From idea to the algorithm

Usually, traders think about when to enter and exit trades. An example brought by George Pruitt in his book The Ultimate Algorithmic Trading System Toolbox is the following. A trader wanted a code to enter the market and told him: 

” Buy when the market closes above the 200-day moving average and then starts to trend downward and the RSI bottoms out below 20 and starts moving up. The sell-short side is just the opposite.” 

No computer would understand that. In this case, the idea was partially defined, though: To buy when the price was above the 200-day SMA, and the RSI crosses down below 20. But what did he mean by “downward trend”? or “starts moving up”?

Pseudo-code

The first step to make a trading algorithm is to create an approximation to the code using plain English, but with more concise wording.

In the example above, Pruitt says that he could translate the above sentence into the following pseudo-code after some calls to his client:

The number inside brackets represents the close x days before the current session; thus, [1] is yesterday’s close.

In the pseudo-code, close below close[1] and close [1] below close [2] and close[2] below close[3] is the definition of a downtrend. But we could define it differently. What’s important is that a computer doesn’t know what a downtrend is, and every concept needed for our purposes should be defined, such as a moving average, RSI, and so forth.

The code

The next thing we need to do is move the pseudo-code to the actual code. There are several languages devised for trading. MT4/5 offers MQL4/5, which are variants of C++, with a complete library for trading. Another popular language is Easylanguage, created by Tradestation, which is also compatible with other platforms, such as Multicharts. Another popular language among quants is Python, a terrific high-level language with extensive libraries to design and test trading systems.

The code snippet above creates a Python function that translates the above code idea. In this case, the myBuy function must be told the actual asset to buy ( which should point to the asset’s historical data), and it checks for a buy condition. If true, it will return a label for the buy and the level to perform the buy, the next open of the asset in this case.

Systematic or discretionary?

The steps from idea to pseudo-code to code is critical. If you do not have a working algorithm, there is no way you could create a systematic trading system. But this is only the beginning. Creating a successful automated trading system is very hard and involves many developing, testing, and optimizing cycles. The market shifts its condition, and not always your system will perform. Then, you have to ask yourself if you’ll endure the drawdown stage until the market comes in sync with the system again.

Some systematic traders think that the best way to attack the market is to have a basket of uncorrelated trading systems, which are in tune with the market’s different stages: low-volatility trend, high-volatility trend, low-volatility sideways, high-volatility sideways, so your risk and reward is an average of all of them.

In the coming videos, we will dissect the steps to create an automated trading system. Stay tuned!

Categories
Forex Elliott Wave Forex Technical Analysis

EURGBP Soars!, More Gains Ahead?

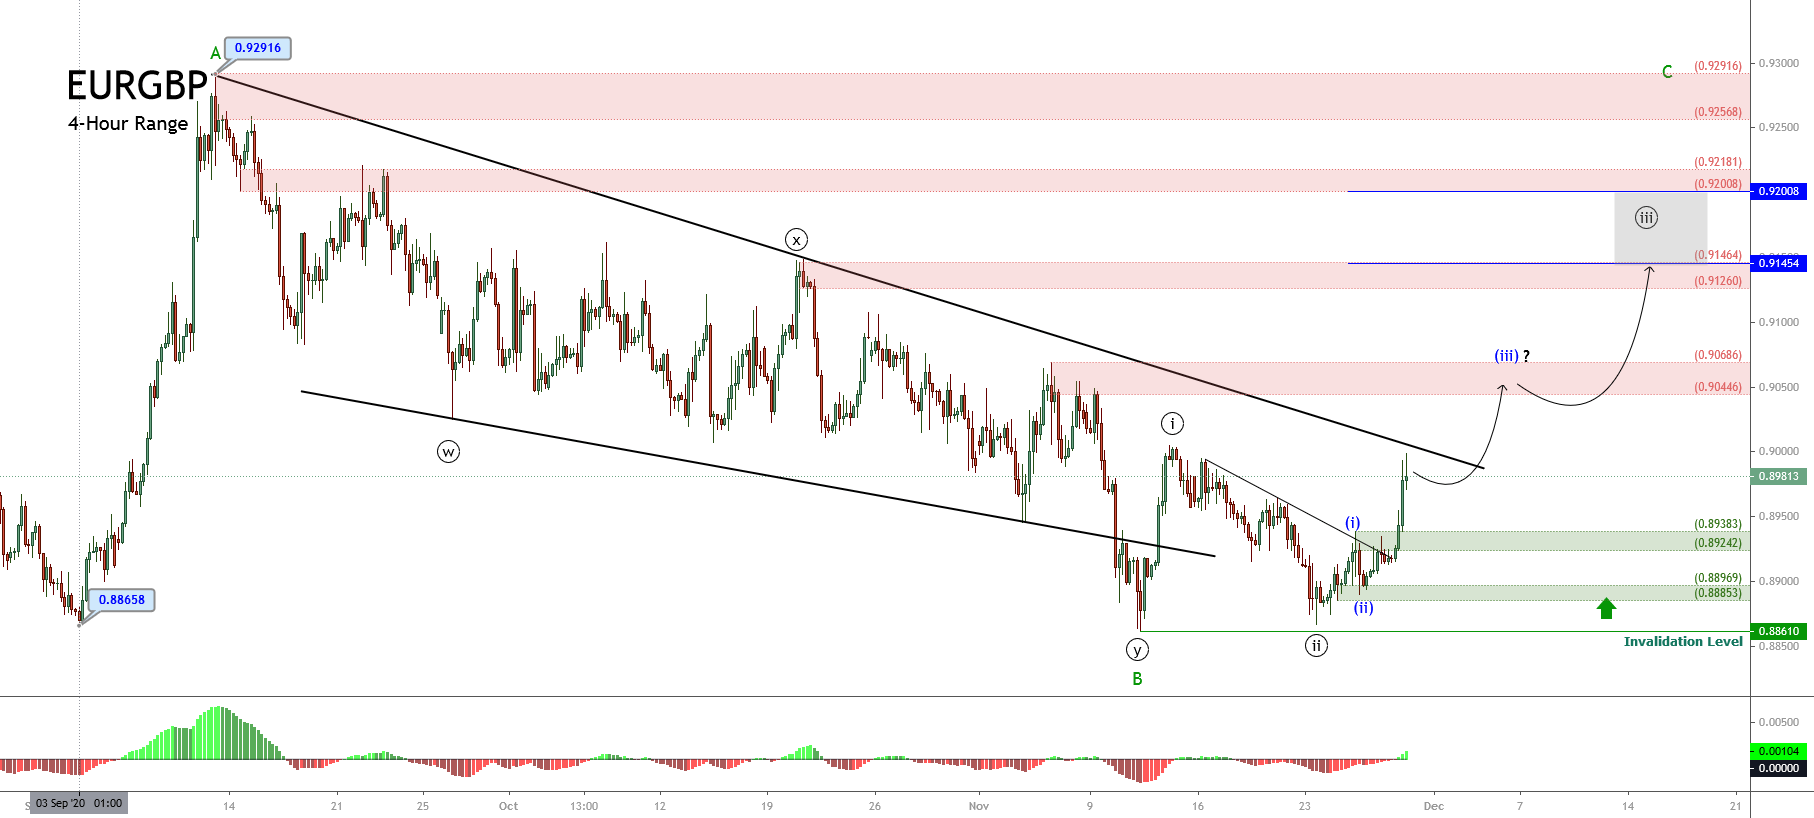
The EURGBP cross soared on Friday session, surpassing the psychological 0.92 barrier, advancing until the target area forecasted in our previous short-term analysis (here.)

Technical Overview

Our previous analysis discussed the completion of the complex corrective formation identified as a double-three pattern of Minute degree labeled in black, which began on last September 11th at 0.92916 and finished on November 11th at 0.88610. Likewise, after the double-three completion, the cross completed the wave B of Minor degree identified in green.

Once the EURGBP found the bottom at 0.88610, the cross began a rally corresponding to wave C. We have seen in our previous analysis the price completed wave ((ii)) at 0.88667 on November 23rd. After this completion, both the breakout of the descending trendline of the second wave in black and the strong bullish long-body candlestick formation developed in the November 27th session confirmed the start of the third wave in black.

Technical Outlook

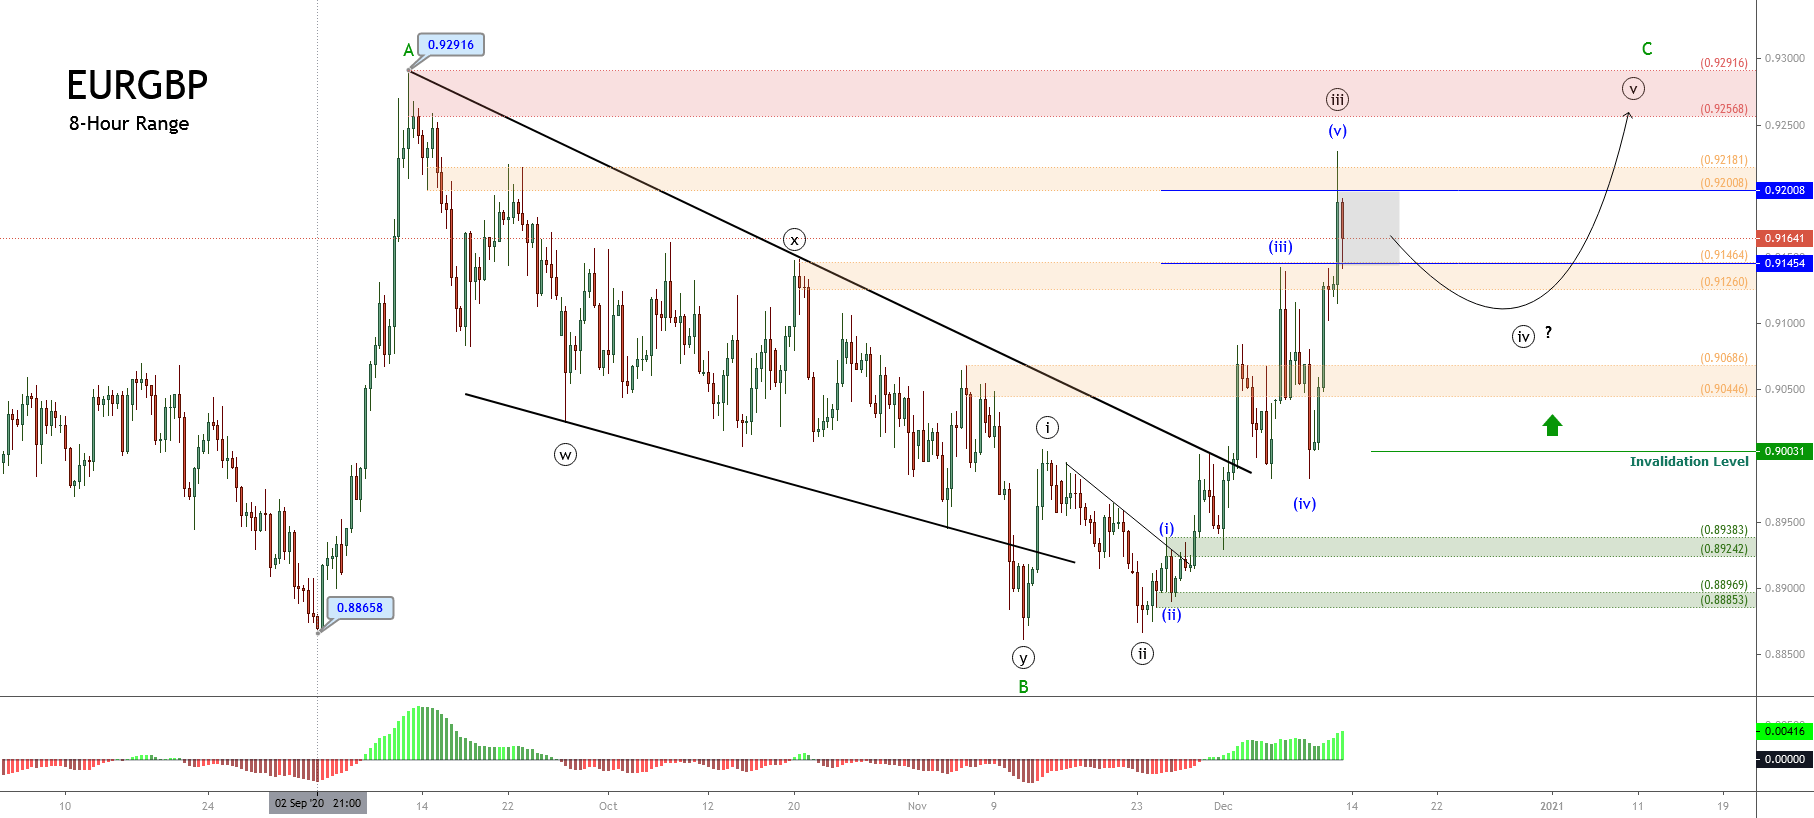
During the last trading session of the week, the short-term Elliott wave view for the EURGBP cross exposed in the following 8-hour chart reveals the acceleration in its advance, which surpassed the supply zone between 0.92008 and 0.92181, finding resistance at 0.92298.

The impulsive upward movement observed during Friday’s session allows us to distinguish the completion of the wave ((iii)) at 0.92298 and the beginning of the fourth wave of the same degree.

In this context, the current corrective formation identified as wave ((iv)) in black could decline until the previous supply zone between 0.90686 and 0.90446, where the cross could find fresh buyers. Once the fourth wave completes, the cross should advance in a new rally corresponding to wave ((v)), which would be subdivided into a five-wave sequence. The potential target for the end of wave C is within the next supply zone between 0.92568 and 0.92916.

In summary, the EURGBP cross appears moving in an incomplete wave C of Minor degree, which, in its lesser degree count, shows the beginning of the fourth wave in black. This corrective formation could decline until the previous supply zone is located between 0.90446 and 0.90686. The cross, then, could find fresh buyers expecting the continuation of the trend that would push up the price toward the supply zone between 0.92568 and 0.92916.

Lastly, the invalidation level for this bullish scenario can be found at 0.90031.

Categories
Beginners Forex Education Forex Basics

Guide to Identifying and Avoiding Dangerous Forex Scams

The Forex market is filled with competitors, and more brokerages pop up every single day. With so many options out there, comparing choices can be difficult or even overwhelming. Novice traders may not be apt at spotting scams, since many of these brokerages have nice websites and seem legitimate to the untrained eye. Unfortunately, there are a lot of scammers out there, and opening a trading account with one of them is one of the worst financial mistakes you could make.

Don’t let us scare you – good brokers are out there; you simply need to be able to identify the difference. Below, we will provide some tips that can help our readers know what to avoid when searching for a broker. 

-Transparency: A good broker offers a transparent website. Details about their account types, funding methods and fees, leverage options, and minimum deposit requirements should be clearly explained. If you’re left with more questions than answers, look for a broker that provides this information upfront. After all, this is need-to-know information!

-Check to see if the broker is regulated. This should be clearly indicated towards the bottom of the website, but you could also check the broker’s “About Us” page. Regulation is a good sign that the company is legit, although US-based residents may need to lower their standards because many regulated brokerages cannot offer service to these clients. 

-Remember that it is impossible for any brokerage to promise they will make you rich. There is no way for them to know that you will make profits, so any such claims are a bad sign. 

-Searching for background information about the company is a great way to see if things are legitimate. User reviews can also give insight into any hidden issues. Reviews might detail issues where brokerages won’t release funds to multiple clients, or other problems you wouldn’t otherwise know of.  

-Be sure to check the funding page for withdrawal rules. Some brokerages impose ridiculous rules and minimums that make it difficult for traders to withdraw their profits. 

-Check out the customer service options offered by the broker. Now, bigger brokerages can generally afford to employ LiveChat agents where smaller companies can’t, but listed contact methods and an address are all good signs.

-Use common sense: if something seems too good to be true, it probably is. Forex trading is risky no matter what, and brokerages need to make a profit. 

-Always check to see what type of spreads are being offered by the broker. On the benchmark pair EURUSD, spreads should be around 1.5 pips or less. We wrote about the importance of transparency earlier – never open an account with a broker that isn’t upfront about their spreads.

Forex Robot Scams

Although Forex robots are different than brokerage-based scams, they can still cause a lot of damage. Before purchasing a robot, do some research about the company or individual that is selling the product. Avoid any claims that the product is guaranteed to make you rich. Instead, look for good backtest results and tips from the author. Many providers will allow users to rent such a product before paying full price, or to at least test it on a demo account.

If you’re ever unsure, then reading user reviews and testing are the best methods of finding out the truth. Know that many of these products aren’t profitable and companies may present one backtest out of hundreds to trick traders into thinking their robot is more profitable than it really is. 

Categories
Beginners Forex Education Forex Basics

Reasons Why Forex Traders Quit Trading (And How You Can Avoid the Same Fate!)

If you’ve ever looked at statistics about forex trading, you’ve likely noticed that the results seem bleak. If you haven’t, check out a couple of the current statistics we’ve listed below:

  • 80% of all day traders quit within the first 2 years.
  • 90% of traders lose money.

These statistics might shatter the delusion that forex trading is the answer, but this doesn’t mean you shouldn’t trade! You might be wondering what the point is if only 10% of traders never lose money. Well, most traders do lose at some point – maybe only a few dollars, or more, but this is expected. What matters is that you have more winning trades than losing ones. Still, you might be wondering why so many traders quit if forex trading is so great. Below, we will try to explain some of the main reasons why traders give up so that you can avoid falling victim to these common problems.

Reason #1: They Start with Unrealistic Expectations

Some people start trading for the wrong reasons. These traders hear about another person’s success and decide that they want a piece of the pie. Others think of trading as an avenue to get rich quick. Trading is profitable, but it takes a lot of hard work and determination. Plus, it takes time. How much time depends on the size of your initial investment, your strategy, and a whole host of other factors but the lesson here is still the same. You should only start trading if you’re willing to put the time into learning with an understanding that it could take a while to see a lot of profits, especially with a small investment.

Reason #2: They Use too Much Leverage

Leverage is attractive because it allows traders to increase their buying power. Unfortunately, overleveraging your trades can backfire. Many beginners turn to leverage without being fully aware of the risks. This often includes those that don’t have a large starting investment. Once these traders wipe out their accounts, they are usually scarred from the loss and never fund their accounts again, thus ending their trading career. The best thing to do is stick with a lower leverage option until you are more familiar with trading and well-aware of the risks. Even then, many professionals recommend using a leverage of 1:100 or lower.

Reason #3: They Risk too Much

Risk-management is essential for success if you decide to trade forex. No matter how skilled one is at trading, failing to use risk-management precautions is one of the biggest mistakes you can make. Setting a stop loss and reasonable lot sizes are some good examples of ways that you can limit your losses. Many professionals recommend only risking 1% of your account balance on any single trade. If you risk too much or you don’t have loss limiting precautions in place, then you’ll likely blow your account as many others have done.

Reason #4: They Let Emotion Guide Them

Emotion plays a bigger role in trading decisions than many realize. Anxiety can cause analysis paralysis, which results in the lack of ability to make any decision altogether or making delayed decisions when one needed to act quickly. Emotions like greed or excitement can cause the opposite, where one fails to stop trading when they should, and they risk too much. Traders that don’t recognize these emotions and their effects often fall victim to their downfalls. If you want to avoid these, research trading psychology to be more aware of the problem and work on self-discipline.

Reason #5: They Don’t Have a Trading Plan

It’s impossible to predict what the market is going to do, but a trading plan can help one to make more informed moves. Your trading plan or strategy needs to consider the best times to enter and exit trades, risk management, and other factors. An example of one common strategy called scalping revolves around making many trades quickly and profiting from small price changes. Day traders open several trades throughout the day and close them out before the end of the trading day. Swing traders do the opposite by allowing their trades to stay open for days or even weeks. Traders that don’t have a game-plan rarely fare well in live conditions. This is another way that traders wipe out their account balance early on and give up.

Reason #6: They Give Up Too Soon

Some traders get off to an unlucky start. Maybe they failed to get a proper education before opening a trading account, they didn’t have a good plan to follow, they used too high of a leverage, or some other reason. This doesn’t mean that person is a bad trader, only that they need to figure out where the problem is stemming from. Keeping a trading journal is one way to log this, but many traders don’t get that far because they become discouraged and convince themselves that they just aren’t any good at trading. If this happens to you, take a step back and look at the bigger picture. It may be discouraging to lose your initial investment but think of it as a lesson rather than a sign to give up trading for good.

In Summary

Statistics about the number of forex traders that quit might seem unpromising, but there are several reasons why traders quit that can be avoided. Here’s a quick summary of the most common reasons why forex traders quit:

-They don’t have realistic expectations and aren’t satisfied with making a small profit, so they quit trading entirely as it seems like too much work.

-They use too high of a leverage, which can quickly backfire and blow one’s account, especially if that person doesn’t have much experience. After losing their initial investment, they feel defeated and walk away.

-They risk too much on their trades, which is another quick way to blow through a trading account’s balance.

-They fail to see the ways that emotions might be interfering with their decisions. Some may be too anxious to make quick decisions and fold under pressure.

-Others may become too excited and risk too much.

-They don’t have a good trading plan to follow. This results in trading decisions that aren’t properly planned and lead to financial misfortune.

-They get off to a bad start and give up before they have a chance to improve.

If you follow our tips, then your trading career should get off to a smooth start. It’s discouraging to see disclaimers about the percentage of traders that actually make money or how many quit, but potential traders need to realize how many of those people weren’t prepared. If you give it a half-hearted go, then of course you are likely to fail. Those that put the effort into securing an education, choosing a good broker, and devising a good trading plan should go on to have a productive trading career.

Categories
Beginners Forex Education Forex Trading Platforms

Overview of the SmartTrader Platform

SmartTrader is an online trading platform that focuses on charting, trading, and social networking. The cloud-based platform supports trading in the forex, stocks, and cryptocurrency markets. SmartTrader also works with a growing list of brokers that currently includes more than 35 options, including some big competitors like Forex.com. Take a look at the SmartTrader platform’s features, compatibility, and price below.

Features:

  • Access to 3 markets: stocks, crypto, and forex
  • More than 8,000 symbols to choose from
  • Supports up to 8 charts
  • 100+ built-in technical indicators
  • Ability to create your own custom indicators with up to 6 indicators per chart
  • Place and close positions from charts
  • Multiple timeframes
  • Configurable chart styles
  • Smart Analytics tool
  • Customizable scripts and market watch
  • Email, text, and browser-based alerts with real-world news updates
  • Custom indicators
  • Connect up to 6 demo or live trading accounts from virtually every major MT4 broker
  • Network with thousands of traders
  • Built-in economic calendar
  • Accessible through phone, computer, or tablet devices

Compatibility

SmartTrader is compatible with several online brokerages. This includes Bitfinex, Forex.com, FPMarkets, FXChoice, FXCM, FXPro, GllopFX, GhandaFX, GKFX, GlobalPrime, GoMarkets, HalifaxPro, HFMarketsSV, CHFClearing, Oanda, and many more. The SmartTrader website explains that they are constantly adding new broker accounts to this growing list. You can trade on forex, crypto, and stock markets – but there are some limitations with the cheaper plans.

Pricing

SmartTrader offers five different plans on a monthly, yearly, or bi-yearly subscription basis:

The FREE plan costs $0.

The PLUS plan costs $14.95 per month/$12.95 per month with one-year subscription/$9.95 per month for 2 years.

The PRIME plan costs $29.95 per month/$24.95 per month with one-year subscription/$19.95 per month for 2 years.

The PRO plan costs $99.95 per month/$84.95 per month with one-year subscription/$64.95 per month for 2 years.

The 360PRO plan costs $199.95 per month/$179.95 per month with one-year subscription/$129.95 per month for 2 years.

With prices ranging from $0 to just below $200 per month, there are obviously some major differences between each plan. First, each plan supports a different number of charts per workspace. The FREE plan only allows for one chart, while the best plan allows up to 8 charts. The FREE and PLUS plans also limit users to one synced device, while the PRIME plan allows 2 devices, the Pro Plan allows 6 devices, and the 360PRO plan allows for the maximum of 8 synced devices.

Price styles, data feeds, the ability to use custom templates, number of indicators allowed per chart, smart trendlines, alert availability, ad-free experiences, and several other factors are different based on the plan one has chosen. You can compare plans on the SmartTrader website here: https://smarttrader.com/plans/compare. You can upgrade your plan at any time.

Conclusion

SmartTrader offers some clear benefits, including networking, charting, and trading tools and features that can help traders make quicker, more informed decisions. The platform is compatible with many forex brokers that are recognizable by name with more being added to the list often. The biggest downside to choosing this platform is the price, although you can start trading for free on the FREE plan. Traders simply need to know that the platform’s unique benefits are much more limited when you aren’t paying for a better plan, so you are likely to notice the restrictions on charting tools, alerts, and other features. Of course, SmartTrader is a solid platform if you can afford it, and there’s no reason why you can’t test it out on the FREE version with plans to upgrade to a paid version later on.

Categories
Forex Elliott Wave Forex Market Analysis

EURNZD Consolidates after Bouncing from its Recent Lows

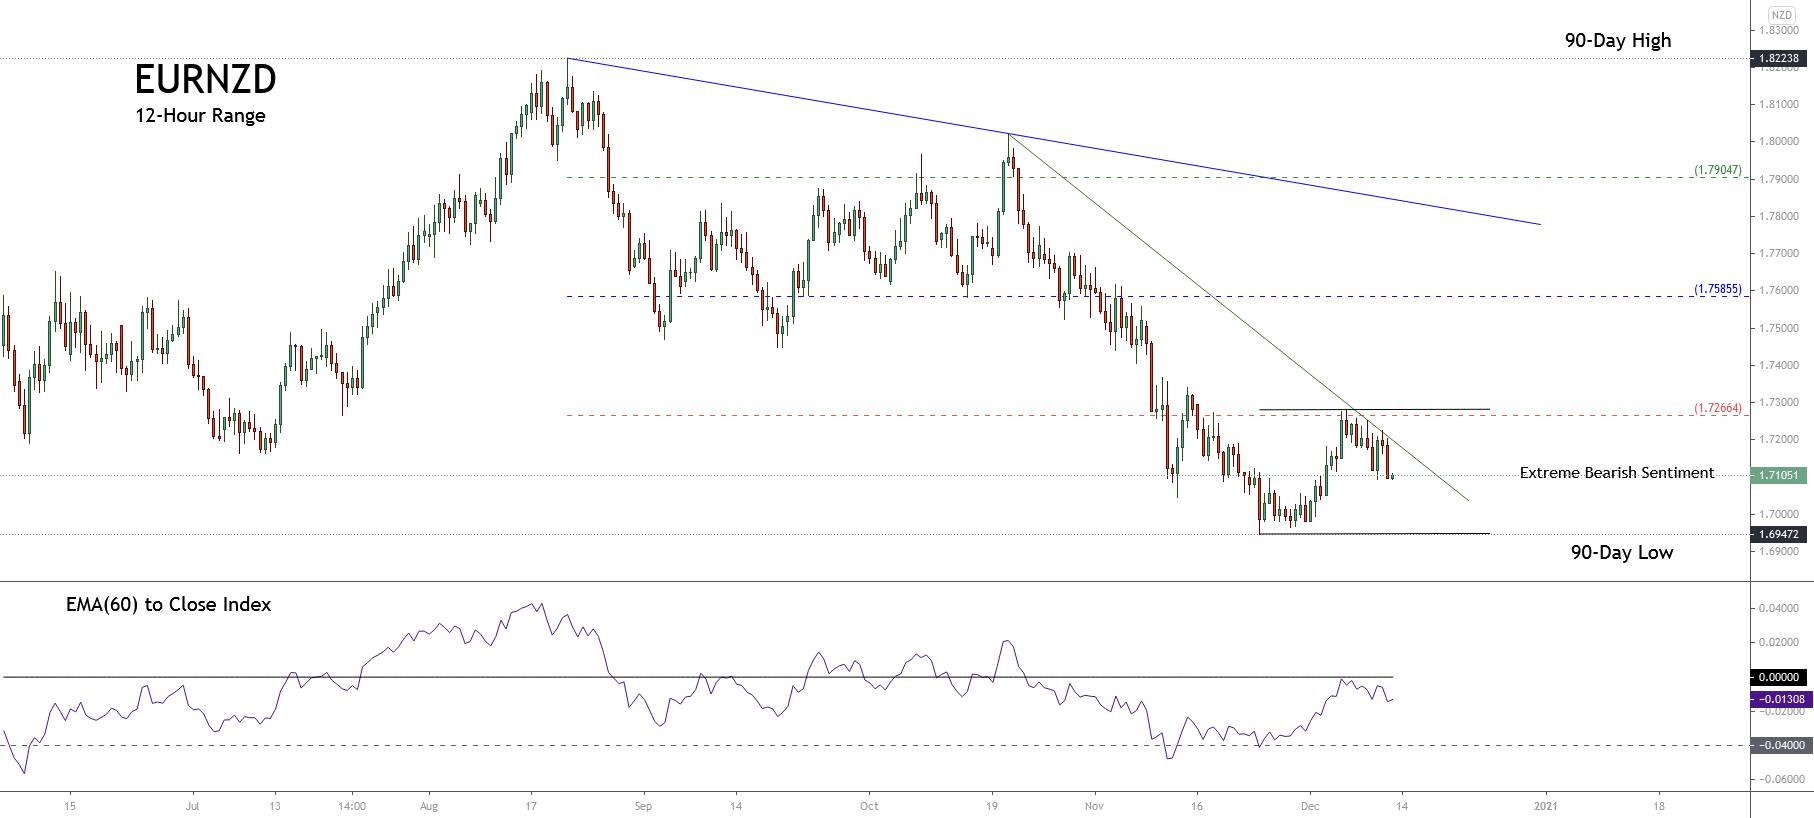
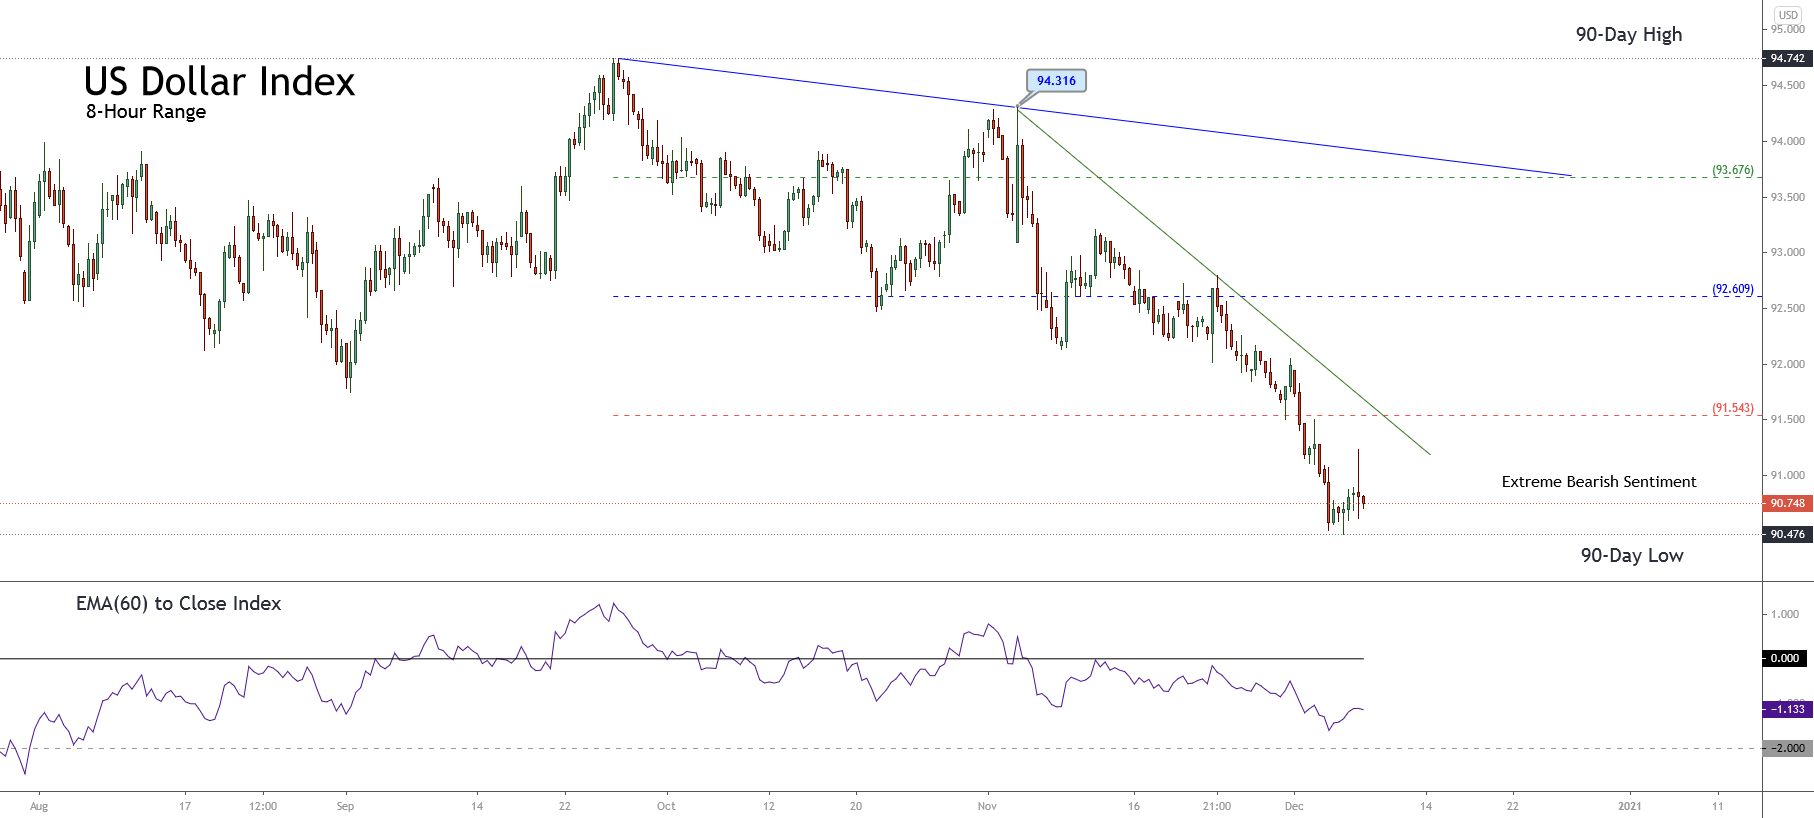
The EURNZD cross is seen consolidating near the extreme bearish sentiment zone backed by the strength of the New Zealand dollar. This consolidation suggests a pause of the downward sequence that began on August 20th and ended heavily oversold after its latest decline that drove it to 1.69472.

Technical Overview

The following 12-hour chart illustrates the short-term markets participants’ sentiment bounded by the 90 high and low range, which shows the price consolidating in the extreme bearish sentiment zone after the cross found support on 1.69472 on November 24th.

Furthermore, the previous chart shows the primary trend outlined a blue trend-line that tells the bias remains mostly bearish. Likewise, the secondary trend represented with the green trend-line exposes the downward acceleration, and, shows also its consolidation range between the levels of 1.69472 and 1.72664.

Finally, as long as the EURNZD cross keeps moving below level 1.72664, the bias will remain bearish, so we could expect further drops, likely below 1.69472. Whereas, the breakout of the extreme bearish zone of 1.72664 to the upside could indicate the start of a recovery.

Short-term Technical Outlook

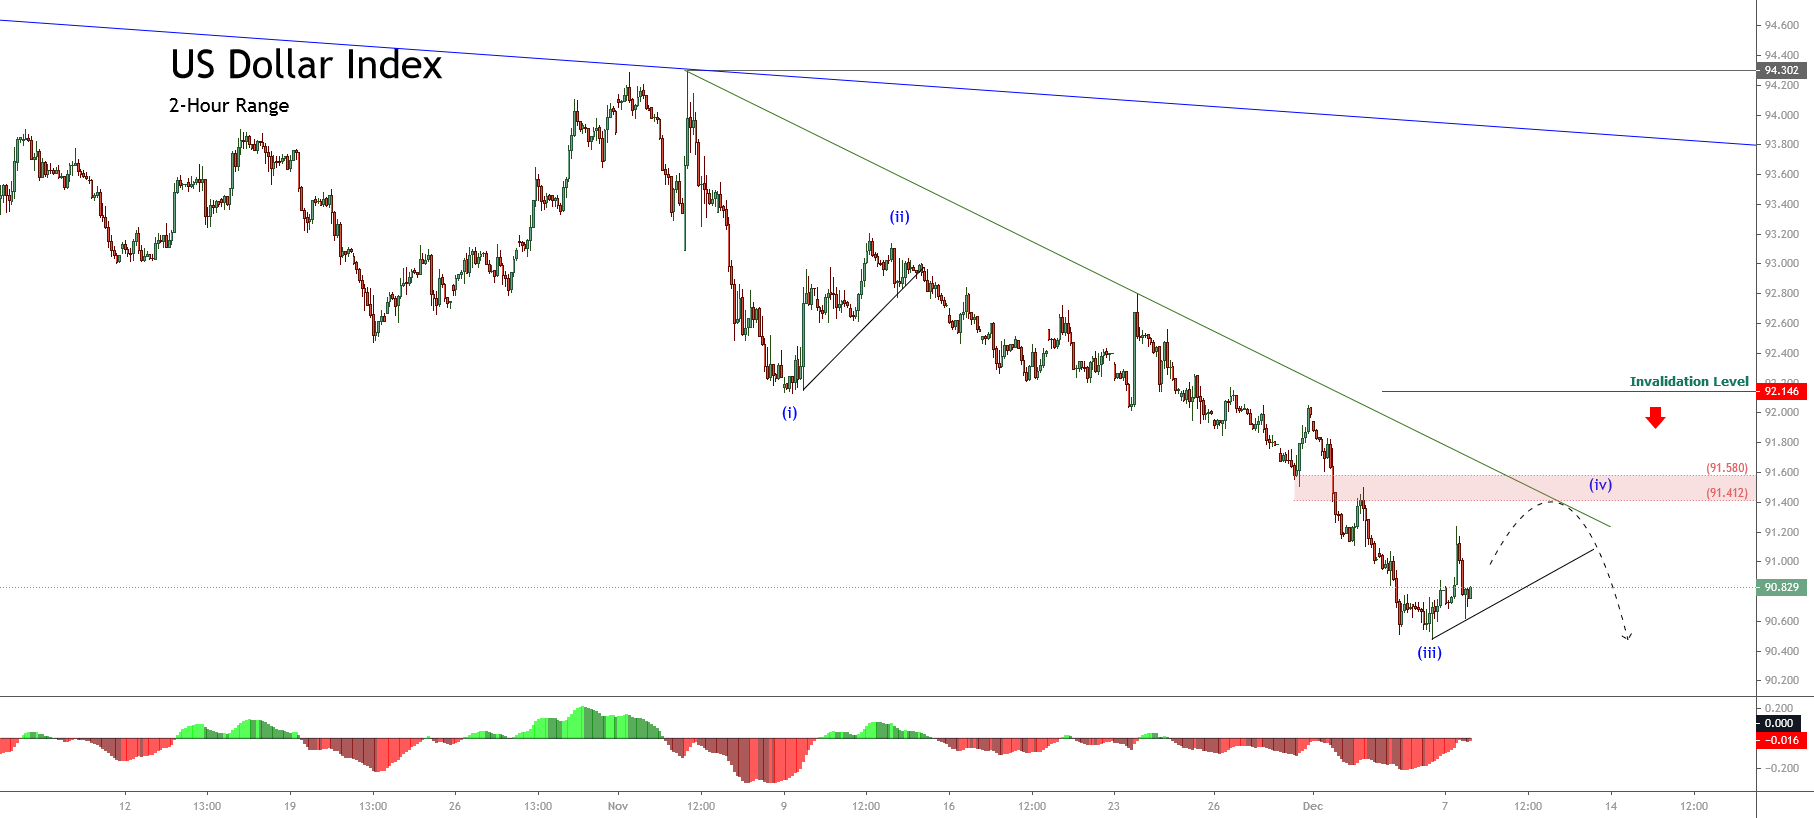
The short-term outlook for the EURNZD cross under the Elliott Wave perspective is shown in the next 2-hour chart and seen moving in an incomplete downward sequence. The current leg in which is moving corresponds to the wave ((c)) of Minute degree labeled in black.  Within that wave ((c)), the price is advancing in its fourth wave of Minuette degree identified in blue.


We see all that the wave ((c)) of Minute degree labeled in black came after the completion of the wave ((b)), which ends on 1.80212 where the cross found fresh sellers dragging it in an accelerated bearish movement. In this context, the current wave ((c)) should develop an internal structure of five waves.

Right now, the chart shows the action is happening in its fourth wave, in blue, which could be advancing in its internal wave b of Subminuette degree identified in green. This leg could possibly test November’s lows. Likewise, considering that the third wave, in blue, looks like an extended wave, the fourth wave should be complex in price, time, or both. Therefore, the current corrective wave could continue evlving likely until early 2021.

Concerning the fifth wave, in blue, and considering that the third one of the same degree was the extended movement, there are two potential scenarios for the cross:

  • First scenario: the cross fails in its downward sequence finding fresh buyers above the end of the third wave, in blue, at 1.69472.
  • Second scenario: the cross penetrates below 1.69472, creating a new lower low. In this case, this new leg down could continue until the psychological barrier of 1.68.

In summary, the EURNZD cross currently moves in a corrective formation in the extreme bearish sentiment zone. In this context, our principal bias remains neutral until the completion of the fourth wave in blue. Once the cross ends the current consolidation, we could seek short positions following the direction of the fifth wave. Finally, the invalidation level of the bearish scenario locates at 1.73606.

Categories
Beginners Forex Education Forex Market

Which Factors Truly Impact the Forex Market?

To be a successful forex trader, you need to understand what affects the value of a currency and what can cause it to change. The following factors have a direct effect on the value of currency for a country:

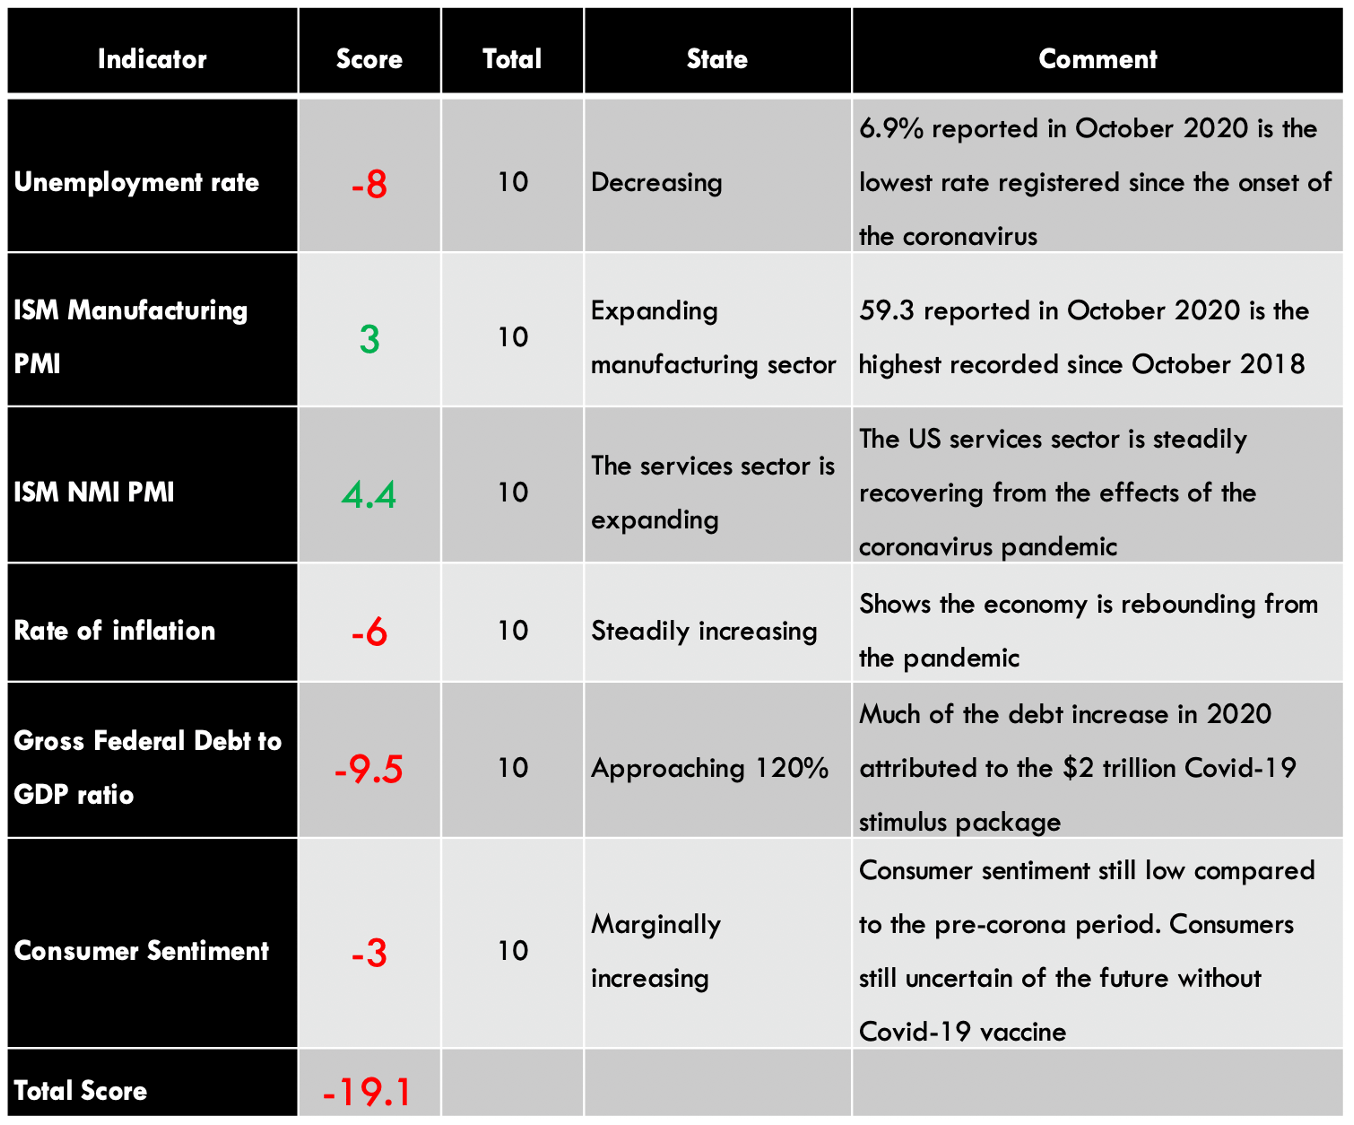
  • Inflation Rates
  • Interest Rates
  • Capital Flow Balance
  • Government Debt
  • Trade Terms
  • Political Factors
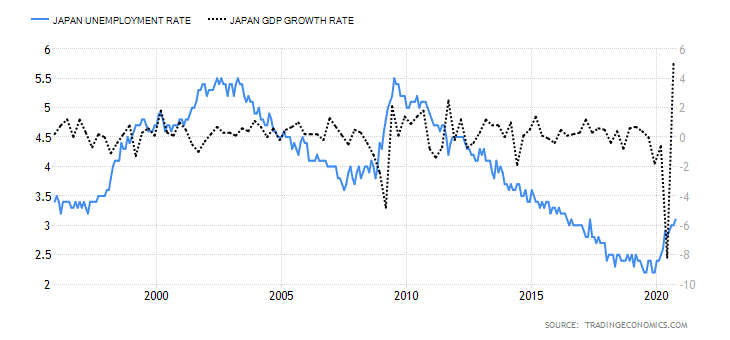
  • Employment Data

If you understand each of the above factors, then you’ll be able to make better predictions about the market. We will explain each factor in more detail below.

Inflation Rates

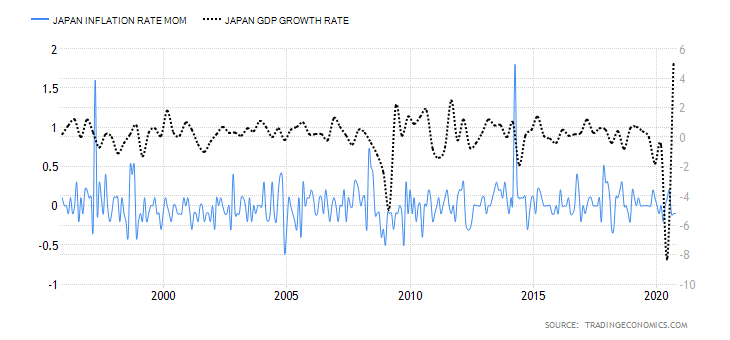
Inflation refers to the general increase in prices over time and fall in the value of purchasing money. One of the main driving factors behind a currency’s exchange rate is its country’s inflation rate. Japan, Germany, and Switzerland are a few examples of countries with low inflation rates.

-Countries with higher inflation will see decreases in the value of their currency compared to the currency it is being traded against.

-Countries with lower inflation typically see an increase in their purchasing power compared to other currencies.

Interest Rates

Interest rates tie in with inflation and forex rates. Increased interest rates raise the value of a country’s currency because they attract more foreign capital. Investors gravitate towards economies with higher interest rates because they will increase the value of their returns. This creates more of a demand for the currency and increases the exchange rate.

Capital Flow Balance

This revolves around several different factors:

  • Exports
  • Imports
  • Debt
  • Retail Sales
Government Spending

If a country has a deficit, it means that they are spending more on imports than they are making with exports. This causes depreciation in value for that country’s currency. The capital flow balance is simply the ration of imports vs exports in a country. China would be a prime example of a country with a higher export rate, which makes its currency more attractive to forex traders.

Government Debt
This involves all public or national debt that a country’s government owes. Countries that are in debt are more likely to experience inflation. If investors know that government debt is predicted, they will sell their bonds, which results in a decrease in that currency’s value. An investor might look at the government’s overall debt over a few years to decide if it is worth investing in that currency.

Trade Terms

Terms of trade are the ratio of export prices vs import prices. If the number of exports is greater, then the value of the currency increases because there is a higher demand for that country’s currency. If there are more imports than exports, the opposite occurs.

Political Factors

Investors prefer stable countries and those countries pull investors away from countries that experience more uncertainty. Being a more politically stable country results in an appreciation of the currency’s value while being less stable results in depreciation. Elections, financial crisis, policy changes regarding money, and wars have a direct effect on the currency’s overall value.

Employment Data

Employment rates can give investors an overall idea of how the economy for a given country is performing. High unemployment rates signifies that the economy is not doing well or growing with the population. This would lead to depreciation in the currency’s value as investors pull away from investing in that country.

Conclusion

Several different aspects of a country’s economy can influence the value of their currency. Investors are generally looking to invest in politically stable countries with high employment rates and less government debt. Higher interest rates and low inflation rates are other ideal conditions. It is important for forex traders to understand what drives a currency’s price so that they can make more accurate predictions about the market.

Categories
Forex Education Forex Risk Management

Are You Taking On Too Much Risk While Trading?

One of the phrases that you have probably heard the most since starting out with trading is risk management, but what does that actually mean, and do you do it? To put it into simple terms, risk management is about reducing the potential risks to your account and protecting your account from dangers and large losses. This sounds simple enough and quite an obvious thing, but you will be surprised at how many people throw it out of the window on their quest for bigger profits.

Risk a Set Amount

One way that people reduce the amount of risk that they have on each trade is to limit the potential losses of each trade, they do this by setting stop losses on each trade that they make. A number that we see a lot of 2%, people seem willing to risk 2% of their overall account on each trade that they make, this would mean that the account would be able to survive up to 50 losing trades on a row without any wins, something that is very unlikely if a proper strategy is being implemented properly. It is important that if you set yourself a maximum loss per trade that you stick with it or if you deviate, only to deviate lower, going higher will put your strategy out of sync and could potentially damage your account equity quite a bit.

Adding to Trades

Something that a lot of people do is to add positions to an already winning trade. This basically means that when a trade is going the right way, you add in an additional trade to make the overall trade size a little larger. While this may work for some, a lot of strategies have not taken this into account so you should be careful when considering it. When you do add an additional trade, you need to bear in mind that your overall risk is increasing, do you stick to a maximum 2% loss on that trade, or do you increase or reduce it? Unless your strategy has already taken these additional trades into consideration we would advise against adding to existing trades as it could mean you can lose more than you had anticipated on that trade.

The Right Trade Size

How are you working out your trade sizes? Is it based on your account size or your strategy? Whichever method of working it out that you use, you need to stick with it. More often than not, your trade size would be based on the percentage of the account you are willing to risk with each trade. There are trade size calculators available all over the web that can help you to work out the exact size of each trade that you should be using based on the pair being traded and the percentage of the account that you are willing to risk. It is important to stick to regular and similar trade sizes for each trade, as suddenly adding larger trades could completely throw your risk management out the window and could be endangering more of your account equity than you would normally be willing to risk.

Taking Profits

Something that people often don’t associate with risks is taking profits, knowing when to come out of trades is just as important to protect your account as restricting your losses. To put this into perspective, a trade has gone into profits, you feel that it may reverse but it is in profit so you will let it run to see if it goes any higher, it suddenly reverses and you are now back to a break-even level or even in the negatives. In order to protect your account, it should have been taken in profit, many people use take profit levels, others have a certain percentage where they move the stop loss levels into profits to guarantee the profits. The importance of doing this is that you will have wins and losses, but it is important that you are able to take those wins as they are there to help cancel out the losses, having them also become losses will put your account in danger.

So those are a few things to think about when looking at the risks you have to your account, there are of course many other things to think about, but those are some of the bigger ones. Think about whether you do these things, if you do, think about how you can improve on your own risk management for the future to help protect your account.

Categories
Forex Signals

AUD/USD Violates Upward Channel – Brace for a Buying Trade 

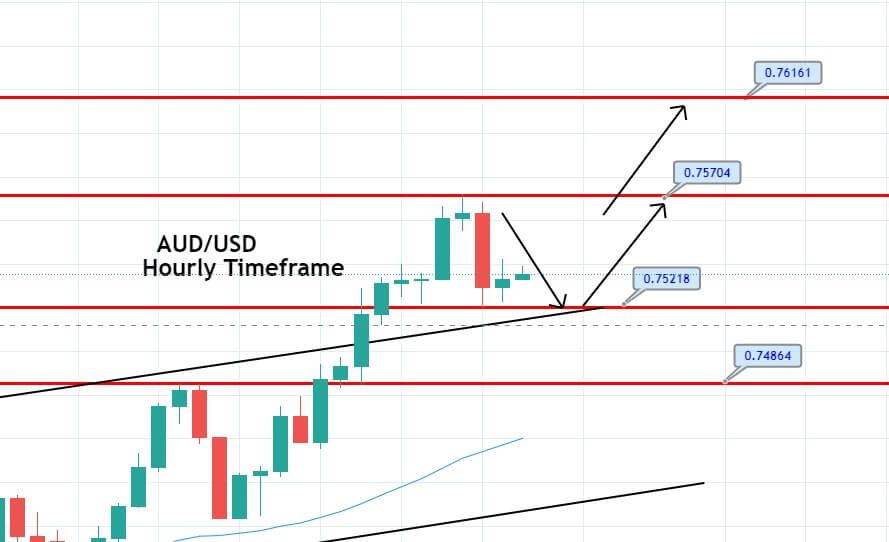
The AUD/USD pair was closed at 0.75350 after placing a high of 0.75296 and a low of 0.74254. The Australian Dollar rose to its highest level in two and a half year as investors started to bet on a successful vaccine roll-out and improving global growth. The risk-sensitive Aussie gained as much as 0.8% on Thursday and rose to its highest since June 2018 as the market’s risk sentiment improved. The pair AUD/USD has gained about 6.8% this year as a rebound in China’s economy has boosted China-proxy Australian Dollar demand.

The risk sentiment in the market was supported by the combination of multiple factors on Thursday and supported the upward trend in the Australian Dollar. The rising hopes for the US stimulus bill after the US Treasury Secretary Steven Mnuchin that a lot of progress has been made regarding the stimulus talks added in the risk sentiment. Meanwhile, the US House Speaker Nancy Pelosi also said that bipartisan negotiations on the coronavirus relief bill were making great progress. These comments reflected the upbeat market mood and supported the risk perceived Australian Dollar.

On the other hand, the US dollar was also weak on Thursday that also supported the upside momentum in AUD/USD pair. The US dollar weakness was driven by the increased unemployment claims and additional stimulus from ECB on Thursday. 

At 05:00 GMT, the MI Inflation Expectations for November remain flat at 3.5% on the data front. From the US side, at 18:30 GMT, the CPI for November rose to 0.2% against the projected 0.1% and supported the US dollar. The Core CPI for November also increased to 0.2% against the forecasted 0.1% and supported the US dollar. The Unemployment Claims from last week raised to 853K against the anticipated 723K and weighed on the US dollar that added gains in AUD/USD pair. Furthermore, the hopes that the US FDA will approve within days using Pfizer’s vaccine also supported the risk sentiment in the market and gave strength to the risk perceived Aussie that ultimately added in the gains of AUD/USD pair.

The rising hopes for quick global economic growth also supported the market’s risk flows after the ECB announced on Thursday that it would expand its bond-buying program by nine months. It also raised the stimulus measure by 500 billion euros that will provide support to the Eurozone economy through the coronavirus pandemic. These updates also supported the risk-sensitive Aussie and helped the pair reach its multi-years highest level on Thursday above 0.7500.


Daily Technical Levels

Support Resistance

0.7403 0.7486

0.7362 0.7528

0.7320 0.7569

Pivot point: 0.7445

Entry Price – Buy 0.75374

Stop Loss – 0.74974

Take Profit – 0.75774

Risk to Reward – 1:1

Profit & Loss Per Standard Lot = -$400/ +$400

Profit & Loss Per Micro Lot = -$40/ +$40

Fellas, now you can check out forex trading signals via Forex Academy mobile app. Follow the links below.

iPhone Users: https://apps.apple.com/es/app/fasignals/id1521281368

Andriod Users: https://play.google.com/store/apps/details?id=academy.forex.thesignal&hl=en_US

Categories
Forex Market Analysis

Daily F.X. Analysis, December 11 – Top Trade Setups In Forex on Friday! 

On the news front, eyes will remain on the German Final CPI m/m, which are expected to remain unchanged, and it may not drive any major movement in the market. BOE Gov Bailey is due to hold a press conference about the Financial Stability Report in London. Euro Summit also remains in highlight as the heads of state from the European Union countries are due to discuss the banking union and the capital markets union in Brussels.


EUR/USD – Daily Analysis

The EUR/USD closed at 1.21215 after placing a high of 1.21588 and a low of 1.20633. After falling for four consecutive days, the EUR/USD pair rose on Thursday amid the European Central Bank’s latest decision.

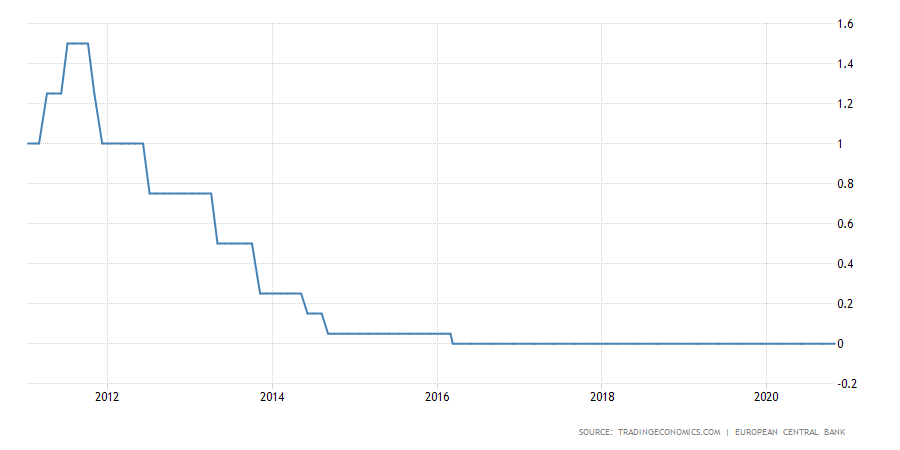
On Thursday, the European Central Bank held its interest rates on its main refinancing operations at 0.00%, marginal lending facility at 0.25%, and the deposit facility at -0.50%. ECB said that it would continue to monitor the exchange rate’s developments about their possible implications for the medium-term inflation outlook.

The European Central Bank expanded its massive monetary stimulus program by another 500 billion euros as the second wave of lockdown measures weighed on the euro area’s economic recovery. It also expanded the emergency bond purchases scheme for nine months worth 1.85 trillion euros and aimed to keep firms and governments afloat until the economy was ready to re-open.

Central Bank also announced that it would hold the interest rates at the same level until the inflation outlook comes close to its below 2% target. The additional support to the Eurozone economy from ECB added that the Eurozone economy will now recover quickly. These hopes added strength in the single currency Euro that helped EUR/USD pair to post gains on Thursday. Meanwhile, on the Data front, at 12:45 GMT, the French Industrial Production for October raised to 1.6% against the expected 0.4% and supported the single currency Euro. From the U.S. side, at 18:30 GMT, the CPI for November rose to 0.2% against the estimated 0.1% and supported the U.S. dollar. The Core CPI for November also raised to 0.2% against the expected 0.1% and supported the U.S. dollar. The Unemployment Claims from last week rose to 853K against the forecasted 723K and weighed on the U.S. dollar that added strength in the EUR/USD pair on Thursday.

The U.S. dollar was also weak on Thursday as the Unemployment claims rose from their expected level during last week due to increased restrictive measures in the U.S. and supported the EUR/USD pair’s upward trend. Furthermore, the U.S. dollar came under more pressure after releasing additional stimulus by the European Central Bank. The U.S. lawmakers were also unable to sort out disagreements over aid to state and local governments, holding up a broader spending package. The U.S. dollar weakness added further support to the upward momentum of the EUR/USD pair.

Daily Technical Levels

Support   Resistance

1.2044       1.2133

1.2006       1.2186

1.1954       1.2223

Pivot point: 1.2096

EUR/USD– Trading Tip

The technical side of the EUR/USD continues to remain the same as the pair is trading at 1.2103 level, facing immediate resistance at 1.2160 and 1.2196 level along with a support level of 1.2085. Closing of candles below the 1.2103 level can send the EUR/USD pair further lower until 1.2080 and 1.2040. Euro Summit will remain in highlights, and the choppy session is expected until the release of the event.


GBP/USD – Daily Analysis

The GBP/USD pair was closed at 1.32900 after placing a high of 1.34108 and a low of 1.32453. The GBP/USD pair declined on Thursday as the meeting between PM Boris Johnson and E.U. Commission President Ursula von der Leyen failed to bridge major gaps between them.

PM Boris Johnson offered his ministers to prepare for the strong possibility of a no-deal Brexit. He said that the E.U.’s current offer was unacceptable because the U.K. could not be treated like its twin. He added that the deal offered by the E.U. was not sensible and was unlike any other free trade deal. He said that it was a way of keeping the U.K. locked in the E.U.’s regulatory orbit.

Johnson added a strong possibility that they would have a solution that will be much more like an Australian & Canadian relationship with the E.U. However, after the meeting, the PM Boris Johnson and E.U. Commission President Ursula von der Leyen agreed that a firm decision should be taken about the future of the talks by Sunday. The talks between the E.U.’s top negotiator Michel Barnier and the U.K.’s top negotiator David Frost will resume Brussels. Whereas, Foreign Secretary Dominic Raab said that it was unlikely the negotiations would be extended beyond Sunday.

At 05:30 GMT, the RICS House Price Balance from the U.K. raised 66% against the estimated 64% and supported British Pound. At 12:00 GMT, the Construction Output in October declined to 1.0% against the expectations of 1.2%. The Gross Domestic Product from Great Britain in October remained flat with expectations of 0.4%. The Goods Trade Balance from the U.K. showed a deficit of -12.0B against the forecasted -9.6B and weighed on British Pound and added losses in the GBP/USD pair. The Index of Services for the quarter also dropped to 9.7% against the expected 9.8% and weighed on Sterling and added further losses in GBP/USD pair. The Industrial Production in October surged to 1.3% against the expected 0.3% and supported British Pound. The Manufacturing Production for October also raised to 1.7% against the projected 0.3% and supported British Pound. 

At 18:30 GMT, the CPI for November surged to 0.2% against the anticipated 0.1% and supported the U.S. dollar that added pressure on GBP/USD pair. For November, the Core CPI also rose to 0.2% against the anticipated 0.1% and supported the U.S. dollar and added losses on GBP/USD pair. The Unemployment Claims from last week increased to 853K against the anticipated 723K and weighed on the U.S. dollar.

Moreover, the E.U. outlined contingency measures for a no-deal Brexit that reflected significant uncertainty whether a deal would be in place on January 1, 2021. This also raised the expectations that a Brexit deal might not be reached and weighed on GBP/USD pair on Thursday.

Daily Technical Levels

Support   Resistance

1.3338       1.3466

1.3280       1.3536

1.3209       1.3594

Pivot point: 1.3408

GBP/USD– Trading Tip

The GBP/USD is trading at the 1.3313 level, holding below an immediate resistance level of 1.3322. On the upper side, the GBP/USD pair can lead to a 1.3390 level, and support stays at 1.3269, which is extended by a double bottom level. Selling bias seems dominant, therefore, we should be looking for a sell trade only upon the violation of 1.3265 level. The lagging technical indicators like 50 EMA is suggesting selling bias, thus we should look for selling trades below 1.3400 and upon breakout 1.3265 level too.   


USD/JPY – Daily Analysis

The USD/JPY was closed at 104.212 after placing a high of 104.577 and a low of 104.139. The USD/JPY pair rose in the early trading session on Thursday amid the rising risk sentiment in the market after the stimulus measure from ECB and the vaccine optimism. On Thursday, an independent committee of experts recommended the U.S. Food and Drug Administration to approve the use of Pfizer and BioNtech’s coronavirus vaccine for people over the age of 16. It will be up to the FDA to decide whether to follow the recommendation or not. The agency is anticipated to announce its decision within days, and if it decides to approve the vaccine, then the health care workers could begin receiving the shots almost immediately.

The vaccine optimism in the U.S. raised the risk sentiment in the market as the chances for vaccine approval raised the chance for quick economic recovery and weighed on the safe-haven Japanese Yen, which ultimately added gains in the USD/JPY pair. The European Central Bank announced expanding its debt purchases scheme and further stimulus measures that also added in the market’s risk sentiment and supported the upward trend in the USD/JPY pair after weighing on the safe-haven Japanese Yen.

However, the USD/JPY pair failed to hold its gain on Thursday and started to decline as the U.S. Unemployment claims from last week raised to their highest since September 19 level. The rise in Americans’ jobless claim benefits was due to the states’ increased restrictive measures that halted economic activities. The raised unemployment claims weighed on the U.S. dollar and dragged the USD/JPY pair on the downside. 

On the data front, at 04:50 GMT, the BSI Manufacturing Index for the 4th quarter raised to 21.6 from the expectations of 3.5 and supported the Japanese Yen and weighed on the USD/JPY pair. The Producer Price Index from Japan came in line as expected -2.2%.

From the U.S. side, at 18:30 GMT, the CPI for November rose to 0.2% against the projected 0.1% and supported the U.S. dollar. The Core CPI for November also raised to 0.2% against the estimated 0.1% and supported the U.S. dollar. The Unemployment Claims from last week rose to 853K against the forecasted 723K and weighed on the U.S. dollar that made the USD/JPY pair to lose all of its gains on Thursday.

Daily Technical Levels

Support   Resistance

104.04        104.41

103.86        104.60

103.67        104.78

Pivot Point: 104.23

USD/JPY – Trading Tips

The USD/JPY violation of the symmetric triangle pattern at 104.346 faked out as the safe-haven currency pair reversed trade within the same triangle pattern. The current trading range of the USD/JPY pair remains 104.375 – 103.650, and violation of this range can extend the selling trend until the next support area of 103.200 level. Typically, such a triangle pattern can breakout on either side; this, we should be careful before opening any trade. The market is neutral as investors seem to wind up their positions ahead of the December holidays. Good luck

Categories
Beginners Forex Education Forex Basics

The Top 6 Things We All HATE About Forex

Most people love forex trading. We would not be doing it if we didn’t. However, no matter how much you love something, there will be things that you do not love about it. When it comes to trading, although we may love it, there are certain things about it that we are not fans of. We have listed some of these things, along with tips for how to avoid them, whenever possible.

Missed Stop Losses

We all use stop losses on our trades. If you do not, then you should. The stop loss is there to protect your account. It is there to ensure that the trades do not go too far into the red when the markets go against you. Many traders seem to think that these stop losses are set in stone. The sad truth is that the markets can in fact move below these levels without it closing and so the stop loss will close at a larger loss. This normally occurs during times of low liquidity and high volatility. The markets will simply jump below the stool loss level and close out at a lower level. This can cause havoc on our overall profits and risk to reward ratio, but it is something that we are going to have to live with, even if we do hate it.

The Markets Move The Wrong Way

As a forex trader, we watch the news, we look out for economic announcements, and generally keep on top of world events. We know that these events can have an effect on the markets and generally the markets react in a  way that can be at least slightly predicted. Bad economic data should make something move down and good economic data should make the markets move up. There are however occasions where the markets just seem to do the complete opposite, for no apparent reason at all. Why this happens, many traders are not sure, the sentiment may just be too high. But when some really bad economic data comes out, something that would normally cause the markets to quite severely drop down, and the markets instead move upwards. This can cause frustrations, especially if trades were put on based on the economic data. This movement against expectations is certainly a cause of major frustration when it happens.

Unforeseen News Events

The economic calendars are fantastic. They give us an idea of what news events are coming up, and what currencies the news will affect the potential impact that they can have on the markets. This enables us to prepare and to stop trading if the conditions won’t be suitable for our strategies. The problems arise when a major piece of economic news comes out of the blue and there is no warning. These news events can cause the markets to jump or even trend, and when it is not predicted or there is no warning. This can catch you out, especially if you are not at your trading terminal and not able to make any adjustments. These news events can cause havoc can lead to losses, which is why we as traders hate them so much.

Long Withdrawals

This is only relevant to some brokers but isn’t it funny how deposits are instant, but it can take up to a week to get your money out. This can lead to a lot of frustrations, especially if you need that money for something. Many brokers are now moving towards same-day or at least next day withdrawals which is great, but there are a lot of them still stuck in the past with long delays to withdrawals. It is frustrating to wait, even if you do not need the money, the wait is something that we hate. Of course, you should not be trading with money that you actually need, so the withdrawal length should not affect your life. Still, it can be a source of frustration, as it is our of money after all.

Scams and Frauds

There are a lot of scams out there and unfortunately, they are giving the idea of trading and forex a bad name. With so many of them from brokers, fake money managers, fake social trading platforms, and more, it is certainly a minefield. Unfortunately, a lot of newer traders seem to fall for them, looking for quick and easy profits. They fall for a scam and then publicise the fact that they were scammed, giving people outside the trading world the idea that it is full of scams and that anyone that trades is potentially a scammer. Legitimate forex traders seem to hate those fake traders simply because of the reputation that they are getting and the reputation that is spreading to the legitimate traders too.

The Risks

If we want to make money there will be risks. Risks are a part of trading, but it is still something that we see a lot of traders say that they hate. We all have different risk tolerance levels. We can all handle different amounts of it, but it will be there with every trade. So while some traders may hate it, it is there, you can reduce the risks but there is no way of removing it completely apart from not trading at all. We all hate certain risks, but when it comes to trading, it is, unfortunately, a necessary evil that we will need to live with.

Those are some of the things that we go through as traders that we absolutely hate. Hopefully, you won’t experience some of them, but we are sure that you will experience at least one of them at some point in your career. If you do go through them, remember that much is out of your control. Do what you can to get past it and to rectify anything that may have happened. It is not the end of the world, even though we do hate it.

Categories
Forex Videos

Forex Trading Algorithms Part 1-Converting Trading Strategy To EA’s & Running Tests On Profitability

Trading Algorithms –  An Introduction


Almost all traders, novices and pros alike, know at least the basics of technical analysis. Still, not many know how to convert a trading idea into a set of rules and then test them for profitability.  This video series aims to be an introduction to algorithms applied to trading. Even if you are not considering creating one EA or trading bot, we think it is very interesting to be proficient in converting your trading idea into formal code and test it. We will use mostly pseudo-code, but also python, a very easy-to-learn but powerful high-level language, and Easylanguage, developed by Tradestation, which is almost as pseudo-code because it was designed to be read as a natural language.


What is an algorithm?

An algorithm is a set of rules to perform a task in a finite number of steps. Basically, an algorithm is a recipe.


For example, if we were to create an algorithm to make a phone call manually. A possible solution could be this :

1.- Open the phone
2.- select the keyboard
3.- dial each number from left to right
4.- Click the green phone icon
5.- Hear the calling sound

6.- Busy tone?
    A- no ---> wait  60 seconds for the answer.
        Did somebody answer?
                Yes--> Start a conversation
                    I - Conversation ended?
                            Yes --> Hang up.
                No --> Hang up
    B- Yes ---> Wait 120 seconds and go to 4th step

Algorithms  used in Trading

There are many ways to create Trading algorithms, including advanced sentiment analysis, evaluating the words used in trading forums and news releases. Still, we will focus on algorithms for historical price action data series.

 The ability to create, test, and evaluate a trading algorithm is a terrific ability to own. This allows creating market models that map and profit from the market’s inefficiencies. If you happen to find one set of rules that historically made profits, it could likely continue making profits in the future. This is the basic premise of automated algos, expert advisors, and trading bots.


Algorithm properties

  • Inputs: zero or more values can be externally supplied. Some algorithms don’t need inputs, although the majority will, and of course, a trading algorithm will need to get timely data from the market to generate outputs.
  • Outputs: at least one result should be delivered. That is logical. The output may not only be a text. It can be a picture, a sound, or a market trading order.
  • Unambiguous: Each instruction must be explicit, with a single meaning.
  • Finite: It ends after a limited number of steps.
  • The algorithm should precisely specify what the computer should do. The computer is not smart. It is dumb. You should tell it precisely the action it has to make.
  • Effective: Every instruction should be basic enough to be made by hand or uses other algorithmic sub-units with the same property. Of course, the action must be feasible, which means the computer can perform that action because the instruction is included in the instruction set of the programming language you’re using.

The key to a good algorithm, as with recipes, is to break the ideas down into simple building blocks.

Flow Diagrams

Algorithms can be more complicated than a simple recipe. Besides, a recipe is interpreted by a (supposedly) intelligent cooker. On the other hand, algorithms are to be interpreted by brainless CPUs. Besides, algorithms usually accept a stream of data inputs, which must be transformed until an output or output is produced.  Flow diagrams are a pictorial representation of the algorithm’s process and data flow.

A Flow diagram is a very handy tool to develop your ideas into coherent algorithms because it helps you spot potential flaws and improvements and should be the first step before proceeding to the actual code.


In the next chapters, we will continue developing this basic idea, applied to trading, using trading examples.


Further reading:

The Ultimate Algorithm Trading Toolbox, by George Pruitt.


Categories
Forex Videos

Forex Position Sizing Part 12 – Two Tier Optimal F Part 2


Position Sizing XIII- Two-Tier Optimal f Part II


In Two-Tier Optimal f part I, we discussed the virtues and drawbacks of optimal f trading. In this part II video, we will present a methodology that will almost ensure that our initial capital is preserved with the possibility of astonishing growth factors on our trading account. This content is exclusive, and, so far, you will not see it explained elsewhere.


System requirements:

This methodology is valid only with profitable strategies. This method is not a miracle solution for losing systems.

It works best when the risk is homogeneous. That is, the dollar risk is a constant R factor to the rewards.

The better the system, the higher the and smoother are the rewards.


The Two-tier Strategy

1.- We split the trading account un two portions. One portion ( 25% of the total in our case) will be used with Optimal f positioning. The other part will be applied to a 1% risk positioning.

2.- After a determined goal (2X, 5X, 10X, 20X of the Opt-f portion), the account will be rebalanced ( by adding both sub-balances together) and then re-split(25%-75%) to start a new cycle. The cycle will also reboot itself if the Opt-f section’s balance goes below 25% of the value at the beginning of that cycle.


What was the procedure to test the two-tier Opt-f position system?

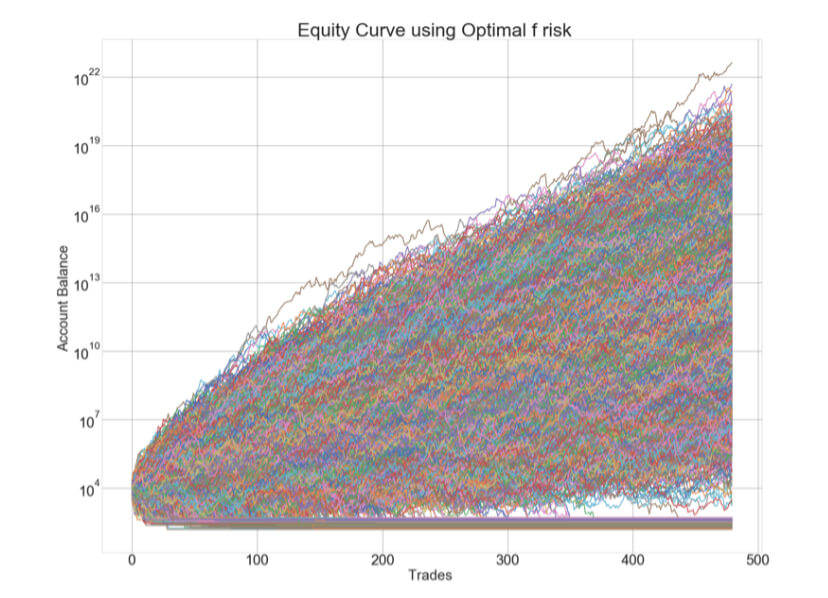
We took the current Signal Table closes signals and created two 10K trading histories of what would have been one year of trading activity. Thus, resulting in two collections of 10,000m years of trading data. One of the collections was to be used with the Optimal f position sizing portion, and the other one was employed in the 75%-portion of the account. The Python code for the entire simulation is shown below.

We did this procedure using several targets for the balance of the portion traded using Opt-f: 2X, 5X, 10X, and 20X. We focused the results on the following parameters: Average final capital, max final capital, min final capital, average trades need to 10X total capital appreciation, average max drawdown, The drawdown with 1% probability of occurrence. In the below table, we also present the results of the 1% risk and 100% Opt-f strategies. ( click the image to enlarge).


Discussion

We see that the 1% risk strategy is not bad at all since it can multiply by five the initial balance in one year. It does this with an average max drawdown of 8.79 percent, with the odds of reaching a 16.2% drawdown on one every 100 years. We see also that, on average, it needs 664 trades to multiply by ten the initial capital.  

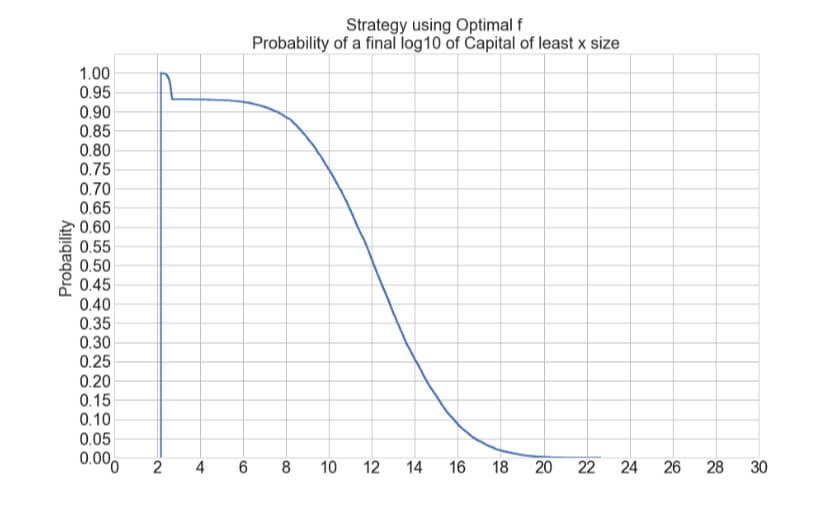
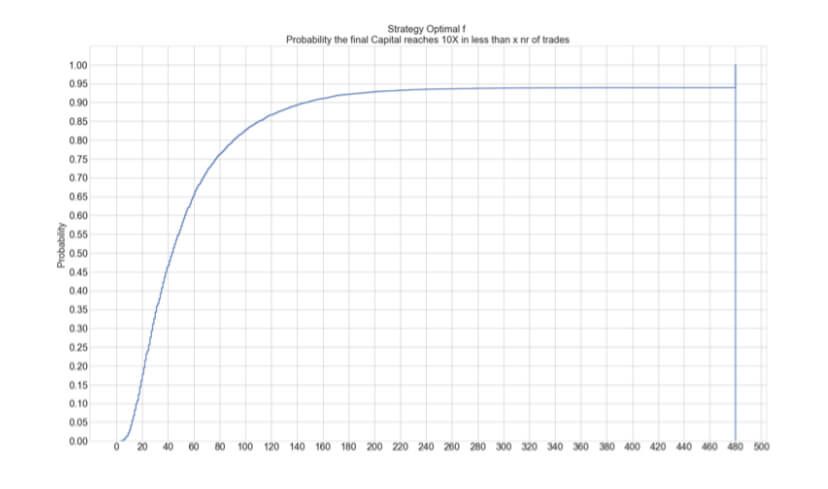
On all two-tier columns, we see a remarkable fact that the min final capital is 10,486. That meant that in all the 10K years of simulated market action, not a single one ended below the initial 10K balance. Thus, this strategy seems to protect us against the loss of the initial capital. That is a terrific psychological reinforcement to withstand the high max drawdowns it presents.  The use of the 2X goal is the best choice for the less bold investors, as this method offers an average max drawdown of 38.32%, with a 1% chance of reaching 59% drawdown.  After one year, the average final capital is $8.5 million, with a starting capital of only 10K.  This positioning strategy multiplies by ten the capital, on average, every 113 trades. The second best choice is a 5X goal.  That will more than double the yearly returns at the expense of a near 50% drawdown on average.   On the table, we can see that the more we increase the goals to rebalance, the more the account growth, but also the max drawdown.

We can see that these strategies’ growth is orders of magnitude lower than fully Optf position sizing. Still, the attractiveness of this strategy is that the odds of being smaller than 10K after one year of trading are virtually none.

More ideas

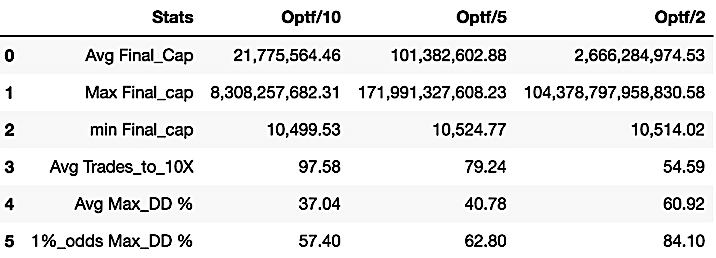
We used 1% as the size used in 75% of the total capital in the preceding trading sizing proposals. Of course, we could modify that to better profit from the total capital with almost no increase in drawdown and fully preserving our initial capital. You can make your own simulations on this to find the best fit for you. As examples, let’s present three more simulations using Optf/10, Optf/ 5, and Optf/2 with 2X rebalancing goals. 


In the image above, we see that using Optf/5 in 75% of the capital will deliver huge profits with 40%-63% Drawdown figures and 79 trades to 10X capital appreciation. All this with almost no chance to blow up the account. 

Final words

This video shows exclusive and never taught position sizing methodologies that protect the initial capital and offer vastly superior results to the 1% risk standard methodology.  But you must be aware that we are assuming the trading strategy is effective long term. The trader will also need to find the safest optimal f value by performing the proper computer simulations.

That also shows that position sizing is part of a trading system that really helps you achieve your monetary objectives. And for optimizing it, you need to know the optimal f of the system you’re using.

Of course, the market will limit the trading size we can reach without influencing it, but as theory, these methodologies are real wealth multipliers for the serious trader.

To employ a two-tier methodology in the real market, you will need to be fully organized, have an appropriate spreadsheet to follow the trade results, have two split balances, and compute the size of the coming positions.

Categories
Forex Course

189. Summary – Trading The News

What did we learn till now? 

Sometimes in the forex market, the movement of prices seems random. In the previous series of courses, we have shown that most of the randomness you observe can be explained. By now, you should be capable of identifying the various news releases published daily. You should also be able to determine which currency pairs the news release is likely to impact.

In this final course, we’ll recap all that we have learned so far.

When it comes to news trading, a forex trader can either have a directional bias to trading or have a non-directional bias. For directionally biased traders, they have to:

  • Familiarise themselves with the economic calendar to know when economic indicators are scheduled for release
  • Understand the impact that each indicator might have and which currency pairs are best to trade
  • Understand that the analysts’ consensus or expectations are what determines if the news release is negative, positive, or in-line
  • Know which news releases to avoid trading

On the other hand, forex traders who have a non-directional bias do not necessarily need to familiarise themselves with these conditions. Such traders only need to know two things.

  • The scheduled release of economic indicators, speeches by influential people, and significant geopolitical events
  • Whether the upcoming event is of a high or low impact

Traders with a non-directional bias only concern themselves with the magnitude of the price movement after an event – not the direction. That is why they adopt the straddle strategy.

The straddle strategy uses forex stop orders, which triggers long or short positions if the market significantly moves in either direction. The buy stop order will trigger a long trade if the news release results in a bullish market. With the sell stop order, s short sell will be executed if the news release results in a bear market.

Remember to be careful when trading the news. Always keep an eye on the prevailing macroeconomic trends and geopolitical events. The overall market sentiment can sometimes amplify or dampen the impact of a news release.

If, for example, moments before the release of UK manufacturing data, the market receives news that the ongoing Brexit negotiations have hit a snag. If the manufacturing data is positive, its impact on the market will be dampened; if the release is negative, its impact will be magnified. All the best.

Categories
Forex Elliott Wave Forex Technical Analysis

EURJPY Consolidates Expecting the ECB Decision Ahead

The EURJPY cross consolidates in the overnight trading session expecting the ECB interest rate decision statement that will take place before the U.S. opening bell. The analysts’ consensus doesn’t expect changes both in the interest rate that remains at 0.0% and in the deposit facility rate that keeps at -0.50%.

Source: TradingEconomics.com

Technical Overview

The following 8-hour chart shows the EURJPY market participants’ sentiment, where the cross looks consolidating in the extreme bullish zone, developing a flag pattern. This chartist pattern suggests the continuation of the previous movement. In this case, the technical formation could be indicative of further upsides for the following trading sessions.

Moreover, the primary trend identified with the upward trend-line in blue remains on the bullish side. Also, the secondary trendline plotted in green reveals the bullish acceleration of the price action. This market context is confirmed by the EMA(60) to Close Index, with a reading above the level 2.000 that suggests the overbought levels and the potential correction or consolidation of the previous rally.

Short-term Technical Outlook

The EURJPY under the intraday Elliott wave perspective unfolded in its 2-hour chart illustrates the advance in an incomplete corrective rally corresponding to wave ((b)) of Minute degree labeled in black. The internal structure shows the cross advancing in its incomplete wave (c) of Minuette degree marked in blue, suggesting a further upside in the following trading sessions.

At the same time, the previous chart reveals the internal five-wave sequence of wave (c) in blue, which exposes the sideways progress of its fourth wave of Subminuette degree identified in green, which belongs to the wave (c) of Minuette degree. 

In this context, considering that the price action could develop a new upward movement, the cross could advance in its fifth wave in green to the potential target zone between 126.84 and 127.48, where the EURJPY cross could complete the wave (c) in blue, and the wave ((b)) in black. Likewise, once this corrective rally completes, the price could start to develop a downward movement identified as wave ((c)) in black.

In this regard, according to the Elliott Wave theory and considering that the mid-term structure corresponds to an incomplete corrective formation constituted by a three-wave sequence, after the completion of the wave ((b)) in black, the price should start to decline in its wave ((c)) with an internal structure subdivided into a five-wave sequence.

Summarizing, the EURJPY cross currently develops a consolidation pattern, which leads to expect a new upward movement with a potential target between 126.84 and 127.48. Once the price completed its target, the cross may start to decline in a five-wave sequence corresponding to wave ((c)) of Minute degree.

Finally, the invalidation level of the current bullish scenario can be found at 124.566.

Categories
Forex Market Analysis

Daily F.X. Analysis, December 10 – Top Trade Setups In Forex – Eyes on ECB Policy Decision! 

On the news front, it’s going to be an important day for the Euro and U.S. dollar as investors await the Main Refinancing Rate and the U.S. CPI figures during the European and the U.S. session. The ECB monetary policy decision, especially the Main Refinancing Rate, is expected to remain unchanged while the Inflation figures can support the U.S. dollar today.

Economic Events to Watch Today  


EUR/USD – Daily Analysis

The EUR/USD pair was closed at 1.20811 after placing a high of 1.21471 and a low of 1.20585. On Wednesday, the currency pair EUR/USD continued its bearish trend for the fourth consecutive day amid the deteriorated risk sentiment and higher U.S. yields that supported the greenback. The U.S. dollar was strong on Wednesday as the U.S. Dollar Index (DXY) rose above the 91.00 level, which was the highest in two days. The coronavirus situation in the U.S. has escalated to an alarming level as more than 200,000 Americans tested positive for the coronavirus every day on average. The total number of infections in the U.S. has surpassed 15 million.

Dr. Anthony Fauci, the nation’s top infectious disease expert, warned on Monday that the country was likely to see a Thanksgiving-related spike in coronavirus cases and hospitalizations in another week or so, in the middle of Hanukkah and just ahead of Christmas. The rising number of coronavirus cases in the U.S. raised the appeal for safe-haven and supported the greenback that ultimately added losses in EUR/USD pair.

Meanwhile, another reason for the continuous losses in the EUR/USD pair was the latest news from Great Britain about the coronavirus vaccine. On Wednesday, Britain’s health officials warned people with significant allergies to avoid receiving the Pfizer-BioNtech vaccine as two people reported an adverse reaction.

On the data front, at 12:00 GMT, the German Trade Balance for October showed a surplus of 18.2B against the expected 18.7B and weighed on Euro. From the U.S. side, at 20:00 GMT, the Final Wholesale Inventories for October surged to 1.1% against the forecasted 0.9% and weighed on the U.S. dollar. The JOLTS Job Opening for October also rose to 6.65M against the expected 6.30M and supported the U.S. dollar that added further losses in EUR/USD pair.

The U.S. dollar was also strong onboard after the hopes for further stimulus package were diminished with the White House’s latest proposal. Steven Mnuchin submitted a proposal on Wednesday worth $916 billion. The offer included only $40 billion towards unemployment benefits that were far less than the amount proposed in the package from a bipartisan group of lawmakers worth $180 billion. Democrats rejected the proposal as they have been trying since the CARES ACT for additional financial aid for laid-off workers.

This new proposal from the Trump administration gave mixed signals in the market. Some believed that the stalemate between Republicans & Democrats would remain intact for long to reach a deal. Others believed that the White House has reengaged in talks for the first time since the election and that it was a positive sign that a compromise could be reached before the end of the year. All the stimulus uncertainty added strength to the U.S. dollar and weighed on the riskier EUR/USD pair on Wednesday.

Daily Technical Levels

Support   Resistance

1.2042     1.2131

1.2006     1.2184

1.1954     1.2220

Pivot point: 1.2095

EUR/USD– Trading Tip

The technical side of the EUR/USD continues to remain the same as the pair is trading at 1.2103 level, facing immediate resistance at 1.2160 and 1.2196 level along with a support level of 1.2085. Closing of candles below the 1.2103 level can send the EUR/USD pair further lower until 1.2080 and 1.2040. However, the focus is likely to stay on the ECB monetary policy decision, especially the Main Refinancing Rate, which is expected to remain unchanged. The choppy session is expected until the release of the ECB report.


GBP/USD – Daily Analysis

The GBP/USD pair was closed at 1.34060 after placing a high of 1.34778 and a low of 1.33455. The GBP/USD pair ended its day in positive territory on Wednesday and climbed above 1.34700 as the final round of talks between UK PM Boris Johnson and the European Commission President Ursula von der Leyen started.

Ahead of the talks, the U.K. Pm Boris Johnson said that the E.U. insisted on terms that no prime minister could accept in EU-UK trade talks. The PM said that a good deal was still there to be done as the E.U. sought an automatic right to retaliate against the U.K. if its labor and environmental standards diverge from theirs. PM Boris Johnson also said that the E.U. could not accept the U.K. as having sovereign control over its fishing waters after Brexit. Major disagreements remain over fisheries, business competition rules, and governance issues.

PM Boris Johnson said that a deal would not be possible if the E.U. insisted that if a new law is passed in the future and if the U.K. did not follow suit, then the E.U. wanted an automatic right to punish the U.K. and retaliate. He also claimed that the E.U. wanted the U.K. to become the only country in the world not to have sovereign control over its fishing waters. He said that he would not believe that any prime minister of this country could accept under these terms. However, German Chancellor Angela Merkel has said that a Brexit deal was still possible but insisted that the E.U. single market’s integrity must be respected.

On Wednesday, PM Boris Johnson arrived in Brussels to find common grounds on significant differences that have stalled the talks for eight months. Over the past couple of days, the optimism has increased that a deal might reach as both sides have successfully reached a post-Brexit arrangement in principle over the Irish border. This optimism kept the British Pound on the upside ahead of the talks and pushed the GBP/USD pair higher. Both sides have confirmed that these final talks’ decision will be revealed on Sunday, and this statement forced investors to lose some of its early daily gains.

Meanwhile, on the USD front, the U.S. dollar was strong across the board. The risk sentiment deteriorated, and safe-haven appeal emerged after the rising number of coronavirus cases posted global economic recovery threats despite the vaccine development. The total number of infections in the U.S. surpassed 15 million on Wednesday, and it was reported that almost 200,000 Americans were tested positive for coronavirus every day in the U.S.

Furthermore, the British Pound lost some of its gains in the late trading session on Wednesday after Britain’s top medical adviser warned people with significant allergies to avoid having Pfizer and BioNtech’s vaccine shots as they could give an adverse reaction. On Wednesday, two people were reported to have an adverse reaction to Pfizer’s coronavirus vaccine in Great Britain and weighed on the local currency that capped further gains in GBP/USD pair.

Daily Technical Levels

Support   Resistance

1.3301     1.3453

1.3236     1.3542

1.3148     1.3606

Pivot point: 1.3389

GBP/USD– Trading Tip

The GBP/USD is trading at 1.3378, holding below an immediate resistance level of 1.3395. On the higher side, the GBP/USD pair can lead to a 1.3437 level, and support stays at 1.3340, which is extended by an upward trendline. Overall it’s an ascending triangle, and it typically breaks on the higher side; thus, we can expect the GBP/USD price to move until 1.3435.


USD/JPY – Daily Analysis

The USD/JPY pair was closed at 104.231 after placing a high of 104.403 and a low of 104.050. USD/JPY pair extended its gains for the second consecutive day on Wednesday as the U.S. dollar gained traction on the day. The hopes for the second round of massive stimulus package from Congress decreased n Wednesday after the Trump administration came up with a new proposal. The U.S. Secretary State Steven Mnuchin submitted a new proposal for an economic relief package that would offer far fewer unemployment benefits than what has been offered by a bipartisan group of lawmakers.

The unemployment benefits for millions of jobless Americans would be delivered as $180 billion under the framework proposed by a bipartisan group of lawmakers. But in contrast to this, the new package submitted by the Trump administration included $40billion in new funding for unemployment benefits.

The bipartisan effort of $908 billion packages has brought the Democrats and Republicans closer to a compromise on a coronavirus package. However, the new White House proposal of $916 billion was a sharp rejection from Democrats as the White House’s proposal was strongly criticized by House Speaker Nancy Pelosi and Senate Minority Leader Charles E. Schumer in a joint statement.

Meanwhile, on Wednesday, the U.S. House of Representatives agreed on a one-week extension of federal government funding that would give lawmakers more time to agree on a massive coronavirus relief package. However, the Senate Majority leader Mitch McConnell said that lawmakers were still looking forward to a relief package.

These developments raised the uncertainty related to the U.S. stimulus package, supported the U.S. dollar, and supported the USD/JPY pair’s upward trend.

Meanwhile, on the data front, At 04:50 GMT, the Core Machinery Orders for October raised to 17.1% against the forecasted 2.6% and supported the Japanese Yen. The M2 Money stock for the year from Japan also raised to 9.1% against the estimated 8.9% and supported the Japanese yen that capped further gains in the USD/JPY pair.

On the U.S. front, at 20:00 GMT, the Final Wholesale Inventories for October rose to 1.1% against the anticipated 0.9% and weighed on the U.S. dollar. The JOLTS Job Opening for October also raised to 6.65M against the projected 6.30M and supported the U.S. dollar that added further gains in the USD/JPY pair.

Daily Technical Levels

Support   Resistance

104.10      104.44

103.90      104.60

103.75      104.79

Pivot point: 104.25

USD/JPY – Trading Tips

The USD/JPY has violated the symmetric triangle pattern at 104.346, and it opens further odds of buying until the 104.750 level. The pair has recently disrupted the sideways trading series of 104.200 – 103850. Now it’s trading at 104.300 level, especially after bouncing off over 103.700 level on the lower side, supporting the pair nearby 103.700 mark. On the downside, the USD/JPY may find support at the 103.200 level upon a bearish breakout of the 103.750 support level. While resistance stays at 104.700 today. Good luck

Categories
Forex Elliott Wave Forex Market Analysis

GBPUSD Ending Diagonal Completion a Warning Sign for a Trend Reversal?

In our last GBPUSD analysis, we discussed its upward advance in an incomplete ending diagonal pattern. We said that the terminal Elliott wave formation progressed in its fifth wave of Minuette degree identified in blue that belongs to a wave ((c)) of Minute degree labeled in black. Likewise, the wave ((c)) corresponds to the third internal segment of the wave B of Minor degree identified in green. 

Technical Overview

The big picture unveiled the sideways movement in an incomplete corrective formation, which could correspond to an expanding flat pattern. In this regard, after the completion of wave B, the Sterling should start developing wave C, which should lead to a decline of this major pair in a five-wave internal sequence.

On the other hand, the following 8-hour chart reveals the market participants’ sentiment unfolded by the 90-day high and low range, which looks advancing in the extreme bullish sentiment zone. 

The previous chart illustrates the bullish failure in the Wednesday trading session, which couldn’t strike the last high of 1.35394. This failure added to the breakdown of the previous upward trendline plotted in green leads us to expect further declines in the coming trading sessions, likely to the ascending primary trend-line identified in blue.

Short-term Technical Outlook

The intraday Elliott wave view for the GBPUSD pair displayed by the following 2-hour chart exposes the breakdown of the ending diagonal pattern formed on December 07th, confirming the completion of the terminal formation unveiled in the wave ((c)) identified in black. 

Once the Pound found the intraday support at 1.32238, the price action began to bounce in an internal corrective rally subdivided in a three-wave sequence corresponding to wave ((ii)) in black, founding resistance at 1.34779 on the Wednesday trading session.

In this regard, the breakdown of the intraday trend-line that connects the waves ((i)) and (b) should confirm the downward progress of its wave ((iii)) in black, which according to the Elliott wave theory, should be the largest wave of the downward sequence.

The third wave in black could find support in the demand zone between 1.31296 and 1.31064. If the price action continues deteriorating, the Cable could drop toward the next demand zone between 1.29843 and 1.29144.

Summarizing

After the GBPUSD pair made a breakdown of its ending diagonal pattern, is currently moving in a corrective rally corresponding to wave ((ii)), which should give way to a new decline corresponding to the third wave of Minute degree. According to the textbook, this movement should be the largest decline of the current downward sequence and could find support in the demand zone between 1.31296 and 1.31064. Finally, the invalidation level of the current bearish scenario can be found at 1.35394.

Categories
Forex Fundamental Analysis

USD/JPY Global Macro Analysis – Part 3

USD/JPY Exogenous Analysis

In the exogenous analysis, we will analyze economic indicators that exhaustively compare the performance of the US and the Japanese economies. These factors impact the dynamic of the USD/JPY pair in the forex market. They include:

  • US and Japan interest rate differential
  • The difference in the GDP growth in the US and Japan
  • Balance of trade

US and Japan interest rate differential

The interest rate differential is the difference between the interest rate in the US and that of Japan. Investors would prefer to invest their funds in a country that offers higher returns. Furthermore, carry traders are often bullish on the currency with a higher interest, which ensures that they earn higher yields.

The Bank of Japan has kept the interest rates at -0.1% since 2016. The current federal funds rate in the US is 0.25%. Thus, the interest rate differential for the USD/JPY is 0.35%. Since there are no foreseeable changes in the interest rates in either country, we assign it an inflationary score of 2.

Balance of trade

Balance of trade determines whether a country has a trade surplus or deficit in international trade. A trade surplus results from a country’s exports being of higher value than that of its imports. A deficit occurs when the imports are of higher value than exports. Japan mostly exports machinery and electronics, which puts it at a significant advantage due to the value of these goods. On the other hand, the US is a net importer.

In October 2020, japan has a trade surplus of ¥872.9 billion, which has been steadily increasing since June. The US has a trade deficit of $63.9 billion, which has been growing throughout the year.

The balance of trade differential between the US and Japan has been widening in favor of Japan. Based on our correlation analysis with the USD/JPY, we assign it a score of -6. It means that if this trend persists, we expect the USD/JPY to be bullish in the near term.

The difference in the GDP growth in the US and Japan

Although the US has a higher GDP than Japan, we can compare the two economies based on their growth rates.

The US economy had a GDP growth rate of 33.1% in Q3 2020, while Japan’s economy expanded by only 5%. The US economy is seen to be expanding at a faster pace than that of Japan. Based on the correlation with the price of the USD/JPY pair, we assign an inflationary score of 2. This means that we should expect a bullish trend on the USD/JPY pair if the US economy keeps expanding faster than that of Japan.

Conclusion

The total score from the exogenous analysis of the USD/JPY pair is -2. This implies that in the near term, we should expect a bearish trend in the pair.

Technical analysis of the USD/JPY pair shows that the weekly chart is still trading way below the 200-period MA. Furthermore, the pair has failed to successfully breach the middle Bollinger band, which has served as its resistance level. All the best!

Categories
Forex Fundamental Analysis

USD/JPY Global Macro Analysis – Part 1 & 2

Introduction

Global macro analysis of the USD/JPY pair involves the analysis of endogenous factors that impact both the USD and the JPY; and exogenous analysis for the USD/JPY pair.

In the endogenous analysis, we’ll focus on domestic macroeconomic factors that drive the domestic growth in the US and Japan. The exogenous analysis will involve the analysis of global macroeconomic factors that define the dynamics of the USD/JPY pair.

Ranking Scale

We will rank both the endogenous and the exogenous factors on a sliding scale of -10 to +10. Whenever the ranking is negative, it means that the macroeconomic indicator led to the depreciation of the currency. A positive ranking means that the indicator had an inflationary impact.

USD Endogenous Analysis – Summary

A score of -19.1 implies a clear deflationary effect on the US Dollar. This means that USD has lost its value since the beginning of 2020, according to these indicators.

You can find the complete USD Endogenous Analysis here.

JPY Endogenous Analysis – Summary

The endogenous analysis for the Japanese economy resulted in an overall inflationary score of 3. Based on this analysis, we can expect that the JPY had appreciated marginally in 2020.

  • Japan Inflation Rate

The inflation rate in Japan is measured by the consumer price index  (CPI). The CPI weights various consumer expenditures depending on their level of importance. Food is weighted at 25%, Housing 21%, transport and communication 14%, recreation 11.5%, energy and water 7%,  medical care 4.3%, and clothing 4%.

A higher rate of inflation is necessary for economic growth. It also forestalls a possible interest rate hike, which is accompanied by currency appreciation.

In October 2020, the MoM inflation rate in Japan decreased by 0.1% constant change since August. The YoY inflation rate decline by 0.4%, the first decline in about four years.

Based on our correlation analysis, we assign Japan’s inflation rate, a deflationary score of -2.

  • Japan Unemployment Rate

The unemployment rate measures the number of Japanese citizens eligible for employment who are currently seeking gainful employment opportunities.

An increasing rate of unemployment means that more jobs are lost in the economy faster than new jobs are being created. That’s an indicator that the economy is contracting.

In October 2020, Japan’s unemployment rate increased to 3.1%, representing 21.4 million people, the highest recorded since May 2017.

Due to the high correlation between the unemployment rate and GDP, we assign it a score of -5.

  • Japan Manufacturing PMI

The Japan manufacturing PMI is also known as the Jibun Bank Japan Manufacturing PMI. The PMI is compiled through a series of monthly questionnaires surveying about 400 manufacturers. The manufacturers are segregated depending on their industry’s contribution to GDP, and their responses aggregated into a diffusion index. When the index is above 50, it means that the manufacturing activity increased while a below 50 reading implies a slow-down in the manufacturing sector.

Japan is a highly industrialized economy, and its manufacturing activities have a high correlation with its GDP growth rate.

In November 2020, the Japan Manufacturing PMI was 49, inching closer to the highest recorded 49.3 in January. Since the manufacturing PMI has been steadily increasing from the lows of 38.4 in May, we assign it an inflationary score of 6.

This PMI is also known as Jibun Bank Japan Services PMI. It is a survey of over 400 services companies operating in the Japanese services industry. A Survey of the purchasing managers is used to track industry changes in employment, inventories, sales, and prices. Sectors covered by the survey include transport and communication, personal services, financial services, hotel industry, and IT. The responses are weighted based on the sector’s size and aggregated into an index from 0 to 100.

When the index is above 50, it signals that there is an expansion in the services industry, while below 50 shows contraction.

In November 2020, the Japan services PMI dropped to 46.7 from 47.7 in October. Although the index is above the lows of 21.5 recorded at the height of the coronavirus pandemic, it is still lower than the levels observed in the pre-pandemic period.

Based on our correlation analysis, we assign Japan services PMI an inflationary score of 2.

  • Japan Retail sales

The monthly retail sales measure the change in the value of goods consumed directly by households. In any economy, the growth in GDP is primarily driven by the demand by households. Thus, retail sales can be considered a significant indicator of economic growth.

In October 2020, the MoM retail sales in Japan increased by 0.4%, while YoY retail sales increased by 6.4%. The increase in October is the first time the YoY retail sales have increased since February. This shows demand in the Japanese economy is growing after the easing restrictions implemented in the wake of the pandemic.

Due to its high correlation with the GDP, we assign Japan retail sales an inflationary score of 5.

  • Japan General Government Gross Debt to GDP

This is the ratio between the amount of debt, both domestic and foreign, that the Japanese government has accumulated to national GDP. Typically, lenders use this ratio to determine if a country’s economy is overly leveraged and if the government might default in the future.

Note that Japan has the largest national debt to GDP in the world. However, although it is heavily indebted, unlike many other countries, Japanese debt is denominated in Yen. More so, foreigners only hold about 6.5% of the total debt. That is why Japan can continue to accumulate such massive debts without any fears of hyperinflation or default risks. But that doesn’t mean that the debt isn’t weighing down on the economy.

In 2019, the Japan national debt to GDP was 238%, an increase from 236.6% in 2018. In 2020, it is projected to exceed 240% due to the measures implemented to fight the pandemic. Based on our correlation analysis, we assign it a deflationary score of -3.

Please check our next article to find the Exogenous analysis of both USD and JPY currencies. We have also come to a conclusion on whether you should expect a bullish or bearish trend in this pair.

Categories
Forex Videos

Position Sizing Part 12 – Two Tier Optimal F – I

Position Sizing XII- Two-Tier Optimal f Part I


In our past video presentation about the Kelly Criterion and Optimal f position sizing methods, we have learned that using these position size methods bring the maximal growth factor to any trading account using a profitable strategy. But, optimal fraction position sizes also presented drawdowns of over 90%, making them unsuitable for any trader except for a robot.

Nevertheless, optimal fraction position size shows the fastest growth rate, meaning achieving a determined goal in minimal time. Consequently, if we were to devise a methodology to reduce drawdown at tolerable levels, diminishing the risk of ruin to zero, and boost the basic 1-percent risk equity progression to unseen levels, we could take advantage of a terrific methodology and produce psychologically acceptable growth optimization.  That is the object of the current video presentation. 

To make this analysis, we used the currently available data from our Live trading signals. That way, our study is as close to a real system as it can be. 

At the time of this writing, we have delivered 203 signals since March 20. Thus, about 51 signals per month, that is, 2.5 signals per trading day. The general statistics were:

STRATEGY STATISTICAL PARAMETERS: 
 Nr. of Trades        : 203.00
 Percent winners      : 65.52%
 Profit Factor        : 2.10
 Average Reward Ratio : 1.11
 Sample Statistics:      
 Mathematical Expectation : 0.3800
 Standard dev            : 1.3682
VAN K THARP SQN           : 2.7774

To find the safest optimal f, we did a Monte Carlo resampling of the original trade sequence. The resampling was done with what would have been one trading year using 10,000 resamples, supplying us with 10,000 years of synthetic market activity.

The resulting optimal fractions were plotted and shown below. We can see a Gaussian bell curve centered at 0.62.

But the average f is not a safe fraction because 50% of the values lie below the average. We seek an optimal f that guarantees as much as possible that no future values lie below it.

Opt f Key Values   
       max: 91.33%
   average: 62.58%
       min: 23.57%

Thus, to be safe, we want the minimum f, which is 23.57%. 

The Live Trade Signals using a fixed 1% risk per trade

To create a reference from which to compare our proposal, we have computed what would have been four years of trading activity using our Live Signals

The next figure shows the equity curves resulting from the 10K resamples, corresponding to a 1% dollar risk on each trade and over what would have been approximately one year of activity.

We see that starting with $10,000, the end capital of the equity curves range from $19,967 up to over $140,000, although the average ending capital is $53,122.

      Average ending Capital : 53,122.77
          Max ending Capital : 154,077.50 
           Min ending Capital: 19,967.23


From these data, we can also create an interesting statistic to answer the question of how many trades are needed to reach a determined goal. In this case, we present the Trades to reach 10X. The curve results from computing this value on all 10K equity curves and computes the odds relative to the number of trades.

In the case of the 1% risk, we see that the average time to reach 10X, the initial capital is about 650 trades, with a minimum of 400 days and a maximum of 1000 days. Not bad at all. But that can be improved dramatically using a mix of conservative and aggressive position sizing.

The optimal F Positioning Strategy

Using the optimal f positioning strategy, a bold investor will navigate in the turbulent waters of one of these equity curves:

The chart is on a semi-log scale because the range of values is too vast to handle on a linear chart. We see that the y-axis show scientific notation, but do not fret. The number of trailing zeros of the equity corresponds with the last digit is in superscript. For instance, in the previous figure, we see that the ending capital after one year of trades ranges from below $1,000 to a theoretical value with 22 trailing zeros.

The next figure shows the cumulated probability of reaching a certain number of trailing zeros:

We observe that a small portion of the equity curves end below 4 digits, meaning they are net losers.  The following data clarifies this by showing relevant figures:

      Average ending Capital : 517.14 billion
          Max ending Capital : 43,096,478,975,341.38 billion 
           Min ending Capital: 153.51
     Capital ending above 517 billion : 55.63 % of the equity curves
     Capital ending above 1 million :  92.51 %
     Capital ending above 100,000 : 92.96 %
     Capital ending below 10,000 :  6.8507 %
     Capital ending below 5,000 :  3.4253 %

And, next, the chart that shows the power of trading using optimal f. The chart shows the time to reach 10X the initial capital,

The graph shows that the average time to reach 10X growth (50% probability) went from about 620 days down to 42 days. The same growth achieved in one-tenth of the time!

The Two-tier risk system.

The proposed system aims to profit from the rapid growth of an optimal fraction position sizing while minimizing the risk of blowing up the account. In this video, we will outline the idea and, in the following videos, will present its results and also the optimal requirements to make it work and minimize the risk.

The critical value here is the percentage of times the optimal f ends below 10K in a determined period.  Here we will take 80 trades instead of one-year of trading, as this shows a more realistic use in a Two-tier system.

40-trade figures:

    Average ending Capital : 213,793 
        Max ending Capital : 5,127 billion 
         Min ending Capital: 154

     Odds of

             Ending above 46,474    : 51.74 %
             Ending above 1,000,000 : 29.61 %
             Ending above 100,000   : 62.82 %
             Ending below 10,000    : 13.35 %
             Ending below 5,000     : 10.40 %

The key idea is based on the odds of the trading capital ending below the initial 10K value. In the case of sequences of 80 trades, we see that the odds are roughly 13.3%, and the odds of ending below 50% of the original figure is just 10.4%. 

That is the risk for the opportunity to have an average of $213,793 ending capital, which is over 21X. The risk/ reward ratio of the proposition is 214/5, which is 43. That means we can be wrong up to 42 times and recover after just one good trading sequence. Our initial proposal is to take 1/4 of the capital to allocate for an opt f positioning strategy.

The Two-tier optimal f proposal 

  1. Take 25% of your current trading balance and use it for the optimal f strategy. Use the rest 75% for 1% risk trades or let it be in cash. (more variations possible)
  2. Let computations of the optimal f strategy be separated in its own pocket to compute the subsequent trades.
  3. The account will be rebalanced after a determined goal has been achieved or goes below a predetermined level ( in our case, we will rebalance if the Optf part drops below ¼ of the initial capital on each cycle).
  4. After rebalancing, a new cycle of 25%-75% allocation begins.

In our next video, we will deal with the results and trade parameters of this combined strategy, as well as our advice on which features are desirable to make this strategy optimal.


Categories
Forex Course

188. Straddle Trading Strategy – An Efficient Way To Trade The News

Introduction 

In the previous lesson, we covered how you can make money if you knew the direction the market was going to move. In this lesson, we will show you how you can make money if you have no idea about the direction the market is going to move.

When there is high volatility in the market, especially as a result of a news release, it is possible to achieve this. Note that this strategy is different from trading with a directional bias.

Let’s break it down!

Firstly, you have to aware of an upcoming high-impact news release. Unlike trading with a directional bias, you don’t have to familiarise yourself with the direction the news will move the market. All you have to know is that the market will significantly move.

Let’s say, for example, that a news release is scheduled for 8.30 AM. Using the 5-minute timeframe, observe the trend for the past 30 minutes and establish the support and resistance levels. You will use these levels to set a buy stop and sell stop order.

With the buy stop orders, if the price breaks above the resistance level, a long order will be triggered. In the sell stop order, if the price breaks below the support level, a sell order will be triggered. Let’s use the news release of the US unemployment rate on October 2, 2020, at 8.30 AM EST.

Here’s the logic behind the straddle strategy. If the news is significant enough to break through the support level, then it is plausible for the bullish trend to continue in the short term. Conversely, if the news release is significant enough to blow the price past the support level, then the bearish trend might progress in the short-term.

Note that you can pre-set your ‘take profit’ and ‘stop-loss’ levels when using the forex pending order types. Doing this ensures that you get to determine your absolute downside in case a trend doesn’t hold. Furthermore, you can opt for only the ‘trailing stop order’ alongside the stop orders. Your ‘stop-loss’ value is not fixed with the trailing stop, which increases your exposure to the upside.

For instance, if, in the above example, we had set our take profit level at ten pips, we would have only made the ten pips. But, if we used the trailing stop order instead, we would have gained more than the ten pips. Cheers!

[wp_quiz id=”98844″]
Categories
Crypto Daily Topic Forex Daily Topic Forex Videos

Position Sizing Part 1 Drawdown – Why You Keep Blowing Your Account!


Position Sizing. Drawdown- The dark side of Trade


This video will be dedicated to explaining the relation between performance and drawdown.  It is an essential topic since most of the trading community ignores the fact that the drawdown of a trading strategy or system is not an independent value. It is position sizing dependent. Furthermore, the profitability of a trading system is also dependent on the size of the position.

Imagine several investors trying to choose a copy-trading service, and you need to rank the potential candidates. Which parameter do you think most of them would choose to grade the quality of that group of systems?  Total returns? Average trade return? Percent winners? Drawdowns?

The majority would rank them by total returns, without any further analysis on how the returns were obtained. This could lead them to select the worst candidate instead. 

The fact is that returns and risks are interlinked in all investments.  You cannot increment returns without increasing the risk. Consequently, traders and investors must analyze both simultaneously.

Let’s look at the characteristics of returns vs. drawdown using a simple position sizing method applied to the trades of one year using a sound system such as our Live Signals Service. 

Let’s see first how this system behaves using just one mini-lot size, which corresponds to $1 per pip gained or lost. 

The figure corresponds to a trader having $1,000 initial capital, using a constant one micro-lot trade. To compute the maximum drawdown, we created 10,000 synthetic account paths using Monte Carlo resampling. The corresponding max drawdown distribution is shown below.

The Average Max Drawdown is 1.94 % with a very tiny possibility a 8% drawdown.

Let’s see how this system performs under increasing lot sizes:

1 mini-lot size

The corresponding drawdown curve  is shown below:

In this case, the average max drawdown goes to 11.77%. But, there is a 30% chance (about one in three) that max drawdown goes to 20%, and in about 2.5% of the occasions, the max drawdown went as high as 40%.

Let’s use now one lot

And the corresponding max drawdown curve is

In this case, the average max drawdown is 40%, but there is a 20% chance of a 65% drawdown and a 5% chance of an 85% drawdown.  40% drawdown is about the limit a usual trader can endure, but inevitably a 65% drawdown would force most traders to stop trading, even when we can see that the system is profitable.

We can see that even using a constant trading size, the drawdown grows with the position size. Of course, we can observe that the returns also grow. Furthermore, profits grow at a much higher rate than risk.  From the preceding examples, any astute observer can notice that moving from one micro-lot to one lot, 1-year returns went from $1,158 to $115,840, a 100X increment, while the drawdown moved from about 2% to 40%, a 20X increase.  

Therefore, the theory behind position sizing is aimed at optimizing both return and drawdown. Of course, there is no single solution to this problem. The solution must fit the particular psychology of the trader. 

Categories
Forex Basics

The Lazy Way to Trade Forex

Let’s be honest, if we could, the majority of us would do everything the lazy way. Why put in the effort and time if you can do it much quicker and with half the effort? This isn’t any different when it comes to forex, with the accessibility that it has now, there are a lot more new traders coming into the trading world, and many of them are not here to put the effort in. Instead, they are here to simply try and take some profits. There is nothing wrong with simply wanting profit or to trade for only the money, many people do this, but when you come into something as huge as forex, you will most likely expect to put in a bit of work, but there are things that you can do that take away a lot of the effort and time that it takes to trade. So that is what we are going to be looking at today, how you can trade, the lazy way.

Gambling

The first and most obvious way to trade the lazy way is to do something that is not recommended at all, and that is to simply place trades without doing any analysis. Doing it this way allows you to trade with very little effort, all you need to do is actually place the trade and it also saves you time from having to do all of the analysis, something that can potentially take a long time to do. Trading this way is a sure-fire way to a loss of your account and let’s be honest, it is simply gambling. So no matter how lazy you are, we would recommend simply not trading this way, instead, go and do some sports betting, you will have more success gambling that way.

Social Trading

Something that has really started to take off in the last few years is social trading, this is where you go onto one of the many platforms that are available, look at the traders that are currently trading and then find the one you like. Once you have found them, you simply subscribe to their profile and your account will start copying their trades. The reason why this is known as a social platform is that you are able to message and communicate with them in order to get some feedback and give your ideas, you can chop and change who you follow at any time from the available traders. This saves you time and effort because all that you are doing is signing up, selecting a trader to follow, and then pressing a single button, all the trades and everything else will then be simply copied from the trader, no effort on your side. The downside to this is that you are fully trusting the other trader, you have no control over the trades so you are effectively giving your account to the other person to trade.

Signals

Another thing that a lot of people seem to be doing lately is to follow signals, this takes little more front than simply copying someone, but signals are where a trader has basically done all the research for you, they then publish the trade that they recommend that you take, it is then up to you to actually put on the trade. So while there is a bit of effort, you are saving a lot of time in avoiding the analysis side of things. Of course, you are trusting that the analysis done by the trader is correct as you are simply blindly following the signal. You can of course do your own research to help confirm it, but then it isn’t quite as lazy is it?

Expert Advisors

There are also expert advisors, these are bits of software that people also refer to as bots. They are often based around an indicator or a number of different indicators and will then take action and open and close trades based on those indicators. So unlike indicators themselves, the EA will actively place and close trades rather than just show you information. This takes away all of the work and time that it takes to trade as the machine will do it for you, it will also trade when you sleep which makes them very desirable. Of course, you are putting your trust in the robot, they cannot think or adapt very well so when the markets change you will need to be there to make changes or to turn it off to avoid larger losses. There is also a startup cost to this method as you will need to purchase torrent the EA, but once that is done, you do not need to put much effort or time in at all.

Using Single Indicators

When it comes to trading, many traders will recommend that you use a lot of different indicators, this brings you a lot of different bits of information that can help you to work out what to trade. The problem is that with each new indicator, it is adding to the amount of time that you will be spending looking at the info and working out how it relates to your trade. So what you can do instead is to take a single indicator and trade with that. It will mean that your trades won’t be quite as reliable or accurate as with more but you will be saving time as you only need to look at that one indicator instead of many. This can be a little risky, and could even be considered as a gamble, but at least you are having one indicator rather than going completely blind, so it is one step further than gambling itself.

Those are some of the lazy ways to trade, if you are planning on doing this then ensure that you look into who you are copying and what EA you are buying, you also need to be comfortable with the fact that you will have very little control over your own trading account as you are trusting someone or something else. It will however give you a lot of time to do things for yourself rather than trading, these methods work well for those that are not really interested in trading themselves or the experience of it, but for those that are simply looking for the profits that come with trading.

Categories
Forex Basics

What Are the Advantages of 1:1 Leverage in Forex Trading?

When it comes to leverage, you often see larger numbers being advertised, brokers trying to entice in new traders and new webers with the promise of sky-high leverage. In fact, the new standard of leverage being given by brokers these days is around the 500:1 level which would have been unheard of a few years ago. Some people, however, still swear by simply not using leverage, to use an account with a 1:1 leverage which basically means that you will be using your own money and only our own money, not borrowing from the broker at all. This does of course come with some advantages, advantages that we will be looking at in this article, so let’s jump in and see what the advantages of trading with a leverage of 1:1 are.

What Is Leverage? 

Before we do that though, a very brief overview of what leverage actually is. Leverage is basically a way of using more money to trade with than you have in your account. If you have a leverage of 100:1, it would basically mean that for every $1 in your account, your broker will let you trade with $100, they would simply lend you the other $99 in order for you to trade. So an account balance of $1,000 would have the trading power of a $100,000 account. This enables you to place larger trades giving you larger profit potential, but it will also increase the risk that you are putting on your balance with the larger trade sizes.

So there are certainly advantages to trading with a higher leverage, especially the profits that we are all after. There are however advantages to keeping your leverage low, so let’s take a look at what they are.

Advantages of Leverage

One of the main advantages to keeping your leverage low is the fact that it enables you to better manage the risk on your account and can allow you to survive for a longer period of time during a period of lots of losses. If we have a trading power of $100,000, this would mean that for an account with a leverage of 100:1 they will only need $1,000, however for an account with a leverage of 1:1, they would need the full $100,000, sounds like a disadvantage needing that much, which is true, but hear us out.

When we put on a trade with an account with the leverage, and the value of the trade drops $1,000, you technically still have $99,000 right? Wrong, due to the leverages, you were able to place those trades, but the $1,000 drop will have completely blown your account. With the leverage at 1:1 however, your account would be set at $99,000, with just the $1,000 lost. So it basically allows you to survive larger movements and consecutive losses that would have otherwise blown a leveraged account.

Transparency

There is also a lot more transparency when it comes to a leverage of 1:1, what you see in your account is what you have and what you have available to trade with. It can be quite confusing when trading with leverage, working out what your margin levels are, working out what your trading power is, and so forth. With the 1:1 leverage, you know exactly what there is and you know exactly what size trades you are able to make. This level of control and transparency can make it far easier to analyse your own account and to work out your risk management plans as well as your risk to reward ratio.

Balancing Losses

Trading with a low leverage keeps losses in line with your account balance, we mentioned before the heavy losses that can come from leveraged accounts, we just wanted to confirm this again. When we trade with low leverage, your losses will be in line with your account, you will be in a much better position to manage those losses and to be able to take a number of them at a time, not putting huge dents into your account. You also do not have any liability when not using leverage, many brokers will charge you a form of interest for using their leverage, so holding trades or simply placing them can mean that you have to incur a charge from your broker. Having a 1:1 leverage will mean that you are not borrowing any money and so do not have to pay the interest for doing so, another advantage and a day to save a little bit of your capital.

Impact on Margin Calls

Trading with a 1:1 leverage also helps you to avoid those pesky margin calls, these are levels set by your broker that are to do with your margin levels. When your margin level falls below the set amount then the broker will basically close all of your trades, this is done to protect you and to prevent you from going into negative balance, something that used to happen quite a lot in the past with leveraged trading. Not having to worry as much about margin calls can take a level of stress out of your trading. It will be very hard to get a margin call when trading on a 1:1 account simply because you are not borrowing any money to trade, what you see is what you have, and so the margin requirements are not as relevant.

Impact on Mental Health

Trading at a low leverage can also be beneficial to your mental health. Trading can be stressful, and when trading with leverage you are adding to that risk and the stress that you will be put under. You are risking more per trade and so each trade will give you additional stresses as you are risking your own money. With a 1:1 account, you are risking a limited amount and so the risks are lower, and so is the stress that you are putting yourself under. If you are a risk-averse person, then low leverage will be perfect for you.

So those are some of the advantages of trading with a 1:1 leverage, we are sure that there are some others out there there are of course some disadvantages too, as there is with any form of trading or leverage amount. You do need a lot of capital to begin with and it will take longer to make decent profits, but you need to weigh up the pros and cons, there are certainly a lot of advantages to trading low leverage, especially if you are not a fan of risk.

Categories
Forex Market Analysis

Daily F.X. Analysis, December 09 – Top Trade Setups In Forex – Brace for BOC Policy! 

On the news front, the economic calendar is filled with the Bank of Canada’s policy rate. The BOC is expected to keep the Overnight Rate rate unchanged at 0.25%, which is likely to drive no major change in the Loonie. The BOC Rate Statement will be worth watching to determine further moves in CAD.

Economic Events to Watch Today  


EUR/USD – Daily Analysis

The EUR/USD closed at 1.21044 after placing a high of 1.21337 and a low of 1.20952. EUR/USD pair fell on Tuesday for the third consecutive session but remained under consolidation in a tight range. The EUR/USD pair avoided major losses as the Euro remained appealing due to broad weakness in the U.S. dollar. The U.S. Dollar Index fell to its two and a half years lowest level on Tuesday and capped further losses in the EUR/USD pair. The U.S. dollar was weak on Tuesday as the country crossed the threshold of 15 million coronavirus cases, which was the world’s highest total. American hospitals braced to ration care amid staff shortages and warned about the rampant spread of the disease.

Pennsylvania’s governor Tom Wolf said that the coronavirus was running extensively throughout the state and could soon reach the level where hospitals will begin turning away patients. He also said that additional pandemic restrictions might be on controlling the spread of the virus.

Meanwhile, the talks for the second round of coronavirus relief stimulus between Democrats and the Republicans and the agreement of both parties over the bipartisan proposal of a $908 billion stimulus package also weighed on the U.S. dollar. Due to stimulus hopes and the rising number of coronavirus cases, the weak U.S. dollar capped further downside in the EUR/USD pair on Tuesday.

On the data front, at 11:30 GMT, the French Final Private Payrolls for the quarter raised to 1.6% against the expected -1.0% and supported the single currency Euro. At 12:45 GMT, the French Trade Balance showed a deficit of -4.8B against the expected -5.5B and supported Euro. At 15:00 GMT, the quarter raised the Final Employment Change to 1.0% against the forecasted 0.9% and supported Euro. The Revised GDP for the quarter dropped to 12.5% against the expected 12.6% and weighed on Euro. The ZEW Economic Sentiment raised in December to 54.4 against the estimated 37.5 and supported Euro. The German ZEW Economic Sentiment also surged to 55.0 from the projected 45.9 and supported Euro.

From the U.S. side, at 01:00 GMT, the Consumer Credit for October fell to 7.2B against the projected 17.6B and weighed on the U.S. dollar and capped further losses in EUR/USD pair. At 16:00 GMT, the NFIB Business Index fell to 101.4 against the estimated 102.6 in November and weighed on the U.S. dollar that capped further losses in the EUR/USD pair.

At 18:30 GMT, the Revised Nonfarm Productivity for the quarter declined to 4.6% against the expected 4.9% and supported the U.S. dollar and supported the downward momentum in EUR/USD pair. The Revised Unit Labor Costs for the quarter came in as -6.6% against the estimated -8.9% and supported the U.S. dollar. 

At 20:00 GMT, the IBD/TIPP Economic Optimism came in as 49.0 in December compared to the previous 50.0.

Moreover, the Euro remained comparatively appealing due to a more optimistic outlook of the Eurozone’s economy than the U.S. that capped further losses in the EUR/USD pair. The ECB’s policy decision is scheduled for Thursday. If the ECB takes a more hawkish tone, then Euro will rise and vice versa.

Daily Technical Levels

Support   Resistance

1.2086        1.2125

1.2071       1.2149

1.2046       1.2165

Pivot point: 1.2110

EUR/USD– Trading Tip

The EUR/USD is trading at 1.2127 level, finding an immediate resistance at 1.2160 and 1.2196 level along with a support level of 1.2085. Closing of candles underneath the 1.2103 level can send the EUR/USD pair further lower until 1.2080 and 1.2040. However, the focus is likely to stay on the German Trade Balance, which is due during the European session. Choppy session expected until economic figures show major deviations. The MACD is mixed, suggesting bearish; therefore, the idea will be to open a sell trade below the 1.2175 level today to capture quick green pips. 


GBP/USD – Daily Analysis

The GBP/USD pair closed at 1.33564 after placing a high of 1.33935 and a low of 1.32894. The GBP/USD pair fell on Tuesday for the third consecutive day amid the rising Brexit uncertainty that took its toll on British Pound. The mixed comments from various officials from both sides raised the uncertainty in the market related to the Brexit deal and weighed on British Pound. The British Cabinet Minister Michael Gove announced that they had reached an agreement in principle. The E.U.’s chief negotiator Michel Barnier told European ministers that a deal’s chances were very thin. At the same time, German Minister Michael Roth said there was no substantial progress in the trade talks between the E.U. and the U.K. He added that it was uncertain whether Britain and the E.U. could reach a trade deal.

All this uncertainty in the market weighed on the British Pound and dragged the pair GBP/USD on the downside. Another factor involved in the GBP/USD pair’s downward momentum was the latest move by the U.K. government to drop parts of its controversial internal market bill that paved the way for both sides to meet in Brussels on Wednesday to settle an agreement.

The U.K. government reached a post-Brexit arrangement in principle over the Irish border with the European Union after agreeing to ditch the most controversial parts of its internal markets bill. On Tuesday, the U.K. government said that it would abandon all the Brexit clauses relating to Northern Ireland in the internal market bill in exchange for promises by the E.U. to minimize checks and control due to being imposed on food and medicines going into Northern Ireland from Great Britain from January 01.

A deal on Ireland is reached between the E.U. and the U.K. it was not one of the key sticking points that have held the Brexit talks hostage. The Brexit talks will enter a last decisive phase from Wednesday as the PM Boris Johnson has prepared to travel to Brussels on that day to secure a deal over the European Union’s relations with the U.K. If he failed to reach an agreement with the E.U. It would mean that from the start of next year, the tariffs would be applied to some trade between the U.K. and the E.U. for the first time in almost half a century. U.K. sends almost 43% of its exports to the trade bloc E.U. and tariffs on its exports will be harmful to its economy. Failure to reach a deal will also end many cooperation types between the U.K. and the E.U. over crime, security, and travel.

The British Pound remains under pressure on Tuesday ahead of the final round of talks between PM Johnson and E.U. Commission President Ursula von der Leyen on Wednesday. On the data front, at 05:01 GMT, the BRC Retail Sales Monitor for the Year raised to 7.7%against the forecasted 5.0% and supported British Pound, and capped further losses in GBP/USD pair.

From the U.S. side, at 01:00 GMT, the Consumer Credit for October declined to 7.2B against the estimated 17.6B and weighed on the U.S. dollar. At 16:00 GMT, the NFIB Business Index declined to 101.4 against the expected 102.6 in November and weighed on the U.S. dollar.

At 18:30 GMT, the Revised Nonfarm Productivity for the quarter fell to 4.6% against the expected 4.9% and supported the U.S. dollar. The Revised Unit Labor Costs for the quarter came in as -6.6% against the projected -8.9% and supported the U.S. dollar. At 20:00 GMT, the IBD/TIPP Economic Optimism came in as 49.0 in December compared to the previous 50.0.

Daily Technical Levels

Support   Resistance

1.3297       1.3400

1.3242       1.3448

1.3193       1.3504

Pivot point: 1.3345

GBP/USD– Trading Tip

The GBP/USD is trading at 1.3378, holding below an immediate resistance level of 1.3395. On the higher side, the GBP/USD pair can lead to a 1.3437 level, and support stays at 1.3340, which is extended by an upward trendline. Overall it’s an ascending triangle, and it typically breaks on the higher side; thus, we can expect the GBP/USD price to move until 1.3435.


USD/JPY – Daily Analysis

The USD/JPY pair closed at 104.161 after placing a high of 104.204 and a low of 103.953. The pair posted gains on Tuesday as the market’s risk sentiment improved due to a combination of factors.

The news that Great Britain has started using the Pfizer vaccine on patients from Tuesday increased the risk-on sentiment as the hopes for economic recovery increased. Another factor involved in the rising risk-on sentiment was the rising hopes that the U.S. will soon deliver the second round of stimulus measures.

On late Monday, the Chinese Foreign Minister, Wang Yi, said that Beijing was open to restarting its relationship with the U.S. He also declared that both countries were at a critical historical stage after a year of intensifying tensions. Wang said that U.S. policy on China needed to return to objectivity and rationality. He also said that both sides should struggle to restart the dialogue and get back on the right track and rebuild mutual trust in the next Sino-US relations phase. Wang blamed the growing division between the world’s two biggest economies on some Americans with outdated Cold War mentality and ideological preconceptions. All these developments in vaccine usage, rising hopes for stimulus, and the U.S. and China relationship raised the risk sentiment that weighed heavily on the safe-haven Japanese Yen that ultimately supported the USD/JPY pair on Tuesday.

On the data front, at 04:30 GMT, the Average Cash Earnings for the Year came in as -0.8% against the expected -0.7% and weighed on the Japanese Yen. The Household Spending for the Year dropped to 1.9% against the forecasted 2.7% and weighed on the Japanese Yen and added gains in the USD/JPY pair. At 04:50 GMT, the Bank Lending for the Year came in line with the expectations of 6.3%. The Current Account Balance from Japan showed a surplus of 1.98T against the forecasted 1.83T for October and supported the Japanese Yen.

The quarter’s final GDP also raised to 5.3% against the expected 5.0% and supported the Japanese Yen. AT 04:52 GMT, the Final GDP Price Index for the Year raised to 1.2% against the forecasted 1.1% and supported the Japanese Yen. At 10:00 GMT, the Economic Watchers Sentiment dropped to 45.6 against the expected 52.7 and weighed on the Japanese Yen that supported the USD/JPY pair’s upward trend.

From the U.S. side, at 01:00 GMT, the Consumer Credit for October fell to 7.2B against the estimated 17.6B and weighed on the U.S. dollar. At 16:00 GMT, the NFIB Business Index fell to 101.4 against the estimated 102.6 in November and weighed on the U.S. dollar. At 18:30 GMT, the Revised Nonfarm Productivity for the quarter declined to 4.6% against the forecasted 4.9%, supported the U.S. dollar, and added further gains in the USD/JPY pair. The Revised Unit Labor Costs for the quarter came in as -6.6% against the projected -8.9% and supported the U.S. dollar and supported the USD/JPY pair’s upside momentum. At 20:00 GMT, the IBD/TIPP Economic Optimism came in as 49.0 in December than the previous 50.0.

Meanwhile, the USD/JPY pair’s gains remained limited as the U.S. dollar was under pressure as the country crossed 15 million coronavirus cases, which was the world’s highest total. American hospitals started to give warnings about the staff shortage and extensive spread of the disease. Pennsylvania’s governor Tom Wolf said that the coronavirus was spreading extensively throughout the state and could soon reach the level where hospitals will begin turning away patients. He also said that additional pandemic restrictions might be on controlling the spread of the virus.

Daily Technical Levels

Support   Resistance

104.00       104.27

103.84       104.38

103.73       104.54

Pivot point: 104.11

USD/JPY – Trading Tips

The USD/JPY is trading within a symmetric triangle pattern observed in the 4-hour timeframe. The pair recently disrupted the sideways trading series of 104.600 – 104.200, and now it’s trading at 104.300 level, especially after bouncing off over 103.700 level on the lower side, supporting the pair nearby 103.700 mark. On the downside, the USD/JPY may find support at the 103.200 level upon a bearish breakout of the 103.750 support level. While resistance stays at 104.350 and 104.700 today. Good luck

Categories
Forex Elliott Wave Forex Market Analysis

EURUSD: is 1.22 at Hand?

The EURUSD pair advances in the extreme bullish sentiment range, consolidating the short-term rally that started on November 04th when the price found fresh buyers at 1.15615.

Technical Overview

The following 8-hour chart shows the short-term participants’ sentiment keeps pushing higher the price action. In this view, the common currency looks to consolidate the pair’s impulsive movement that began in early November.

In this chart, we can see that the current primary trend is clearly bullish. Simultaneously, the accelerated trendline identified with the green line shows the short-term bull market remains intact.

On the other hand, both the intraday sideways channel and the retracement observed in the EMA(60) to Close Index lead to a consolidation of the rally experienced by the common currency during the previous trading sessions.

Therefore, if the price action penetrates below 1.20338, the likelihood of a reversal movement in the EURUSD increases.

Short-term Technical Outlook

The short-term Elliott Wave view for the EURUSD pair unfolded in the next 4-hour chart reveals the advance in an incomplete bullish impulsive wave of Minor degree identified in green.

The EURUSD 4-hour chart illustrates the impulsive rally that began on November 04th when the price found fresh buyers at 1.16025. The price action currently looks to have completed its third wave of Minute degree labeled in black, confirmed by the broadest distance shown on the MACD oscillator

On the other hand, the consolidation structure in progress reveals the potential sideways advance of its fourth wave. Considering the Elliott Wave Principle, the fourth wave shouldn’t penetrate below the invalidation level located at 1.19201, which corresponds to the end of wave ((i)) in black.

Also, considering both the second wave, which looks like a simple corrective pattern, and the alternation principle on corrective waves, the fourth wave should be a complex correction. In this context, the fourth wave could be a triangle or a combination of simple waves grouped in a double-three or a triple-three formation.

Finally, the extension in terms of time should indicate the exhaustion of the bullish pressure; thus, the common currency could soon end its bullish cycle.

Categories
Forex Basics

Follow Top Trader Advice When Getting Started in Forex

Starting the forex journey has a reason, so you first need to know what you want out of trading once you are familiar with the basics. It is not always about the money, some people like the thrill of trading, however, if you want to have some income out of forex forget about getting emotional. The great thing about forex trading is that it is very flexible for you. You can shape trading how you like it, trade only 10 minutes a day, explore an incredible array of methods possible, and use your knowledge how you see fit.

Now we have mentioned a broad spectrum, when you have so many possibilities people start wondering if they have made the right choice. Eventually, your trading will become a result of what you like but also evolve as you develop the skill and discipline. The right path to consistent results is very hard, that is why most fail. But it is not hard to learn to trade, it is hard to fight with the emotions and urges trading will put on you many times. Therefore, we have made a few steps that will put you on the right track, getting started is a crucial moment that will direct you for some time. Sometimes it may take a while to understand that a particular trading method is not for you, but this is ok, successful traders fail and keep trying. 

Treat Trading Like Your Business

If you want to treat forex trading like your little business project, you are on the right track to becoming a professional trader. If you are in for the thrill, make fast money, consult our other articles about this to have at least a bit better luck (probabilities), you are going to need it. Now, making things serious will result in serious outcomes. Forex, after all, will just reflect what you have been doing and how on several aspects: your mindset or psychological aspect, how you manage your capital when trading or risk management, and finally your trading methods. You have to master these three pillars of forex trading. All of these aspects need to align with your personality and lifestyle. 

Now that we have outlined the most important things you need to focus on, let’s first get acquainted with forex and trading. Your first stop can be babypips.com. The internet is full of guides about forex, however, this portal has easygoing content beginners like. You can also consider our article about free resources you can gradually explore as your skill and knowledge grow. Some things need to be understood before trading, consider babypips as your encyclopedia about forex, however, we do not recommend applying right off trading methods in the later lectures about advanced trading. This part has to be molded as you want and at the end of the day, where you have the best results. Actually, the biggest part of making yourself a pro is finding where you perform the best, all aspects combined. 

Trade Demo First!

After you have a picture of what forex is, you might try demo trading. Demo trading can be done in several ways, and again the internet is providing you the best tools for this. Just two decades before, traders had a lot harder way to test their trades. You can try to handle the tradingview.com portal and try out some trading. Use their charting to explore practically what you have learned from babypips lessons, spend some time getting familiar with the charts. The replay button on the top is very handy if you want to test out your trading ideas. 

After you get familiar with charts, time to get to some demo trading. Metatrader platform is great for this and is supported by the majority of the brokers. Find one regulated broker you like, consult our resources to find one, and get familiar with the client, there are many guides online. Demo accounts are where you will spend most of your time, forward testing or trading in real-time, and backtesting your strategies. Only by doing this part, you can know if you have something worth working on further. Of course, there is a proper way of doing this too as we have explored in the previous articles. Know you are most likely into an emotional rollercoaster, what you have made may not work for a long time. If you find yourself in a position you become wondering again, you may need more guidance. 

Take Advantage of All Resources

At this point, you may try to find other resources where you can have a glimpse of how professional traders trade. By professional, we mean proprietary firms and fund traders that have real experience trading large portfolios and manage other investors’ money. To find these people is not easy, however, social media is a good source where to seek them. Learning from the greats is completely normal, even required if you want to get to the top of the forex game. Find like-minded people and their channels on youtube, tweeter or forums. It is important to align your trading ways with similar traders or their strategies.

The result from this is that it could point what is missing from your current strategy which is not performing well. But also, inspired to try new things too. Experienced traders have discovered what works and what is junk already, most of the methods and tools are not very good, so do not be surprised if everything you have made so far is way below what is considered good and consistent. 

Once you make your strategy sound and rigid, traders at this point often fail on the psychological aspects. Messing up with the rules that could work is a common mistake. It is just a matter of if you can keep consistent with your strategy to get consistent results. Of course, the strategy that works is backed up by rigorous proving grounds you had to endure but everything can fail if you do not follow it to the letter. There are so many reasons to get off track on the psychological aspect many professional traders agree this is the most important pillar. Right after it comes how you manage your risk in trading. Therefore, all things considered, you might want also to include some books while you are exploring other strategies and traders. 

Forex Reading Materials

Forex books come in many flavors, however, when you are getting started it is recommended to read those that concern with trading psychology. Some of the most interesting books in this category do not even talk about forex trading, but everyday discipline. Once you have understood some strategies on a more advanced level, and also explored other tools not mentioned on babypips or other media, it is time to make sure you are not making any emotional decisions in forex.

Some of the books we recommend to get started are from Ray Dalio, one of the best economists who can transfer an incredible amount of useful information that is easy to digest. Advanced forex psychology books, but good ones may come from less known traders, such as “No Nonsense Forex Trading Psychology” by Patrick Victor. Books such as these not only point where your drawbacks and mistakes are, but also motivate traders to keep pushing to the top. As mentioned before, not quitting is the only way to succeed.

With this article, you have some starting points but also you know what to do as you progress. Exploring forex trading is a very engaging journey, for those that like the idea they can discover their own strategy or system of indicators that make money over many years will certainly dive into this world and be persistent in their quest. If you need more resources consider our free resources article.

Categories
Forex Elliott Wave Forex Market Analysis

GBPAUD Consolidates in an Incomplete Correction

The GBPAUD cross continues consolidating in what is a corrective formation that continues in development since October 22nd when the price found fresh sellers on 1.85272. In this context, the current consolidation pattern suggests a coming rally in the following trading weeks.

Technical Overview

The next 12-hour chart illustrates the short-term market participants’ sentiment displaying the 90-day high and low range, which bounced in the bearish sentiment zone finding resistance in the neutral level of 1.80104, where the cross is still moving in the current trading session. However, as long as the GBPAUD cross doesn’t surpass and closes above the level of 1.80104, the bias will stay mostly bearish.

The primary trend identified in blue shows that the current uptrend remains in its formation process. In this context, the corrective movement in progress represents a secondary trend from the last upward move that carried the cross from 1.74935 to 1.85272.

Short-term Technical Outlook

The short-term Elliott wave view for the GBPAUD cross shown in the following 4-hour chart reveals the downward advance in an incomplete double-three pattern of Minute degree labeled in black, which suggests further declines for the following trading sessions.

The previous chart shows the GBPAUD developing a double three pattern. According to the textbook, this complex corrective formation follows an internal sequence subdivided into 3-3-3, where each three corresponds to a basic corrective structure.

Currently, the cross looks advancing in its wave (c) of Minuette degree labeled in blue, which belongs to the wave ((y)) of Minute degree identified in black. The movement developed until now fits two potential scenarios:

  • The first scenario considers the pause in the wave (c), which could see further declines to the demand zone between 1.7774 and 1.7716. The cross could even extend its drops until 1.7610 and 1.7554, where the price could find fresh buyers expecting a boost in its price to new highs.
  • The second occurs if the price ends its wave (c) in blue and rally toward fresh highs. In this context, the cross should confirm the breakout of the supply zone resistance at 1.8041. Also, the cross must break up the ((x))-(b) trend-line.

Finally, the invalidation level for this bearish sequence in progress can be found at the end of wave (b) in blue at 1.82144.

Categories
Forex Basic Strategies

Ever Heard Of The Andrew’s Pitchfork Forex Trading Strategy?

Introduction

Pitchfork is a technical indicator developed by Alan Andrews. This indicator consists of three parallel lines- These three lines help us identify the possible support and resistance levels. They also do help us in recognizing potential breakout and breakdown levels. With this, we can identify possible trading opportunities in the Forex market. Long term investors use this indicator to identify and gauge the overall cycles that affect the activity of the underlying currency pair.

Three lines of Andrew’s pitchfork tool are as follows. The first one is the median trend line in the center, and the two equidistant trend lines on each side. Moving from left to right of the chart, these lines are drawn by selecting the three points, which are usually a reaction of highs and lows. As long as price action holds inside the Andrew pitchfork tool, it indicates that the trend is in place. Reversals occur when the price breaks the pitchfork.

Andrew’s pitchfork indicator can be used on all the timeframes, and it works on every single chart. Note that this indicator works very well on all types of securities, such as stocks, cryptocurrencies, futures, or the Forex market.

Picking The Three Points

The first step to know before using Andrew’s pitchfork tool is to select the three points for drawing the trend lines. The first point that we chose must be either a high or low that occurs on the price chart. Once that point is chosen, we must identify the trough and peak to the right and left sides of this point. This must be a pullback, which is opposite in the direction of the ongoing trend. Once these points have been isolated, the indicator is placed on the price chart. The two prongs formed by the peak and trough serves as a support and resistance of the trend as shown below.

Trading Strategies Using The Andrew Pitchfork Tool

Mini Median Method

This one is the most basic and popular strategy used by the traders to trade the market using the Pitchfork indicator. We must place the Andrew Pitchfork tool in a strong ongoing trend and look for the buy/sell opportunities.

In the below image, we marked a few trading opportunities presented by this indicator.  We can see that when the price hits the lower line of the tool, we went long. Likewise, we have activated sell trades when the price action hits the median line. This strategy is basic, but it provides a good risk to reward ratio trades in a strong trending market.

In case of a buy entry, exit your position when the price hits the median line. Conversely, take sell when price reverses at the median line, and we can book our profit at the lower line. Place the stop loss a few pips above your entry and ride the move.

This approach works best for aggressive traders who prefer to pull the trigger when prices reach any significant level. So, if you are an aggressive trader, you can go with this approach. But if you are a conservative/confirmation trader, follow the next strategy.

For Conservative Traders

Most conservative traders do not prefer taking many trades in a single day because they tend to seek extra confirmation before pulling the trigger. This Pitchfork strategy is for them.

When the price action approaches the lower line of the indicator, wait for the price action to hold there to take entry. The holding confirms that the price action respects the dynamic support line, and going long from here will be a good idea.

As you can see in the below price-chart, the USDJPY was in a strong uptrend. We have identified three opportunities to go long, but out of three, only two trades were held at the lower support line to confirm the entry. Both of our trades worked very well, and they went on to make a brand-new higher high.

By using this approach, we can safely trade the market. We must always go for smaller stops because the holding at any significant area confirms the power of buyers.

Breakout Trading

Breakout trading is a popular way to trade the markets. Most of the highly successful traders, market technicians, chartists, banks, hedge fund managers use this approach to trade the Forex market. In this strategy, let’s understand trading the breakouts successfully by using the Andrew Pitchfork tool.

The idea is to find a strong trending market first and wait for the price to pullback. When the price gives enough pullback, place the Andrew pitchfork tool on price action and wait for the breakout in the ongoing trend direction. When the breakout happens, take the trade in the direction of the ongoing trend.

As you can see in the below image, the USDJPY was in an uptrend, giving quite deeper pullbacks. When we got enough pullback, we applied the tool on the price action, and when the breakout happened, we went long. Look for the breakouts only in the direction of the ongoing trend.

The chart below represents our buy entry and risk management in this pair. We went long when the breakout happened, and the stop-loss order was placed just below the breakout line.

There are several ways to book our profits. We can use indicators like RSI and Stochastic to confirm our exits. Here we have used the pitchfork itself to book our profit in the above-discussed trade. When we activate a trade at the breakout, the first thing we must do is to apply the Andrew Pitchfork tool in the direction of our trade and wait for the price action to break the tool to book the profits.

In the below image, we applied the tool when our trade took off, and at around 109.60, the price strongly broke the Andrew pitchfork tool. This is an indication for us to close our whole buying position. Also, you can notice that after our exit, the price action blasted to the south.

Conclusion

Just like other trading tools, Andrew pitchfork is not perfect. We need to have strong knowledge of the money management techniques in place before using this tool on live markets. If you are a novice trader, it is advisable to gain experience by experimenting with this tool on the demo account. Using this tool first hand, we are sure that you will discover various ways of using this tool. This will enhance your ability to understand the market better. Cheers!

Categories
Crypto Daily Topic Forex Daily Topic Position-sizing Guide

Forex Academy’s Guide to Position Size

After completing our series on position size, we would like to summarize what we have learned and make conclusions.

Starting this video series, we have understood that position size is the most crucial factor in trading. On Position Size: The most crucial factor in trading, we learned that deciding the position’s size is not intuitive. In an experiment made by Ralf Vince using forty PHDs with a system with 60 percent winners, only two ended up making money. Thus, if even PHDs couldn’t making money on a profitable strategy, Why do you think you’re going to do it right? You need to follow a set of rules not to fool yourself.

The Golden rules of trading

The trading environment seems simple, but it’s tough. You have total freedom to choose entries, exits, and the size of your trade. Some brokers even offer you up to 500x leverage. But you’re not free from yourself and your psychological weakness, Therefore, you need to set up a set of rules to stop the market to play with you. In “The golden rules of Forex trading” III, and III, we propose specific rules it is advisable to follow to succeed in trading. These include never open a position without knowing your dollar risk, defining your profits in terms of reward/risk factors, and limit your losses to less than 1R, a risk unit. We also advise to keep a record of trades and identify your strategy’s basic stats: Average profit, the standard deviation of the profits, and drawdown.

The dark side of the trade

In our video, The Dark Side of Trade, we explain the relation between position size, results, and drawdown, showing that position size plays a vital role in both aspects. In the video, We show that while results grow geometrically ( 100x), drawdown increase arithmetically, 10X. But the lesson here is that the size of the position must be chosen with the drawdown in mind. That is, we should choose a position size so that the max drawdown could be limited to a desirable size. 

The Gamblers Fallacy 

on Position Size – The Gamblers Fallacy, we explain why it is wise to consider position sizing independently of the previous results. We explain that a new trading result does not usually depend on prior results; thus, modulating the trade size, such as do Martingale systems, is not only useless but dangerous because winning or losing streak ends are unpredictable.

The Advantage!

Even when most retail traders don’t realize it, the “how much” question is the advantage or critical factor to achieve your trading goals because the size of the position defines both the trading results and the risk, or max drawdown, in your trading portfolio. We mention in Position Sizing III- The Advantage that in 1991 the Financial Analyst Journal published a study on the performance of 82 portfolio managers over a 10-year period. The conclusion was that 90% of their portfolio differences were due to “asset allocation,” a nice word for “investment size.”

In this article, we also presented the simplified MCP model to compute the right lots to trade as:

M = C/P, where M is the number of lots, C is the (Cash at) Risk, and P is the Pip distance from entry to stop-loss. The cash will depend on the percent you’re willing to risk and the cash available in your trading account. 

Equity Calculation Models

In our next video of this series, Position Size IV – Equity Calculation Models, We explain several models to calculate several simultaneous positions: 

  • The Core Supply Model, in which you determine the nest trade’s size using the remaining cash as the basis for computing C.  
  • The Balanced Total Supply Model, in which C is determined by the remaining cash plus all the profits secured by a stop-loss.
  • The Total Supply Model, in which the available cash is computed by adding all open position’s gains and losses plus the remaining cash.
  • The Boosted Supply Model uses two pockets: the Conservative Money Pocket and the Boosted Monet Pocket. 

The Percent Risk Model

The Percent Risk Mode is the basic position sizing model, barring the constant size model. on Position Sizing Part 5, we analyze how various equity curves arise when using different percent risk sizes and how drawdown changes with risk. Finally, we presented an example using 2.5 percent risk for an average max drawdown of 21 percent.

The Kelly Criterion

Our next station is  The Kelly Criterion. The linked article explains how the Kelly Criterion is used to find the optimal bet amount to achieve maximal growth, based on the winner’s percentage and the Reward/risk ratio. The Kelly criterion was meant for constant reward bets, and as such, it cannot be used in trading, but it tells us the limit above which the size of the position increases the risk while decreases the profits. We should be aware of that limit considering that most retail Forex traders trade beyond it and blow out their accounts miserably.

Optimal fixed fraction trading

Optimal fixed fraction trading, Optimal f for short, is the adaptation of the Kelly criterion to the financial markets. The optimal f methodology was developed by Ralf Vince. In Position Size VII: Optimal Fixed Fraction Trading, we explain the method and give the Python code to find the Optimal fraction of a stream of trading results. The key idea behind the code is that the optimal fraction is the one that generates the maximal growth factor on a set of trades. That is, Opt F delivers the maximal geometric mean of the trading results.

Optimal f properties

But nothing in life seems easy. Optimal f has dark corners that we should be aware of. In Position size VIII – Optimal F Revisited, we analyze the properties of this positioning methodology. We understood that, due to the trading results’ random nature, we should find a safer way to find the optimal fraction to trade. This article presented a safer way to compute it using Monte Carlo resampling and take the minimum value as optimal f. This way, the risk of ruin is minimized while preserving the strong growth factor Opt f provides.

Market’s money

Traders define their recent trading gains as “market’s money. A clever way to profit from the usual winning streaks is to use the market’s money to increase the position size in a planned manner. In Position Sizing IX: Improving the Percent Risk Model-Playing with market’s money,

we present the N-Step Up position sizing strategy, an innovative algorithm that adds the gains obtained in previous trades to boost the profits. This way, it could increase the profitability by 10X with a max drawdown increase of roughly 2.8X, from 8.02% to 22.5%. This article analyzes four models: one, two, and three steps with 100% reinvestment and three steps with 50% reinvestment.

Scaling in and out

Our next section, Position sizing X: Scaling-in and scaling-out techniques, is dedicated to scaling in and out methods. Scaling in and out are techniques to increase the position size while maintaining the risk at bay. They work best with trending markets, for instance, the current crypto and gold markets. The main idea is to use the market’s money to add to our current position while trailing our stops. 

System Quality and Max Position Size

System quality has a profound influence over the risk, and, hence, over the maximum position size, a trader can take. In Position Sizing XI- System Quality and Max Position Size Part I and part II, we presented a study on how the trading strategy’s quality influences the maximum position size a trader should take. To accomplish this, we created nine systems with the same percentage of winners, 50 percent. We used Van K Tharp SQN formula to compute their quality and adjusted the reward to risk on each system to create nine variations with SQN from 1 to 5 in 0.5 steps. 

Then, since traders have different risk limits, we defined as ruin, a max drawdown below ten preset levels from 5 to 50 in 5-step.   

 Our procedure was to create a Monte Carlo resampling of the synthetic results, which simulated 10 thousand years of trading history on each system.  

Since a trading strategy or system is a mix between the trading logic and the trader’s discipline and experience, we can estimate that the overall outcome results from the interaction of the logic and the treader. Thus, we can accurately associate a lower SQN with lowing experienced traders and higher SQN to more professional traders. The study’s concussions suggest a limit of 0.5 percent risk on newbies, whereas more experienced traders could boost their trading risk to an overall 4.5%.

Two-tier Optimal f Positioning

After this journey, we have understood that Using Ralf Vince’s optimal f position sizing method means maximally growing a portfolio. Still, the risk of a 95% drawdown makes it unbearable for any human being. Only non-sentient robots can withstand such heavy drops. In Position sizing XII- Two-tier Optimal f, we analyzed the growth speed of a 1% risk size, and we compare it with the Optimal f. We were interested in the average time to reach a 10X final capital. We saw that on a system with 65.5% winners and a profit factor of 2 ( average Reward/risk ratio of 1.1), using 1 percent risk, it would take650 days ( about two years) on average, whereas, using optimal f sizes, this growth was reached in 42 days, less than one-tenth of the time!.

The two-tier Optimal f positioning method uses the boosted supply model, and is a compromise between maximal growth and risk. The main objectives were to preserve the initial capital while maintaining the Optimal f method’s growth characteristics as much as possible.

The two-tier optimal f creates two pockets in the trading account. 

  1. The first pocket, representing 25% of the total trading capital, will be employed for the optimal f method. The rest, 75%, will use the conservative model of the 1 percent model.
  2. After a determined goal ( 2X, 5X, 10X, 20X), the account is rebalanced and re-split to begin a new cycle.

In Position sizing XII- Two-tier Optimal f part II, we presented the Python code to accurately test the approach using Monte Carlo resampling, creating 10,000 years of trading history.

 The results obtained proved that this methodology preserved the initial capital. This feat is quite significant because it shows the trader will dispose of unlimited trials without blowing out his account. Since the odds of ending in the lowest possible scenario are very low, there is almost the certainty of extremely fast growths.

Finally, we also analyzed other mixes in the two-tier model, using Optf / 10, Optf/5, and Optf/2 instead of 1%, with goals of 10X growth to rebalance. These showed extraordinary results as well while preserving the initial capital. B.

Drawdowns

The trader should also consider the drawdowns involved before deciding which strategy best fit his tastes because, while this methodology lowers it, in some cases, it goes, on average, beyond 60%. We have found that the best balance between growth and risk was the combination of 75% Optf/10 and 25% Optf, which gave an average final capital of $21.775 million with an average drawdown of 37%.

To profit from this methodology, the trader must ensure the long-term profitability of his system. Secondly, he must perform a Monte Carlo analysis to find the lowest optimal f value. Finally, he should create an adequate spreadsheet to follow the plan.

Final words

After reading all this, we hope you know the importance of position sizing for your success goals as a trader.

One caveat: We have left some topics out, such as martingale methods, which many traders use and are the main cause of account blown out. Please adhere to the philosophy that position sizing should be thought of as a tool to reach your goals and handle your risk and drawdowns. As shown in The Dark Side of the trade, position sizing should be separated from the previous trades’ results.

Categories
Forex Course

187. Learning To Trade the News With Directional Bias

Introduction

In this course, we will further explain, with an example, how you can trade a news release with a directional bias. In the US, the labor market report is one of the most anticipated new releases in a month. The report has a significant impact on any pair with USD. Note that every trader has their approach to trading the news with a directional bias. Here’s our approach.

If you are a forex trader with a directional bias, you need to have in-depth knowledge of the news release you are trading. What do we mean by in-depth knowledge? Firstly, you have to know what that particular news release tells about the economy. For example, the US labor market report has the unemployment rate and nonfarm payroll data.

When both these indicators beat the analysts’ expectations, we can expect that the USD will become stronger than other currencies. The US labor market report is a leading indicator of consumer demand, contributing up to 70% of the GDP. Furthermore, in the current coronavirus pandemic, the labor market report is used to show the rate of economic recovery.

You’d also expect the USD to weaken relative to currencies it is paired with if the news of the labor market report doesn’t meet analysts’ expectations. In this case, it means that unemployment increased, and the economy didn’t add as many jobs as expected.

To make a proper directional bias trade, you need to understand how the labor market report impacts the forex price charts. You have to look into past releases and establish how much the market moved; this will help you get the average pip movement. You also need to be aware of the prevailing macroeconomic conditions and the recent unemployment rate trend.
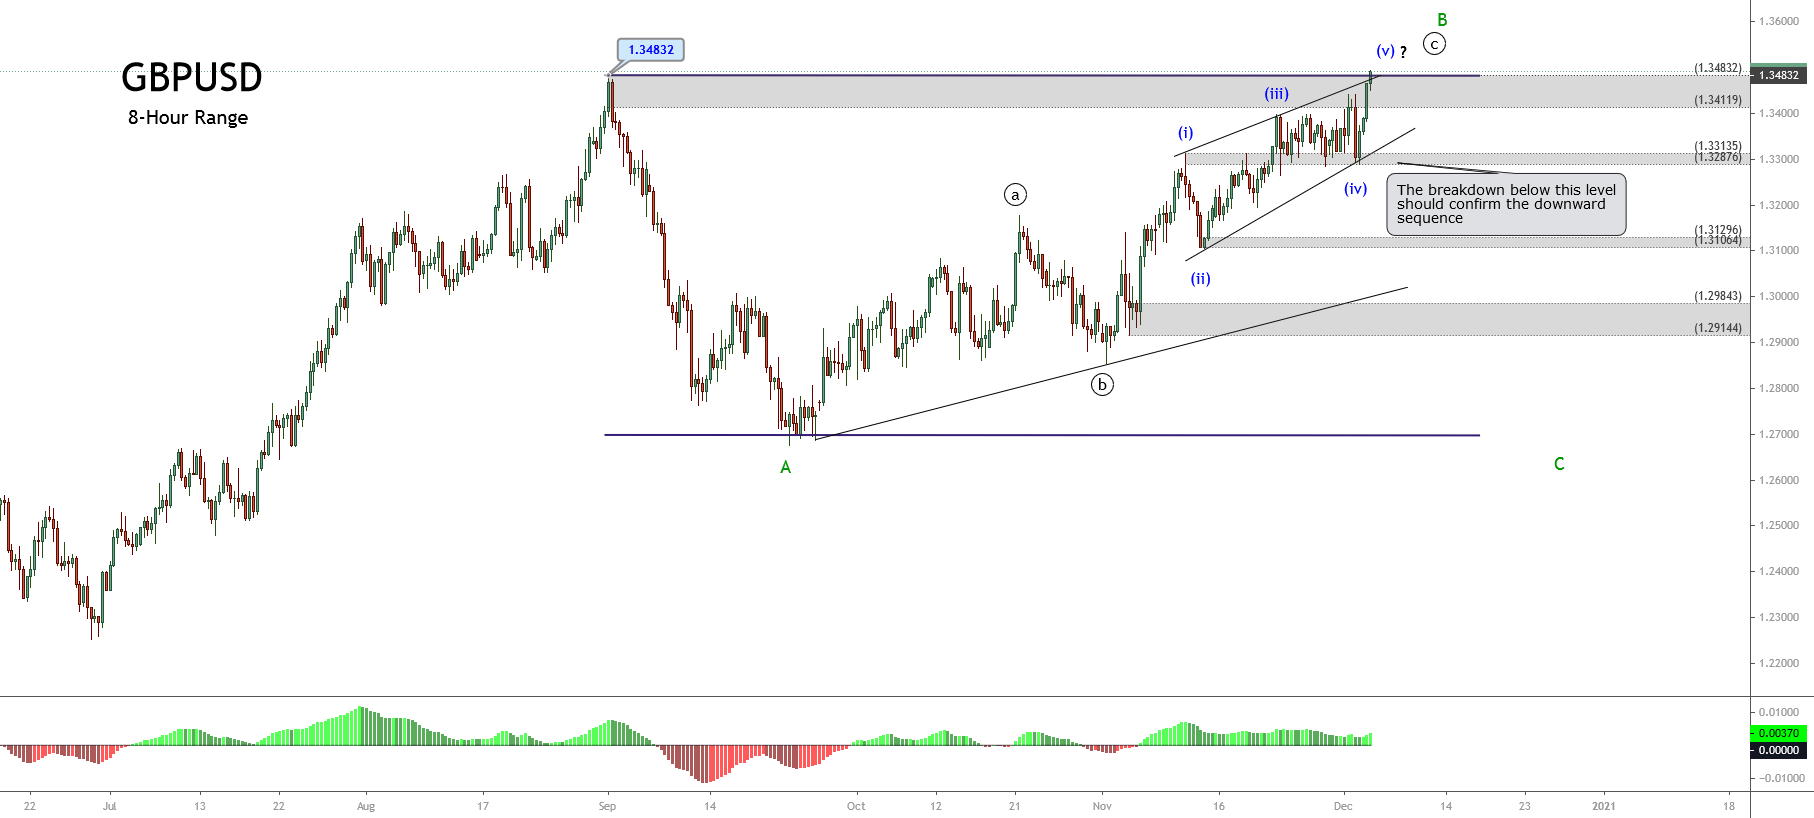
What to do before the news release?

Go back a few hours on your chart and establish the intraday support and resistance levels. You will use these levels as your ‘take profit,’ and ‘stop-loss’ levels after the news is released.
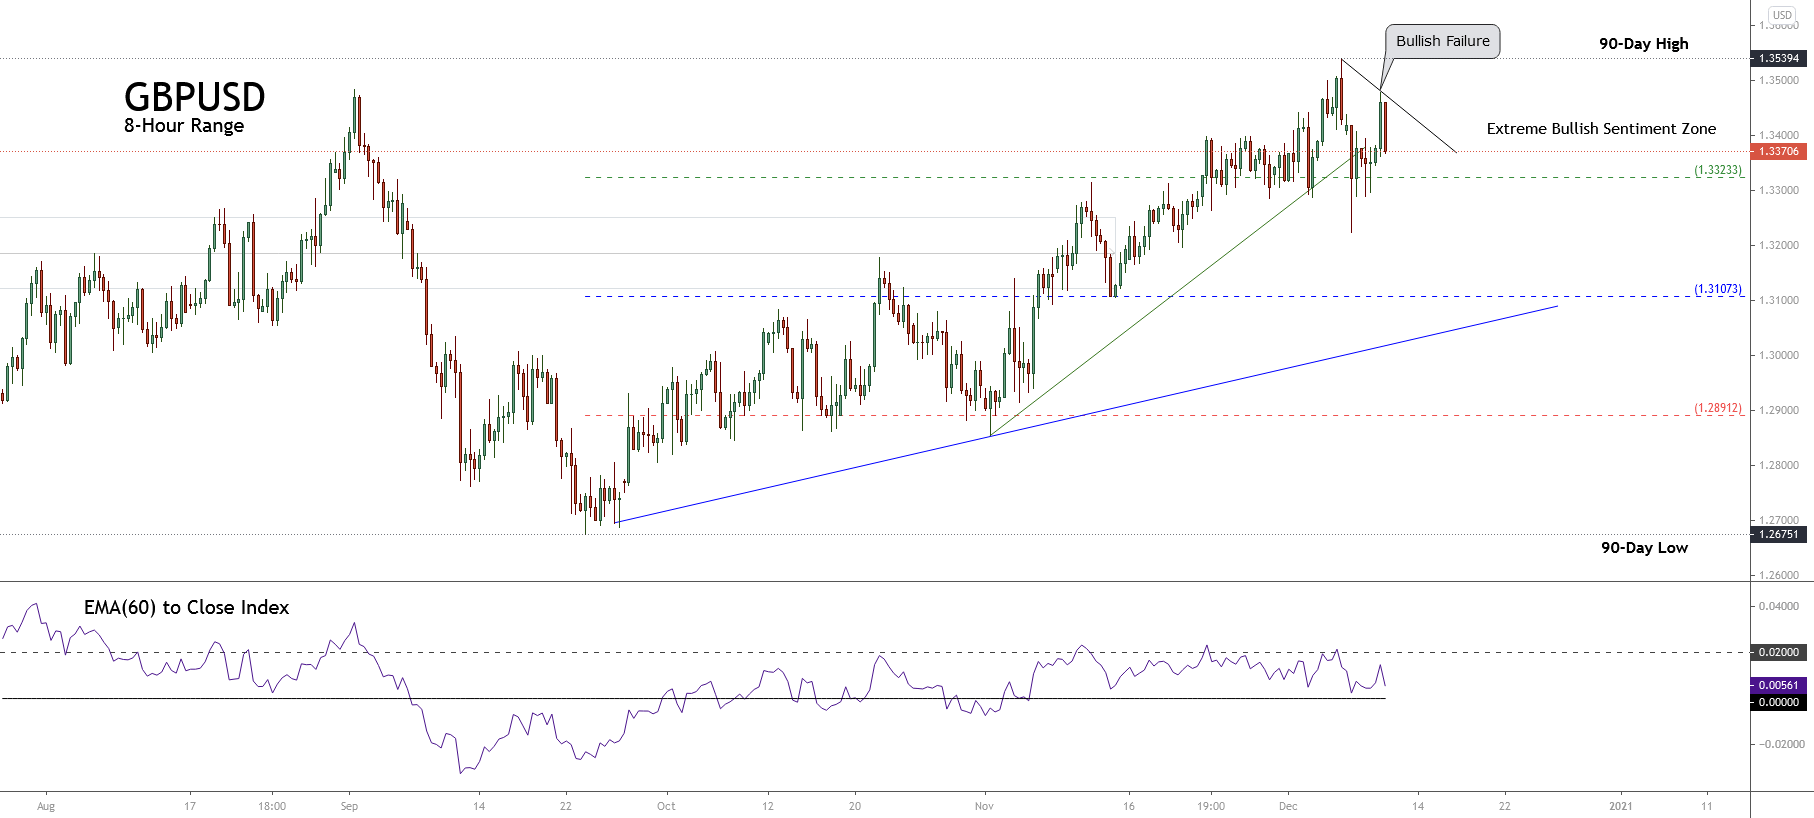
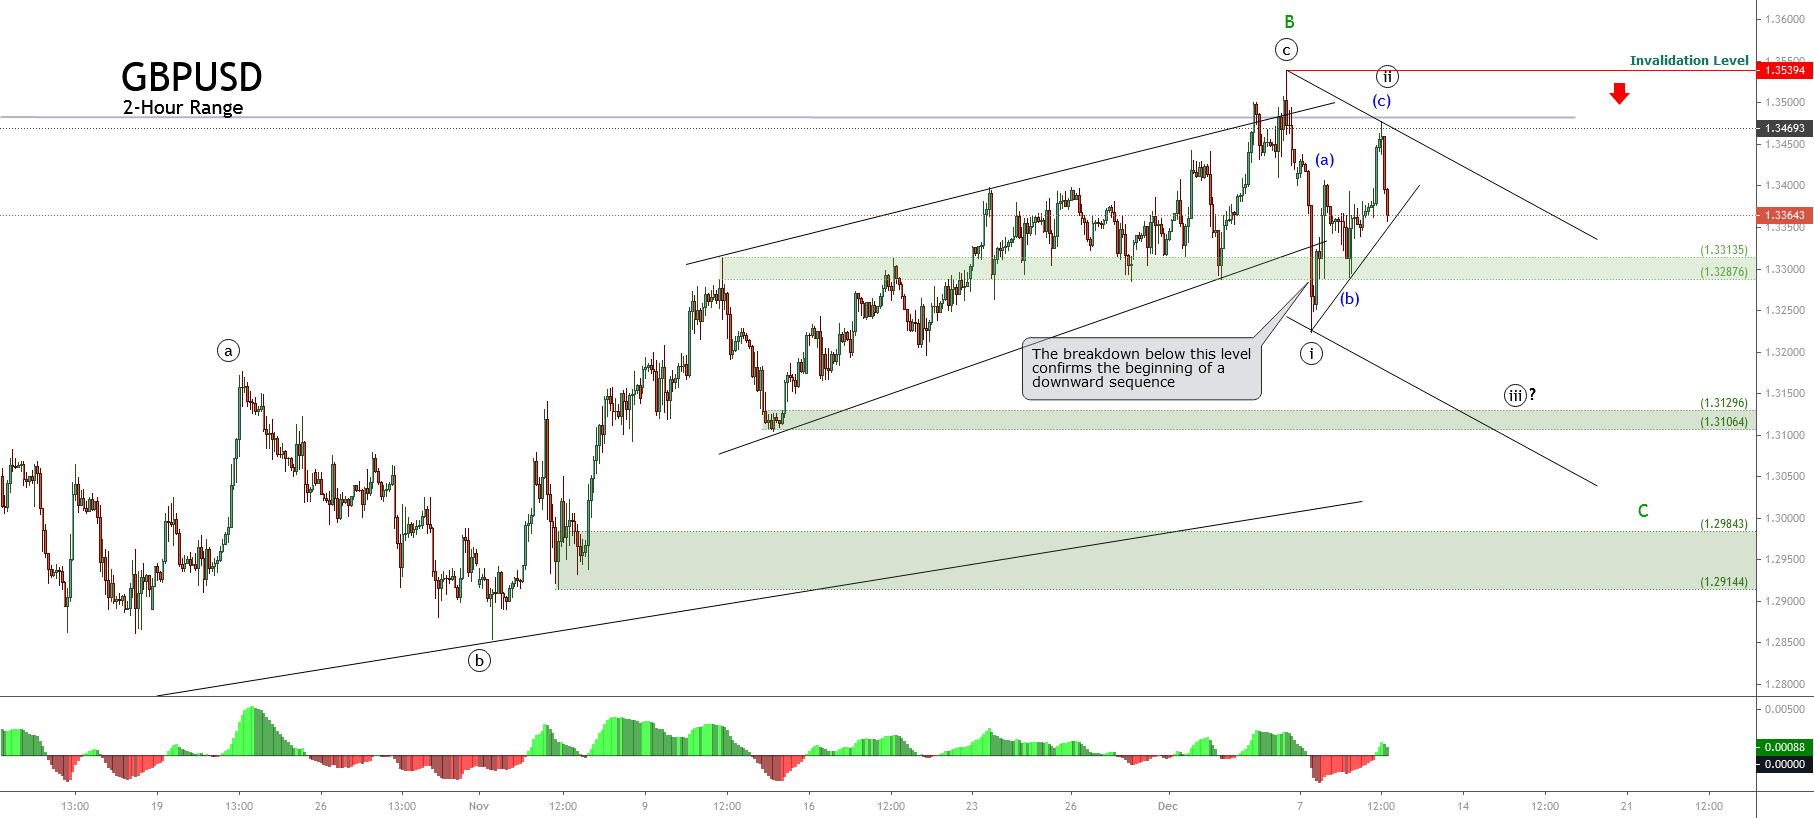
Let’s check out the news release of the US unemployment rate on October 2, 2020, at 8.30 AM EST.

EUR/USD: Before US Unemployment Rate Release on October 2, 2020, 
just before 8.00 AM EST

Since the unemployment rate was lower than the previous release and also beat analysts’ expectations, our directional bias is to be bearish on the EUR/USD pair. In this case, we will use our previously established Support Level as the ‘take profit.’

EUR/USD: After US Unemployment Rate Release on October 2, 2020, 8.00 AM EST

[wp_quiz id=”94037″]
Categories
Forex Fundamental Analysis

EUR/USD Global Macro Analysis – Part 3

EUR/USD Exogenous Analysis

In the exogenous analysis, we’ll analyze the economic fundamentals that impact the Euro-US Dollar exchange rate. For this analysis, we’ll focus on:

EU and the US GDP Growth Difference

The primary drivers of GDP growth in an economy are domestic demand and international trade. When a country’s exports increase, it means that the demand for its currency also increases, which makes it appreciate.

The US and the EU GDP change are in tandem. In Q3 of 2020, the EU GDP expanded by 11.6%, while that of the US expanded at an annualized rate of 33.1%. Although this change seems much, the US GDP level is still about 3.5% lower than the pre-coronavirus pandemic levels.

Based on the correlation analysis of the GDP differential and the EUR/USD pair changes, we assign a deflationary score of -2. It implies that the difference in GDP growth between the EU and the US will lead to a bearish EUR/USD.

Trade Balance Difference

For each country, the trade balance shows if an economy is running on deficits in international trade. The trade balance is simply the difference between exports and imports. Surplus trade balance happens when an economy exports more than it imports. A negative trade balance means an economy is importing more than it exports.
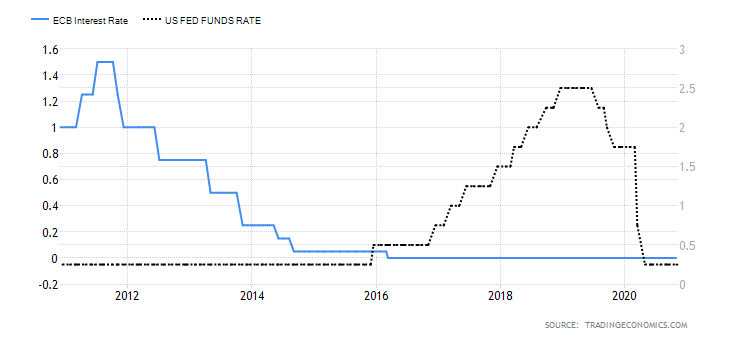
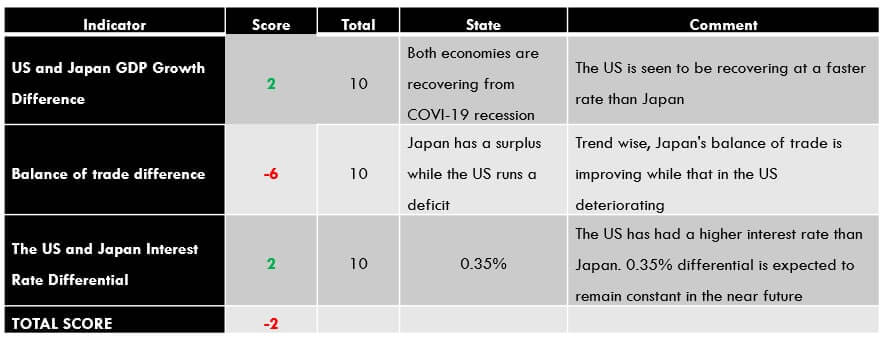
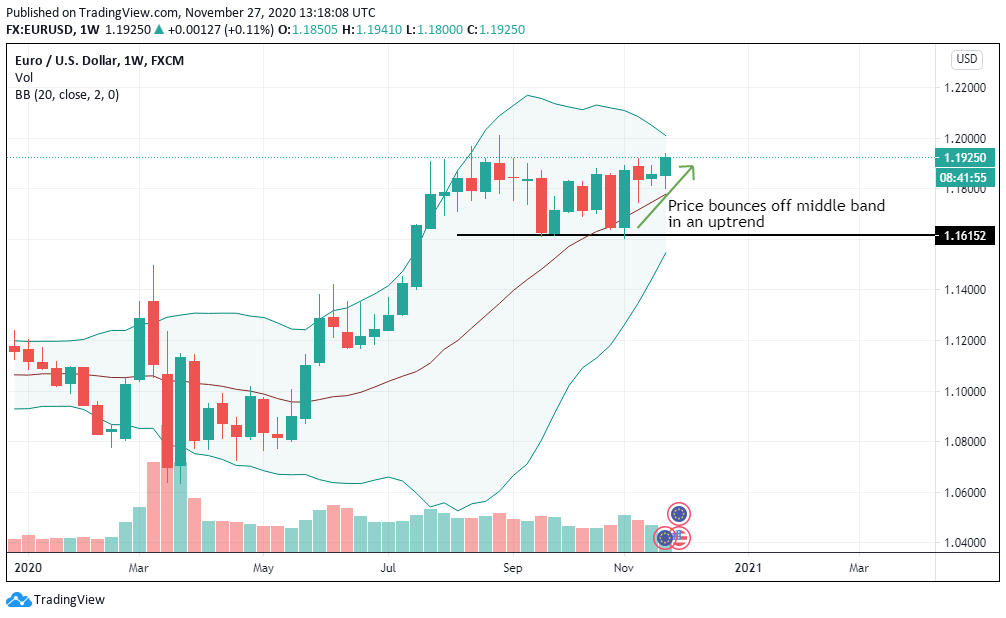
The EU recorded a trade surplus of €24489.40 million in September 2020, while the US had a $63.9 billion trade deficit in the same period. The trade balance has a high correlation with the exchange rate of the EUR/USD pair. Therefore, we assign it an inflationary score of 7, meaning we expect a widening trade balance between the EU and the US to result in bullish EUR/USD.

EU and US Interest Rate Differential

This indicator measures the difference between the interest rates in the EU and that in the US. The economy with a higher interest rate will attract more investments from foreigners seeking higher returns.

In the US, the Federal Reserve has kept the interest rate within a range of 0% – 0.25%. In the EU, the ECB interest rate is 0%. Since the interest rate differential between the two economies is low, we do not expect it to impact the EUR/USD exchange rate. Therefore, we assign a deflationary score of -1. That means we expect it to result in a mild bearish trend for the EUR/USD pair.

Conclusion

The exogenous analysis of the EUR/USD fundamentals gives an inflationary score of 4. This implies that in 2020, the EUR/USD pair has had a bullish trend. In the short term, this bullish trend is expected to persist.

Note that the EUR/USD pair has formed a support level along with the middle Bollinger band. Therefore we can say that our Fundamental analysis is being supported by our Technical Analysis as well. Cheers!

Categories
Forex Fundamental Analysis

EUR/USD Global Macro Analysis – Part 1 & 2

Introduction

In this analysis, we’ll focus on endogenous economic growth factors in the EUR and the US. We’ll also analyze the exogenous factors that will help us compare the economic performance in both regions.

Endogenous economic factors are inherent within the domestic economy and are primarily driven by domestic demand. On the other hand, exogenous factors are external economic factors that result from a country’s participation in the international markets. Both of these factors influence the fluctuation of the currencies from both countries.

Ranking Scale

We will rank both the endogenous and the exogenous economic factors on a scale of -10 to +10. A negative ranking shows that the economic factor had a deflationary impact on the currency. Conversely, a positive ranking implies that it had an inflationary impact.

USD Endogenous Analysis – Summary

The USD endogenous factors recorded a score of -19.1, implying a deflationary effect on the USD. This essentially means that according to these indicators, the USD has lost its value since the beginning of this year.

You can find the complete USD Endogenous Analysis here.

EUR Endogenous Analysis – Summary

The endogenous analysis of the EU economy shows a modest deflationary score of -8.5. This means that in 2020, the Euro has shed some of its inherent value.

The endogenous economic indicators in the Eurozone are an aggregate of the 27 member countries in the EU.

  • Monthly retail sales

It measures the inflation-adjusted value of retail sales. About 40.1% of all retail sales in the EU are from food, drinks, and tobacco. Electronics and furniture account for 11.5%, while computer equipment accounts for11.4%. 9.2% of the retail sales are attributed to clothing and footwear,  while pharmaceutical and medical products account for 8.9%.

In September 2020, retail sales in the EU dropped by 2%. Given that retail sales account for about 70% of the GDP, our correlation analysis, we assign the EU retail sales an inflationary score of 2.5.

  • Industrial production

This indicator measures the total output by manufacturers, mines, and utility industries in the EU. The value is adjusted for inflation. Note that the industrial sector in the EU is among the top employers.

In September 2020, industrial production dropped by 0.4%, which is an improvement from the drop of 17.1% recorded in April. However, the change in industrial production has been steadily falling from a peak of 12.4% in May.

Based on our correlation analysis, we assign the EU change in monthly industrial production a deflationary score of -2.

  • Unemployment rate

This indicator shows the percentage of the total workforce in the EU who are seeking gainful employment. The data shows the monthly change.

In September 2020, the unemployment rate in the EU was 8.3%. Throughout the year, the EU has experienced a steady increase in the unemployment rate. This is due to the economic effects of the coronavirus pandemic. However, our correlation analysis shows the minimal impact of the unemployment rate on the EU GDP. Therefore, we assign it a deflationary score of -2.

  • Employment change

As an economic indicator, employment change shows the quarterly change in the number of EU citizens who are gainfully employed. This indicator can also be used to show the ability of the economy to create more jobs. It measures both full-time and part-time employment.

In the third quarter of 2020, the EU employment change increased by 0.9%, showing that the EU economy is recovering from the slump of Q2 2020. Our analysis shows a higher correlation of the employment change with the changes in GDP. Hence, we assign it an inflationary score of 4.

  • Business confidence

The business sentiment is also referred to as the Industry Sentiment. It measures the economic sentiment among manufacturers, consumers, and employers in the EU by rating the current and future economic conditions.

The lowest business confidence recorded in 2020 was -32.3 in April 2020. Since then, the indicator has been steadily improving to -9.5 in October. Based on the correlation analysis with the EU GDP, we assign business confidence a deflationary score of -3.

  • Consumer Spending

Consumer spending measures the quarterly amount that households spend on goods and services for personal consumption. As an economic indicator, it can be used to show households’ welfare and the prevailing economic conditions. Since consumer expenditure accounts for about 70% of the EU GDP, any changes in the quarterly expenditure are bound to impact the GDP levels directly.

In Q2 of 2020, consumer spending dropped to € 1511.14 billion from € 1716.59 billion in Q1 of 2020. It is the largest drop ever recorded in history and can be attributed to the pandemic-induced economic recession.

Due to its high correlation to the change in GDP, we assign consumer spending a deflationary score of -5.

  • European Union Government Debt To GDP

This ratio compares what the EU economy produces and what it owes. It shows the efficiency of the economic process and the capability of the government to service its debts without overstretching the available resources. Investors can use this ratio to gauge whether the debt in an economy is becoming unsustainable.

Increasing levels of government debt and a stagnating GDP results in a deflationary effect for the domestic currency.

By the end of 2020, the EU government debt to GDP is expected to reach 95% from 79.3% recorded in 2019. The higher government debt to GDP in 2020 is a direct result of the aggressive measures out in place to curb deep recessions from the coronavirus pandemic.

Based on our correlation analysis, we assign a deflationary score of -6 to the EU government debt to GDP.

  • EU Rate of inflation

In the EU, the inflation rate is best measured using the consumer price index (CPI). It measures the overall monthly change in the prices of consumer goods and services. The rate of inflation can be used as gauge the purchasing trends among households.

In theory, a rise in inflation implies that consumers’ demand for goods and services is increasing. Conversely, a drop in inflation implies that demand is shrinking hence corresponding to lower GDP levels.

In September 2020, the rate of inflation in the EU decreased by 0.2%. It is, however, an improvement from the -0.4% recorded in July and August. Based on its correlation with GDP, we assign the EU rate of inflation a score of 3.

In the next article, we have posted the Exogenous Analysis of the EUR/USD pair to have a clear idea of whether this pair is bullish or bearish market conditions.

Categories
Forex Signals

Daily F.X. Analysis, December 08 – Top Trade Setups In Forex – Eyes on European Events! 

On the news front, the market is likely to remain muted in the absence of high impact events. Italian banks will be closed in observance of Immaculate Conception Day while the Frend Trade Balance, European Revised GDP q/q, and German ZEW Economic Sentiment will remain in the highlights today.

Economic Events to Watch Today  


EUR/USD – Daily Analysis

The EUR/USD pair was closed at 1.21088 after placing a high of 1.21660 and a low of 1.20784. EUR/USD pair extended its losses on Monday for the second consecutive day over the diminishing risk sentiment and the hopes for further easing package from ECB. The EUR/USD pair remained under pressure on Monday ahead of the upcoming ECB meeting on Thursday. The European Central Bank was set to deliver a further easing package of almost 500 billion euros to the Pandemic Emergency Purchase Programme that will extend the purchases for many more months and weighed on the single currency Euro. 

Furthermore, the European Central Bank is also expected to increase its targeted longer-term refinancing operations and also to make them more accommodative. The ECB’s governing council members said that these decisions have been taken to extend the duration of accommodative financial conditions to support the recovery in 2021 further and beyond, rather than making financial conditions right now more accommodative.

The pressure on ECB to over-deliver on the market expectations declined due to the recent improvement in global financial market conditions since Joe Biden won the U.S. presidential election and positive vaccine news in early November. The more important event of the day for EUR was the Summit of 27 E.U. countries that will begin on Thursday and Friday.

The top agenda will be Brexit in the Summit as the question remained that UK PM Boris Johnson and E.U. Commission President Ursula von der Leyen will be successful in reaching a deal before the Summit. The paused Brexit talks by top E.U. negotiator Michel Barnier on Friday also added pressure on EUR/USD pair on Monday. Another factor pressuring the European Union was the Polish and Hungarian veto against the E.U. Recovery Fund and the 2021-2027 Budget. Both nations announced their intentions shortly before ambassadors of the E.U. member states met on Monday to veto various parts of the financial settlement. If a deal cannot be agreed with these two nations regarding the rule of law attachments being added to funding, then the E.U. has threatened to go with EU-minus Poland and Hungary fiscal package. 

On the data front, at 12:00 GMT, the German Industrial Production also raised to 3.2% against the estimated 1.8% and supported Euro and capped further losses in EUR/USD pair. At 14:30 GMT, the Sentix Investor Confidence came in as -2.7 against the estimated -11.9 and supported Euro and limited additional losses in EUR/USD pair.

Daily Technical Levels

Support   Resistance

1.2113      1.2129

1.2107      1.2139

1.2097     1.2146

Pivot point: 1.2123

EUR/USD– Trading Tip

The market’s technical side continues to be the same as the pair continues to trade sideways due to a lack of high impact economic events. On the higher side, the EUR/USD may find an immediate resistance at 1.2160 and 1.2196 level. Simultaneously, the closing of candles below the 1.2103 level can send the EUR/USD pair further lower until 1.2080 and 1.2040 level. The MACD is strongly bearish; therefore, the idea will be to open a sell trade below the 1.2175 level today to capture quick green pips. 


GBP/USD – Daily Analysis

The GBP/USD pair was closed at 1.33785 after placing a high of 1.34375 and a low of 1.32239. The GBP/USD pair dropped to its lowest since November 19 on Monday in the early trading session due to the rising U.S. dollar, but it started to recover in the late trading session after the Brexit hopes raised. The U.S. dollar raised on Monday after the coronavirus cases continued to rise, and lockdowns expanded and weighed on the U.S. economic recovery. On Sunday, the Governor of California, Gavin Newsom, ordered large parts of the most populous U.S. state to close down as coronavirus cases spiked to record levels. 

On Sunday, California reported more than 30,000 new cases and marked a new record for hospitalized coronavirus patients. Other states including, New Jersey, North Carolina, Virginia, and West Virginia, also announced a record one-day rise in new infections. These increased cases raised concerns over the economic recovery hopes and raised the demand for safe-haven greenback that ultimately weighed on GBP/USD pair. However, the currency pair GBP/USD recovered some of its losses on Monday after the UK PM Boris Johnson revealed that he was set to travel to Brussels in a last-ditch effort to break a post-Brexit deal. The E.U. Commission President Ursula von der Leyen and the UK PM Boris Johnson will remove the differences on a post-Brexit deal in the coming days. This came in after a 90 minutes phone call between the two leaders failed to produce a breakthrough. 

In a joint statement, both said that the conditions for a deal were not there, and significant differences remained on fishing, level playing field, and any deal governance. They have asked their chief negotiators to prepare an overview of the remaining sticking points discussed in a physical meeting in Brussels in the coming days. A senior U.K. governmental source warned that a deal might not be possible after the phone call between Ursula and Johnson. It was also reported that the talks were in the same position as they were on Friday and made no progress. All these downbeat statements related to Brexit weighed heavily on GBP/USD pair.

On the data front, at 13:30 GMT, the Halifax Housing Price Index for November raised to 1.2% against the forecasted 0.6% and supported British Pound, and capped further losses in GBP/USD pair.

Daily Technical Levels

Support  Resistance

1.3377      1.3438

1.3338      1.3462

1.3315      1.350 0

Pivot point: 1.3400

GBP/USD– Trading Tip

The GBP/USD pair bounced off over 1.3263 level, trading at 1.3340 level now. On the 4 hour timeframe, the GBP/USD is consolidating in between a wide trading range of 1.3406 – 1.3263 level. The Cable may find the next support at 1.3204 level, and below this, the next support can also be found around 1.3100 level today. On the higher side, the resistance hold around the 1.3406 mark. The MACD and RSI are suggesting selling bais in the pair, and we should look for selling trades below 1.3400 and buying over 1.3265 level today. 


USD/JPY – Daily Analysis

The USD/JPY pair was closed at 104.046 after placing a high of 104.310 and a low of 103.920. On Monday, the USD/JPY pair consolidated within a tight range around 104.00 level after placing a high of 104.310 on the U.S. dollar’s strength in the early European morning. However, the pair USD/JPY reversed its direction and started posting losses in late trading hours. The U.S. dollar was strong in early European trade on Monday as the coronavirus cases continued to rise and lockdowns expanded and weighed on the U.S. economic recovery. The U.S. Dollar Index that tracks the greenback against the six other currencies basket was up by 0.3% at 90.993.

The record hike in the coronavirus spread caused the Governor of California, Gavin Newsom, to order large parts of the most populous U.S. state to close down again. California state reported 30,000 new cases in a single day and broke its daily high record. Other states like New Jersey, North Carolina, Virginia, and West Virginia also reported a record-high number of coronavirus cases.

The rising number of coronavirus infections and the U.S. hospitalization rate added pressure on the U.S. economic recovery and raised the appeal for safe-haven that ultimately added strength to the greenback. The strong U.S. dollar helped the USD/JPY pair rise to the 104.300 level in the early trading session.

However, the USD/JPY pair’s gains were short-lived as the pair started to decline in the late trading session and posted losses for the day. The decline in the USD/JPY pair was due to appreciation in the Japanese Yen after the lower U.S. yields on the day.

The 10-year Treasury yield fell by 4bps to 0.929%, and the 10-year real rates also dropped to -0.97% by 3bps. The declining U.S. yields thus decreased the attractiveness of USD investments relative to Japanese government bonds and underpinned selling pressure in the USD/JPY pair.

On the data front, at 09:59 GMT, the Leading Indicators from Japan came in line with the expectations of 93.8%. Meanwhile, the latest optimism regarding the vaccine and fiscal stimulus also kept the USD/JPY pair supported and limited the day’s losses.

Another reason behind the increasing demand for safe-haven Japanese Yen was the recent financial sanctions imposed by the U.S. and a travel ban on 14 Chinese officials over their suspected role in disqualifying elected opposition legislators in Hong Kong.

Hong Kong’s Beijing-backed government expelled four opposition members last month. In this response, the U.S. levied sanctions on Chinese officials and also blocked any assets the official might have within the U.S. These sanctions added in the safe-haven demand in the market and added strength in the Japanese Yen against the U.S. dollar, and weighed on the USD/JPY pair on Monday.

Daily Technical Levels

Support   Resistance

104.10      104.27

104.00      104.34

103.94      104.44

Pivot point: 104.17

USD/JPY – Trading Tips

The USD/JPY is trading within a symmetric triangle pattern seen in the 4-hour timeframe. The pair lately violated the sideways trading range of 104.600 – 104.200, and now it’s trading at 104.300 level, especially after bouncing off over 103.700 level on the lower side, supporting the pair around 103.700 level. On the downside, the USD/JPY may find support at the 103.200 level upon a bearish breakout of the 103.750 support level. While resistance stays at 104.350 and 104.700 today. Good luck

Categories
Forex Elliott Wave Forex Technical Analysis

US Dollar Index Under Bearish Pressure. What’s next?

The US Dollar Index (DXY) consolidates on Monday’s session in the extreme bearish sentiment zone bouncing a modest 0.06% from the last Friday 04th, from 90.476 to 90.757. However, the technical perspective is mostly bearish for the DXY basket of currencies.

Technical Overview

The following 8-hour chart shows the mid-term market participants’ sentiment unfolded in its 90-day high and low range. The figure reveals the bearish pressure that carries the Greenback in the extreme bearish zone between 90.476 and 91.543. Likewise, the intraday sideways candlestick formation suggests the likelihood of a pause and the downward continuation for the following trading sessions.

Regarding the US Dollar’s trend, the primary trend plotted in the blue line reveals the bearish bias. The secondary trend identified in green suggested the downward acceleration since November 04th when the price failed its bullish advance at 94.316. Likewise, the broader distance between the primary trend-line and the price leads to a limited correction before continuing the bearish path.

Short-term Technical Outlook

The short-term Elliott Wave perspective for the US Dollar Index exposed in the next 2-hour chart suggests the incomplete downward advance of a five-wave sequence, which could be starting to consolidate in its fourth wave of Minuette degree identified in blue.

The current bearish sequence began on November 04th when the price found fresh sellers at 90.302 and began a decline that is still present to date. The previous chart suggests the completion of the third wave of Minuette degree. This Elliott wave context is supported by the broadest distance observed in the MACD oscillator.

On the other hand, considering that the second corrective wave seems simple in terms of price and time, the alternation principle suggests that the fourth wave in progress should be complex in terms of price, time, or both. In this context, the next corrective pattern could be a triangle pattern or a combination such as a double-three or a triple-three formation.

The implication of the fourth wave’s extension could be indicative of the exhaustion of the bearish trend, and the price action should reverse soon.

Finally, if the price action rises and closes above the supply zone between 91.412 and 91.580, the US Dollar Index could reveal a possible reversion of the current bearish trend.

Categories
Forex Psychology

BEWARE: These Excuses Could Be Holding You Back from Dominating in Forex

If you search “forex trading” on any search engine, you’re going to find a lot of frequently asked questions from users that doubt trading is profitable. For example:

  • “Is forex a scam?”
  • “Can you really make money trading forex?”
  • “Is the forex market illegal?”
  • “Is it really worth becoming a trader?”

As you can see, a lot of people online seem to feel apprehensive about opening a trading account thanks to online myths and speculation or stories about traders that have lost money. Sure, it is possible to lose money and there are scammers out there, but you shouldn’t let these common excuses keep you from trading:

Excuse #1: I Don’t Have Money to Invest

Many people want to start trading forex, but they imagine that the luxury is reserved for those that have a great deal of money to invest. In reality, you can get started trading on a demo account for free. It’s also possible to open a trading account with only a few dollars through a wide variety of brokerages, so you shouldn’t let a lack of money keep you away. Of course, you should expect to be limited to a micro, cent, mini, or standard account if you only have a small investment, but these accounts are actually beneficial for beginners. These accounts might not offer as many perks as elusive VIP accounts but they will allow you to trade, hone your skills, and make profits, nonetheless. Just remember not to invest more money than you can afford to lose – if it’s meant to pay bills or live on, don’t deposit it into your trading account. 

Excuse #2: I Don’t Have the Time

It’s true that some traders sit in front of their computer screen constantly entering and monitoring positions, but you don’t have to do this. In fact, there are many different strategies that benefit part-time traders that have other things going on in their lives. Swing trading is one example where you enter trades and let them go for days or even weeks in some cases. The flexibility of being able to trade from any device with an internet connection even makes it possible to monitor your account while you’re on your lunch break or from your child’s soccer game. It might seem like another annoying thing to keep up with, but it’s worth it when you think of how much money you could make if you carve out a little bit of time each week for trading. 

Excuse #3: It’s too Risky

Forex trading is an investment, meaning that there is risk involved, not unlike other investment opportunities. You really do have to give money to make money, but you shouldn’t think of trading as gambling. Before you ever start, you should have a good concept of what moves the market and how trading works. Then, you’ll develop a trading plan that tells you what to look for when it comes to entering and exiting positions, along with plans for managing your risks, and so on. All of this is designed to keep you safe if things go against you, although they don’t eliminate the risk of losing money entirely. Still, with a solid trading plan and background knowledge of what you’re doing, your risk will be significantly reduced. 

Excuse #4: It’s too Complicated

This excuse seems to come from people that just don’t want to invest the time into learning to trade. Sure, there are a lot of things you’ll need to know about, like terminology, how to work a trading platform, factors that affect prices, trading psychology, and so on. However, it’s wrong to say that these topics are complicated to learn. All of this information can be accessed online for free and you can even try learning through different resources if you have trouble understanding a certain topic. For example, some might learn better by reading articles, while others might prefer to watch videos. Some authors can also do a much better job of explaining concepts than others, so there’s no reason to give up.

Excuse #5: It’s a Scam

This myth likely comes from the idea that most brokers are scammers just waiting to steal your hard-earned money. As we mentioned earlier, there are some scammers out there, but there are a lot more reputable brokers than there are scammers. If you want to ensure that you’re opening an account with a trustworthy company, try following these steps:

  • Check to see if the company is regulated. (Double-check that the listed regulation company exists and check for a license number, as some scammers will post pretend regulation details. Also, if you’re located in the US, you might have to go with a company that isn’t regulated.)
  • Look at the broker’s website. Does it tell you in detail about the accounts they offer, available funding methods, applicable fees for funding, spreads, and commissions, etc.? Or are you left with more questions than answers? A detailed website is a sign of a good broker, while a lack of information suggests otherwise.
  • Read through the broker’s terms & conditions to ensure that there aren’t any crazy policies or hidden fees, like inactivity charges.
  • Look for customer reviews online. More popular brokerages will have a lot of feedback, while scammers may not have any at all or everything will be negative. Remember that some traders that have lost money at their own fault might leave bad reviews regardless.
Categories
Forex Signals

USD/CAD Completes 23.6% Fibonacci – What’s Next? 

The USD/CAD closed at 1.27841 after placing a high of 1.28735 and a low of 1.27720. The USD/CAD pair extended its losses towards its lowest level since May 2018 amid the strength of the Canadian dollar against the US dollar and the rising crude oil prices. On Friday, the Canadian dollar outlook improved on the expectations that the currency will benefit from the domestic economic stimulus and the rollout of the coronavirus vaccine. On Monday, the Canadian Finance Minister Chrystia Freeland forecasted the budget deficit to hit a historic C$382 billion on coronavirus emergency aid. She also added that C$100 billion would be rolled out in stimulus once the virus came under control.

These statements from the Canadian Finance Minister added strength to the Canadian dollar as the hopes for Canadian economic recovery increased. The strong Canadian dollar added heavy pressure on the USD/CAD pair on Friday and dragged the pair on the downside.

Meanwhile, the Canadian dollar was also strong because of the positive macroeconomic data on Friday. At 18:30 GMT, the Employment Change from Canada raised to 62.1K against the forecasted 22.0K and supported the Canadian dollar and added losses in USD/CAD pair. 

The Unemployment Rate from Canada dropped to 8.5% against the forecasted 9.0% and supported the Canadian dollar and supported the USD/CAD pair’s downward trend. The Trade Balance from Canada came in as -3.8B against the forecasted -3.2B and weighed on the Canadian dollar.

From the US side, at 18:30 GMT, the Average Hourly Earnings raised to 0.3% against the estimated 0.1% and supported the US dollar, and capped further losses in the USD/CAD pair. The Non-Farm Employment Change declined to 245K against the estimated 480K and weighed on the US dollar and supported the USD/CAD pair’s losses. The Unemployment Rate dropped to 6.7% against the estimated 6.8% and supported the US dollar. The Trade Balance from the US came in as -63.1B against the estimated -64.7B and supported the US dollar. 

At 20:00 GMT, the Factory Orders for November raised to 1.0% against the estimated 0.8%, supported the US Dollar, and capped further USD/CAD pair losses. Most of the US dollar economic data came in favor of the US dollar, but the NFP employment change or the job creation by the US economy fell short of expectations and weighed on the US dollar that added losses in the USD/CAD pair.

Another important factor involved in the USD/CAD pair’s losses on Friday was the rising crude oil prices. The price of crude oil, one of Canada’s major export, rose on Friday above $46 per barrel after the coronavirus vaccine’s speedy approval that would boost the global economic recovery and ultimately increase the energy demand. The higher crude oil prices supported the commodity-linked currency Loonie and added pressure on the currency pair USD/CAD on Friday.


Daily Technical Levels

Support Resistance

1.2825 1.2918

1.2791 1.2977

1.2733 1.3011

Pivot point: 1.2884

The USD/CAD slipped to trade at a 1.2811 level, holding above an immediate support level of 1.2775. Above this level, the commodity currency pair has formed a Doji candle, suggesting odds of selling bias until the 1.2770 level. Taking a look at the 4-hour timeframe, the USD/CAD pair has closed a bullish engulfing pattern at the 1.2811 level, and it may head upward until the 38.2% Fibonacci retracement level of 1.2837 level. Bullish trend continuation can lead to its prices further higher until the next resistance level of the 1.2904 level marks a 61.8% Fibonacci level. Good luck! 

Categories
Crypto Daily Topic Forex Daily Topic

How to Trade Forex Anonymously with Bitcoin

Anonymous trading used to be a reserve for high-profile investors. But with the increasing acceptance of crypto in forex trading, anyone can trade anonymously now. There are both advantages and limitations to trading anonymously. If you choose to trade forex anonymously, you could use Bitcoin or any altcoin accepted by your broker. 

In this article, we’ll look at what it means to trade anonymously, why you would do it, and, most importantly, how to use Bitcoin in this endeavor.

KYC-Based vs. Anonymous Forex Trading

Unlike crypto trading, forex investment is a highly-regulated industry. For this reason, regulators require forex brokers to conduct extensive know-your-customer (KYC) processes before allowing traders in. Traditionally, exchanges have had no provision for anonymity. However, over time, many have switched to anonymous/hybrid trading practices. 

So, what is anonymous trading? Anonymous trading happens when investors choose to conceal their identity, although their trading activity remains visible in the order book. Usually, an investor will choose between trading on an anonymous (national) exchange or opt for the more private dark pools. 

Anonymous brokerage firms are still regulated and thus do not provide complete anonymity – regulators can still access personal information about a particular trader and their activity. On the other hand, dark pools are private trading platforms that are generally out of the investing public’s reach. They can be registered and operate legally, like conventional brokerages. 

Whether you’re trading in an open brokerage or a dark pool, crypto is particularly useful in keeping transactions identityless. 

With that, let’s find out why you would consider trading anonymously. 

Why Trade Forex Anonymously?

Motivations for trading anonymously may differ slightly between investors. However, the following are common reasons. 

  • Protecting identity – For personal reasons, you might opt to remain an unknown investor on the market. Sometimes one just desires privacy – be it to circumvent some restrictions, keep away stalkers, etc.
  • Protecting your strategy – If you’re a particularly savvy trader, your tricks will always be at risk of being copied. But if you trade with your identity concealed, you’re making it difficult for them to join the dots that make up your strategy. 
  • To conceal your intention – Crypto markets are sentimental, and if traders see you buying or selling in large volumes, prices can move, sometimes to your disadvantage. In such a case, buying or selling anonymously allows speculation to shape the course of price movements.

Using Bitcoin to Trade Forex Anonymously 

It’s very possible to trade forex using crypto. And while you can use any crypto to trade forex (as long as your broker allows it), Bitcoin has some advantages. Obviously, the main one is its wide acceptability. BTC’s volatility also makes it a suitable currency for investment. That said, this is how you can use Bitcoin to trade forex. 

#1. Get Bitcoin – Naturally, the first step is to acquire Bitcoin. For this, you will need to visit an exchange (not a forex exchange, though). Familiarize yourself with the likes of Coinbase, Binance, and Changelly. 

#2. Find a good broker – Not all forex brokers accept Bitcoin. Those that do may be referred to as Bitcoin deposit forex brokers. 

#3: Deposit Bitcoin with the broker and provide them with the finer details of the trade they should execute.

Of course, this is a high-level overview of the process. There are intricacies involved, such as how to evaluate brokers and the risks and the benefits of using Bitcoin to trade crypto that you need to be aware of. Let’s take a look at these below: 

Top 10 Bitcoin Deposit Forex Brokers

The list of Bitcoin deposit forex brokers is growing by the day. Some of the truly tried-and-tested include the following. Links go to a full review of the broker, where available.

#1. IC Markets – This broker is regulated by the Australian Securities and Investments Commission. They accept deposits from $200 in any of the supported currencies, including BTC. With IC Markets, you can get a leverage of up to 500:1. IC Markets allows its customers to trade Forex, Metals, indices, bonds, stocks, and digital currencies.

#2. EagleFX – EagleFX is a beginner-friendly broker with whom you can trade from as low as $10. The platform offers fast account setup and supports over 55 currencies and 32 digital assets. Withdrawals are also pretty fast. With leverage of 1:500, experienced traders can equally benefit from the platform. One of the things making EagleFX stand out is that it appeals to all levels of traders – from beginners to seasoned investors.

#3. CedarFX – CedarFX is a rather interesting option, as it offers zero commission trading with very tight spreads. This broker offers traders six asset classes: digital assets, stocks, indices, metals, futures, and commodities. When trading with CedarFX, the best part is that investors get to choose from a wide array of options. CedarFX’s leverage goes up to 1:500 and also accepts a minimum $10 deposit.

#4. FX Choice – Just like IC Markets, FX Choice is an electronic communication network (ECN). They accept deposits from $100 in a range of crypto and fiat currencies. The broker offers maximum leverage of 200:1 and a variety of Forex pairs, metals, indices, and digital assets.

#5. Longhorn FX – This broker seeks to attract beginner investors with low minimum deposits starting from $10. You can get leverage up to 1:500 to trade with over 55 currency pairs. Withdrawals are fast and easy, which increases its appeal. 

#6. Cryptorocket – This broker allows investors to trade various instruments that include crypto, commodities, stocks, and forex. Leverage of up to 1:500 is possible, and it can be applied to trade some 35 crypto pairs, 55 fiat currency pairs, among other asset classes. The broker features institutional-grade liquidity that guarantees investors competitive pricing. Also, Cryptorocket uses straight-through processing – so you can be sure there will be no price manipulation.

#7. Think Markets – Think Markets is a market maker non-dealing desk kind of broker. You can start with any amount for your deposit, which is encouraging for new users. It is regulated by the Australian Securities and Investments Commission (AU), the Financial Conduct Authority (UK), and the Financial Sector Conduct Authority (ZA). 

#8. FXTM – FXTM is an ECN market maker regulated by the Financial Services Commission of Mauritius. You can start trading from a minimum of $5 (or its equivalent in any of the supported currencies). The broker offers maximum leverage of 1:1000.

#9. HotForex – HotForex is also a market maker that accepts deposits from $5. It is regulated by the Dubai Financial Services Authority and accepts several base currencies. The maximum leverage you can get is 1:1000. 

#10 Hugosway – Hugosway is a well-established broker with offices in Kingstown, St. Vincent and the Grenadines. The broker accepts bank transfers as well as crypto funding while offering its customers fast times on deposits and withdrawals. It allows trading in digital assets, forex, indices, and metals.  The minimum deposit is $50 using credit card and bitcoin, and $10 using Vload.

Benefits of Trading Forex with Bitcoin

  • Increased privacy – When you trade forex using Bitcoin, you don’t need to share your personal financial info.
  • Increased leverage – Many brokerage firms offer leverage to Bitcoin traders. If you know how to use leverage, this can be hugely beneficial.
  • Potentially lower costs – Bitcoin deposit forex brokers are reportedly lowering brokerage fees to attract the new breed of BTC-forex investors.
  • Lower deposits allowed – Again, it appears like Bitcoin deposit forex brokers are using this strategy to attract new investors.
  • Easier cross-border trading – Thanks to Bitcoin being a global currency, you can trade with any broker from anywhere.

Risks of Trading Forex with Crypto

  • Volatility – Since Bitcoin’s prices change continuously, a broker may take advantage of traders by receiving their Bitcoin using the day’s lowest rate and exchanging it at the day’s highest rates. 
  • The leverage temptation – The special leverage used to entice BTC-forex brokers is a great risk to novice investors.
  • Mixing of asset classes – Bitcoin and forex are different asset classes. This use of an ‘intermediary’ currency increases trading complexity and risks.
  • Bitcoin’s inherent risks – Bitcoin, like all cryptos, can be easily stolen if not properly secured. A broker that is licensed and reputable ensures the safety of your funds.

Final Thoughts

Using Bitcoin to trade anonymously offers several benefits. You can take advantage of the higher leverage, lower deposits, lower costs, easier cross-border trading, and so on. There is also an ever-increasing number of Bitcoin deposit forex brokers you can experiment with. However, ensure to employ plenty of caution and thoroughly research brokers so you don’t lose money, and start slow, testing it with minimum deposits and thin trades. Overall, anonymous forex trading with Bitcoin is an exciting endeavor that you can explore – whether you’re a veteran or new to the game. 

Categories
Forex Market Analysis

Daily F.X. Analysis, December 07 – Top Trade Setups In Forex – Eyes on European Events! 

The calendar is a bit muted today, and the market can exabit thin trading volume on the news front. However, the focus can stay on German Industrial Production m/m and Sentix Investor Confidence from the Eurozone, which are expected to perform better than the previous month and may underpin the Euro currency. Besides, the U.K. Halifax HPI m/m will also play a slight role in determining the GBP trend, while economists expect HPI to improve from 0.3% to 0.6% this month.

Economic Events to Watch Today  


EUR/USD – Daily Analysis

The EUR/USD pair was closed at 1.21185 after placing a high of 1.21772 and a low of 1.21101. After rising for three consecutive days, the EUR/USD pair dropped on Friday after the initial rally. The downfall in EUR/USD pair on the day came in after U.S. job figures’ release.

In the trading session on Friday, the EUR/USD pair rallied slightly on the back of improved risk sentiment and the U.S. dollar’s weakness. The risk perceived EUR/USD followed the optimism regarding the coronavirus vaccine and moved higher in the early trading session on Friday. Besides, the U.S. dollar’s weakness due to the increased spread of coronavirus and hospitalization rate in the U.S. also added strength to the rising EUR/USD pair.

The U.S. dollar was also weak due to increased hopes for the next round of U.S. stimulus package after the CARES Act passed in March. Democrats and Republicans have agreed over a $908 billion stimulus package, and the expectations have increased that a big stimulus will also be delivered soon. The weak U.S. dollar gave a Pushto EUR/USD pair on Friday and raised its prices above the 1.21700 level.

However, the EUR/USD pair’s gains started to reverse and converted into losses after the release of macroeconomic data from the U.S.

At 12:00 GMT, the German Factory Orders for November raised to 2.9% against the expected 1.4% and supported Euro. At 12:45 GMT, the French Gov Budget Balance came in as -159.9B. At 14:00 GMT, the Italian Retail Sales raised to 0.6% against the forecasted 0.2% and supported Euro.

At 18:30 GMT, the Average Hourly Earnings rose to 0.3% against the anticipated 0.1% and supported the U.S. dollar and added pressure on EUR/USD. The Non-Farm Employment Change declined to 245K against the anticipated 480K and weighed on the U.S. dollar. 

The Unemployment Rate declined to 6.7% against the anticipated 6.8% and supported the U.S. dollar and dragged the EUR/USD pair. The Trade Balance from the U.S. came in as -63.1B against the anticipated -64.7B and supported the U.S. dollar and weighed on EUR/USD pair. At 20:00 GMT, the Factory Orders for November raised to 1.0% against the anticipated 0.8% and supported U.S. Dollar. Most of the U.S. data came in support of the U.S. dollar that resulted in the EUR/USD pair’s downfall on Friday in the late trading session.

Daily Technical Levels

Support  Resistance

1.2101        1.2178

1.2063       1.2215

1.2025       1.2254

Pivot point: 1.2139

EUR/USD– Trading Tip

On Monday, the EUR/USD continues to trade sideways amid mixed NFP figures released on Friday. On the higher side, the EUR/USD may find an immediate resistance at 1.2160 and 1.2196 level. While the closing of candles below the 1.2103 level can send the EUR/USD pair further lower until 1.2080 and 1.2040 level. The MACD is strongly bearish; therefore, the idea will be to open a sell trade below the 1.2175 level today to capture quick green pips. 


GBP/USD – Daily Analysis

The GBP/USD pair was closed at 1.3413 after a high of 1.35390 and a low of 1.34096. The GBP/USD pair rose to its highest level since May 2018 in the early trading session on Friday over the combined factor of Brexit optimism and the weakness of the U.S. dollar. However, the British Pound cut its gains after the E.U.’s Brexit negotiator Michel Barnier paused the talks.

During the early trading session on Friday, the GBP/USD pair rose and started to post gains following the Brexit optimism triggered after the agreement was reached over the Fisheries between the U.K. and the E.U. Another factor involved in the GBP/USD pair’s upward momentum was the U.S. dollar’s weakness.

The U.S. dollar index (DXY) that measures the value of the U.S. dollar against the basket of six currencies fell to its six years, the lowest level of 90.47 on Friday. The losses in DXY were due to a combination of factors, including the rising number of coronavirus in the nation and the rising expectations of the U.S. stimulus package.

The number of new coronavirus cases in the past five days in the U.S. reached about 1 million. The hospitalization rate also increased to an alarming level and hit a record high after 101,487 patients were reported to be hospitalized in a single day. This negative news from the U.S. added further pressure on the U.S. dollar and supported the upward trend in the GBP/USD pair in the early trading session on Friday.

British Pound was under demand on Thursday after the U.K. and E.U. reported that they had reached an agreement over one key sticking issue of Fisheries. Investors started to buy GBP/USD in the early trading session on Friday as they continued following the previous trend.

However, the currency pair GBP/USD pair started to decline on Friday after the release of U.S. macroeconomic data and the announcement from Michel Barnier. The E.U. Brexit negotiator, Michel Barnier, said that he had paused the trade talks with the U.K. and added that the conditions for a deal had not yet been met.

After one week of intensive negotiations in London, the U.K. and E.U. agreed to pause talks because the post-Brexit deal conditions were not met. Barnier said that E.U. Commission president Ursula von der Leyen and PM Boris Johson would try to make progress on a deal in the next meeting that will take place on Saturday.

After these comments by the E.U. top negotiator, the earlier optimism that the deal was imminent could be reached before the end of the week. These updates suggested that talks have reached a very critical stage, and anything could happen. It raised the market’s uncertainty and supported the safe-haven greenback that exerted pressure on GBP/USD pair.

On the data front, at 14:30 GMT, the Construction PMI from Great Britain raised to 54.7 against the projected 52.3 and supported British Pound and limited the losses in GBP/USD pair.

From the U.S. side, at 18:30 GMT, the Average Hourly Earnings surged to 0.3% against the projected 0.1% and supported the U.S. dollar and added losses in GBP/USD pair. The Non-Farm Employment Change fell to 245K against the projected 480K and weighed on the U.S. dollar. The Unemployment Rate fell to 6.7% against the projected 6.8%, supported the U.S. dollar, and dragged GBP/USD pair. The Trade Balance from the U.S. came in as -63.1B against the projected -64.7B and supported the U.S. dollar. At 20:00 GMT, the Factory Orders for November surged to 1.0% against the projected 0.8% and supported U.S. Dollar and added losses in the GBP/USD pair on Friday.

Daily Technical Levels

Support   Resistance

1.3286       1.3441

1.3209       1.3519

1.3131       1.3596

Pivot Point: 1.3364

GBP/USD– Trading Tip

The GBP/USD is falling dramatically from 1.3450 to 1.3230 level by the time of covering this report. On the 4 hour timeframe, the GBP/USD pair has dipped sharply and has already violated the upward channel, which supported the pair around the 1.3350 level. The Cable may find the next support at 1.3204 level, and below this, the next support can also be found around 1.3100 level today. On the higher side, the resistance hold around the 1.3300 mark. The MACD and RSI are suggesting selling bais in the pair, we should look for selling trades below 1.3350 and buying over 1.3185 level today. 


USD/JPY – Daily Analysis

The USD/JPY pair was closed at 104.186 after placing a high of 104.242 and a low of 103.736. The currency pair USD/JPY rose on Friday amid the supportive U.S. macroeconomic data and the increased U.S. yields.

On Friday, the U.S. Bureau of Labour reported that only 245K jobs were added to the economy while the unemployment rate fell by 0.2% in November and supported the U.S. dollar.

On the data front, at 18:30 GMT, the Average Hourly Earnings advanced to 0.3% against the anticipated 0.1% and supported the U.S. dollar and added gains in the USD/JPY pair. The Non-Farm Employment Change declined to 245K against the anticipated 480K and weighed on the U.S. dollar capped further gains in the USD/JPY pair. The Unemployment Rate declined to 6.7% against the anticipated 6.8% and supported the U.S. dollar.

The Trade Balance from the U.S. came in as -63.1B against the anticipated -64.7B and supported the U.S. dollar and pushed the pair USD/JPY higher. At 20:00 GMT, the Factory Orders for November advanced to 1.0% against the anticipated 0.8% and supported the U.S. Dollar, and added further gains in the USD/JPY pair.

The U.S.’s supportive data proved good news for the market that pushed the S&P 500 to an all-time high and raised the U.S. 10-year yield by 5bps to 0.97%. The rise in U.S. yields also added strength in the U.S. dollar and added gains in the USD/JPY pair. The less than expected job creation by the U.S. Labor Department made the near-term U.S. fiscal stimulus more likely and exerted pressure on Congress to swiftly avert the labor market’s slowdown.

However, the risk sentiment was also strong in the market after the vaccine optimism escalated and supported the hopes that the economic activities will return to pre-pandemic levels. These hopes, along with the rising expectations that the world’s largest economy will also recover soon as the stimulus package was near to be delivered, added to the risk-sentiment. These risk flows added weight on the safe-haven Japanese Yen that supported the USD/JPY pair and pushed it higher.

Meanwhile, the gains in the USD/JPY pair were also limited because of the rising number of coronavirus cases in the U.S. Over the period of 5 days, the U.S. has recorded about 1 million new coronavirus cases, and the hospitalization rate in the U.S. also hit its highest record by reaching more than 104,000 patients in a single day.

The USD/JPY pair rose on Friday due to supportive U.S. macroeconomic data, higher U.S. yields, and the rising risk sentiment in the market due to global economic recovery hopes.

Daily Technical Levels

Support   Resistance

103.48       104.35

103.13       104.89

102.60       105.23

Pivot point: 104.01

USD/JPY – Trading Tips

The USD/JPY is trading within a symmetric triangle pattern seen in the 4-hour timeframe. The pair lately violated the sideways trading range of 104.600 – 104.200, and now it’s trading at 104.300 level, especially after bouncing off over 103.700 level on the lower side, supporting the pair around 103.700 level. On the downside, the USD/JPY may find support at the 103.200 level upon a bearish breakout of the 103.750 support level. While resistance stays at 104.350 and 104.700 today. Good luck

Categories
Forex Course

186. What Are Directional & Non-Directional Bias While Trading The News?

Introduction

By now, you have a clear idea of how to make a news trading plan and schedule. The next thing you need to understand is that there are two primary ways of trading the news in the forex market. These ways involve whether or not you have a directional bias towards the news being released.

Having a Directional Bias

Among the first lessons you learn about the release of economic indicators is how they impact different currency pairs. For example, let’s say that you are interested in the GBP/USD pair, and there is an upcoming news release of the UK GDP.

We would expect that if the GDP shows that the UK economy has expanded, then then the GBP will appreciate relative to the dollar the pair will rise. Conversely, if the GDP shows that the UK economy contracted, you will expect the GBP to depreciate against the USD, and the pair will fall. This is what having a directional bias means.

We’re sure you have noticed the ‘consensus’ aspect from the economic calendar. This number is usually what the majority of financial analysts and economists agree on, as the forecast for a particular economic indicator. It is commonly referred to as “Analysts’ expectations.” In most cases, the market reaction to a news release is determined by whether the news was better than the analysts’ expectations, worse than the expectations, or in line with the expectations.

Let’s say that the analysts’ expectation for the upcoming UK GDP is a growth of 2% and when the actual GDP data released turns out to be 2.3%. If you have a directional bias, you will buy the GBP/USD pair as you expect the GBP to appreciate against the USD.

In another scenario, assume that the news release did not meet the analysts’ expectations and the actual GDP growth is 1.6%. For a forex trader with directional bias, they would sell the GBP/USD pair since they expect the GBP to depreciate relative to the USD. The analysts’ expectation is vital to a trader with a directional bias.

Non-Directional Bias

A news trader with non-directional bias ignores the analysts’ expectations. Such traders are aware that high-impact news will result in a significant movement in price action. For them, it doesn’t matter the direction of the market movement; they only follow the trend. They don’t bother whether the news release beat expectations or not.

We hope you got an understanding of what Directional and Non-Directional bias are while trading the news. Don’t forget to take the below quiz. Cheers!

[wp_quiz id=”94041″]
Categories
Forex Market Analysis

NZDCAD Heavy Drops driven by a Sharp Shift in Market Sentiment

In the last trading week, the NZDCAD cross  90-Day market sentiment declined from the extreme bullish to the bullish sentiment zone. The move was helped by the Canadian unemployment rate figures, which declined to 8.5% in November, beating the analysts’ expectations of 8.9%. 

Source: TradingEconomics.com

The last unemployment rate reading represents an improvement in the Canadian labor market, which showed a slight decline to 8.9% in October. On the other hand, during the current year, the data gathered from Statistics Canada stated that the record unemployment high was Mays figure of 13.7%, its highest level in more than four decades.

Technical Overview

The following 8-hour chart illustrates the market participants’ sentiment unfolded in the 90-day high and low range, revealing an aggressive decline in the Friday 04th trading session where the cross dropped over 1.7%. 

In this context, the downgrade on the market sentiment leads us to expect a corrective movement. This potential drop could find support in the neutral zone of 0.88698. Likewise, the descending of the NZDCAD EMA(60) to Close index below the zero-line drives us to anticipate a consolidation during the coming trading sessions before continuing a further decline.

Technical Outlook

The NZDCAD cross in its 8-hourly chart illustrates the mid-term uptrend that began on March 18th once the price confirmed its bottom of 0.80849. The primary trend plotted in blue reveals that the bull market remains intact.

Likewise, the breakdown observed in the last ascending secondary trend identified in green reveals a short-term correction with three potential key support levels: 0.89469, 0.88583, and 0.87489. Each of these levels shows a zone where the price action developed a polarization movement.

The following 2-hour chart shows an impulsive movement, which began on October 20th when the price found support at 0.86270. After completing its third wave of Minuette degree, in blue, the NZDCAD cross found resistance on December 03rd at 0.91630, where it started a decline in an incomplete corrective sequence that could correspond to wave (iv), in blue.

In this context, the cross could develop two potential scenarios:

  • The first scenario occurs if the price completes the third wave on 0.91630. In this case, the cross could advance mostly sideways in its wave (iv), in blue. In this scenario, the cross could find support in the demand zone between 0.89723 and 0.89490, where the price could begin to advance in its wave (v) of Minuette degree at least to the 0.9163 level.
  • The second scenario: considers an alternative count and occurs if the NZDCAD cross completes a wave (v), in blue, on 0.91630. If that is the case, it implies the price is currently advancing in a corrective formation of Minuette degree. Thus, the price could create a decline in a three-wave sequence toward the next demand zone between 0.88437 until 0.88234. 

In both scenarios, the invalidation level is found below the origin of wave (i) at 0.86270.

Categories
Crypto Videos

How To Spot Bitcoin Bull & Bear Cycles Beginners Edition!


Bitcoin Bull and Bear cycles – Beginners Edition


Animals Bear Fighting With Bull

Since its launch over a decade ago, Bitcoin has seen a number of bull and bear cycles, with each one of them being greater than the last. However, many have tried to find an answer to the main question: What drives these cycles? Co-founder of Decred Jake Yocom-Piatt has claimed that the answer certainly lies within the human brain.

“Bitcoin’s bull and bear cycles are both functions of generic human psychology, attention spans, as well as its deterministic and diminishing issuance,” Yocom-Piatt stated.

Over the years, numerous parties have tried to find the reason behind and argue different cases for Bitcoin’s cycles, including PlanB’s infamous stock-to-flow model, which projects Bitcoin prices in the future based on its programmed halving events that happen every four years.

One major characteristic that sets Bitcoin apart from every other asset is its deflationary nature. It is programmed to have a finite supply, and that, combined with the ease of movement it provides, allows for borderless value storage better than any asset before.

Then, one might wonder whether the programmed supply that Bitcoin possesses dictates its price cycles on some level. This refers to its mining reward being cut in half every four years, essentially decreasing the amount of new Bitcoin put out on the market each time a block is mined. Its 21 million coins supply cap may also factor into this equation.

“Bitcoin’s rate of supply is constantly shrinking as a percentage of the circulation, with the addition of a massive supply shock every halvening,” explained Yocom-Piatt.

“Bull runs occur when the demand begins to outstrip the supply, driving up the price, which then gets the attention of myopic investors. After some time passes, these myopic investors’ attention span for a bull market fades away, and we revert back to a bear market. With each bull cycle, the overall awareness of Bitcoin grows, further sowing the seeds for the next bull cycle.”

Bitcoin recently approached its 2017 all-time high of $20,000, receiving a big chunk of mainstream media coverage during the time of the push towards the upside.

Categories
Forex Videos

How To Trade Forex Like Bankers Do & Spot Their Tactics!


A retail trader’s insight into how bankers trade Forex


In this session, we will give retail traders some insight into how professional bankers trade forex, with their own bank’s money, in the forex market.

Wouldn’t it be absolutely fantastic if everybody traded forex the same way?  But of course, that is not the case because traders use different time frames, have different opinions about where currency exchange rates should be, they have different views on political and economic situations which will affect forex exchange rates, and this dynamic array of variances makes Forex moves very difficult to predict on a long-term basis.  Situations can change in the blink of an eye and cause price action moves and reversals, which nobody could have foreseen.

However, if retail traders knew what was going on behind the scenes at a major investment bank, might it give them a better understanding of how price action is affected by the big guns’ actions?  Well, yes, it would.

Firstly, it is he said that under 10% of bank traders’ own banks’ funds, accounts for 90% of all forex volumes. The best way to explain this is to say that the average forex retail trader probably trades between a couple of dollars per pip, with larger account balance traders ramping their trades up to $10 or a standard lot, equivalent, and perhaps a little more when risk suits. And now factor in the fact that over 75% of retail traders lose all of their money in the first 6 months of trading.

And now, let’s look at bankers. The majority of their trading is for their corporate or high net worth client base, where they instigate forex trades on those client’s behalf. And where some of these trades are speculative, and some of these trades are because of clients doing business in other currencies abroad, or perhaps hedging against inflation or portfolios or fluctuating exchange rates, etc.

But when the bankers themselves come to trade, these guys do not mess about. They are likely to instigate a spot or forward Forex trade in ticket sizes ranging from $10 million up to $500 million.  And in which case, they are certainly not picking their trades on a whim. They do not scalp, and they do not go long or short because a stochastic is overbought or oversold, or because an RSI has reached a particular area, or because a Fibonacci retracement to X, Y, or Z level has occurred.

Professional bank traders have a dedicated team behind them who are professional analysts and economists advising them. They have a defined fundamental and technical view of where an exchange rate should be and where reversals in price action might occur, and they tend to be swing traders, not intraday traders, and they usually only do a couple of trades a week on their own bank’s book. But how do they choose their levels?

You definitely will not find something like this one hour chart of the EURUSD pair on a professional bank trader’s screen, which is cluttered with lagging indicators.

However, you probably would find something like this daily EURUSD chart. But what are they looking at? What information does such a chart provide them? 

Actually, it provides them with a wealth of information, such as here we have added some notes, including at position A , which shows defined lines of resistance and support, in a wedge-shaped formation, where a bullish breakout occurs.

And at position B, where price reverses 300 pips from the key 1.200 level, before forming a support line and where the price is moving higher, potentially retesting that key level again.

Now, if our professional bank traders bought this pair at the breakout from position A and rode that trade up to the peak at position B, they would have made 1000 pips on that trade, on a multimillion Euro – in this case – ticket size. The profits would have been incredible. 

Therefore, we know that professional bank traders take a longer-term view of the market. They enter with large size ticket trades, and they use a minimal amount of technical analysis indicators, preferring to draw their own trendlines while looking for breakouts and concentrating heavily on key numbers for support and resistance.

While bankers have deep pockets in terms of how much exposure they have with regard to stop losses, it is almost impossible for a retail trader to incorporate the same amount of risk into their trades.  However, if a retail trader understands where these large ticket trades are occurring, it could be beneficial in terms of their own trading setups.

In conclusion, no matter what your trading style is, look at the longer time frames and look at key areas of support and resistance, which is the institutional size traders maybe referring to, in order to better select your trades on the lower time frames.

Categories
Forex Elliott Wave Forex Market Analysis

AUDUSD Consolidates its Gains Expecting the US Employment Data Ahead

The price of AUDUSD reached a fresh yearly high at 0.74496 on the Thursday trading session expecting the last employment data release of the year for the US labor market corresponding to November. 

(Source: tradingeconomics.com)

Technical Overview

This year, as illustrated in the previous chart, Australia’s unemployment rate peaked at a record high of 14.7% in April, mainly boosted by the coronavirus lockdown. In this context, the analysts’ consensus expects the unemployment to drop to 6.8% for November, from 6.9% reported last October.

The mid-term Elliott wave perspective displayed in the 12-hour chart below reveals the upward progression in an incomplete five-wave sequence of Minor degree labeled in green. This bullish impulsive move began on March 18th when the Aussie found fresh buyers at 0.55063.

The previous chart also shows the Aussie’s advance in a third extended wave, suggesting that the price action could be moving in its fourth wave in green, still in development. 

This scenario considers that the Aussie moves in its internal wave (c) of Minuette degree labeled in blue, developing an ending diagonal pattern. Likewise, the wave of the upper degree corresponding to wave ((b)) of Minute degree identified in black should correspond to an expanded flat pattern, and the price should realize a new decline,

The alternative count considers the advance in the fifth wave of Minor degree in green is developing an internal ending diagonal pattern. In this case, the Aussie should start a decline corresponding to wave A in green.

Technical Outlook

The short-term Elliott wave for AUDUSD exposed in its 4-hour chart shows the advance in an ending diagonal pattern, which looks developing its fifth wave of Subminuette degree labeled in green.

Although the ending diagonal pattern suggests completing the fifth wave or wave (c), the Aussie must confirm its completion through the breakdown of its base-line that connects the waves ii and iv, in green. Also, the price should confirm the close below the intraday demand zone between 0.73492 and 0.73571.

Finally, if the price confirms its downward correction, the potential target area for this movement is from 0.7265 and 0.7144. If the area fails to hold, and the bearish pressure extends this downward movement, the Aussie could visit the base of its sideways channel on the psychologically key level of 0.70.

Categories
Forex Videos

Forex – Fed Saturates The Markets With Dollars – How Should You Trade The Dollar Now!


Fed saturates the markets with dollars – what next? 


In this session, we will be looking at the extraordinary amounts of US dollars, which have been printed by the federal reserve in America and flooded into the system to try and prop up the US economy during the coronavirus.

Since the pandemic began and started to bite in the United States, it is estimated that over 20% of all circulating US dollar bills were printed during this time.

 Although the federal reserve has publicly declared that their monetary policy has not been designed to save Wall Street,…..

….there is no denying from this chart that dollars,  which are required to buy United States stocks,  are finding their way into US stocks and indices, such as the Dow Jones Industrial Average Index shown here, which had climbed from the panic sell-off in March 2020 when the pandemic began to take a grip of the United States,  up to record highs of over 30 thousand.

Purely on a supply and demand basis,  the shock and magnitude of the influx into the market of the US dollar has gone a long way to shedding its market value against currencies, including the major currency pairs as shown here on this dollar index where it was at a high of 103.00 in March, and while the fed has been pumping dollars into the system, it has collapsed to 91.70 at the time of writing.

While the safety of gold saw investors take flight here during the latter part of March 2020, causing the precious metal to rise in value in a risk-off event during the early stages of the pandemic in the USA to a peak of over 2000 an ounce, and where traders have pulled back while shifting their focus to the US stock market, in a risk-off phase, and where gold currently sits around 1800 per ounce.

The federal reserve has been getting into the markets indirectly, via the backdoor, by talking to hedge funds, mutual funds, credit facilities, market makers, and commercial paper funding facilities, and instigated a huge emergency repo loan operation with the New York fed, where it is said that over 6 trillion dollars have as entered into circulation through this facility.

The Fed’s pumping of dollars into the market, where its value has crashed in value relatively over the last 100 years, has given fuel for the rise in interest for bitcoins and other cryptocurrencies and as we have seen gold and other precious metals, while investors try to hedge against dollar depreciation and inflation, as the dollar continues to lose value against other assets. 

 And by the time the new president-elect, Joe Biden, takes office, the two political houses in the USA, currently at loggerheads, will agree more stimulus, in the range of 1 to 2 trillion dollars, and where once this has been agreed, this will only pour more oil on the burning cauldron and the effect will likely be the US dollar’s further decline, with a knock-on effect being volatility in the financial markets, and higher prices for consumers.  

Categories
Forex Signals

USD/CAD Bearish Bias Seems to Halt – Eyes on U.S. NFP Figures! 

The USD/CAD pair was closed at 1.28619 after placing a high of 1.29411 and a low of 1.28519. The USD/CAD pair extended its losses for the 3rd consecutive day on Thursday due to broad-based U.S. dollar weakness and the rising crude oil prices.

The USD/CAD fell to its lowest since October 2018 on Thursday as the U.S. Dollar Index (DXY) reached 90.50 level, its lowest for 31 months. The U.S. dollar weakness could be attributed to the latest progress made in the talks of stimulus relief package in the U.S.

The Top Democrats officials, including President-elect Joe Biden, House Speaker Nancy Pelosi, and the Senate Minority Leader Chuck Schumer, have said that they favored a $908 billion worth bipartisan bill for now as it was the starting step towards the stimulus package. These comments from Democrats raised hopes that a deal might be reached between Republicans and Democrats. Both parties have a shared view that there was a need for a 2020 stimulus package in the economy and that a deal should be reached soon.

This progress raised the hopes and optimism in the market related to the U.S.’s stimulus package and weighed heavily on the U.S. dollar that ultimately added in the losses of the USD/CAD pair. Meanwhile, the WTI crude oil prices increased on Thursday as producers, including Saudi Arabia and Russia, resumed discussion to agree on how much crude to pump in 2021 after earlier talks failed to compromise how to tackle the weak oil demand coronavirus pandemic.

In late Thursday, OPEC+ announced after three days of discussion that they have agreed to increase the production by 500,000 barrels per day beginning in January. This will bring the total production cuts at the start of next year to 7.2 million BPD. On Thursday, the rising crude oil prices added strength in the commodity-linked Loonie that added further pressure on the USD/CAD pair.

On the data front, at 17:30 GMT, the Challenger Job Cuts for the year in November came in as 45.4%against the previous 60.4%. At 18:30 GMT, the Unemployment Claims from last week fell to 712K against the expected 775K and supported the U.S. dollar. At 19:45 GMT, the Final Services PMI for November rose to 58.4 against the forecasted 57.5 and supported the U.S. dollar. At 20:00 GMT, the ISM Services PMI stayed as forecasted 55.9.


Daily Technical Levels

Support Resistance

1.2898 1.2950

1.2877 1.2981

1.2847 1.3002

Pivot point: 1.2929

The USD/CAD traded in a selling mode, falling below the 1.2885 level to test the support area of the 1.2845 level. Bearish crossover of 1.2845 level can extend selling bias until 1.289 level. We opened a selling trade during the European open, but it seems to consolidate sideways ahead of the NFP figures. Here’s a trading plan for now…

Entry Price – Sell 1.28485

Stop Loss – 1.28885

Take Profit – 1.28085

Risk to Reward – 1:1

Profit & Loss Per Standard Lot = -$400/ +$400

Profit & Loss Per Micro Lot = -$40/ +$40

Fellas, now you can check out forex trading signals via Forex Academy mobile app. Follow the links below.

iPhone Users: https://apps.apple.com/es/app/fasignals/id1521281368

Andriod Users: https://play.google.com/store/apps/details?id=academy.forex.thesignal&hl=en_US

Categories
Forex Market Analysis

Daily F.X. Analysis, December 04 – Top Trade Setups In Forex – NFP in Highlights! 

The eyes will remain on the U.S. NFP data on the news side, which is expected to report a slight drop from 638K to 500K during the previous month. Besides, the U.S. Average Hourly Earnings m/m and Unemployment Rate will also remain the main highlight of the day, and these may determine the USD trend for today and next week. Let’s wait for the news.

Economic Events to Watch Today  


EUR/USD – Daily Analysis

The EUR/USD pair was closed at 1.21474 after placing a high of 1.21744 and a low of 1.21008. EUR/USD pair extended its gains for the 3rd consecutive day on Thursday due to the U.S. dollar’s weakness amid the rising hopes for the next round of U.S. stimulus package from Congress.

The Top Democrats, Joe Biden, and Nancy Pelosi backed the bipartisan $908 billion stimulus plan on the previous day. They urged the Senate Majority Leader Mitch McConnell to drop his plan to bring a more modest package. All top Democrats, including the President-elect Joe Biden, Nancy Pelosi, and the Senate Minority Leader Chuck Schumer, said that the bill would be acceptable as a starting point. 

The need for more stimulus relief packages to support the economy was increasingly evident, with both the ADP Non-Farm Payrolls and the ISM manufacturing survey below the expectations. Meanwhile, Car and Truck sales in November also fell from October level. On the coronavirus front, the U.S. had its deadliest day since the start of the pandemic on Thursday, with over 2700 recorded deaths due to coronavirus. Over the past 2-days alone, the death toll has reached 5000. The number of hospitalized people also reached for the first time, an alarming level of 100,000. All these developments weighed heavily on the U.S. dollar on Thursday and added strength to the EUR/USD pair.

The Spanish Services PMI for November raised to 39.5 against the expected 36.5 and supported Euro and added further gains in EUR/USD pair. At 13:45 GMT, the Italian Services PMI declined to 39.4 against the forecasted 40.9 and weighed on Euro. At 13:50 GMT, the French Final Services PMI fell to 38.8 against the anticipated 49.1 and weighed on Euro. AT 13:55 GMT, the German Final Services PMI came in line with the expectations of 46.2. At 14:00 GMT, the Final Services PMI from Eurozone raised to 41.7 against the expected 41.3 and supported Euro and the EUR/USD pair raised further. At 15:00 GMT, the Retail Sales for October also surged to 1.5% against the anticipated 0.7% and supported Euro and helped the EUR/USD pair to continue its bullish momentum.

From the U.S. side, at 17:30 GMT, the Challenger Job Cuts for the year in November came in as 45.4%against the previous 60.4%. At 18:30 GMT, the Unemployment Claims from last week fell to 712K against the anticipated 775K and supported the U.S. dollar. At 19:45 GMT, the Final Services PMI for November surged to 58.4 against the anticipated 57.5 and supported the U.S. dollar. At 20:00 GMT, the ISM Services PMI stayed as anticipated 55.9.

Daily Technical Levels

Support   Resistance

1.1971       1.2122

1.1873       1.2175

1.1819       1.2273

Pivot point: 1.2024

EUR/USD– Trading Tip

On Friday, the EUR/USD pair continues to trade sideways ahead of the NFP figures, which may drive sharp movements during the U.S. session.

On the higher side, the EUR/USD may find an immediate resistance at 1.2160 and 1.2196 level. Simultaneously, the closing of candles below the 1.2103 level can send the EUR/USD pair further lower until 1.2080. Trend depends upon the NFP data.


GBP/USD – Daily Analysis

The GBP/USD closed at 1.34525 after placing a high of 1.34998 and a low of 1.33288. The GBP/USD pair rose and reached above one year’s highest level over the bullish Brexit bets and the U.S. dollar’s weakness. On Thursday, the latest news raised the British Pound over the board that suggested that the Brexit trade deal could be reached by the weekend after the two sides showed hints of compromise over fish quotas. The positive news made the British Pound the best performer on the day in the G10 currencies. 

In an attempt to break the deadlock, Mr. Barnier and Boris Johnson lowered their demands by asking to get back only 60% of the fish that E.U. boats currently catch in British waters, down from 80%. Under the reported proposal, the U.K. would hold onto increased stocks of fish that are sold in the U.K. while the E.U. will keep the similar quotas of stock that are popular in the E.U. but not in the U.K.

The compromise was reported less than a week after E.U. Brexit negotiator Michel Barnier proposed to return about 15-18% of the fish caught by European fleets in British waters to the U.K. under a free trade agreement; however, at that time, the U.K. rejected this proposal.

The progress on fisheries is progress after a months-long stalemate; however, other key sticking points, including the level-playing field and governance, need to be solved to reach a deal. The time for the end of the Brexit transition period is near, and both sides have shown hints that a deal might reach by this weekend.

All these optimistic Brexit progress reports gave the local currency British Pound strength and supported the GBP/USD pair’s upward momentum that led the pair to its one-year highest level near 1.35000 on Thursday.

On the data front, at 14:30 GMT, the Final Services PMI from Britain raised to 47.6 against the expected 45.8 and supported British Pound and added further gains in GBP/USD pair.

From the U.S. front, at 17:30 GMT, the Challenger Job Cuts for the year in November came in as 45.4%against the previous 60.4%. At 18:30 GMT, the Unemployment Claims from last week declined to 712K against the projected 775K and supported the U.S. dollar. At 19:45 GMT, the Final Services PMI for November rose to 58.4 against the projected 57.5 and supported the U.S. dollar. At 20:00 GMT, the ISM Services PMI stayed as projected 55.9.

Furthermore, the gains in GBP/USD pair on Thursday were also because of the U.S. dollar’s weakness due to the progress in talks to reach a consensus between Republicans & Democrats over the second round of stimulus talks. Joe Biden, Nancy Pelosi, and Chuck Schumer have shown their consent for the bipartisan bill of $908 billion. This progress raised the hopes for a stimulus bill and weighed on the U.S. dollar that added strength to the GBP/USD pair.

Daily Technical Levels

Support   Resistance

1.3286       1.3441

1.3209       1.3519

1.3131       1.3596

Pivot Point: 1.3364

GBP/USD– Trading Tip

The GBP/USD is trading sideways in between a fresh trading range of 1.3305 – 1.3445. Breakout of this range can lead the Cable price towards the 1.3517 level. The volatility seems low ahead of the Christmas holidays. However, the European session can trigger a buying trend until the 1.3515 level, while support continues to stay at the 1.3305 level. A bearish breakout of the 1.3305 level can trigger selling until the 1.3212 level. The MACD and RSI are suggesting a bullish bias in the market. Let’s consider taking buying trades over 1.3305 and 1.3447 level today.


USD/JPY – Daily Analysis

The USD/JPY pair was closed at 103.841 after placing a high of 104.534 and a low of 103.669. The USD /JPY pair dropped to its lowest since November 18 on Thursday due to broad-based U.S. dollar weakness.

The U.S. Dollar Index extended its losses for 3rd consecutive day on Thursday and fell to a 31-month lowest level below 91.10 after the hopes for the next round of stimulus raised in the market. The top three Democratic Leaders, President-elect Joe Biden, House Speaker Nancy Pelosi, and Senate Minority Leader Chuck Schumer, backed the bipartisan proposal for a coronavirus relief package worth $908 billion. They all urged the Senate Majority Leader Mitch McConnell to drop his plans of bringing a more modest package back to the floor of the upper chamber.

Both parties agree that more relief aid should be delivered to Americans to curb the coronavirus pandemic’s effects but have differences over the size, method, and healthcare system. The renewed efforts to strike a deal followed a months-long deadlock over the second stimulus relief package and weighed heavily on the greenback that added losses in the USD/JPY pair.

On the data front at 17:30 GMT, the Challenger Job Cuts for the year in November came in as 45.4%against the previous 60.4%. At 18:30 GMT, the Unemployment Claims from last week dropped to 712K against the estimated 775K and supported the U.S. dollar, and capped further losses in the USD/JPY pair. At 19:45 GMT, the Final Services PMI for November rose to 58.4 against the estimated 57.5 and supported the U.S. dollar. At 20:00 GMT, the ISM Services PMI stayed as estimated at 55.9.

Furthermore, the U.S. dollar was also weak because of the rising cases of coronavirus in the U.S. The U.S. saw its deadliest day since the start of the pandemic on Thursday after 2,700 deaths were reported in a single day. Over the past two days only, the death toll has reached 5,000 in the U.S. from the coronavirus, and the hospitalization rate has also increased, with more than 100,000 cases reported to be hospitalized in a single day.

These raised concerns for the U.S. economy as many states were still under strict restrictive measures, and the economic activities there were still affected. The rising number of deaths might weigh more on the local currency. The U.S. dollar came under pressure and dragged the USD/JPY pair further on the downside.

Daily Technical Levels

Support   Resistance

104.13       104.54

103.95       104.77

103.72       104.95

Pivot point: 104.36

USD/JPY – Trading Tips

The USD/JPY has violated the sideways trading range of 104.600 – 104.200, and now it’s trading at 103.876 level. On the lower side, the pair has formed a triple bottom level, supporting the pair around 103.700 level. Investors seem to wait for the U.S. NFP and unemployment rate figures to determine further U.S. dollar trends. On the lower side, the USD/JPY may head towards the 103.200 level upon a bearish breakout of the 103.750 support level. While resistance stays at 104.350 today. Good luck