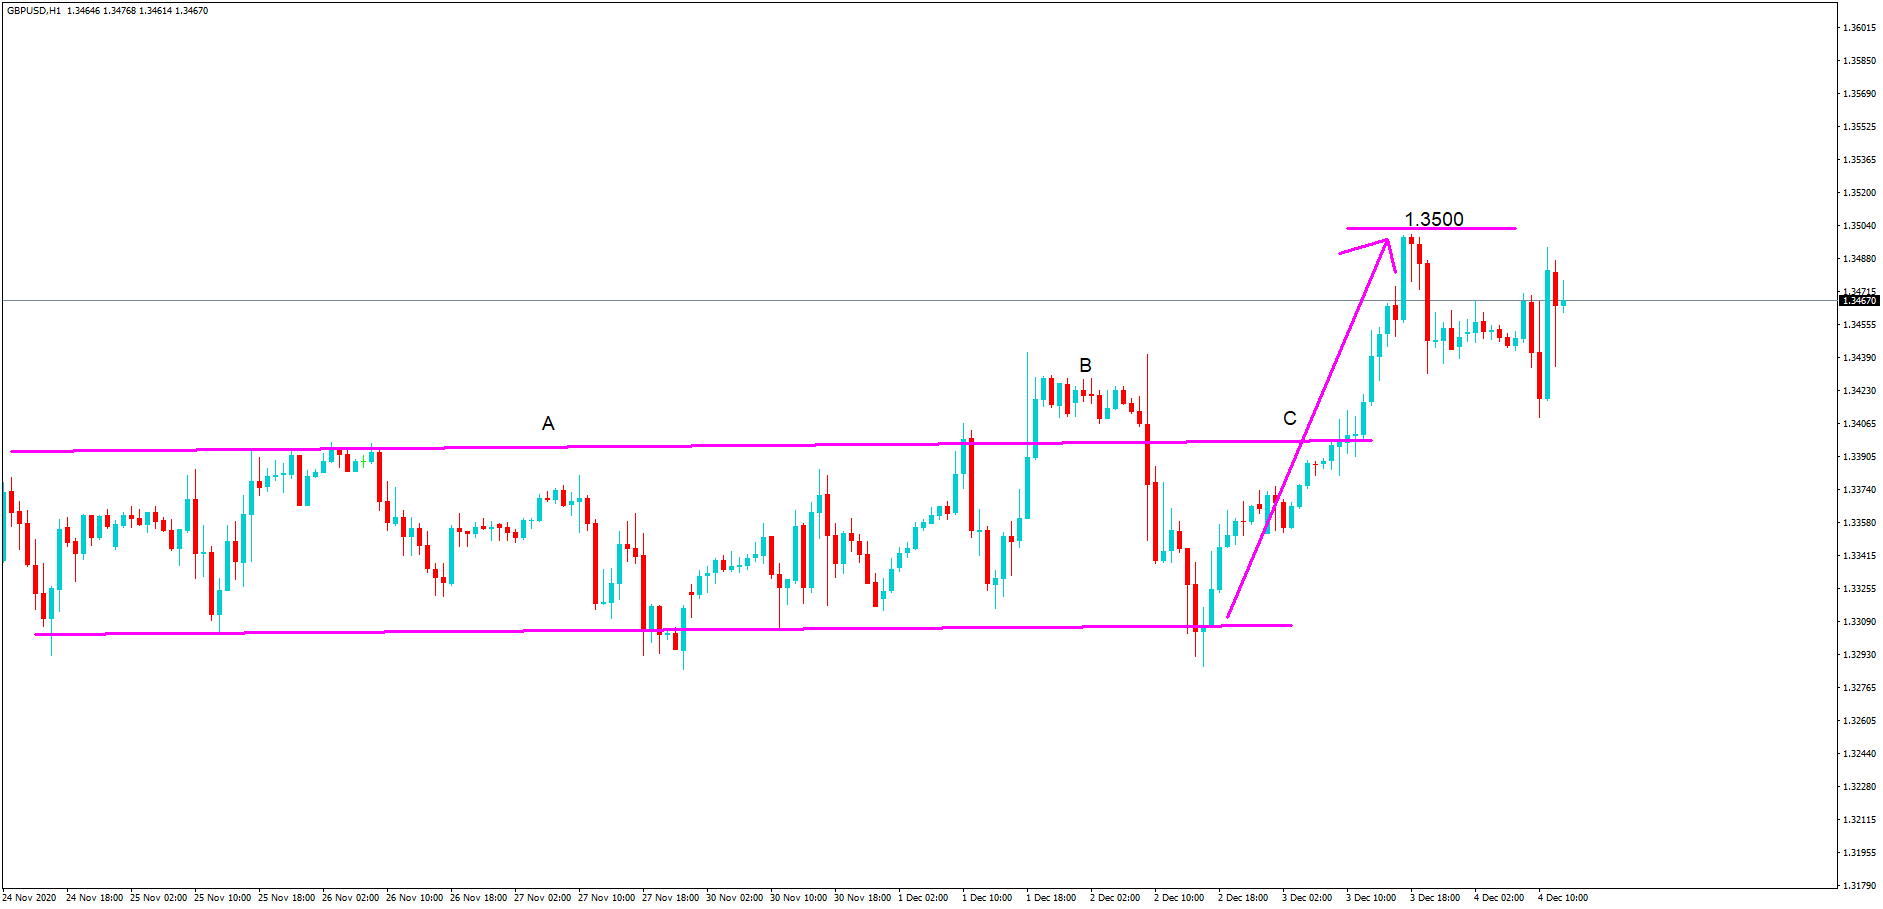
Introduction
Global macro analysis of the EUR/AUD pair will focus on the endogenous analysis of fundamental factors driving economic growth in the EU and Australia. It will also involve exogenous analysis that will focus on factors that influence the EUR/AUD pair’s exchange rate.
Ranking Scale
This analysis will assign a score between -10 and +10, depending on the endogenous and exogenous factors’ impact.
A negative score for the endogenous factors means that the local currency shed some value. When positive, it means that the domestic currency has appreciated. The endogenous score is determined through correlation analysis between the endogenous factors and the GDP growth rate.
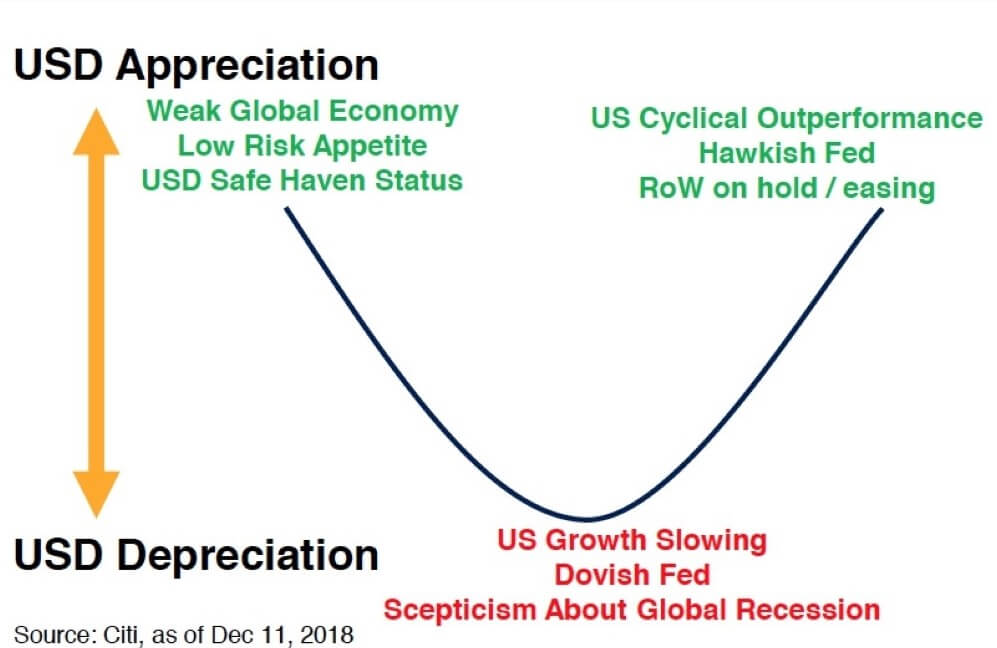
On the other hand, when the exogenous factors have a negative score, it means that the exchange rate between the EUR and the AUD will drop. A positive score means that the exchange rate will rise. The exogenous score is determined via a correlation analysis between the exogenous factors and the EUR/AUD pair’s exchange rate.
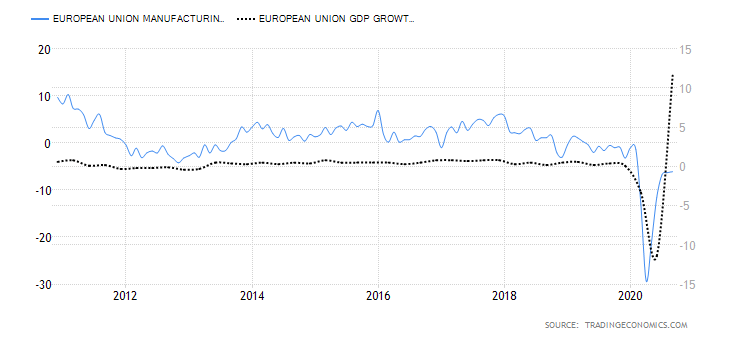
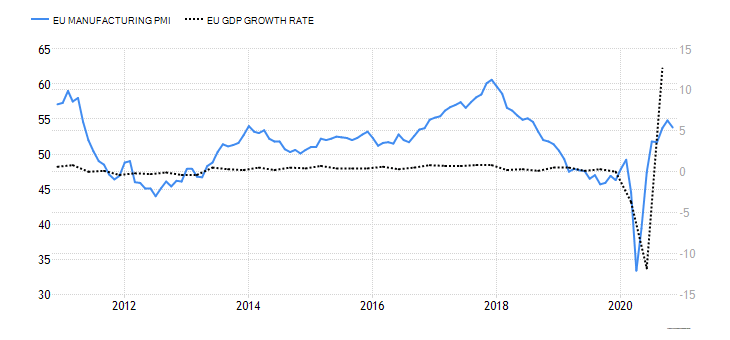
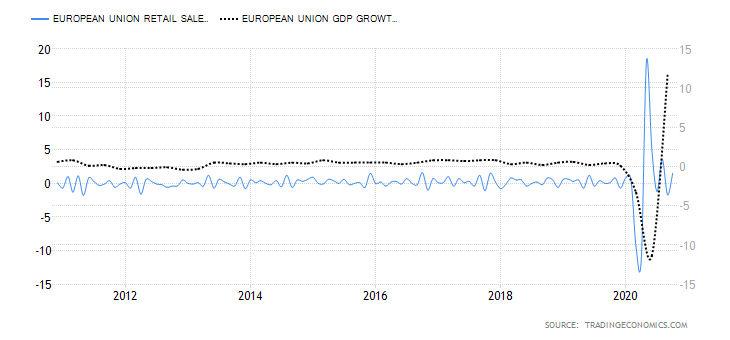
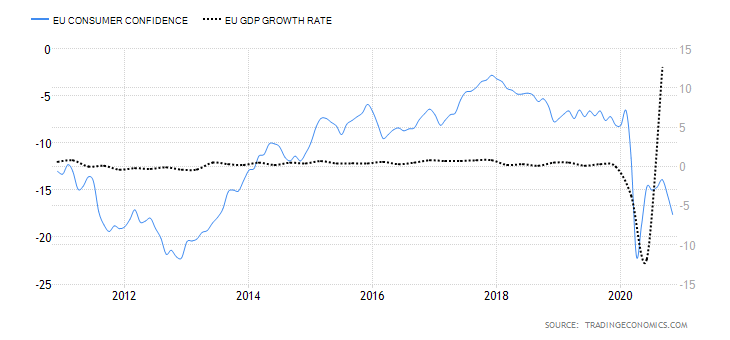
EUR Endogenous Analysis – Summary
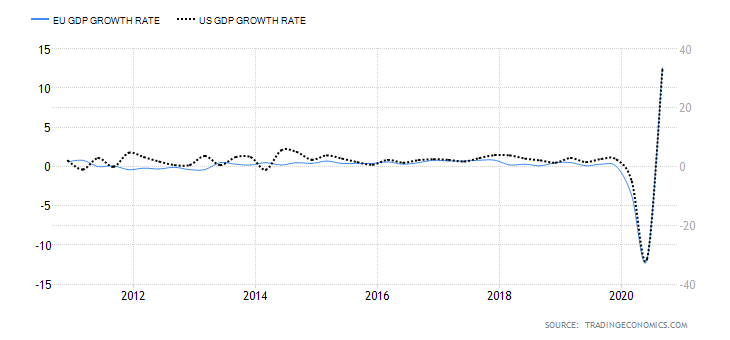
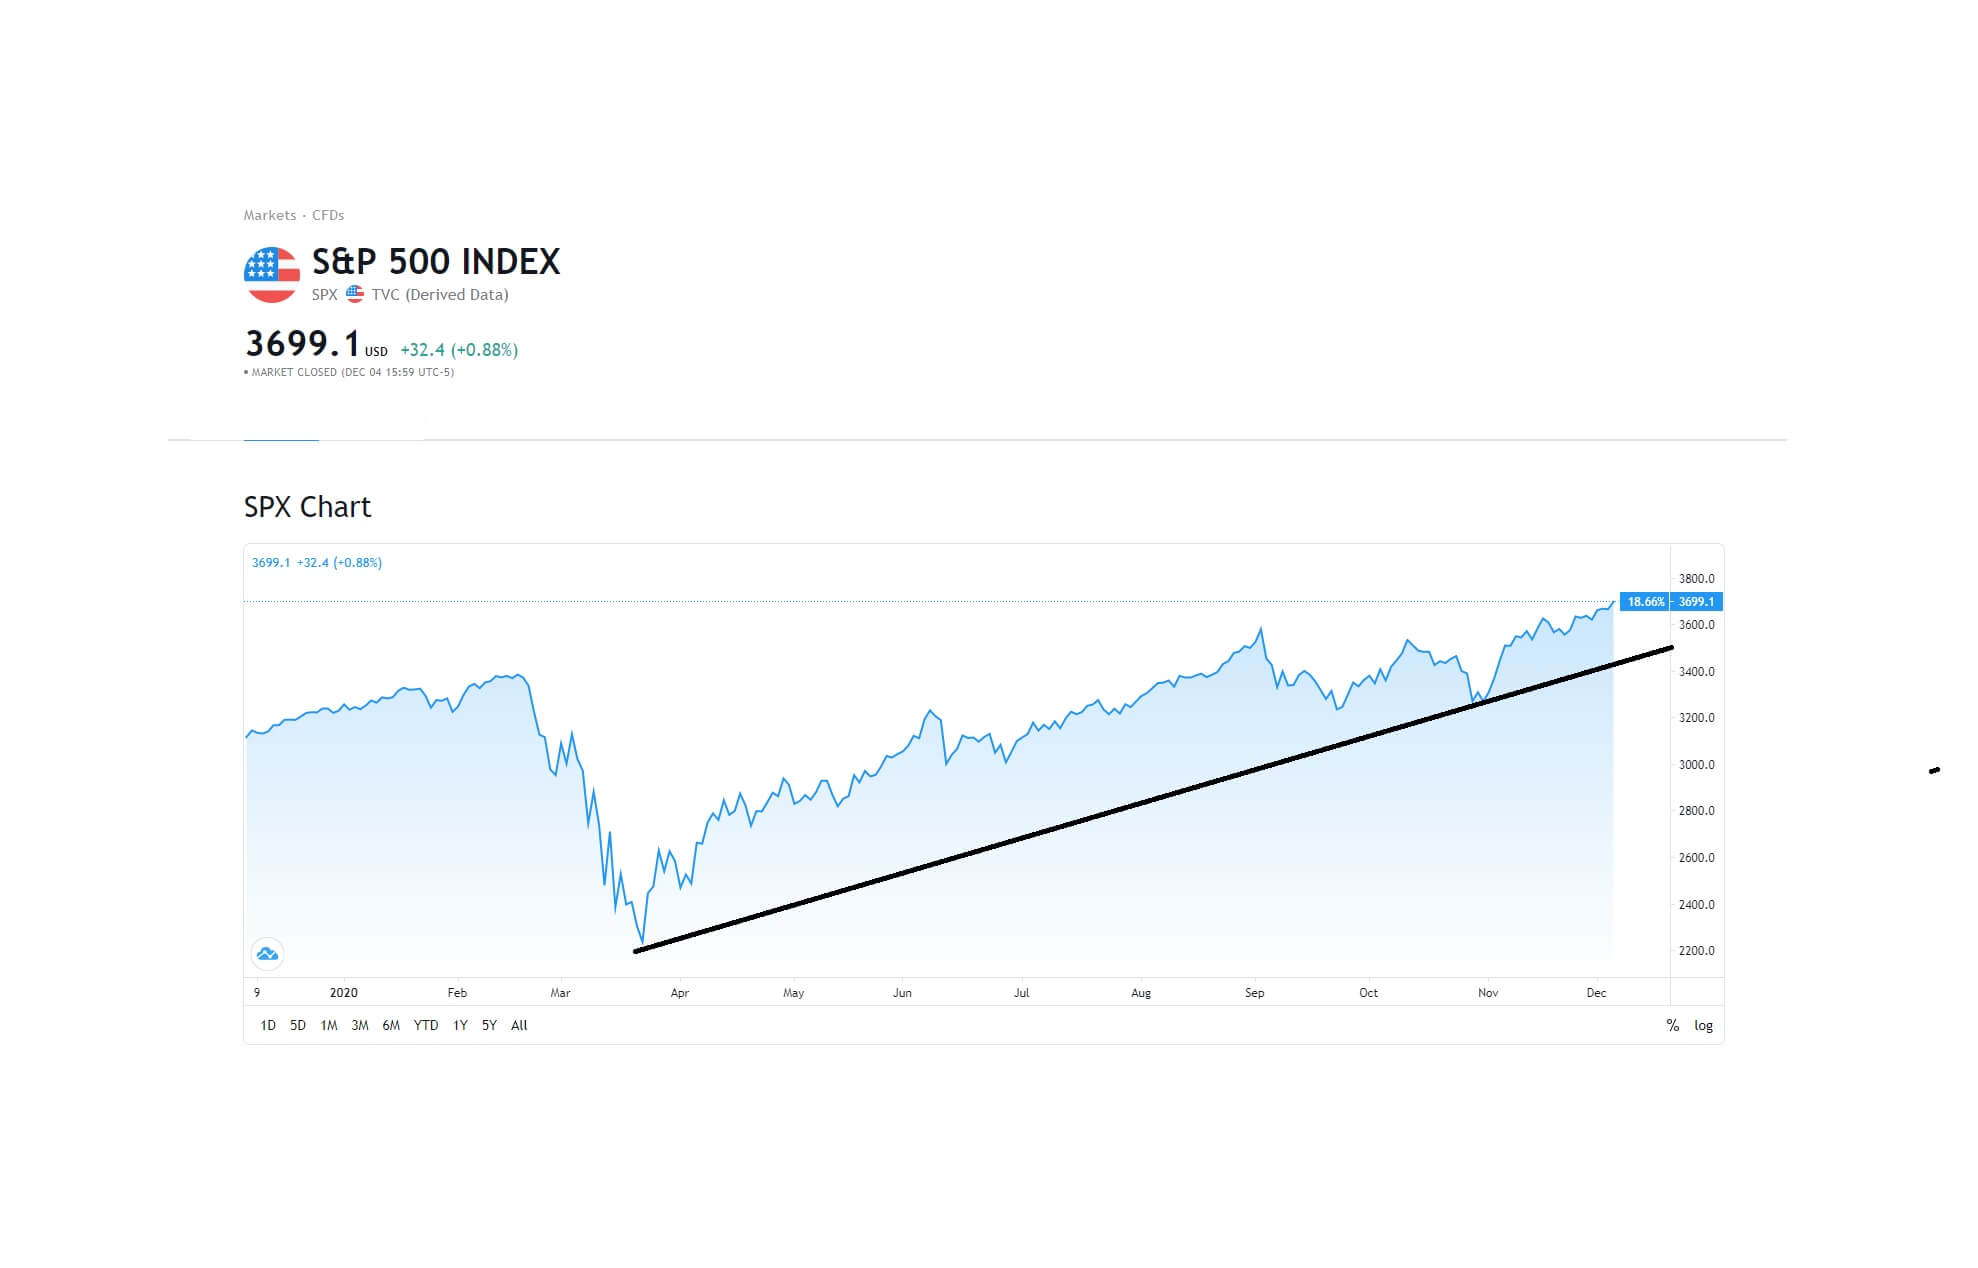
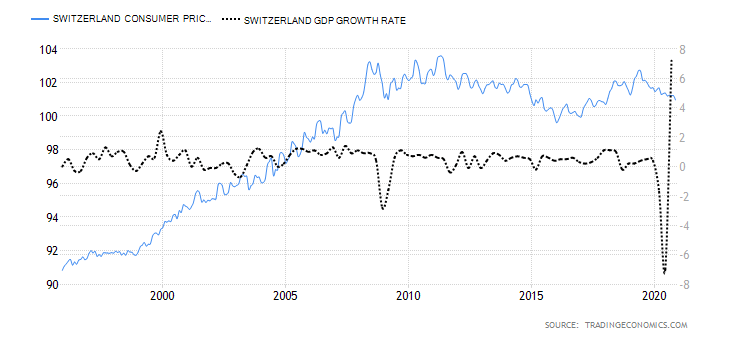
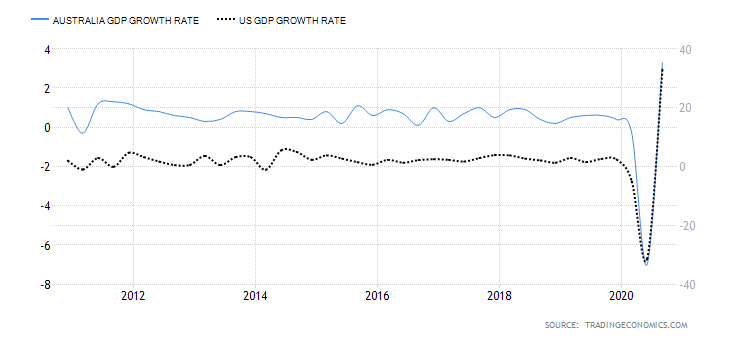
The endogenous analysis of the EUR has an overall score of -3. Based on the factors we have analyzed, we can expect that the Euro has marginally depreciated in 2020.

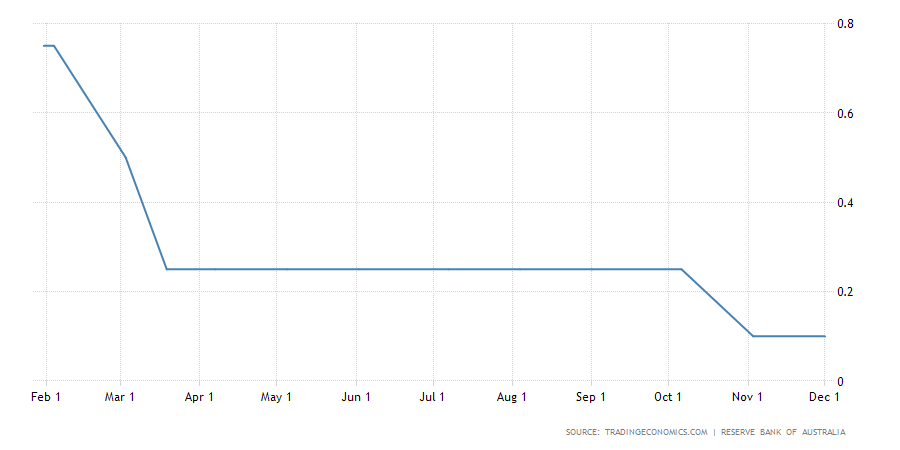
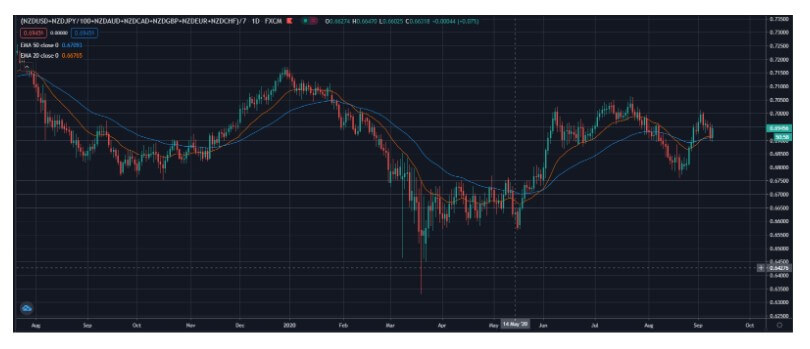
AUD Endogenous Analysis – Summary
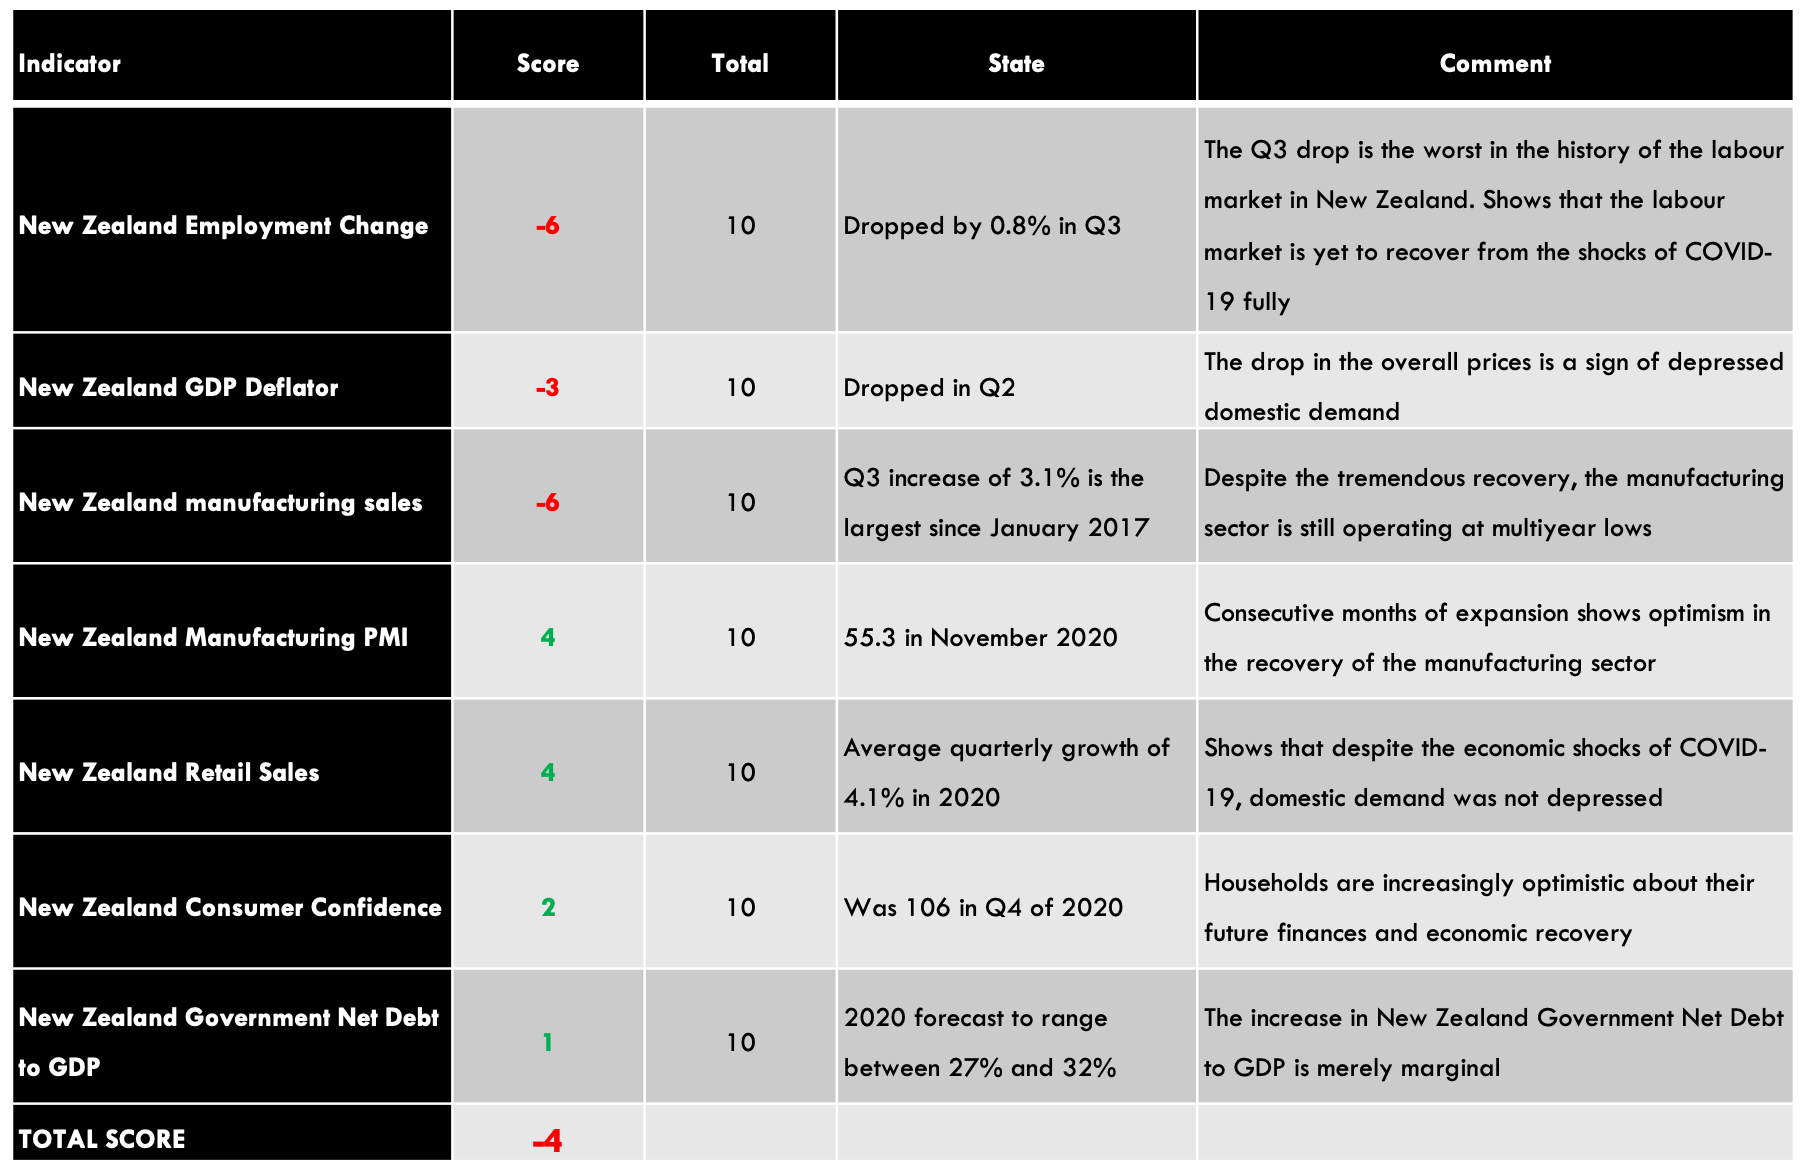
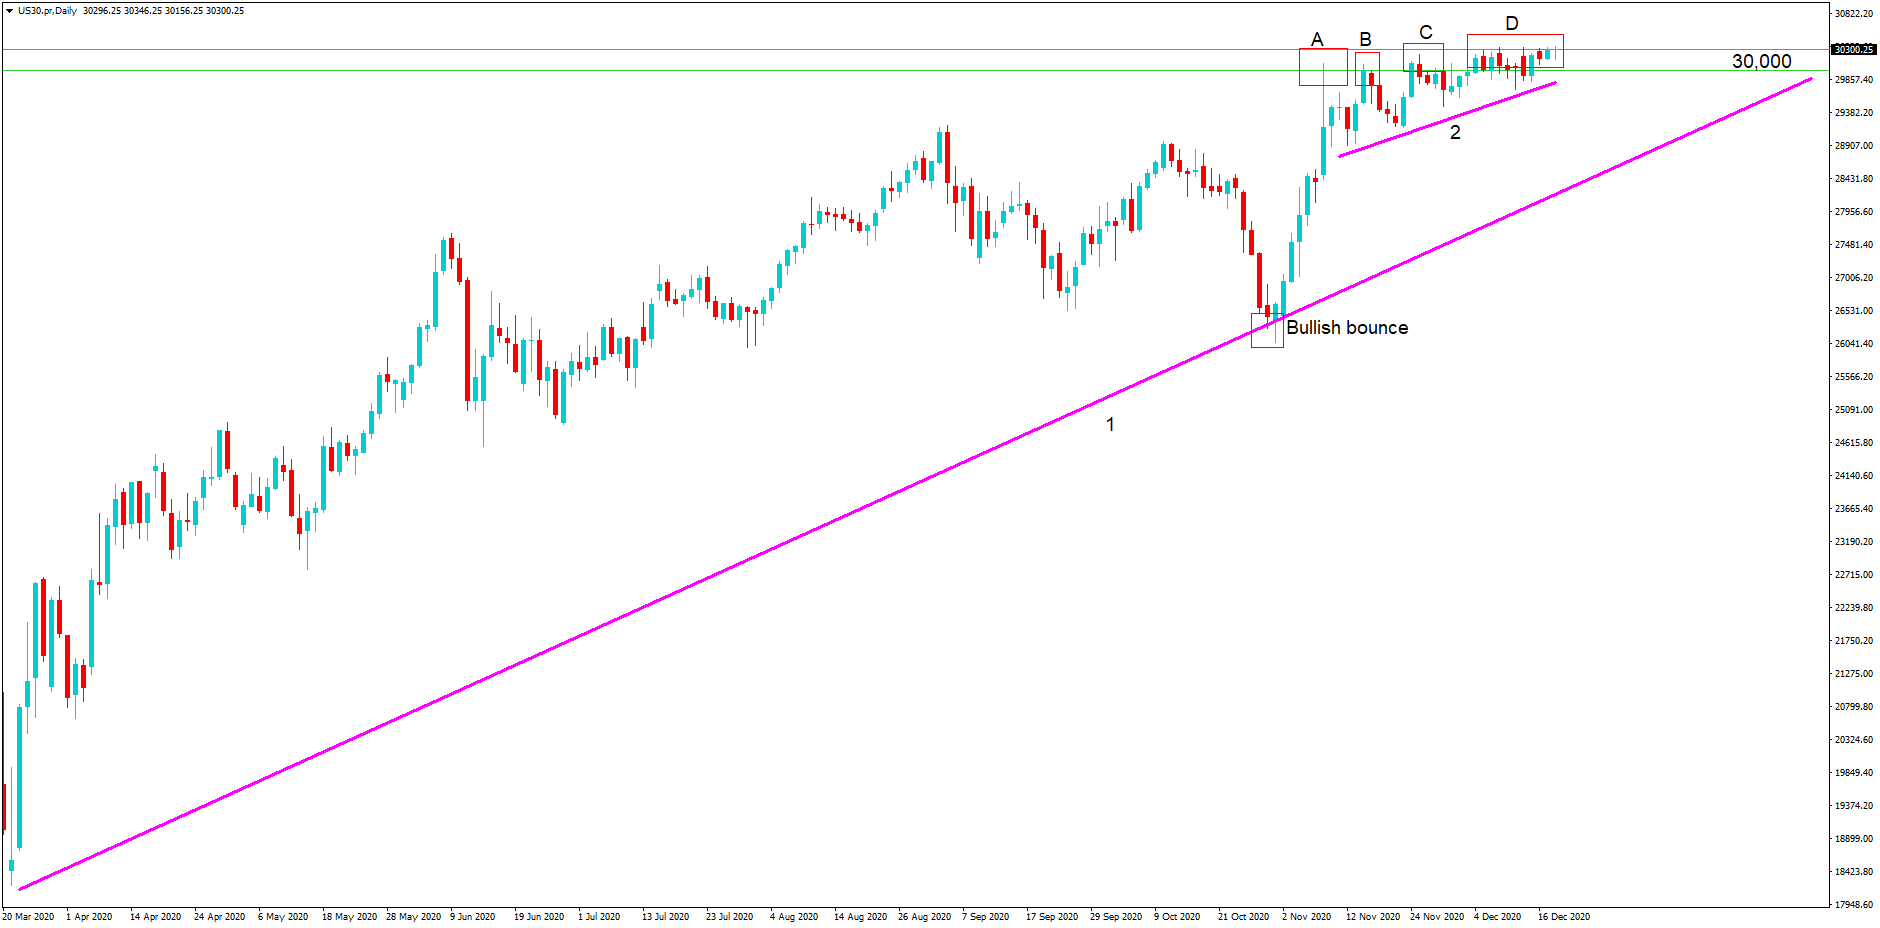
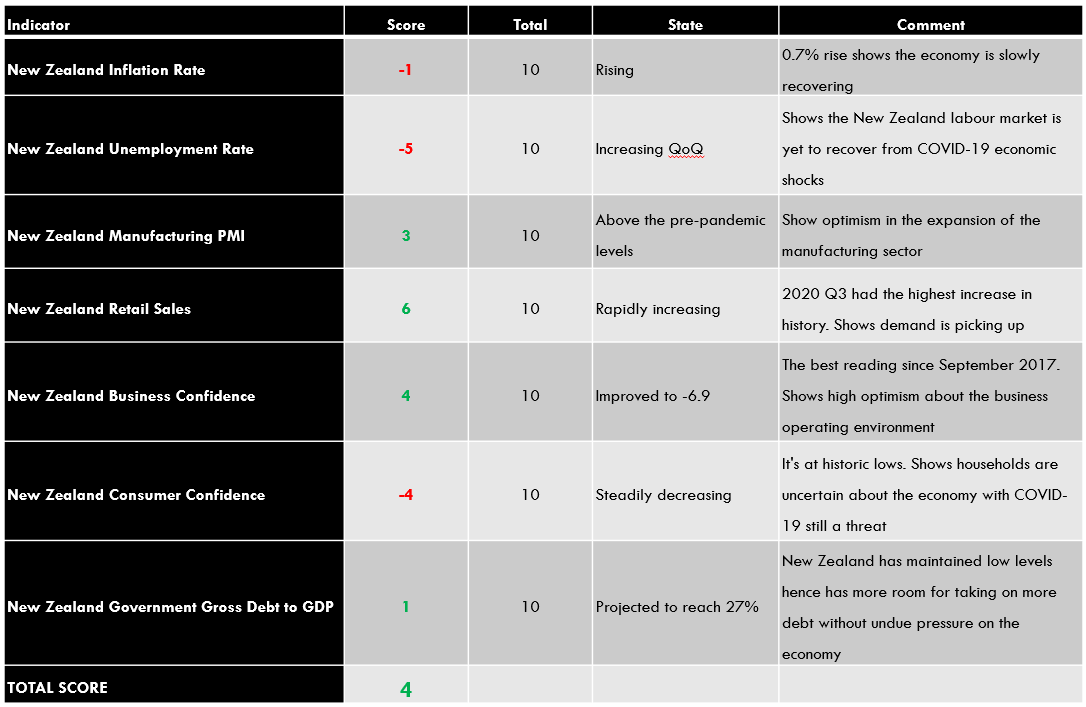
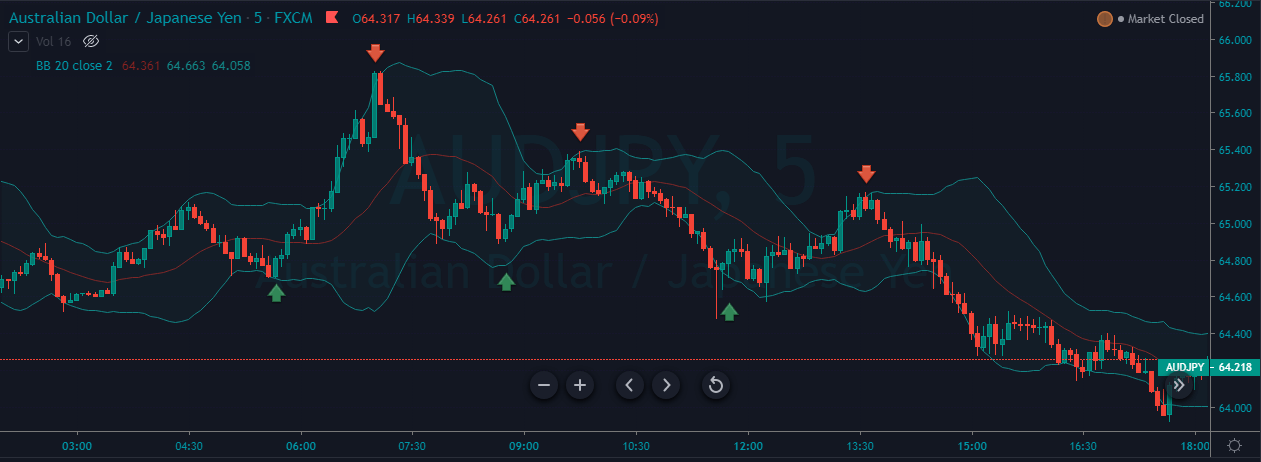
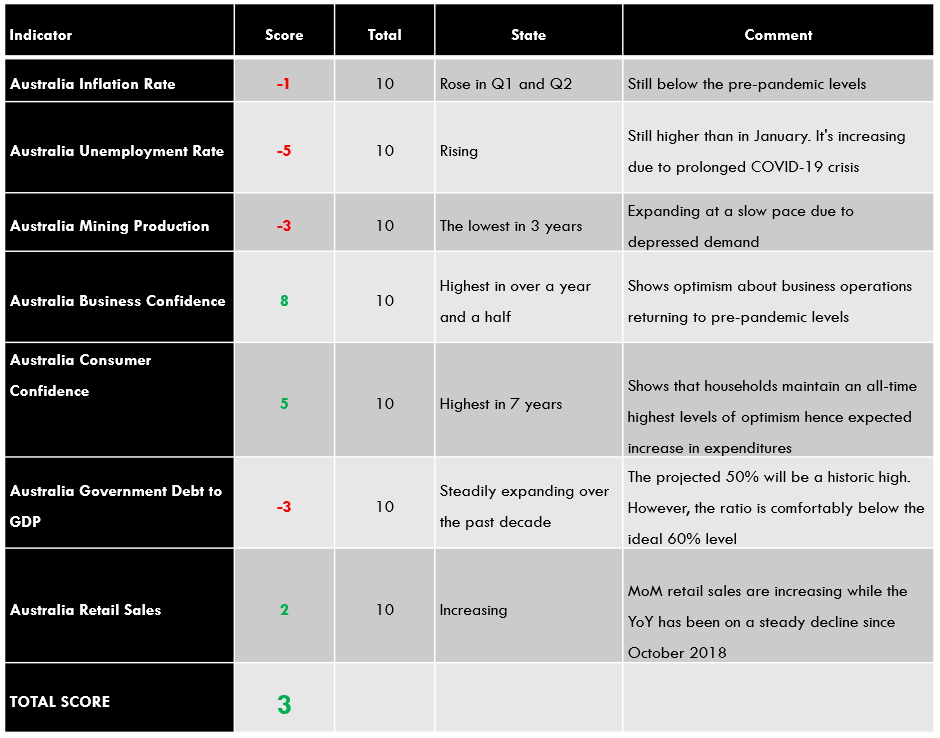
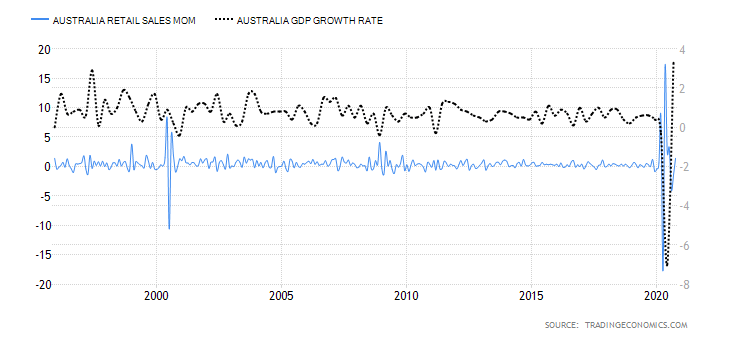
As you can see in the below image, according to the Endogenous Indicators of AUD, we can conclude that this currency has depreciated as well in 2020.
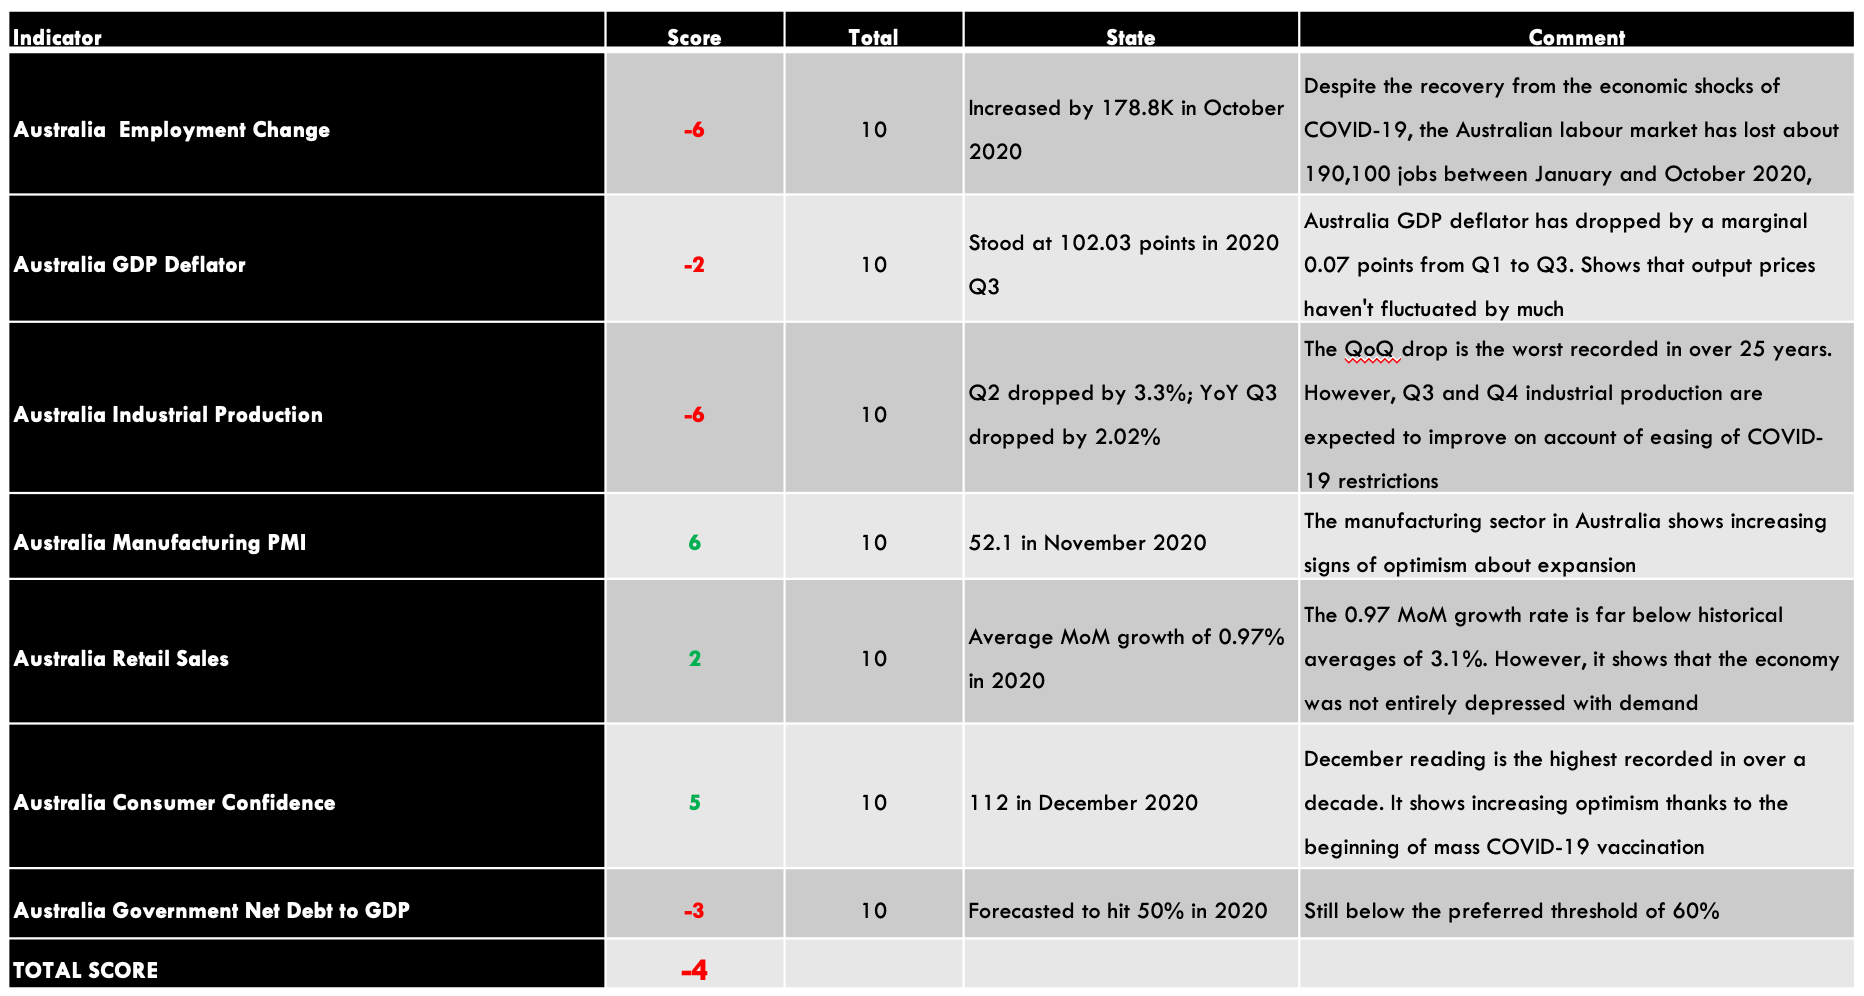
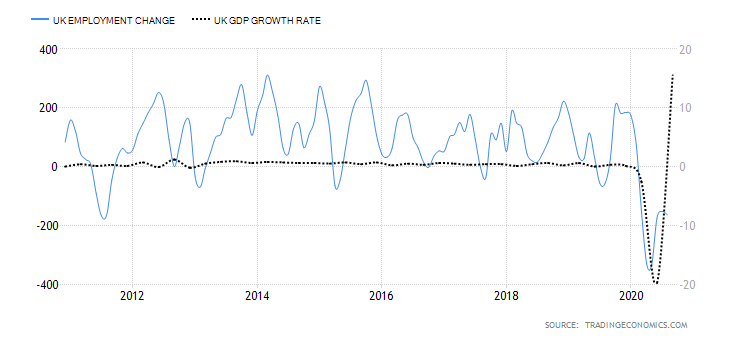
- Australia Employment Change
The employment change in Australia tracks the monthly number of people who are gainfully employed or engaged in unpaid work. The fluctuation in the number of those employed on a full-time or parttime basis helps to show economic growth.

Between September and October 2020, the number of those employed in Australia increased by 178,800. This shows that the economy is recovering and adding more jobs to the labor market. However, from January to October, the Australian labor market has lost about 190,100 jobs. Hence, we assign a score of -6.
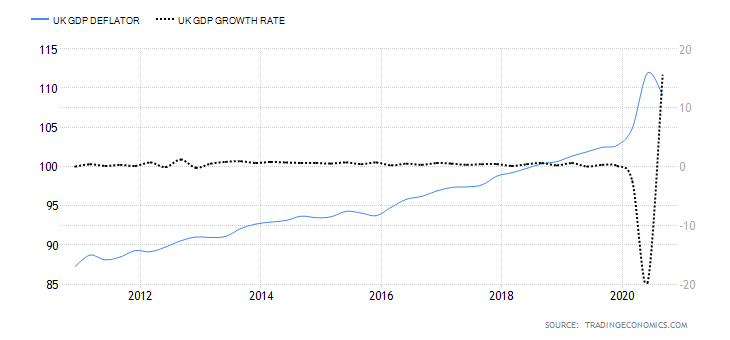
- Australia GDP Deflator
The GDP deflator measures the overall inflation for the economy. It is a comprehensive measure of inflation rate compared to other measures since it accounts for the changes in the prices of all goods and services produced within Australia. Changes in the prices often correspond to changes in economic growth.
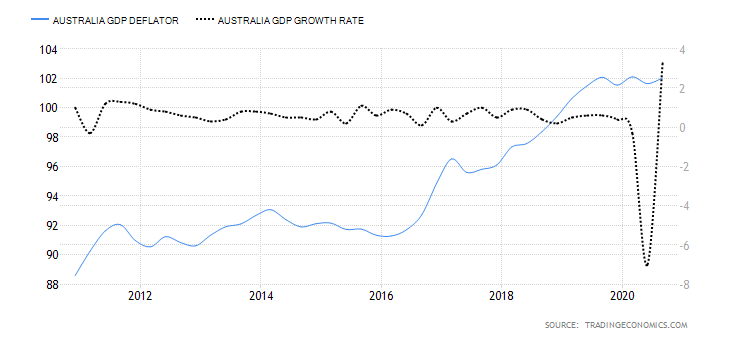
In the third quarter of 2020, the Australia GDP deflator rose to 102.03 points from 101.64 in Q2. Up to Q3, the GDP deflator in Australia has dropped by 0.07 points. We assign a score of -2.
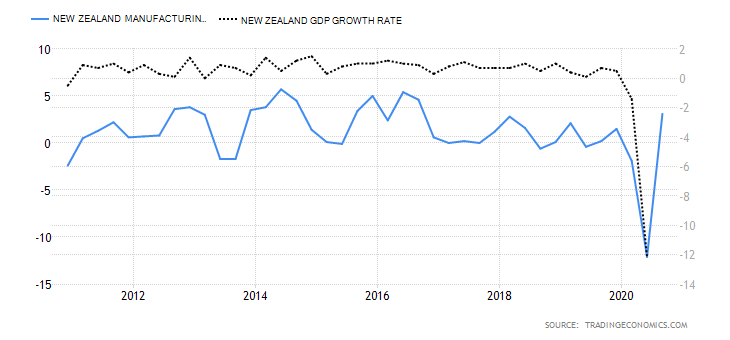
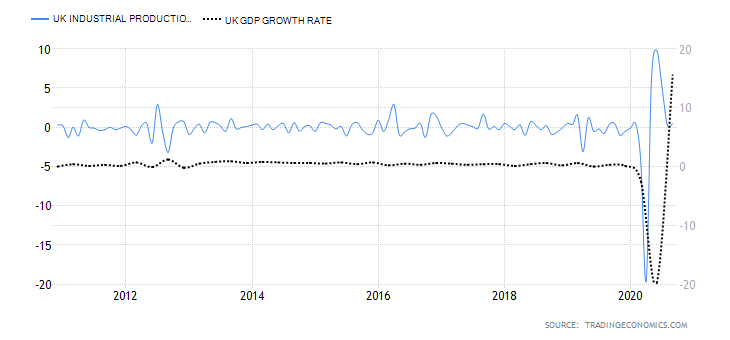
- Australia Industrial Production
Industrial production measures the quarterly changes in output from the manufacturing sector, utilities, and mining. Note that the Australian economy is heavily dependent on commodity exports, which means that industrial production changes significantly impact economic growth.
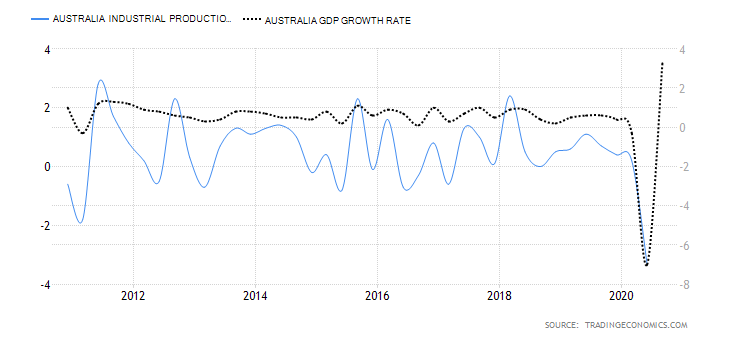
In Q2, the industrial production in Australia dropped by 3.3%, while the YoY Q3 industrial production dropped by 2.02%. The drop in Q2 is the largest quarterly drop in over 25 years. We assign a score of -6.
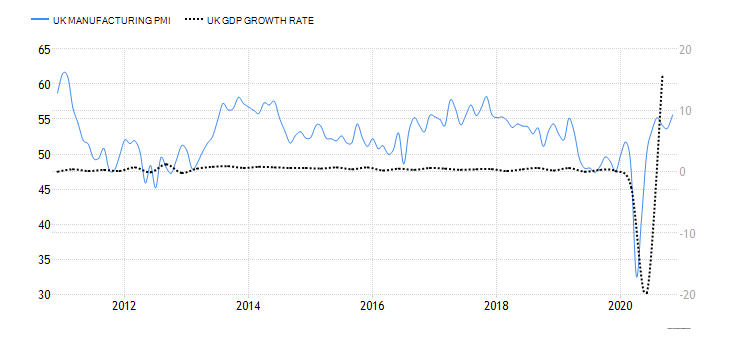
- Australia Manufacturing PMI
This PMI is from a survey of companies operating in the industrial sector. The index shows whether the manufacturing sector in Australia is expanding or contracting. In Australia, the Ai Group surveys the changes in new orders, employment, inventory, output prices, and production levels. When the index is above 50, it means that the manufacturing sector is expanding and contracting when it’s below 50.
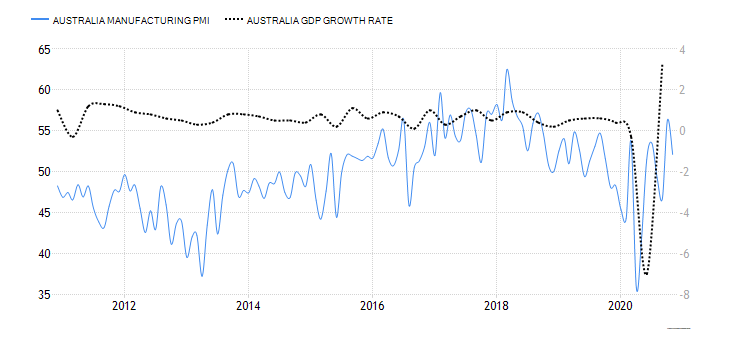
In November 2020, the AIG Australian manufacturing PMI dropped to 52.1 from 56.3 in October. Despite the drop, the Australian manufacturing PMI points to growth in the industrial sector. Hence, we assign a score of 6.
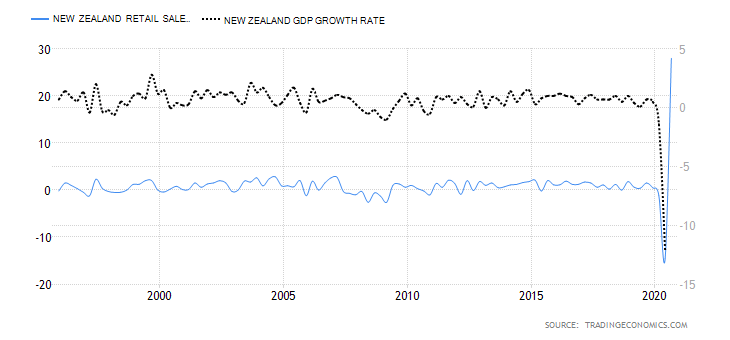
- Australia Retail Sales
The retail sales data in Australia tracks the monthly change of the consumer expenditure on goods and services. Consumer goods include items of clothing and footwear, food, and household items. Purchases made in restaurants, departmental stores, and hotel services and deliveries are also included as retail sales.
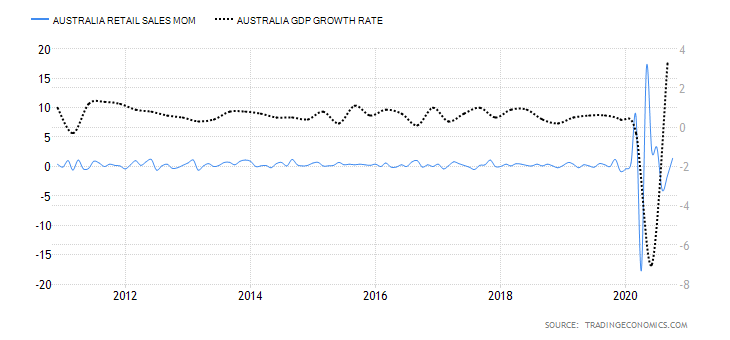
In October 2020, the MoM retail sales increased by 1.4% from a 1.1% drop in September. In 2020, the average MoM retail sales have grown by 0.97%. We assign a score of 2.
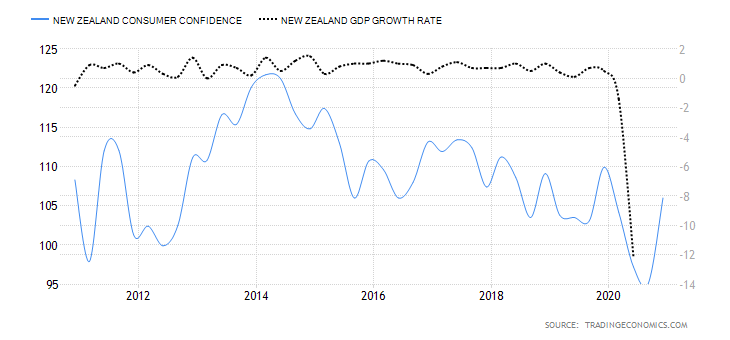
- Australia Consumer Confidence
The Melbourne Institute and Westpac Bank survey about 1200 households in Australia and constructs the consumer confidence index. The index is based on households’ evaluation of their financial condition for the preceding year and in the next 12 months. It also includes their economic expectations in the next one and five years. When the index is above 100, it shows that households are optimistic and pessimistic if the index is below 100. Note that consumer confidence about their finances and the economy determines their level of expenditure; hence, it drives the rate of GDP growth.
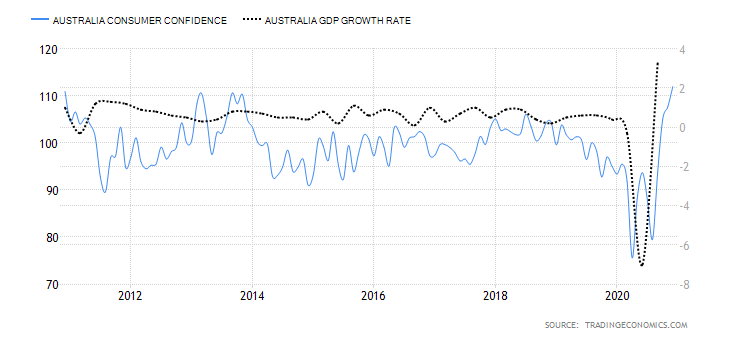
In December 2020, consumer confidence in Australia rose to 112 from 107.7 in November, which is the highest in over ten years. We assign a score of 5.
- Australia Government Debt to GDP
The government debt to GDP determines the ability of the economy to service its debts. It also impacts the ability of the government to take on more debt to advance an economic agenda. A debt level of below 60% of the GDP is preferable since it ensures that the government can take on more debt without over-leveraging the economy.
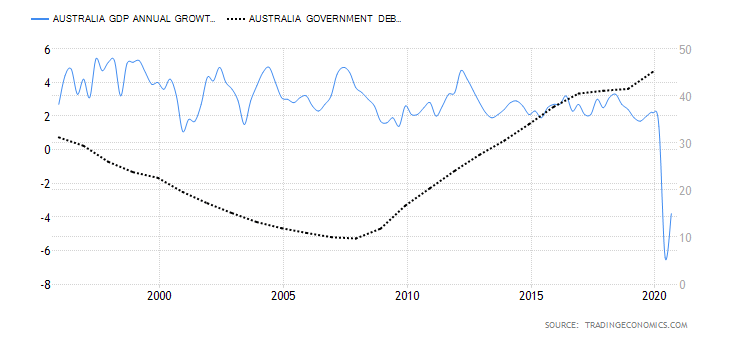
In 2019, the Australian government debt to GDP rose to 45.1% from 41.5% in 2018. In 2020, it is expected to reach 50% on account of increased government expenditure during the coronavirus pandemic. We assign a score of -3.
Please check our following article where we discuss the Exogenous analysis of the EUR/AUD Forex pair. Cheers.