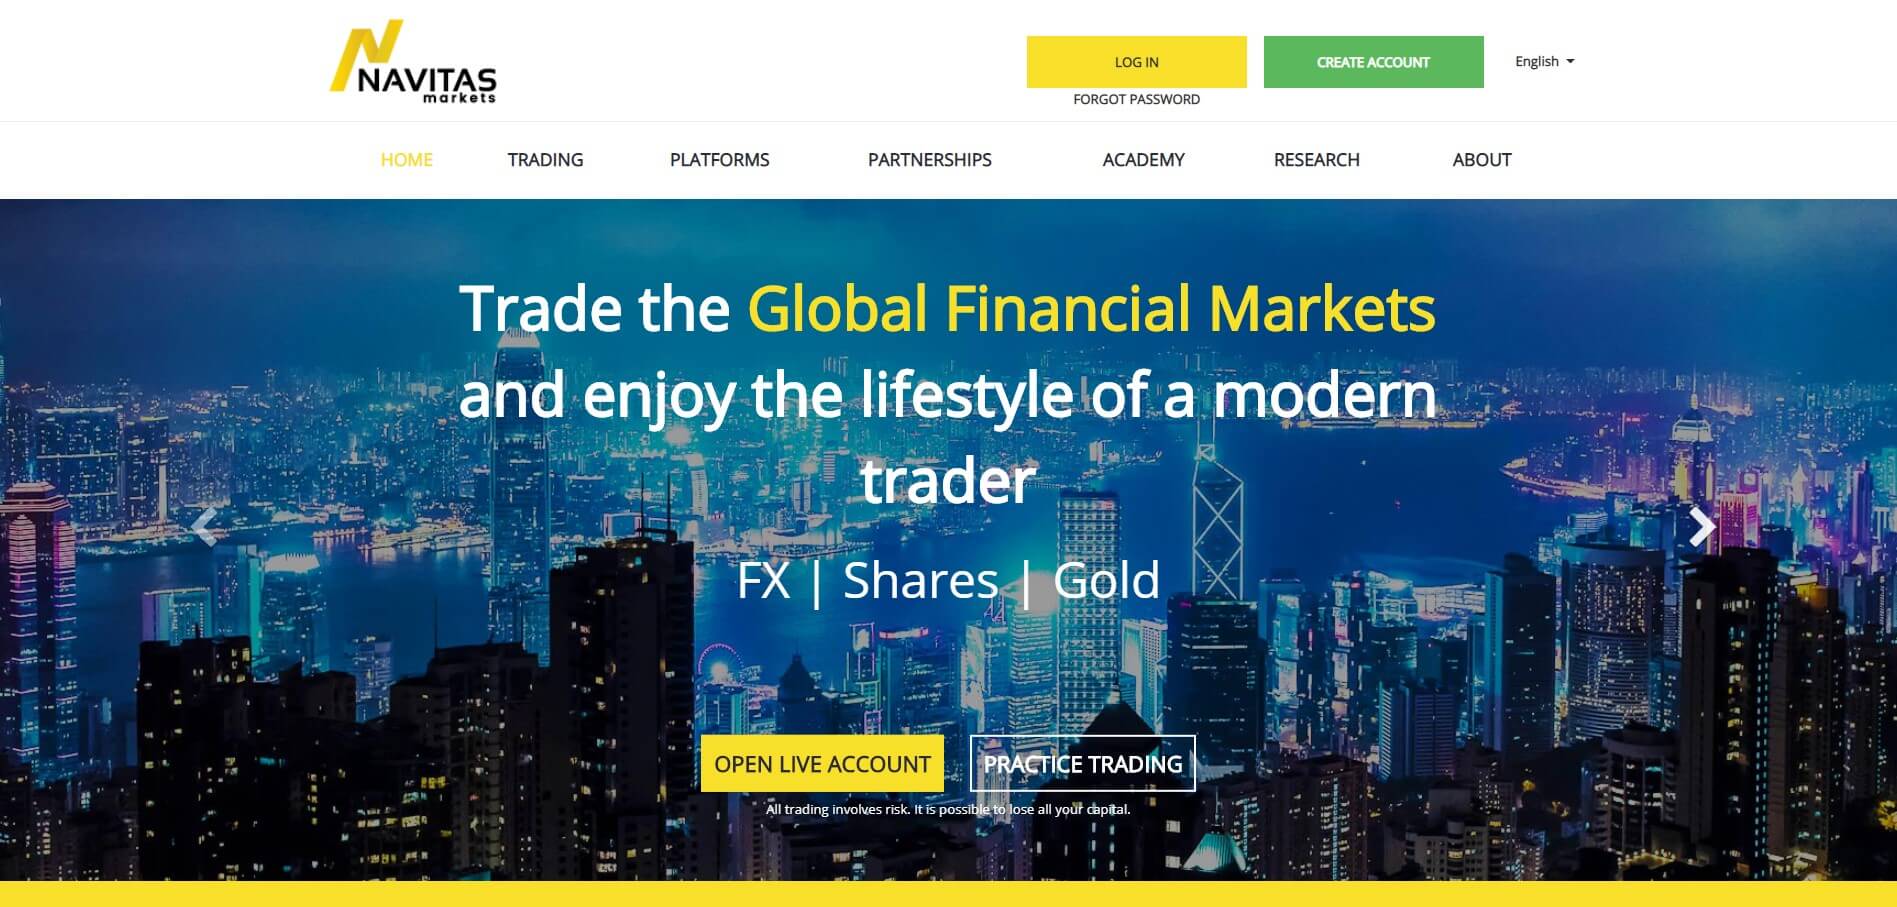
Navitas is a foreign exchange broker based in Bermuda. They are a broker that likes to think of themselves as active and ready to innovate. Their mission involves providing traders and investors with the best trading environment, giving their employees the best working conditions, and to generate value with a difference and to inspire a moment of optimism and happiness. We will be delving deep into the site to see exactly what is on offer, so you can then decide if they re the right broker for you.
Account Types
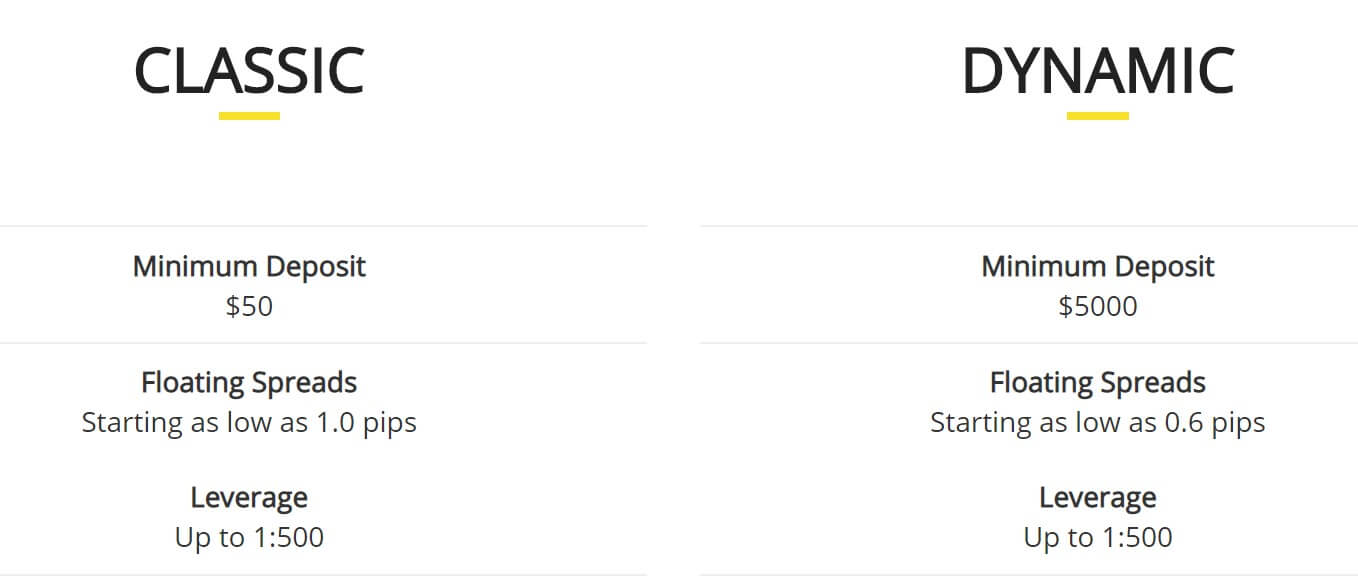
There are just two different accounts to choose from when signing up with Navitas Markets, so let’s look at what they offer.
Classic Account:
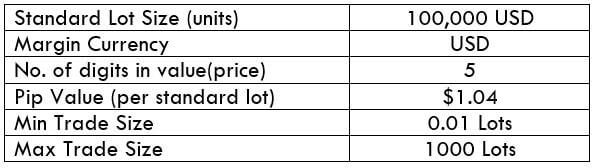
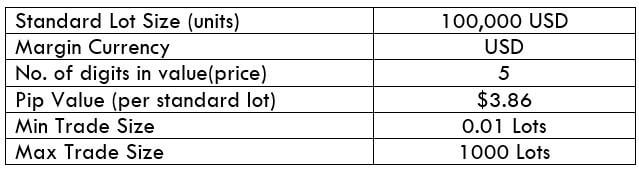
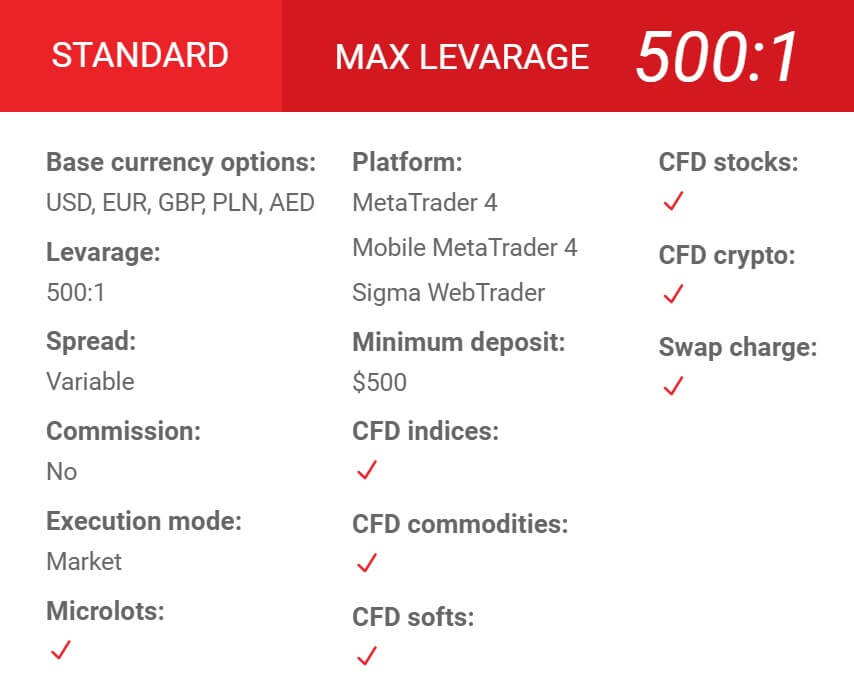
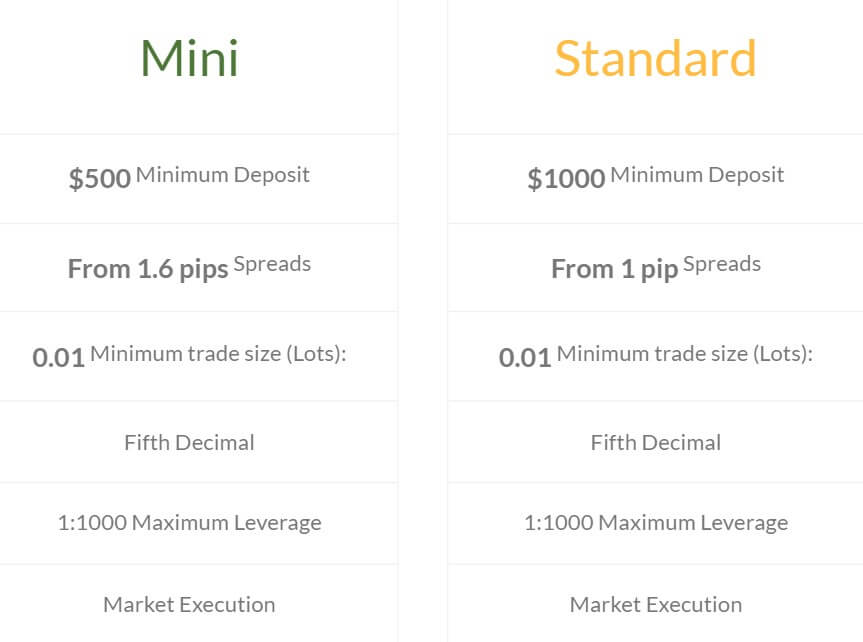
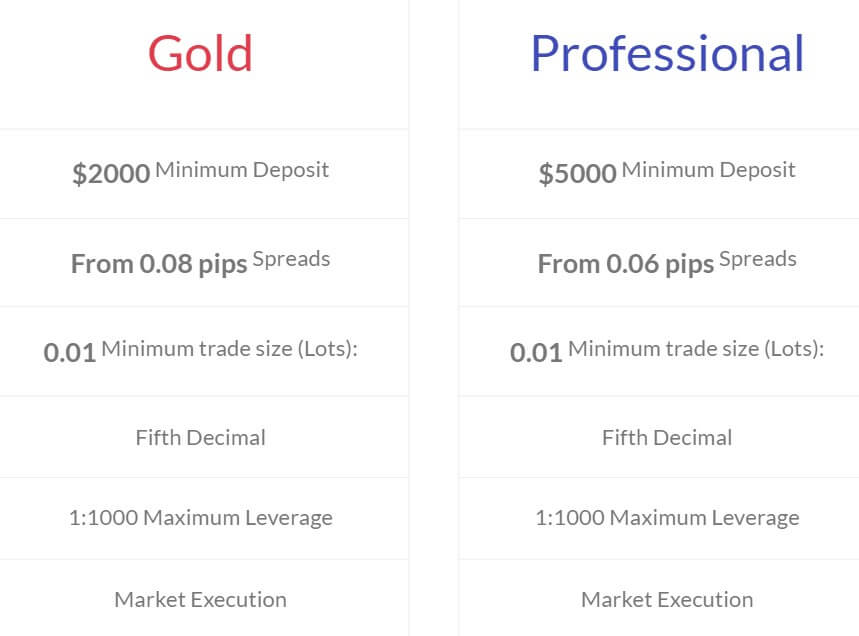
This account requires a deposit of at least $50 and must be in USD, it comes with floating spreads starting from 1 pip and can be leveraged up to 1:500. The minimum trade size is 0.01 lots and the account has access to forex, metals, commodities, and indices. It uses the MetaTrader 4 trading platform and has no added commissions on forex pairs. A margin call is set at 60% with the stop out level set at 40%. Swap-free accounts are also available and the account has negative balance protection.
Dynamic Account:
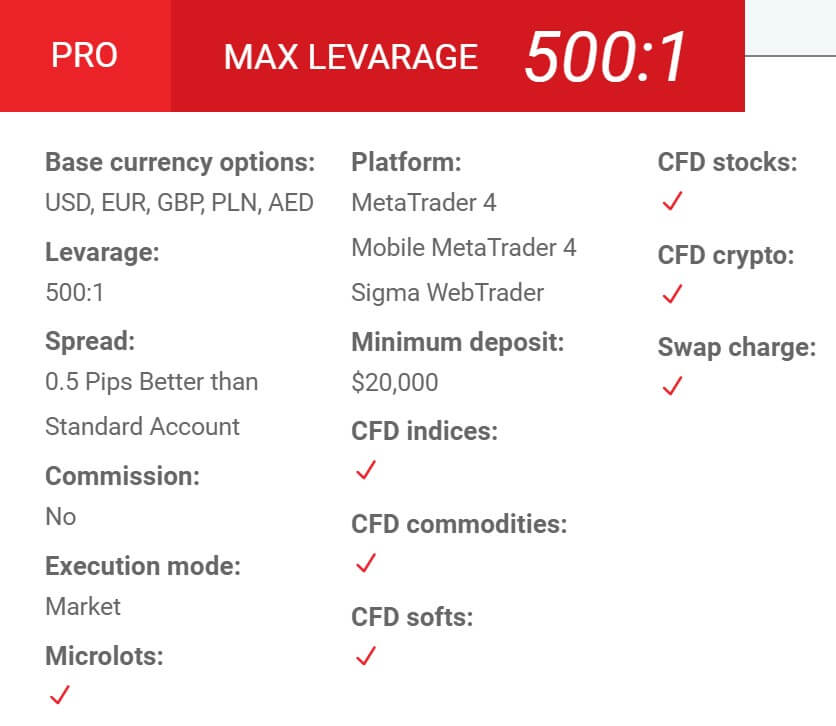
This account requires a deposit of at least $5,000 and must be in USD, it comes with floating spreads starting from 0.6 pip and can be leveraged up to 1:500. The minimum trade size is 0.01 lots and the account has access to forex, metals, commodities, and indices. It uses the MetaTrader 4 trading platform and has no added commissions when trading forex pairs. A margin call is set at 60% with the stop out level set at 40%. Swap-free accounts are also available and the account has negative balance protection.
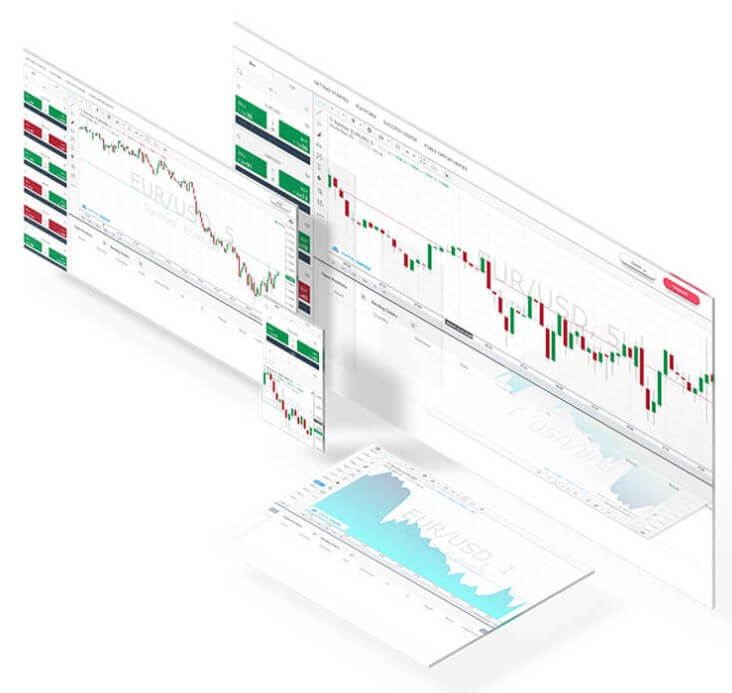
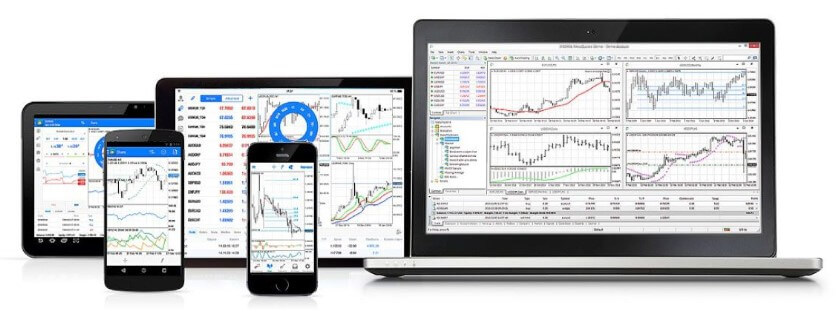
Platforms
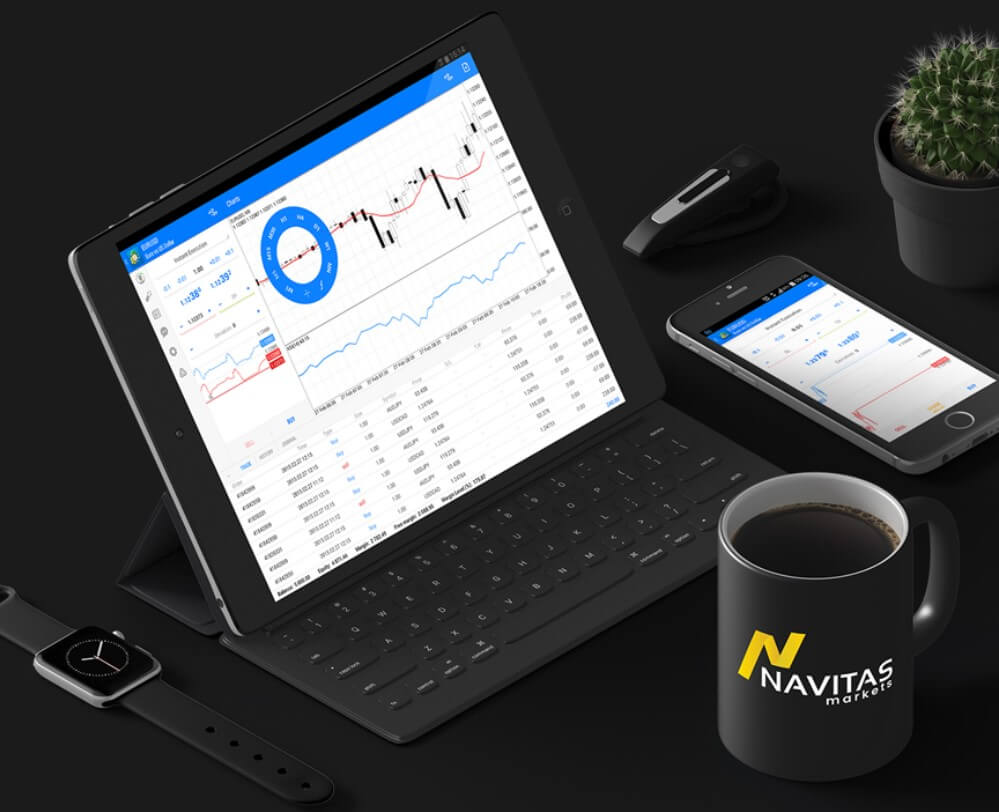
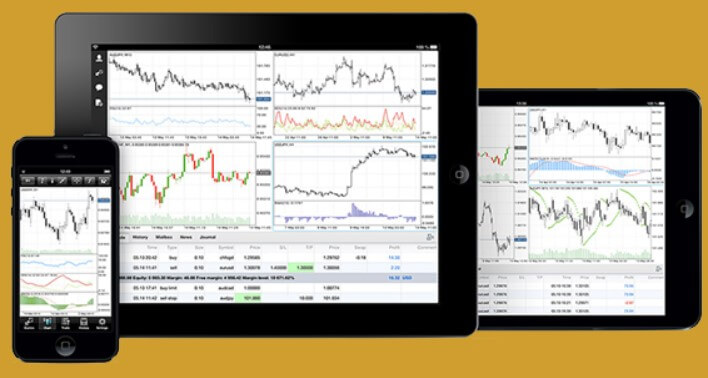
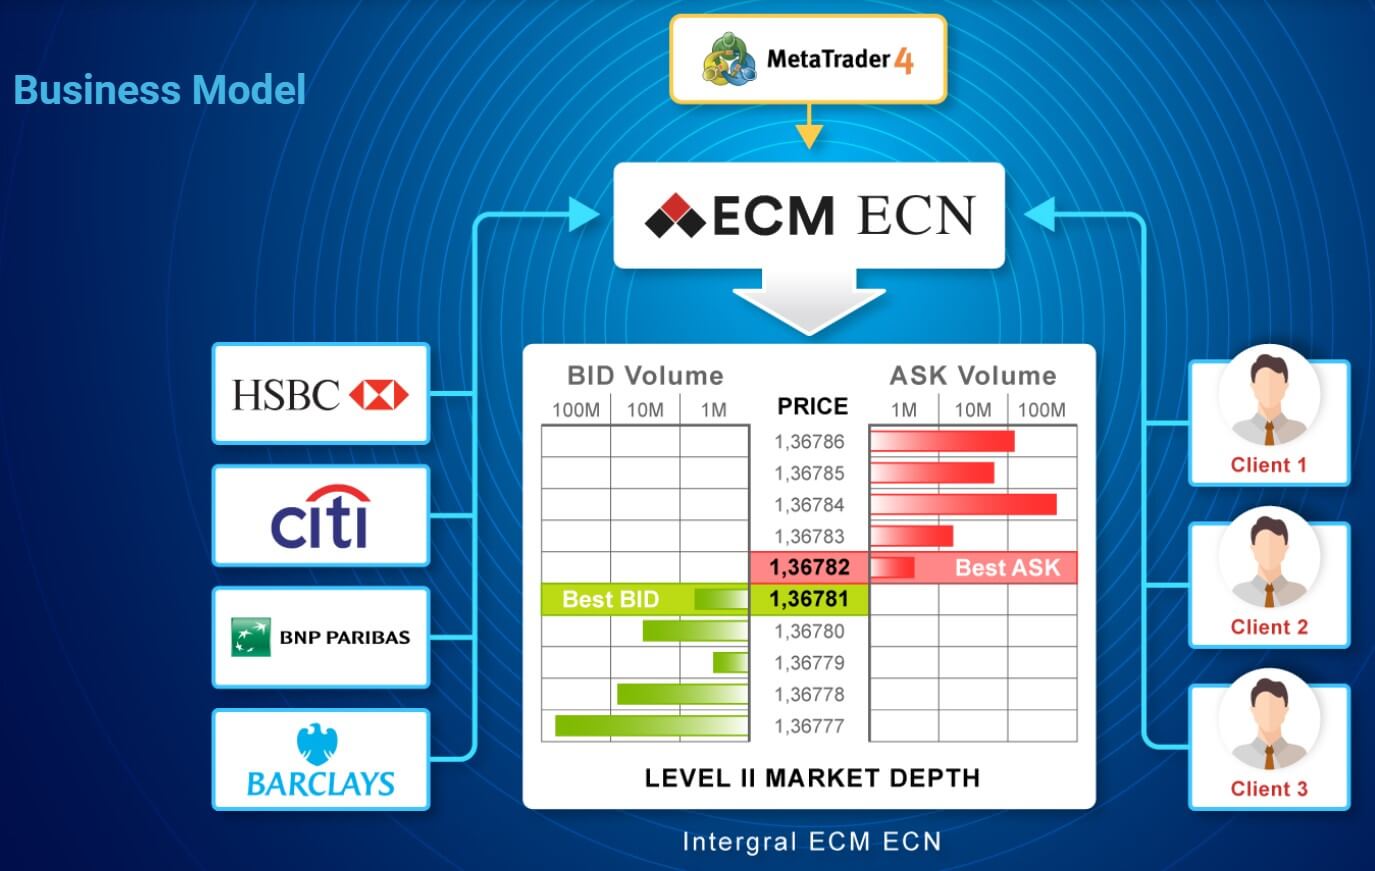
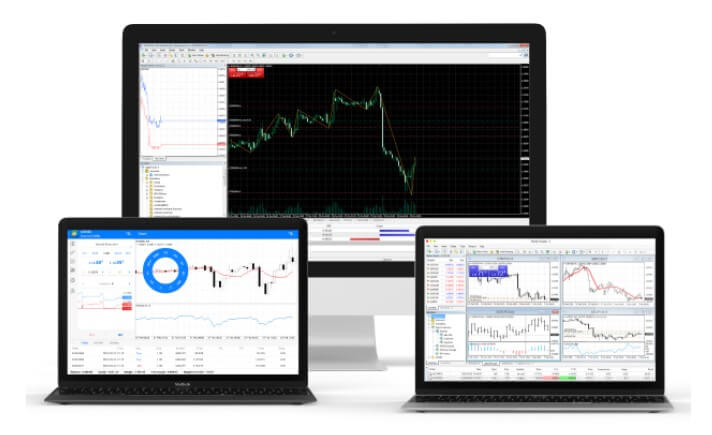
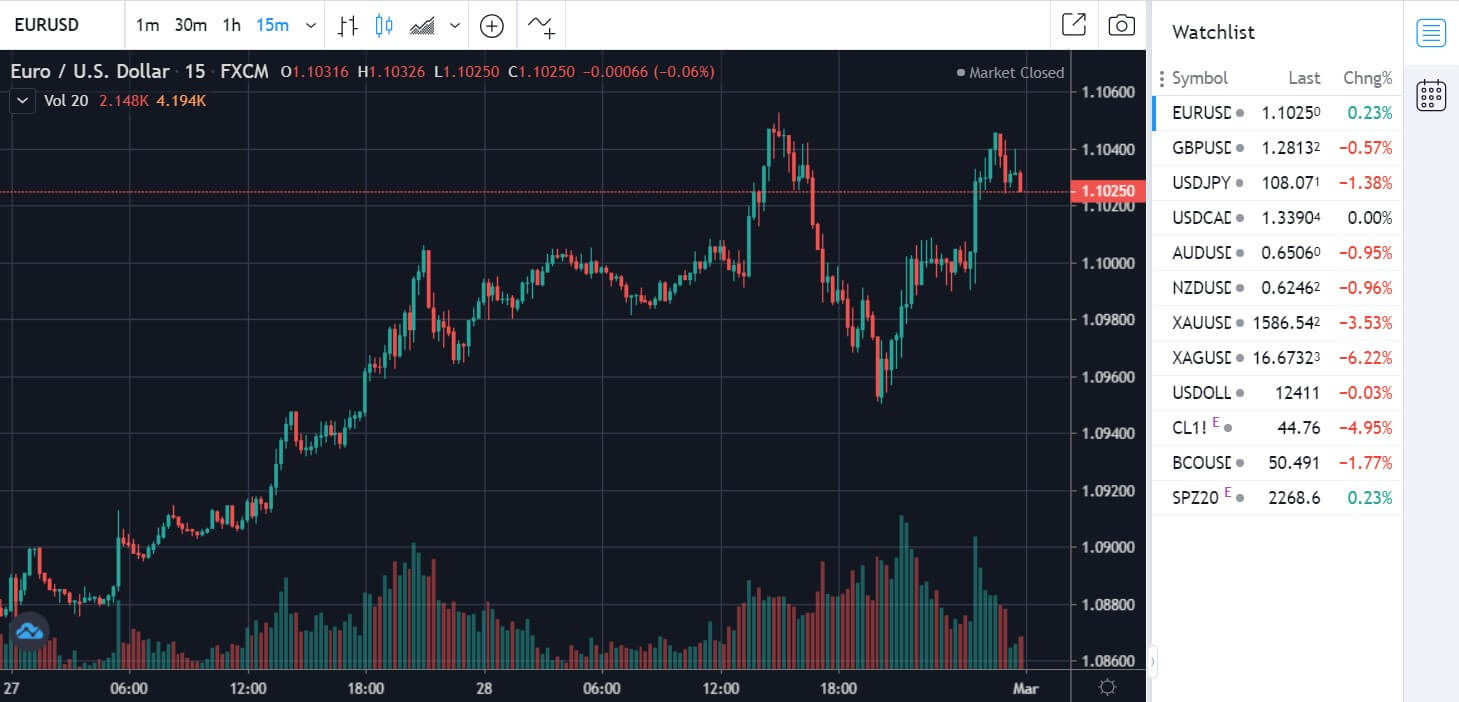
The only platform on offer from Navitas Markets is MT4. MT4 is an all-in-one trading platform with a user-friendly interface and easy to use functionalities allowing traders to analyze the markets, place orders and manage their own risk all with a single click. Traders can also manage several trading accounts simultaneously, not to mention its cutting edge technology which includes a web-based solution enabling traders to trade at any time from any device and from anywhere in the world.
Leverage
Both accounts can be leveraged up to 1:500 and this can be selected when opening up an account. You can request for it to be changed on an already open account by contacting the customer service team.
Trade Sizes
Trade sizes on both accounts start from 0.01 lots (known as a micro lot) and go up in increments of 0.01 lot so the next trade would be 0.02 lots and then 0.03 lots. We do not know what the maximum trade size is or how many trades you can have open at any one time.
Trading Costs
There are no added commissions on either of the accounts as they use a spread based payment structure. There are swap fees that are charged for holding fees overnight, swap-free versions of each account are also available.
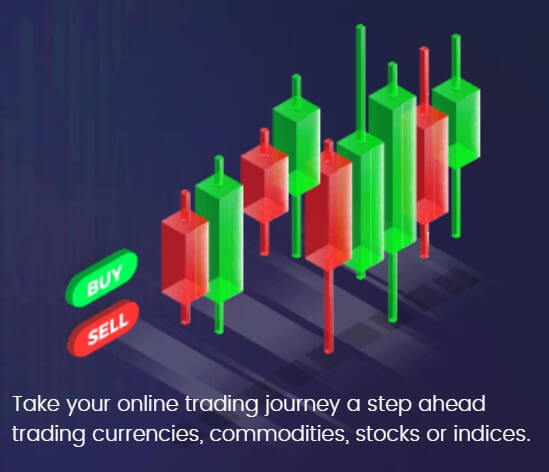
Assets
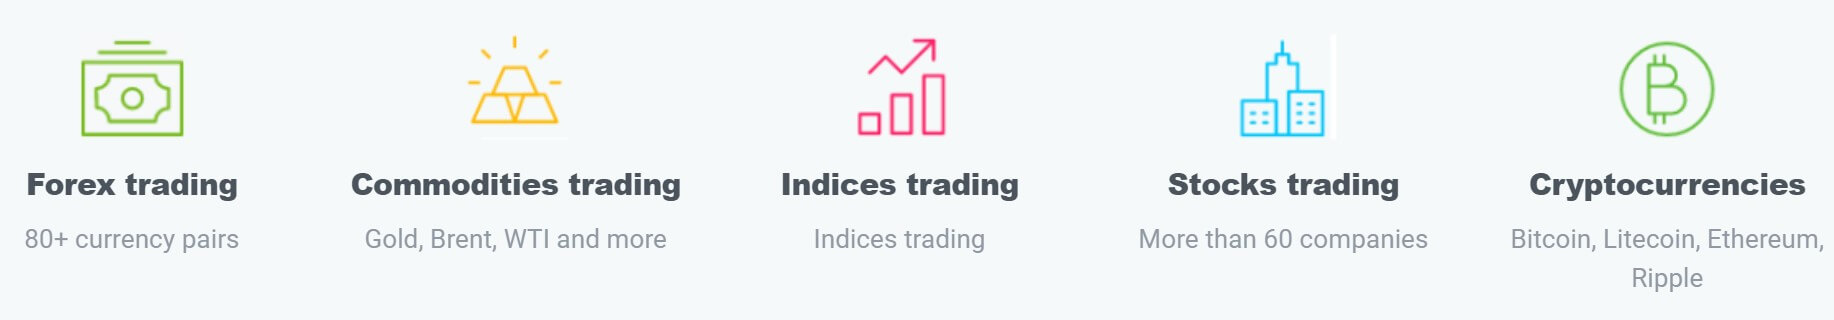
The instruments and assets at Navitas Market shave been broken down into a number of different categories. We have outlined them for you below.
Forex:
AUDCAD, AUDCHF, AUDJPY, AUDHUF, AUDZND, AUDUSD, CADJPY, CADNOK, CADSEK, CHFJPY, CHFHUF, CHFSGD, EURUAD, EURCAD, EURCHF, EURCNH, EURCZK, EURGBP, EURHUF, EURJPY, EURNZD, EURPLN, EURRUB, EURTRY, EURUSD, GBPAUD, GBPCAD, GBPCHF, GBPJPY, GBPHUF, GBPTRY, GBPUSD, NZDCAD, NZDCHF, NZDHUF, NZDJPY, NZDUSD, SGDJPY, TRYJPY, USDCHF, USDCNH, USDCZK, USDHUF, USDJPY, USDMXN, USDNOK, USDPLN, USDCAD, USDRUB, USDSEK, USDSGD, USDTRY, ZARJPY.
Metals:
Gold and Silver.
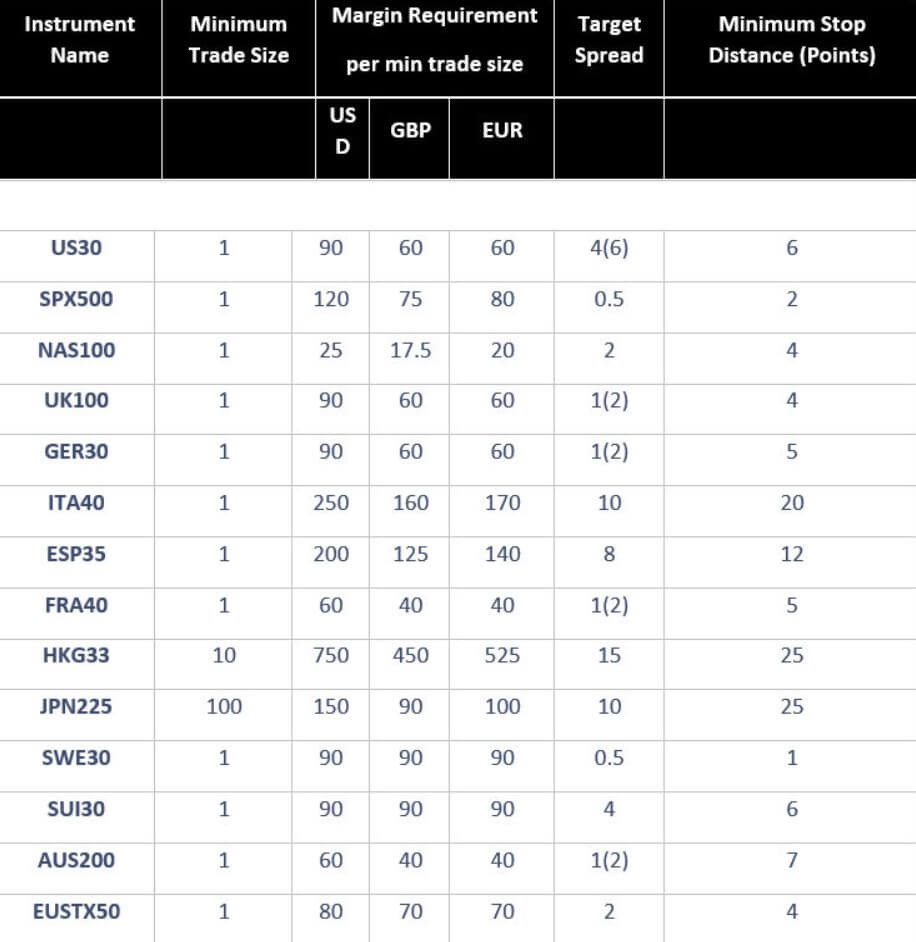
Indices:
EU50, JPY225, US30, FRA40, AUS200, GER30, NETH25, Spain35, UK100, US100, US500, SWE30, Swiss20,, HK50, UK250, Italy40.
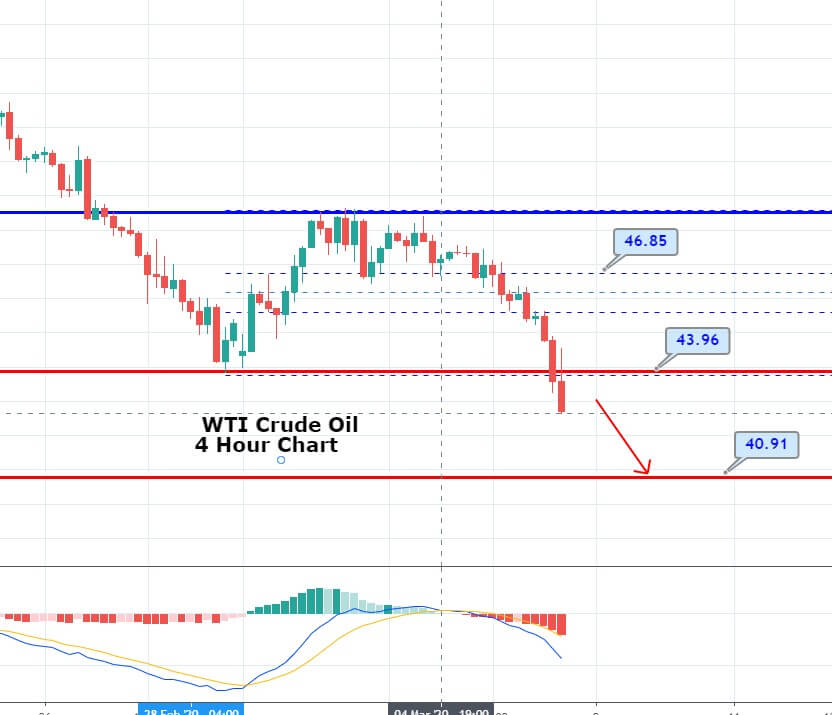
Commodities:
WTI Crude Oil, Brent Crude Oil, and Natural Gas
Shares:
There are plenty of shares available including Amazon, American Express, McDonald’s, Apple, General Motors, and Tesla Motors.
Spreads
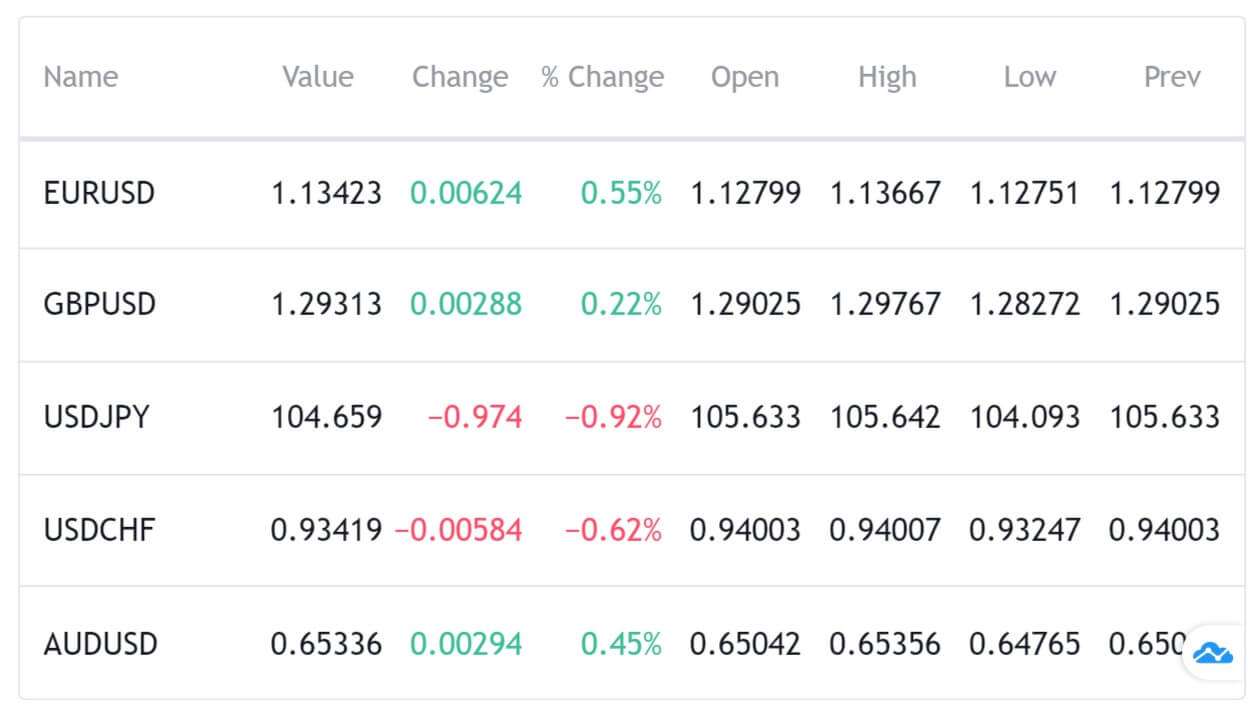
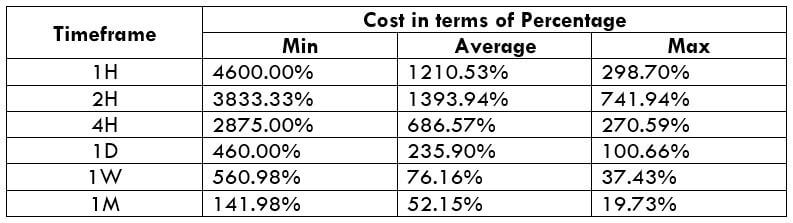
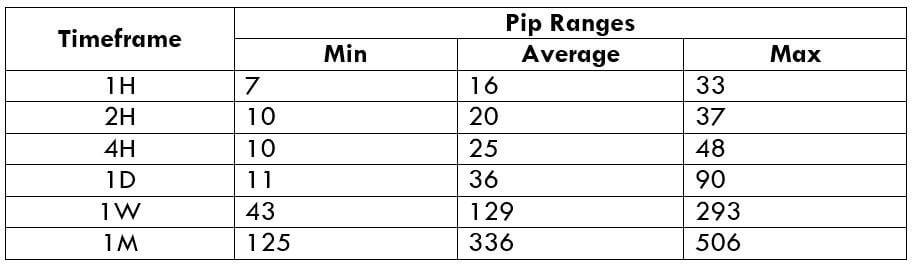
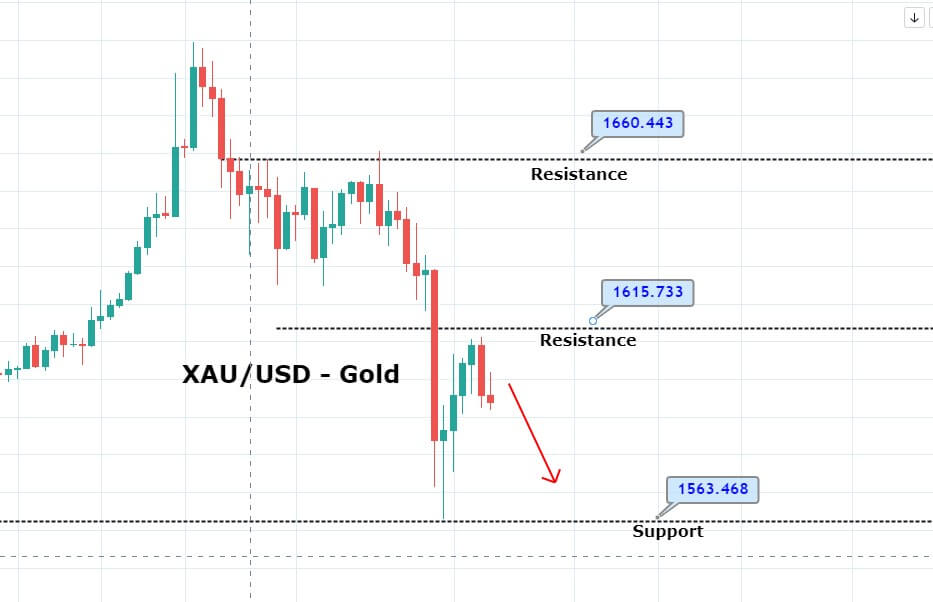
The spreads that you get vary slightly depending on the account. The Classic account has spreads starting from around 1 pip while the Dynamic account has spreads starting from around 0.6 pips. The spreads are variable which means they move with the markets, the more volatility in the markets the higher the spreads will be, different instruments and assets will also have different starting spreads.
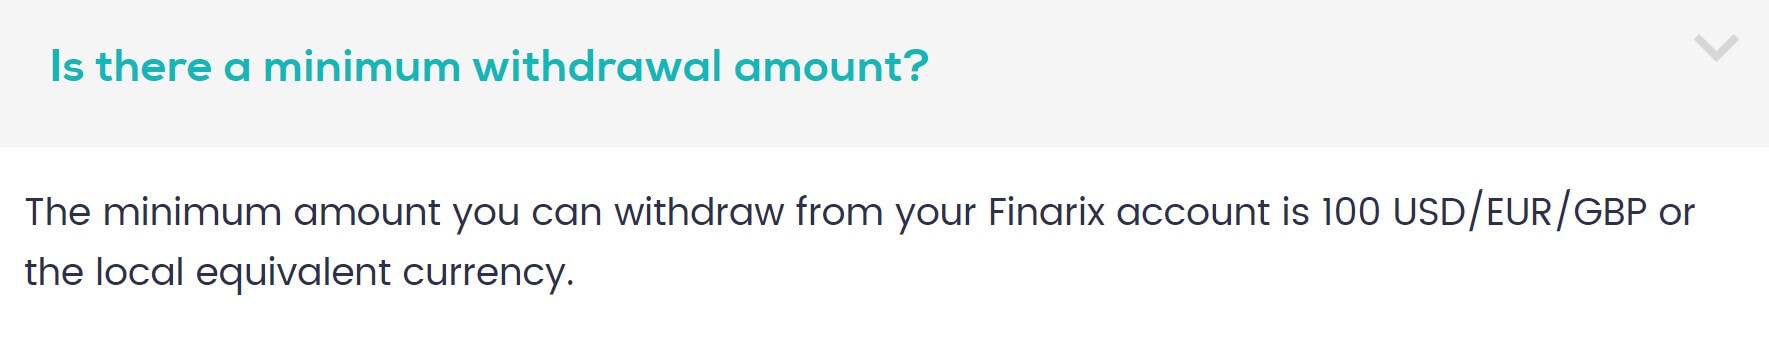
Minimum Deposit
The minimum deposit required is $50 which gets you the Classic account. If you want the Dynamic account you will need to deposit at least $5,000.
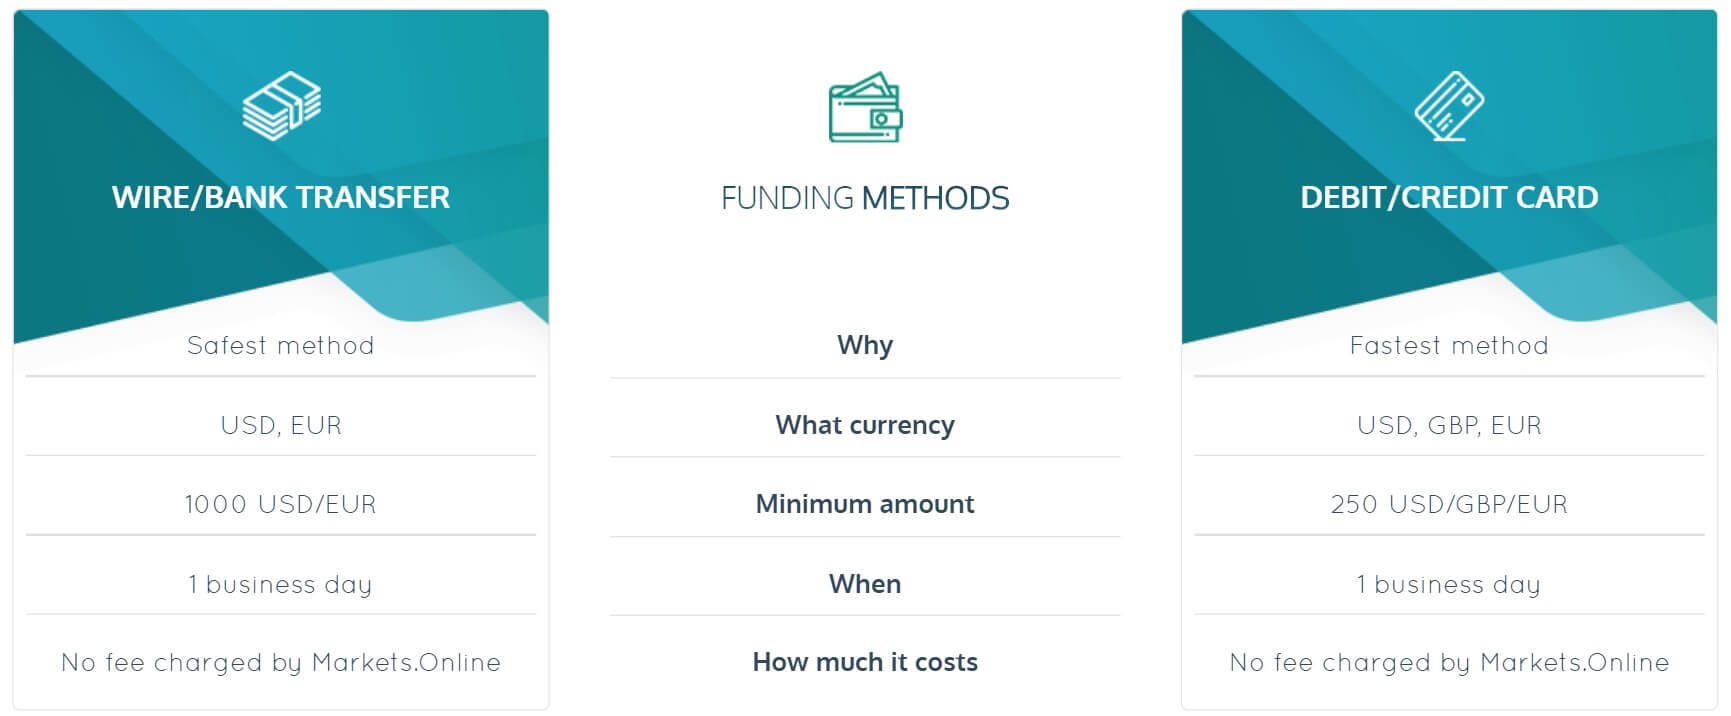
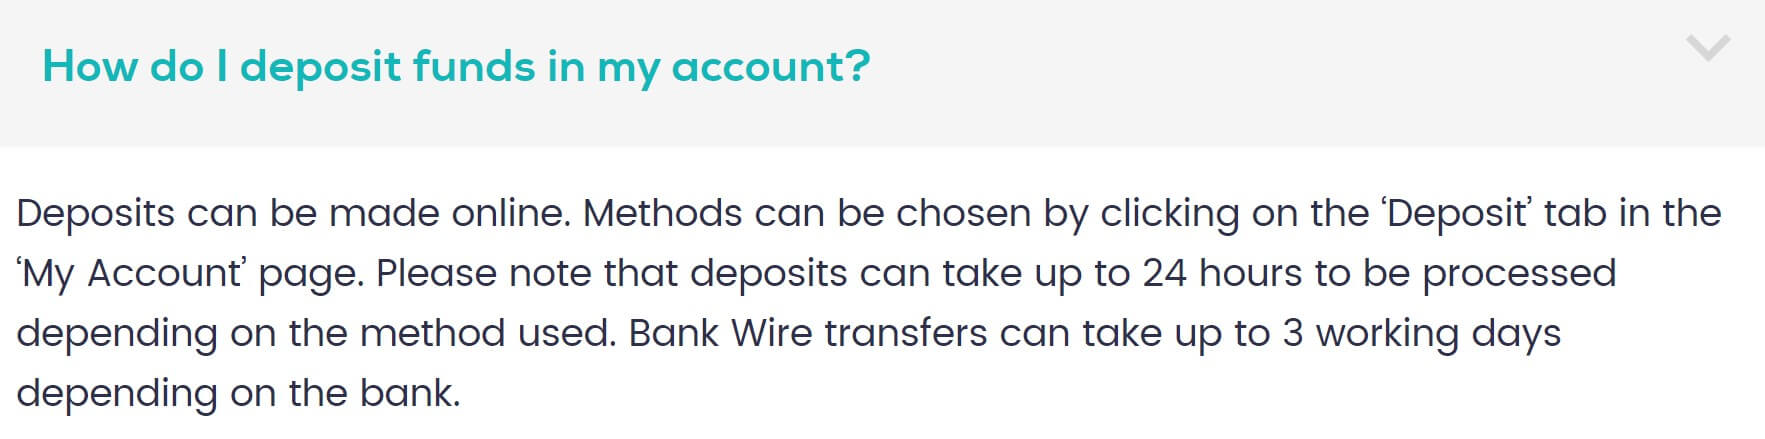
Deposit Methods & Costs
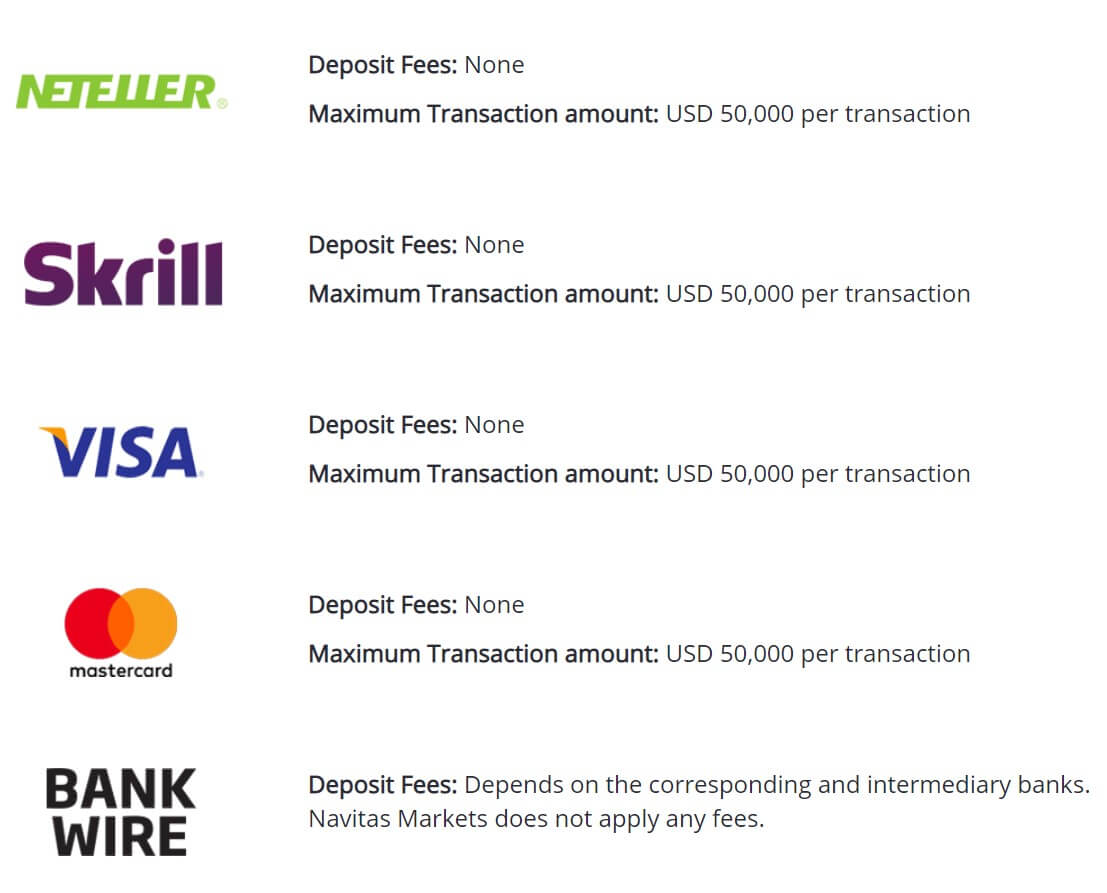
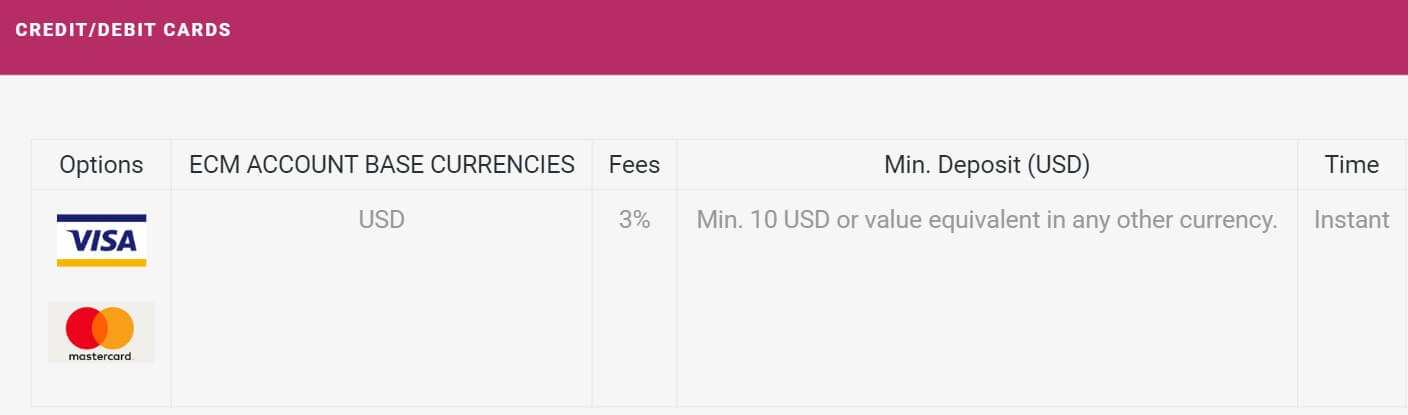
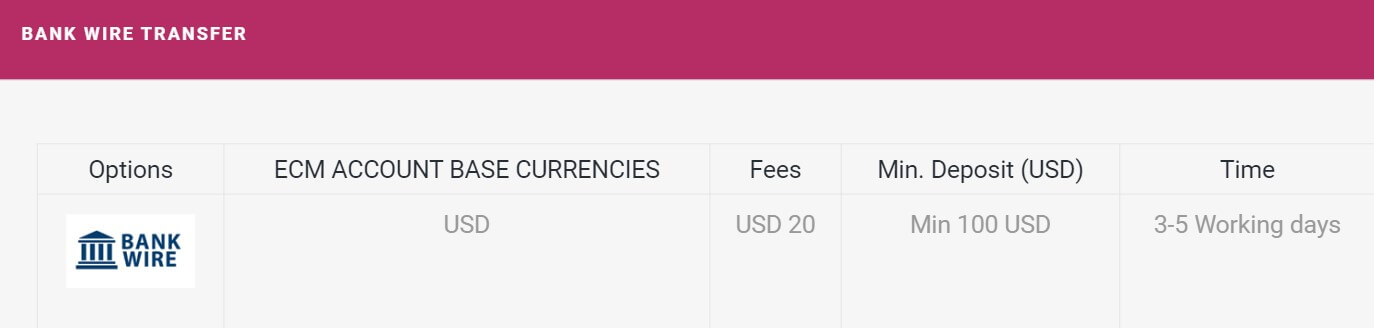
There are a number of different ways to deposit which include Neteller, Skrill, Visa, MasterCard, Bank Wire, fasapay and UnionPay. There are no added fees when depositing, however, be sure to check with your own bank or processor to see if they will charge any fees of their own.
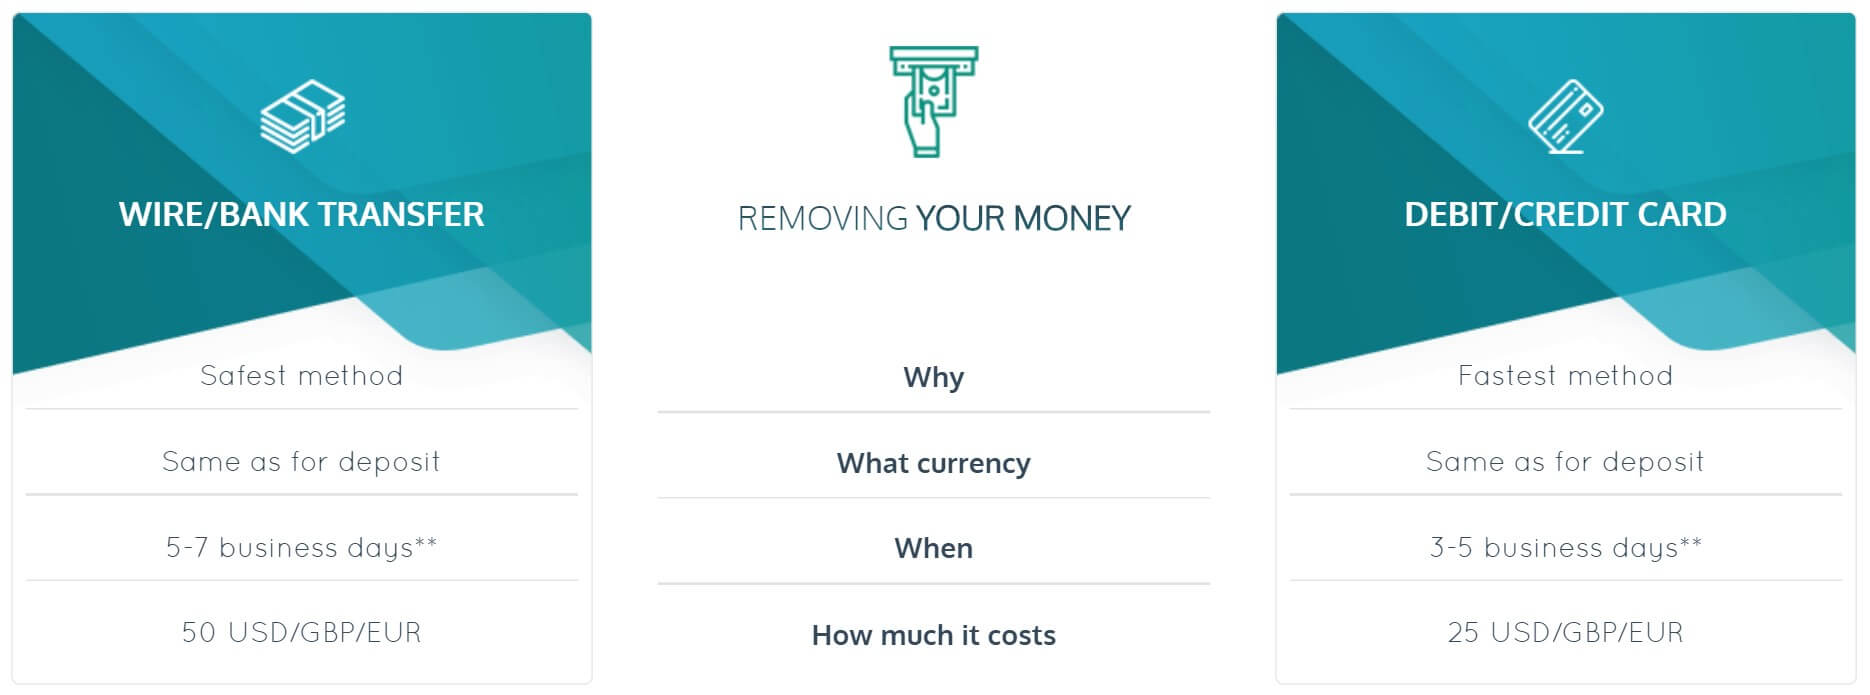
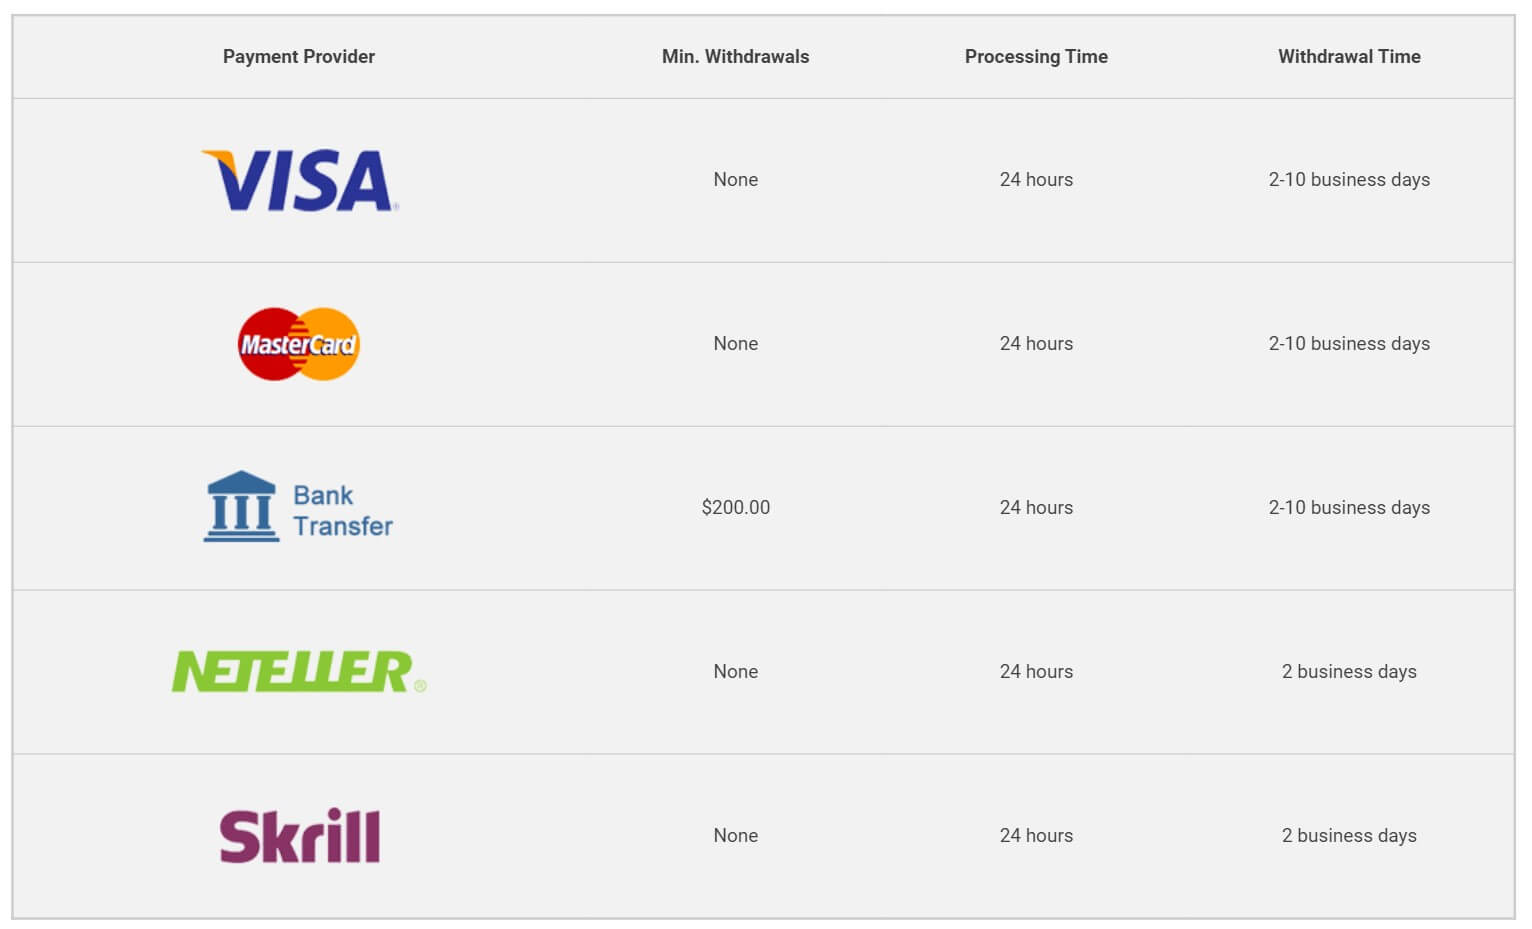
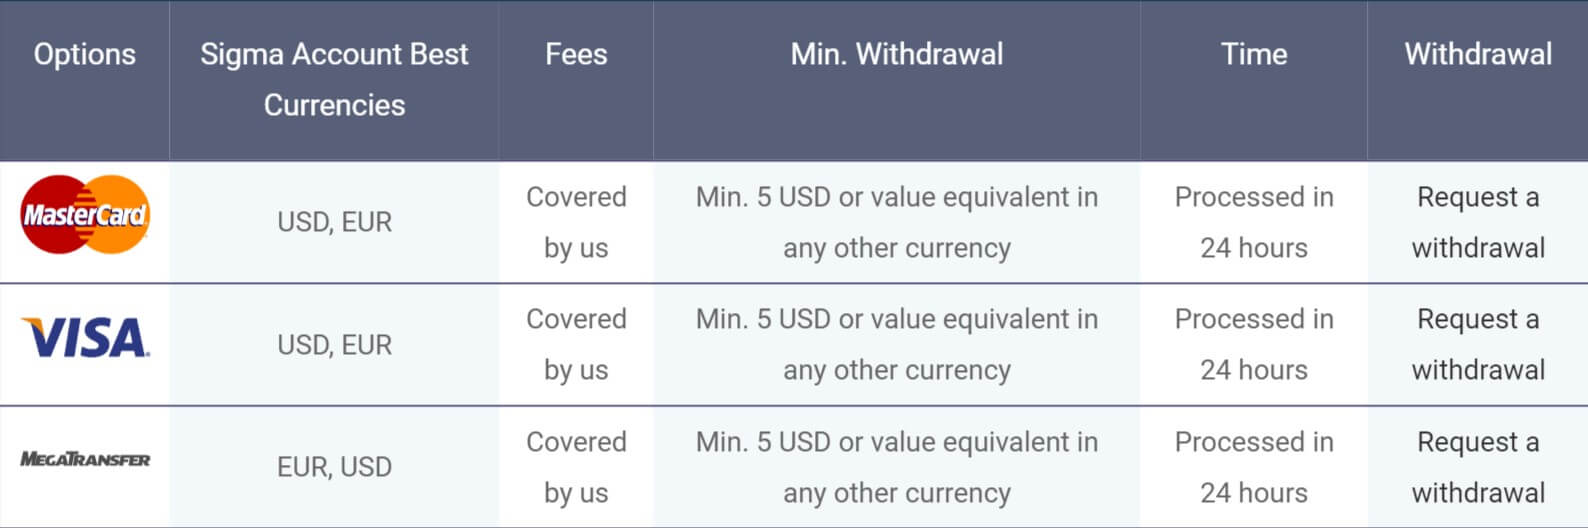
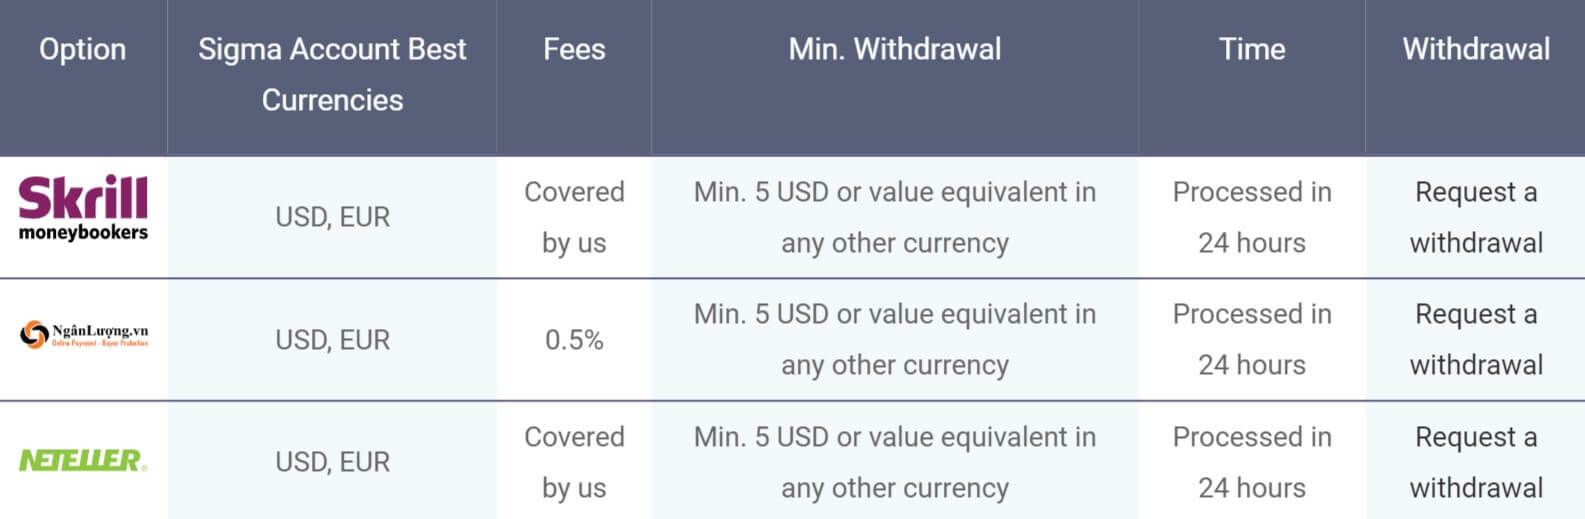
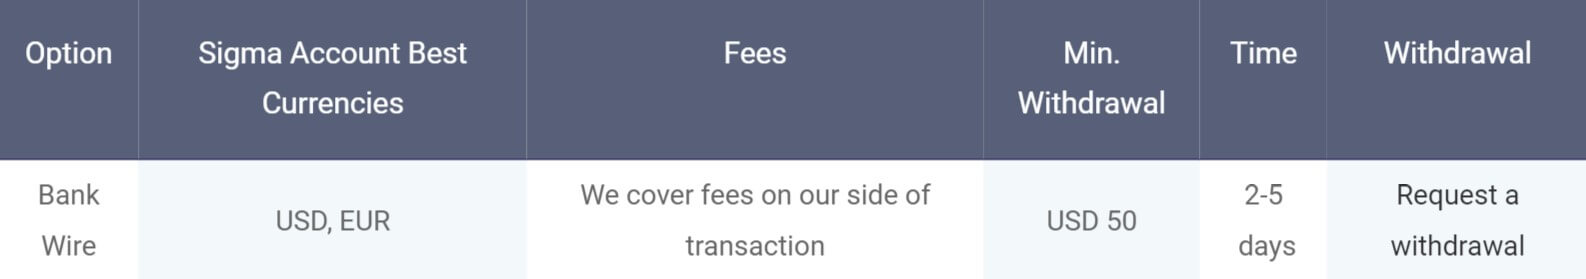
Withdrawal Methods & Costs
The same methods are available for withdrawal, but there are no added fees. We have outlined them below.
- Neteller: 2% capped to USD 30.00 / minimum USD 1.00 per transaction
- Skrill: 1% capped to USD 10,000
- Visa: up to EUR 1.5 per transaction
- MasterCard: up to EUR 1.5 per transaction
- Bank Wire: It depends on the corresponding and intermediary banks.
- FasaPay: 0.5% per transaction (max approx. $5)
- UnionPay: 1.2% per transaction (max approx. $5)
Withdrawal Processing & Wait Time
Withdrawal requests should be fully processed between 1 to 5 days from the date of the request depending on the method used.
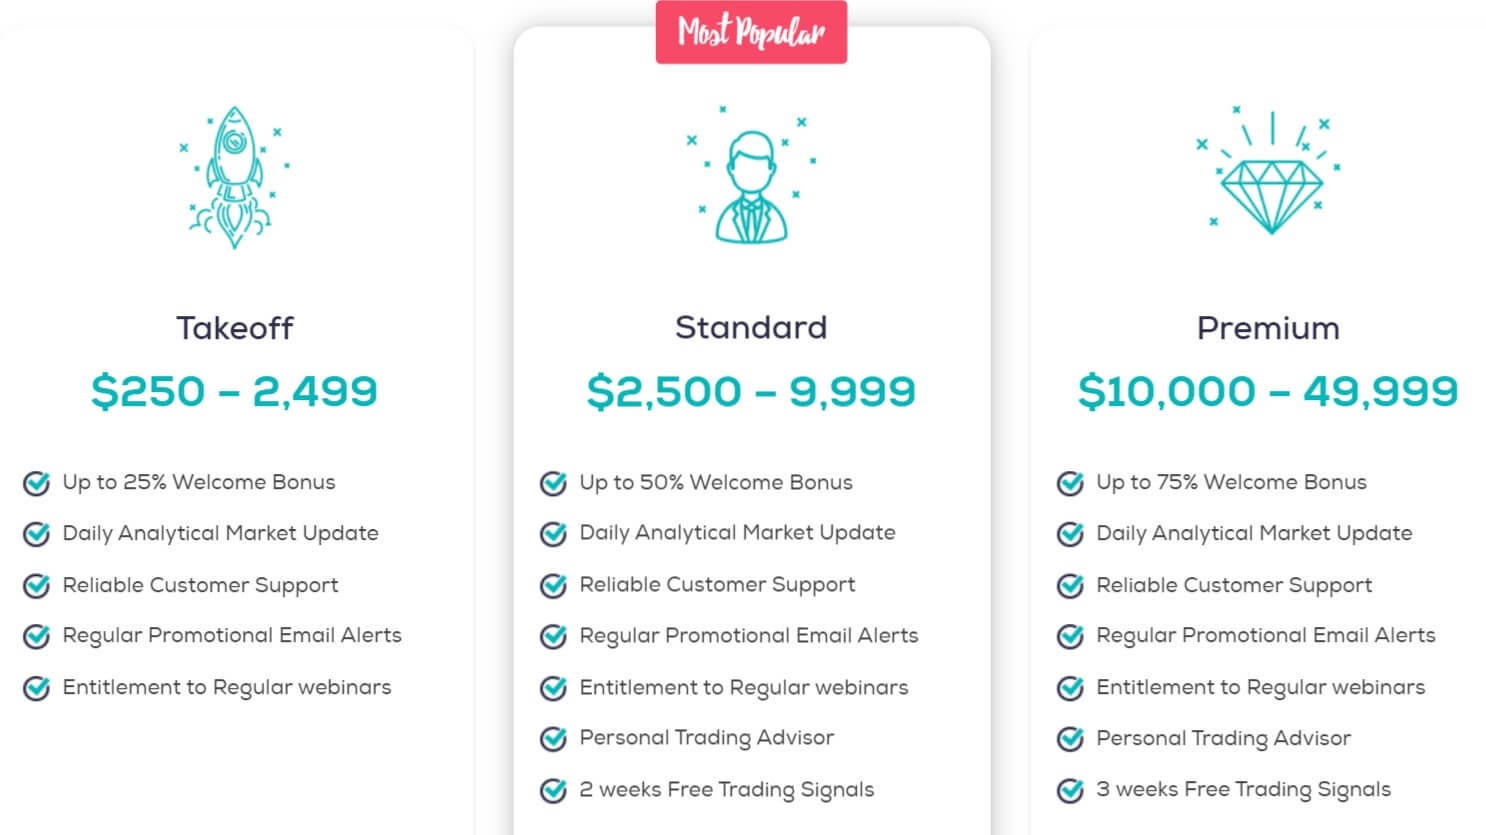
Bonuses & Promotions
There doesn’t seem to be any active promotions at the time of writing this review. However, that doesn’t mean there won’t be any, so be sure to check back regularly just in case any have come up.
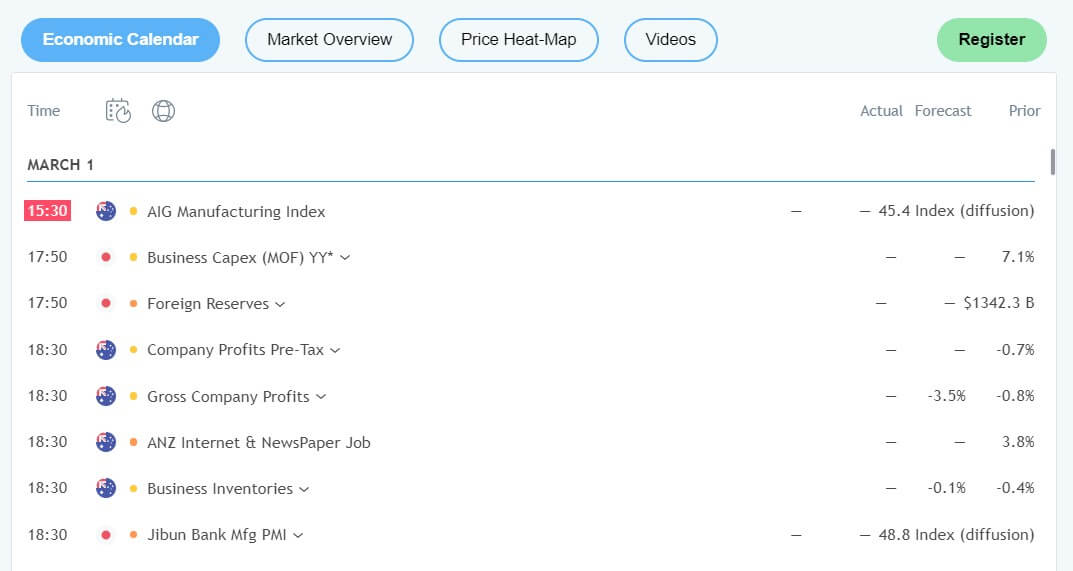
Educational & Trading Tools
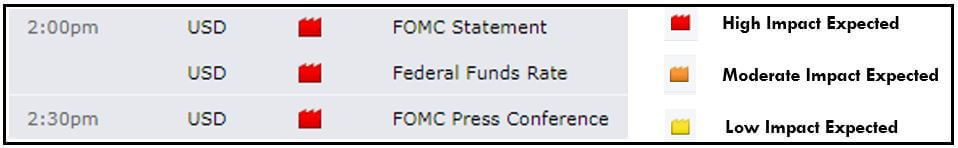
The educational and tools section of the site has a few different things available. The first is a set of articles looking at different things about trading such as what is forex or an introduction to fundamental analysis. There is an infographic that just shows what forex trading is, some seminars, and a glossary of different trading-related terms. There is also an economic calendar detailing different news events and the effects they could have. You can view the current exchange rates, heat map, market times, and trading-related news on the site too.

Customer Service
You can contact the customer service team using the email address provided or the telephone number.
Account Email: [email protected]
Partnership Email: [email protected]
Phone: +44 1216476059
Demo Account
Practice accounts are available from Navitas Markets. When signing up for a demo account you can select a demo floating account with USD base currency, a choice of leverage between 1:1 and 1:500 and a balance from between 500 to 5,000,000. The demo account allows you to test the markets and new strategies without risking any of your own capital.
Countries Accepted
The following statement is available on the site: “NavitasMarkets does not offer its services to residents of certain jurisdictions such as USA, Iran, Cuba, Sudan, Syria, and North Korea.”
Conclusion
The two accounts on offer are not a whole lot different from each other. The only changes in the trading conditions are slightly lower spreads, but with the Classic account starting from 1 pip it isn’t a huge deal (although we expect the spreads to be quite a bit higher in reality). Plenty of assets are available to trade with which is good. There are added fees for withdrawing but the majority of them are quite low. It would still be nice to see these removed. Overall, Navitas Markets seems to tick off most of the boxes and should meet the needs of the vast majority of Forex traders.


 The contact us page is what you would expect of a Forex broker. There is an online submission form as well as a postal address, email address and phone number to choose your method of contact from.
 There are plenty of options when it comes to accounts, but it is not fully clear what the differences between them are. Different bonus amounts, spreads, and commissions, all with no information on what any of them actually are. We have no idea what the trading costs are and even more worryingly, we have no idea how to deposit or withdraw and if it will cost us to do so. Not to mention the complete lack of information on available assets. With so much information missing, we cannot recommend Double Million as a broker to use at this point in time.
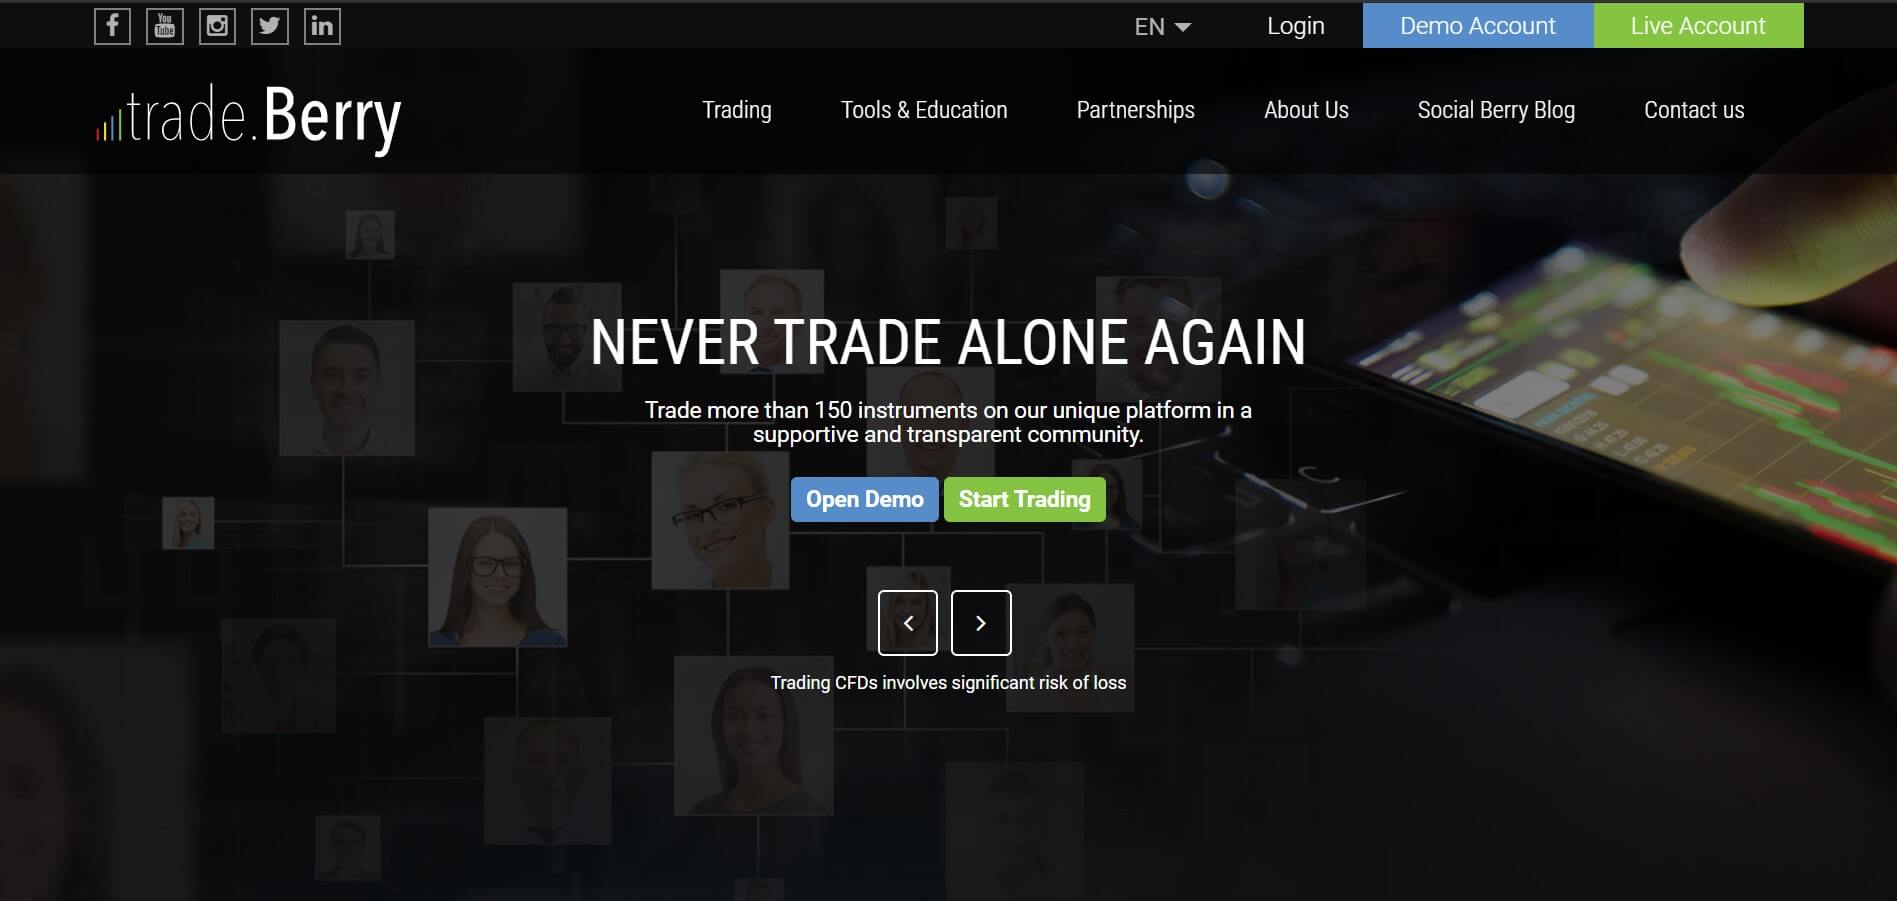
 TradeBerry uses its own trading platform that they have developed themselves. Trade.Berry’s vision is to host the most transparent social trading community ever created. That is why they joined forces with TOOMIT to create an ultra-fast platform offering the transparency they want for their community of traders. Features include execution in milliseconds,
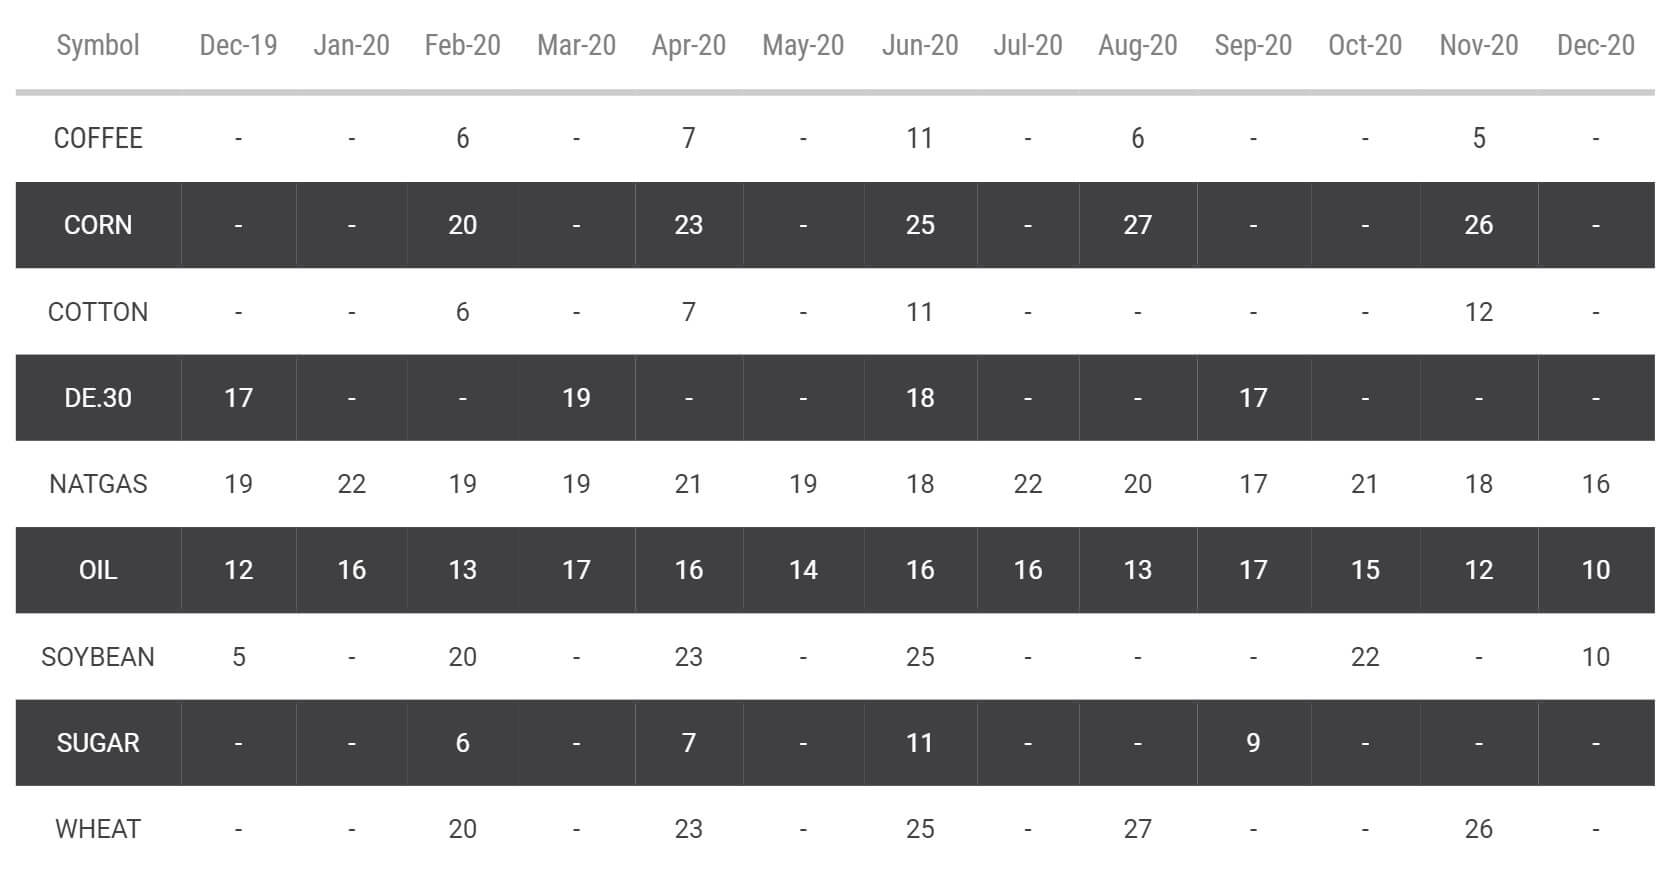
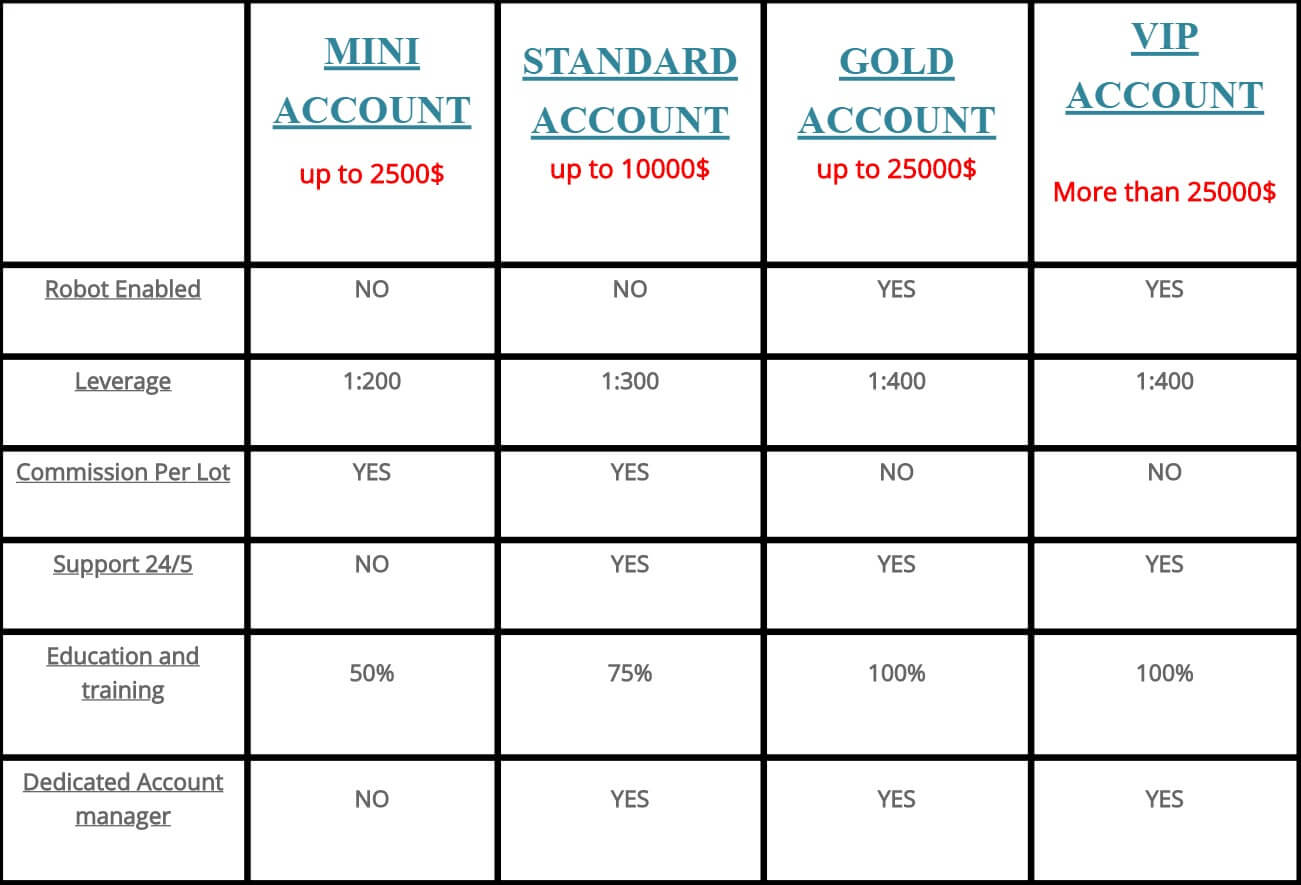
 Trade.Berry has broken down its assets into 5 different categories, each with different instruments within them. They haven’t broken down their assets into each one so we will just give a little overview.
 There are a few examples of spreads available on the site. There is also a little confusion, on the accounts page it states that all the account shave fixed spreads. However, when looking at the product specification, they all say variable, so we are not sure which one it is. EUR/USD seems to have a spread of 1.2 pips, other instruments will naturally have a different spread and if we look at
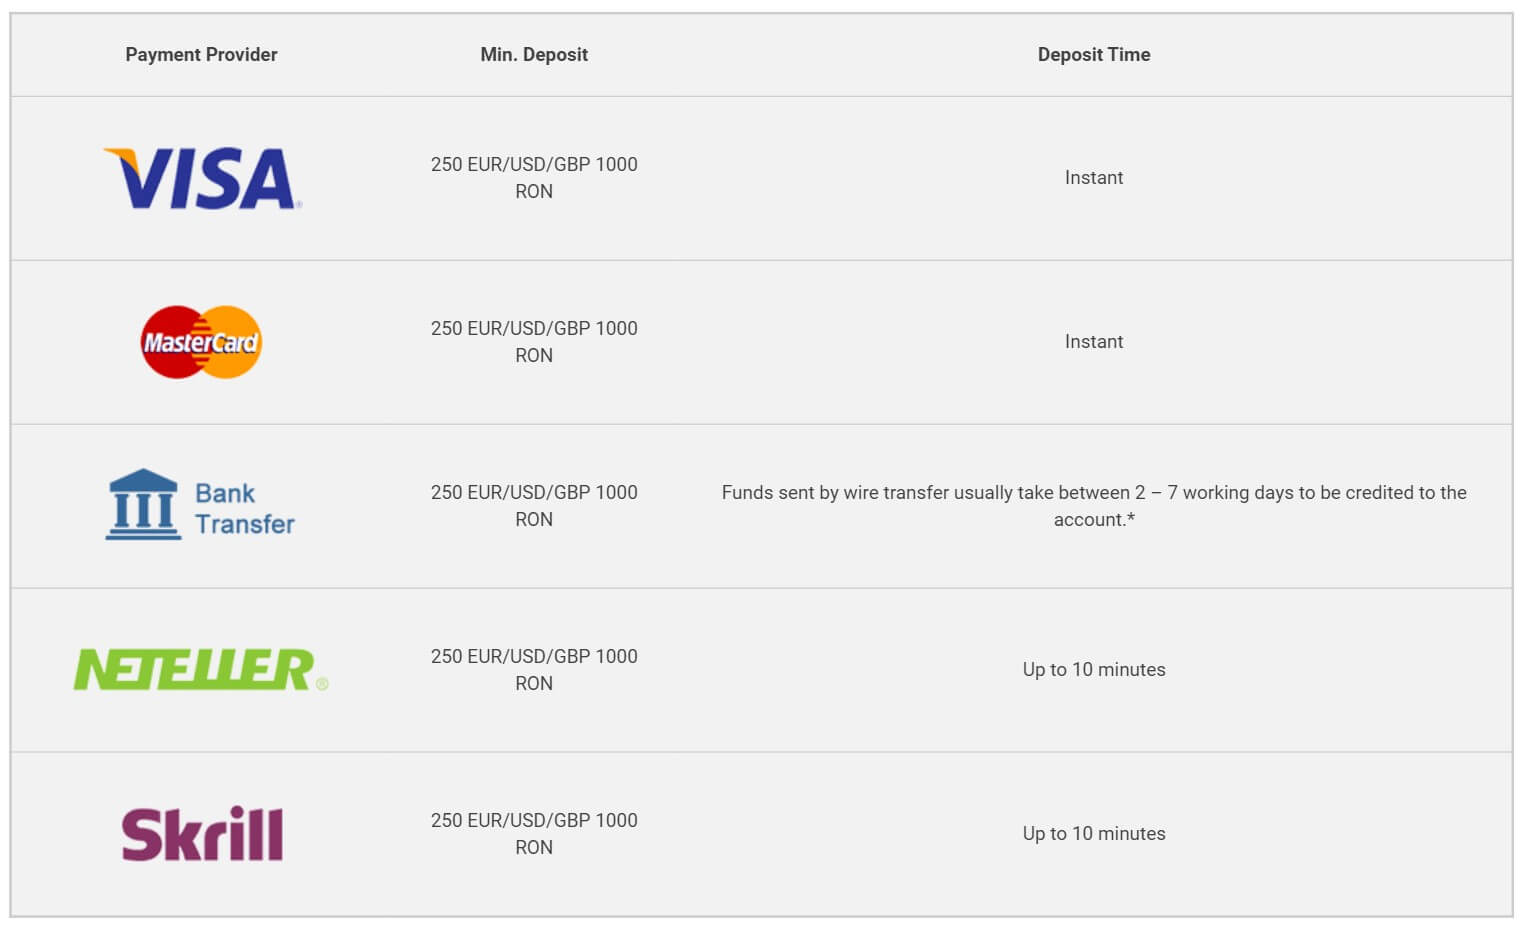
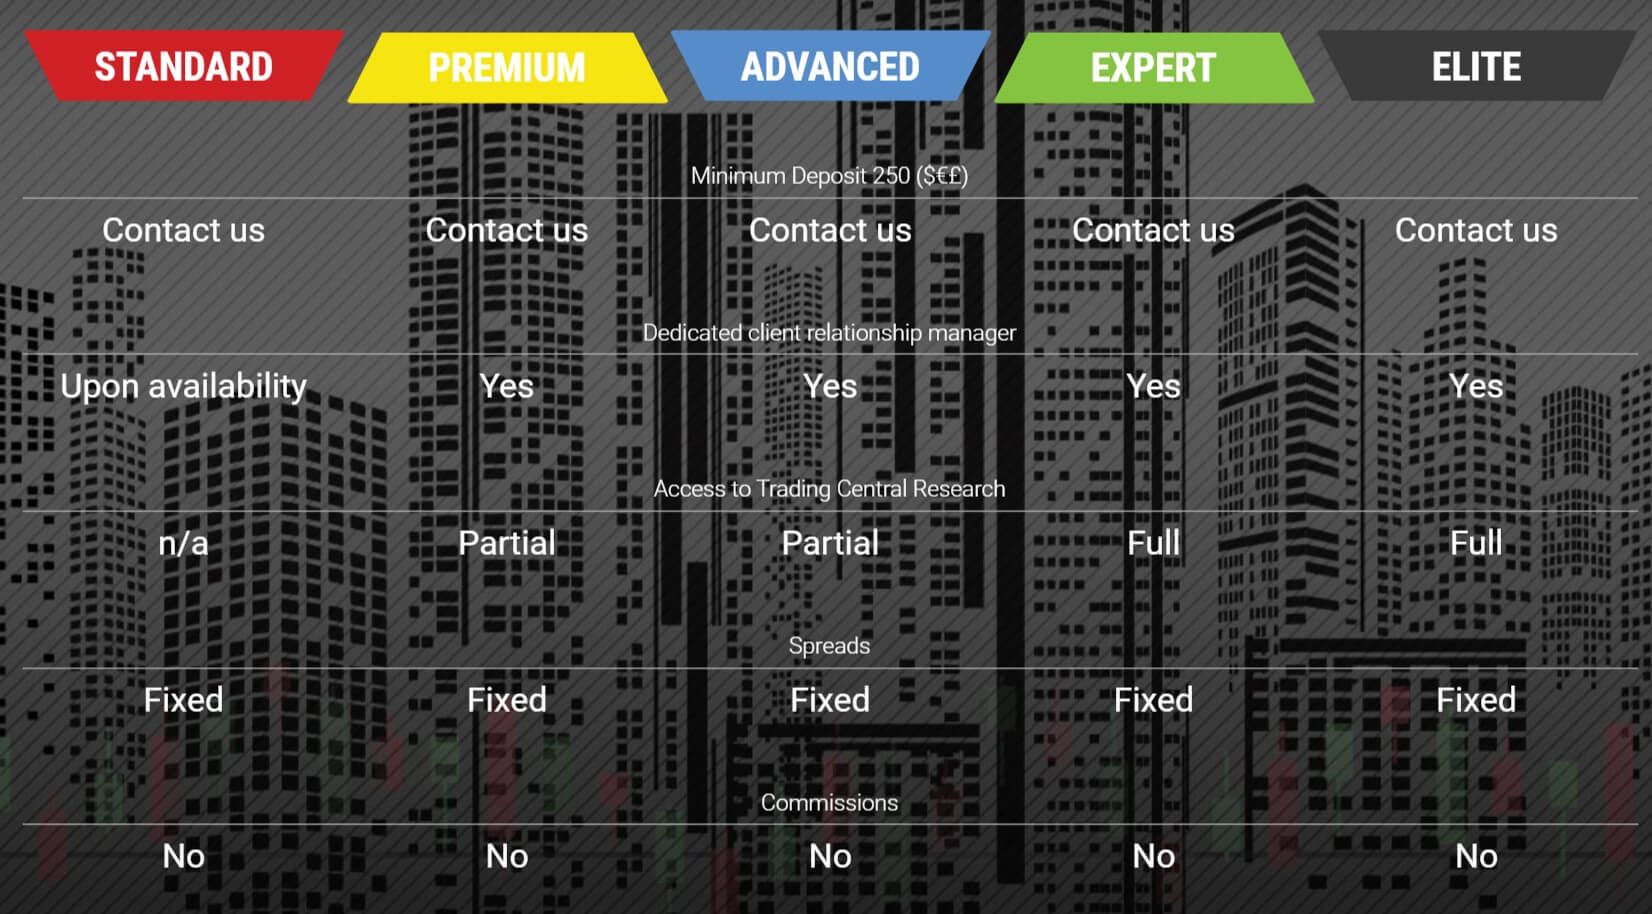
 Trade.Berry confused us a little with their accounts, as they all seem to have the same entry requirements and the same trading conditions The only differences are a few educational tools, but with the entry requirement being the same, everyone will just go for the Elite account. The spreads are average. For non-commission accounts, they are in line with the rest of the industry. There are a few different ways to deposit and withdraw and each having no additional fees is a big plus. The full break down of assets and instruments is a little overwhelming as it is all on a single page rather than broken down into categories. Overall, there seems to be plenty to trade at Trade Berry and the broker seems poised to meet the needs of a wide variety of Forex traders.
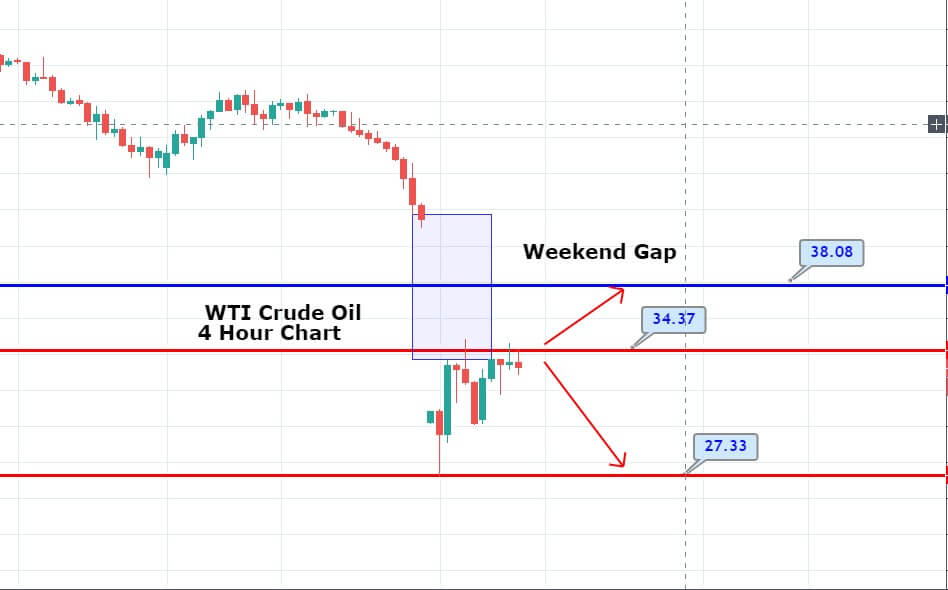


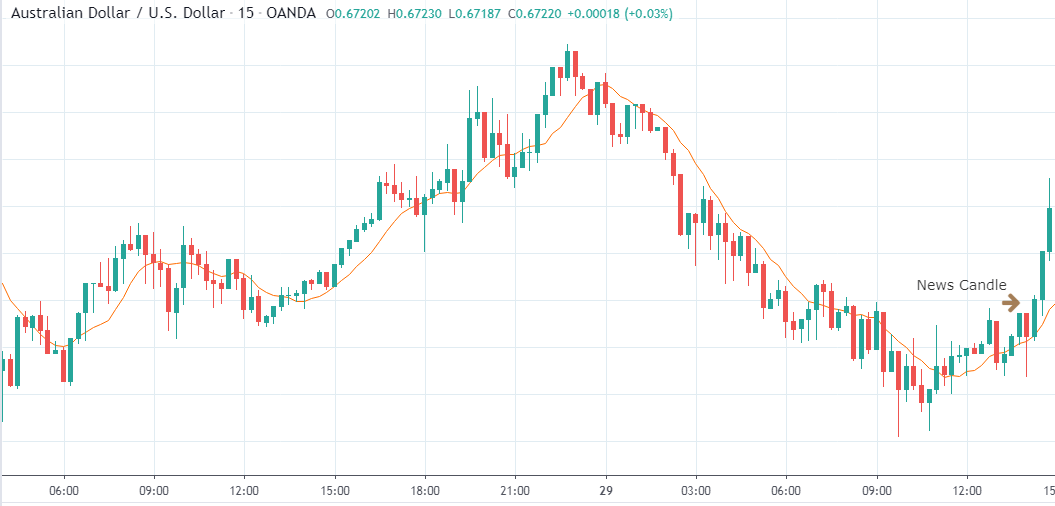


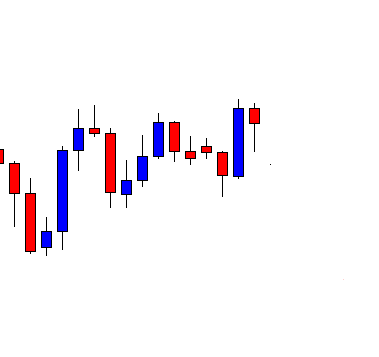


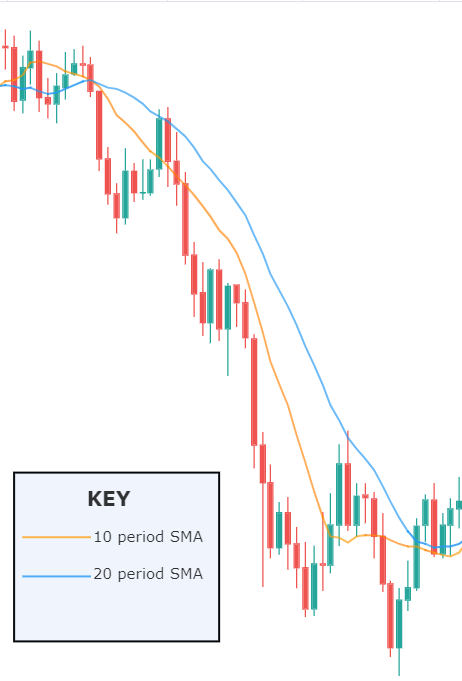
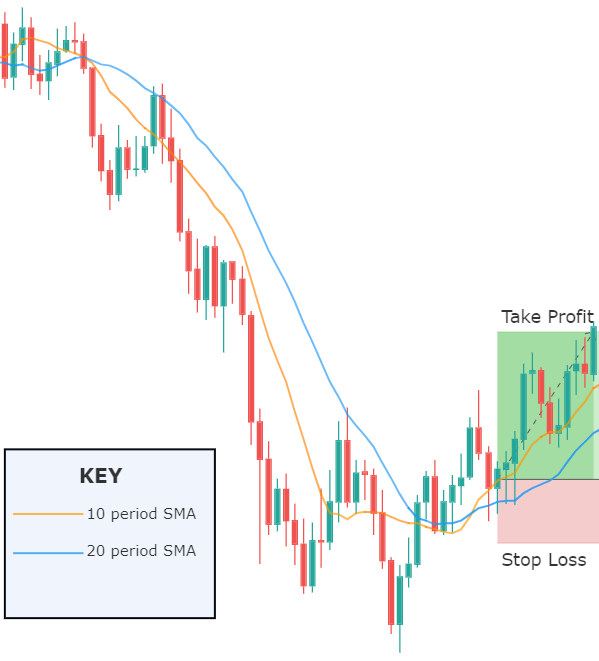


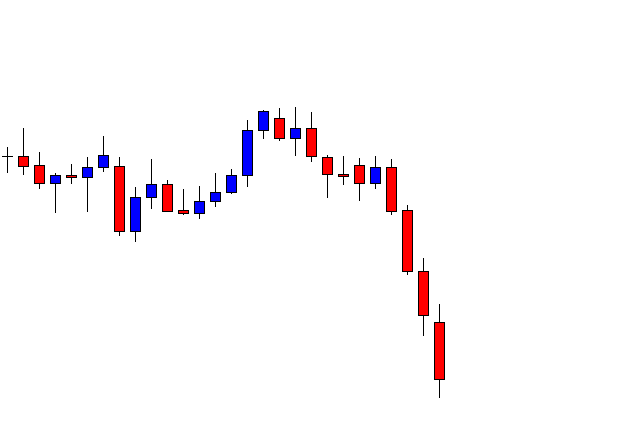
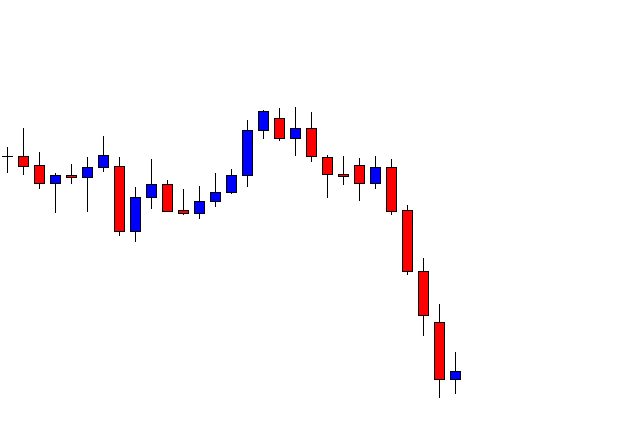
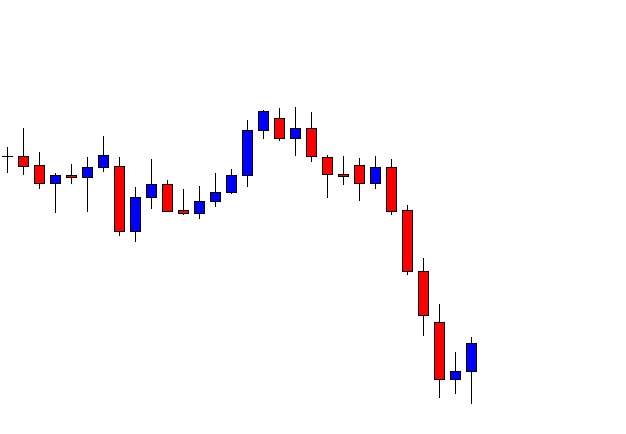
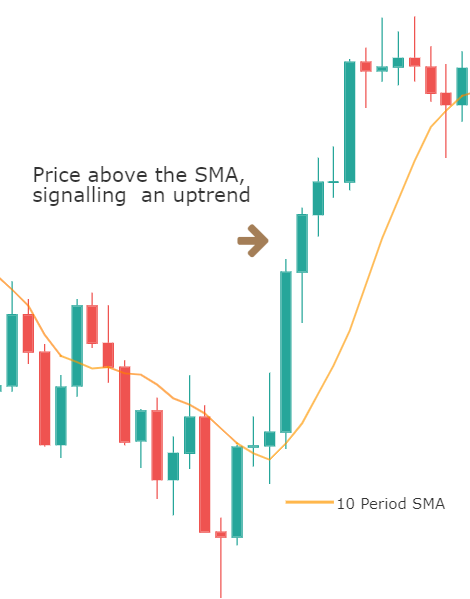
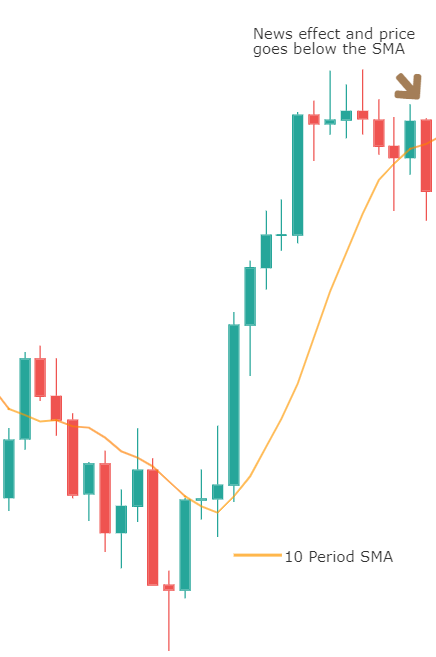
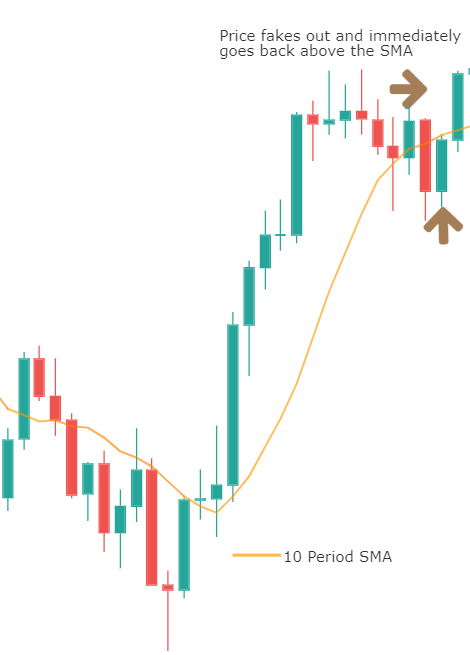
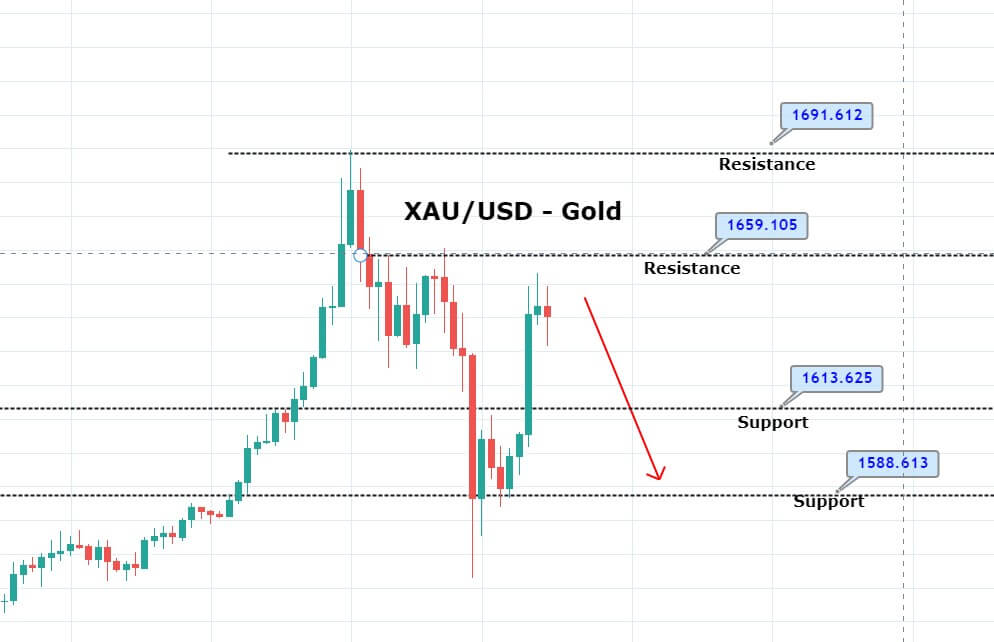
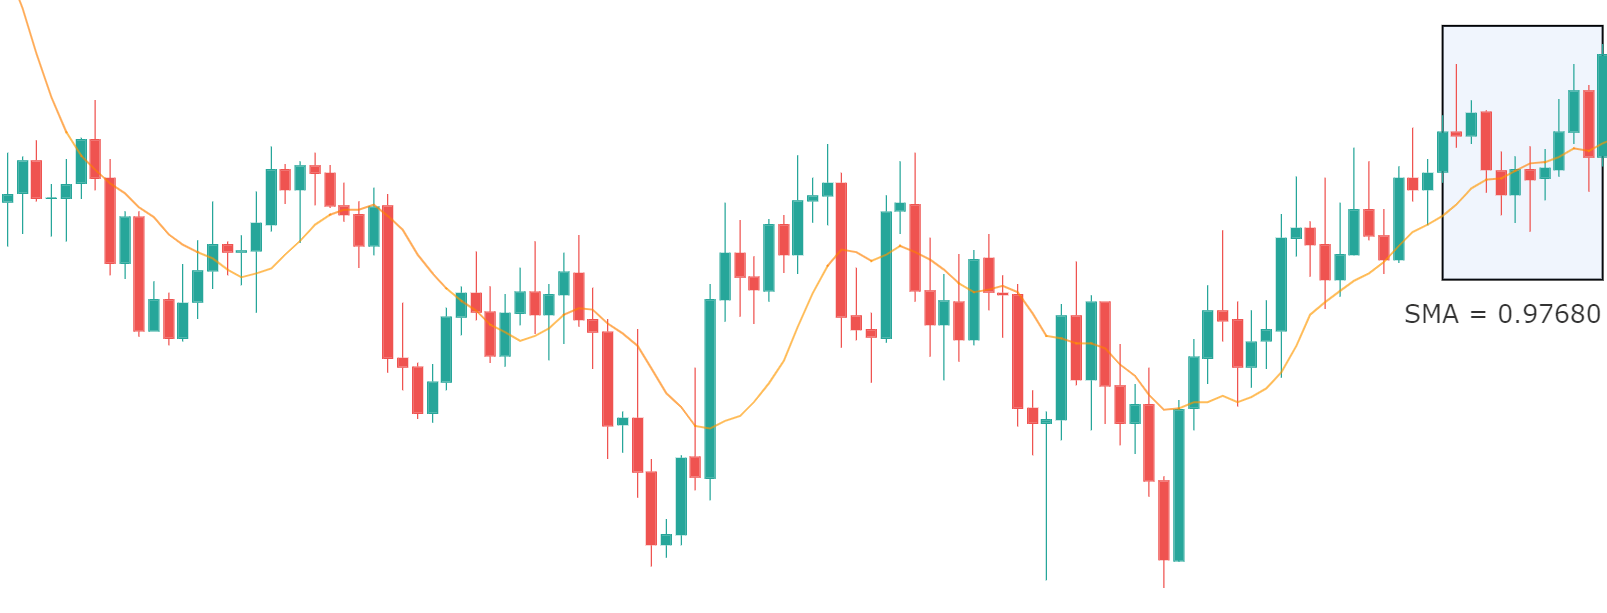
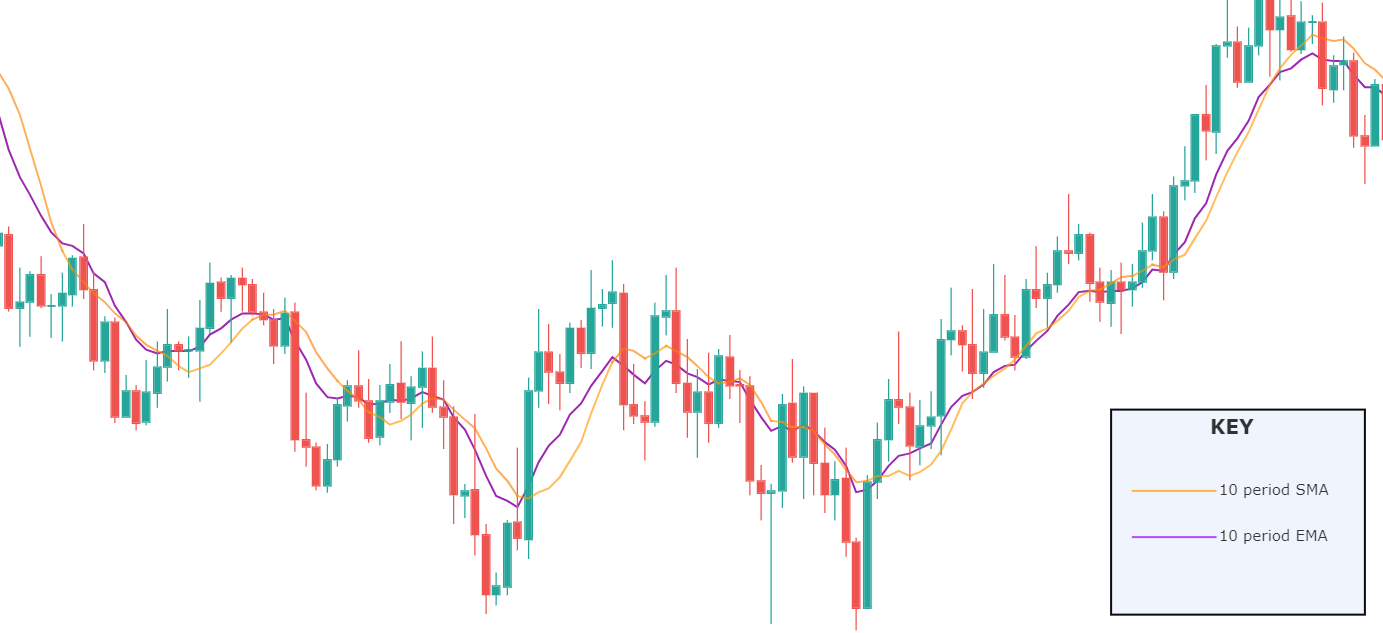
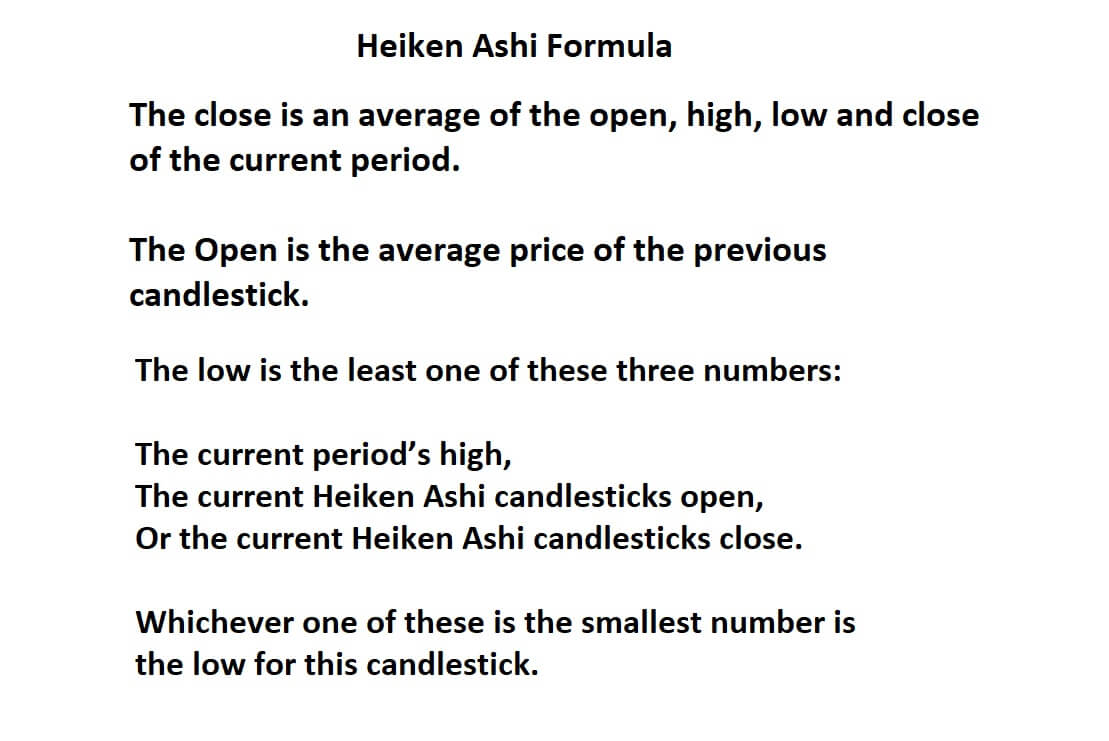 The close is an average of the open, high, low, and close of the current period. The Open is the average price of the previous candlestick.


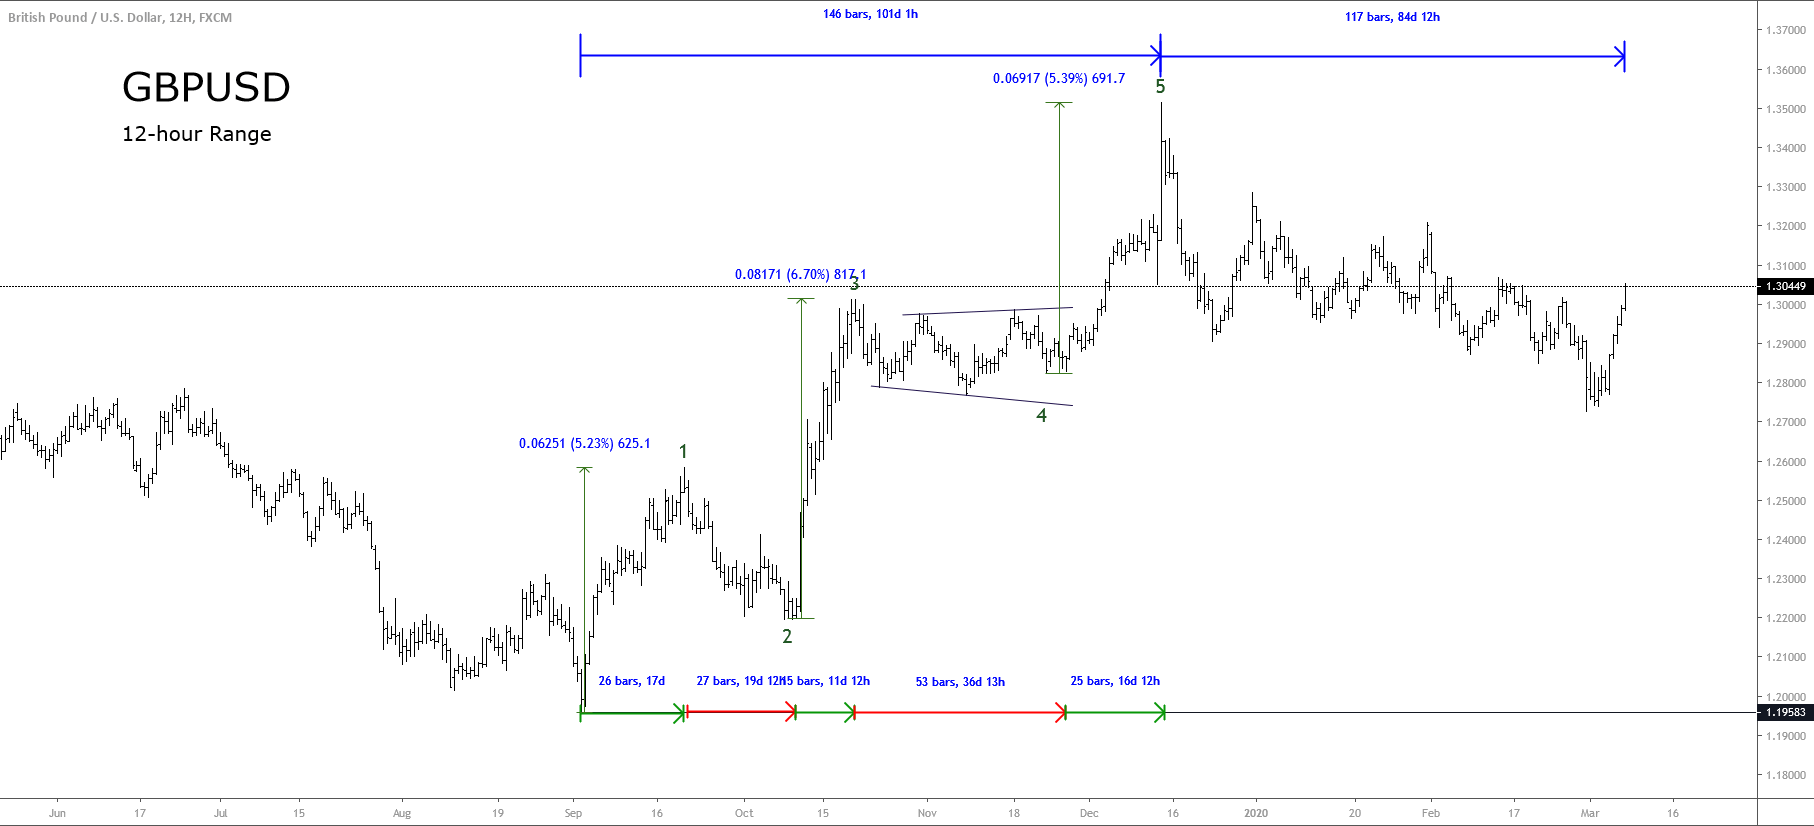
 An interesting proposal within Bonacci’s book was based on an observation of how the population of rabbits grew in ideal conditions. The solution to the rabbit problem was found within a mathematical sequence, which we now know as Fibonacci numbers.


 As mentioned above there isn’t any information available on the site that relates to funding, so this included the available deposit methods or any fees that come with them. This is a shame as Alpha Group will be dealing with our money so the least they could do is detail the methods are available and any fees relating to them.
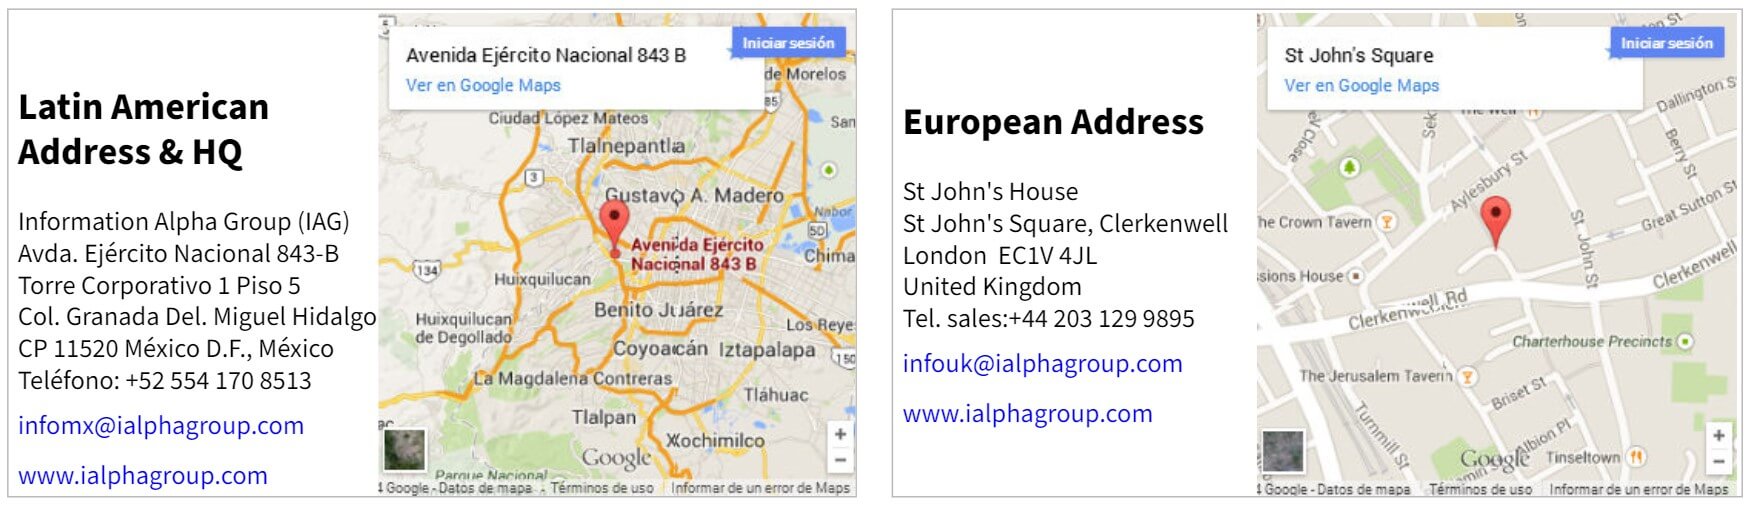


 Educational & Trading Tools
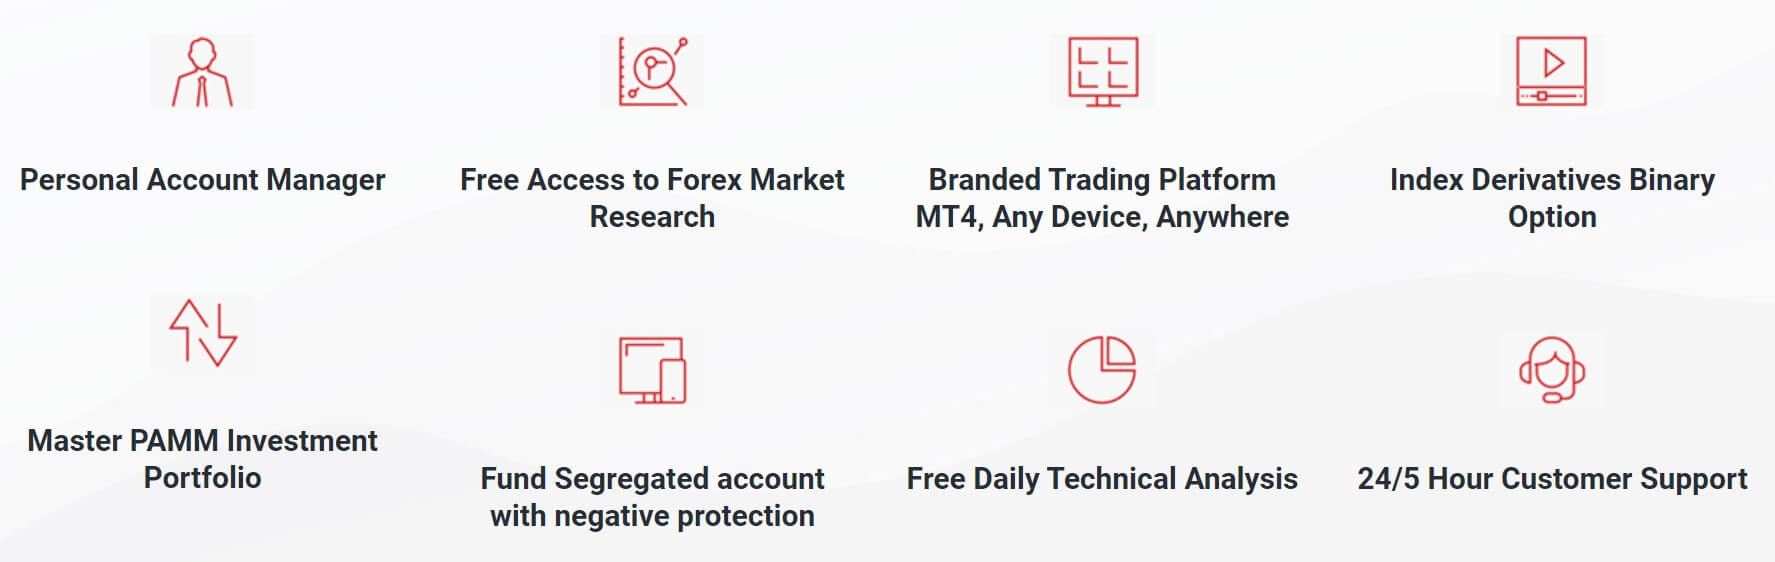


 There are over 470 total assets and we have been broken down into a number of different categories, including FX pairs, commodities, stocks, metals, and more. We did not see any cryptocurrencies, and this could certainly be an issue for a number of traders.
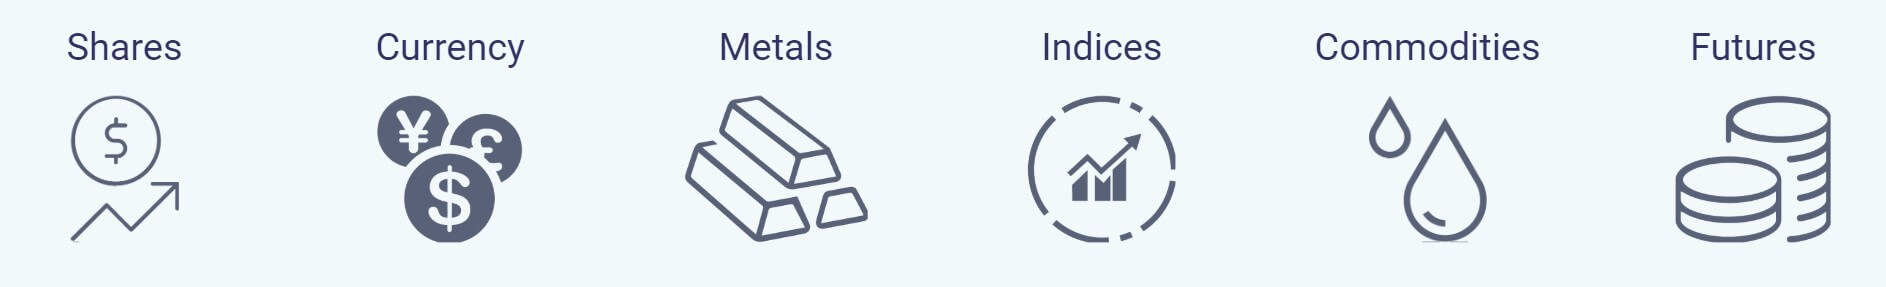


 Minimum Deposit
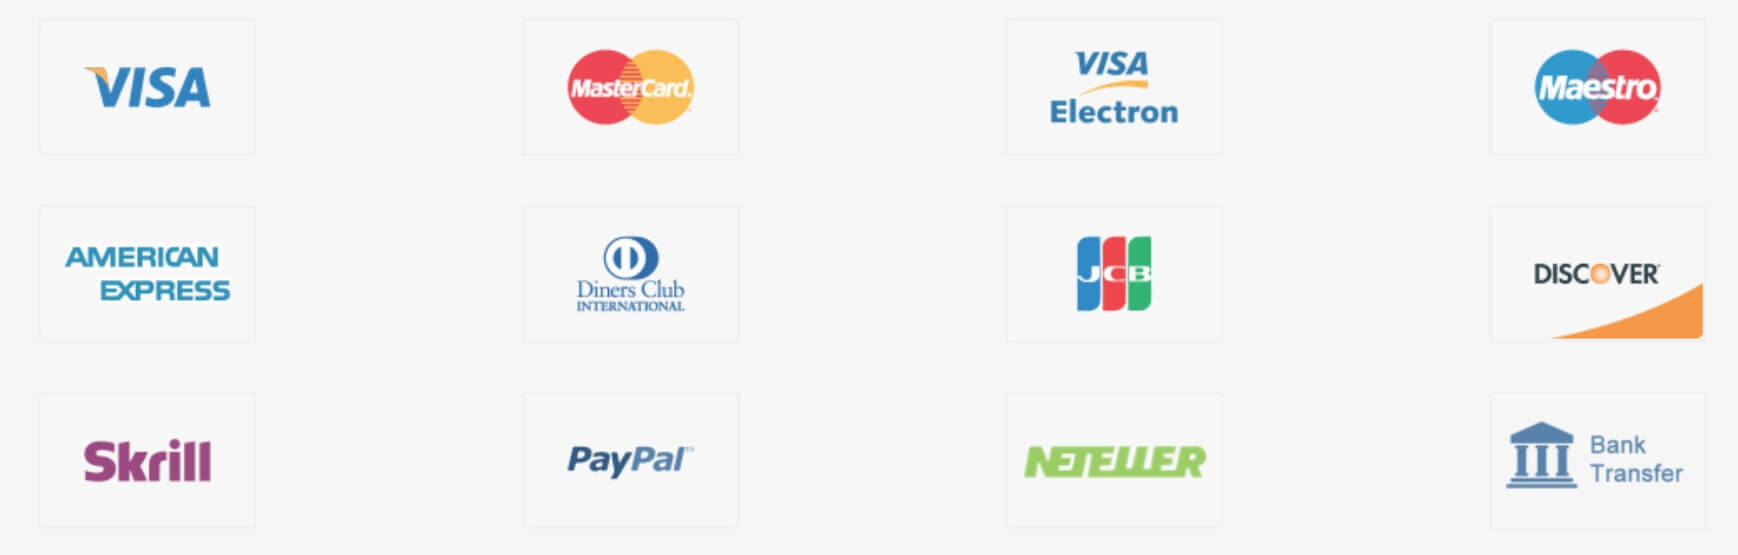
 Customer Service