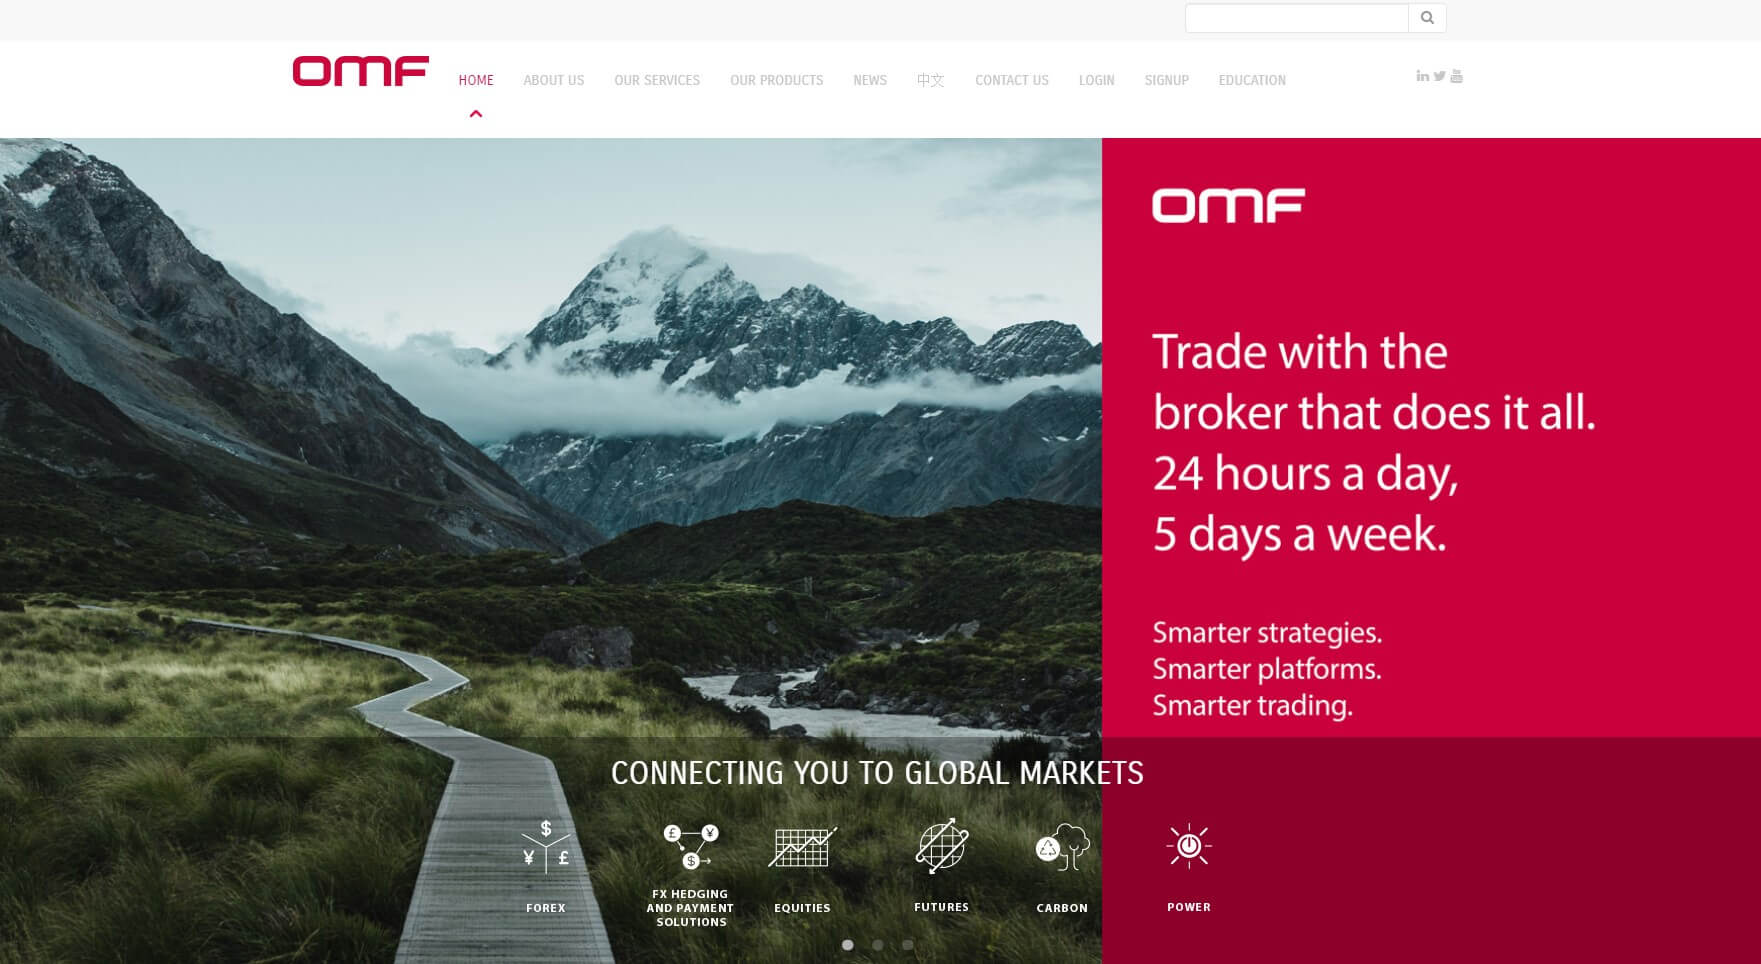
OMF Financial Markets is an online foreign exchange broker that recently won an award for the best cTrader broker. Located and regulated within New Zealand, they offer a wide range of services from forex to CFDs. OMF is committed to providing the best service that they can and so we will be using the review to dive deep into the services on offer to see what is really there and how they compare to the competition in this very competitive industry.
Account Types
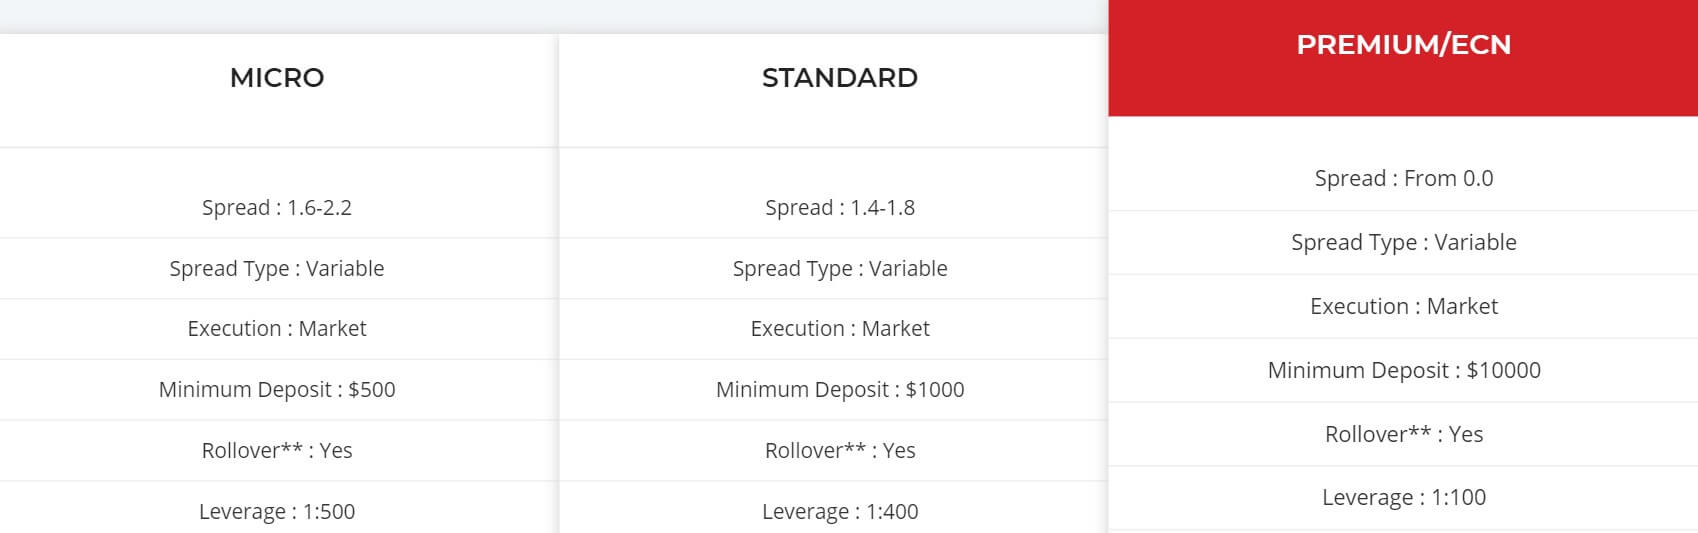
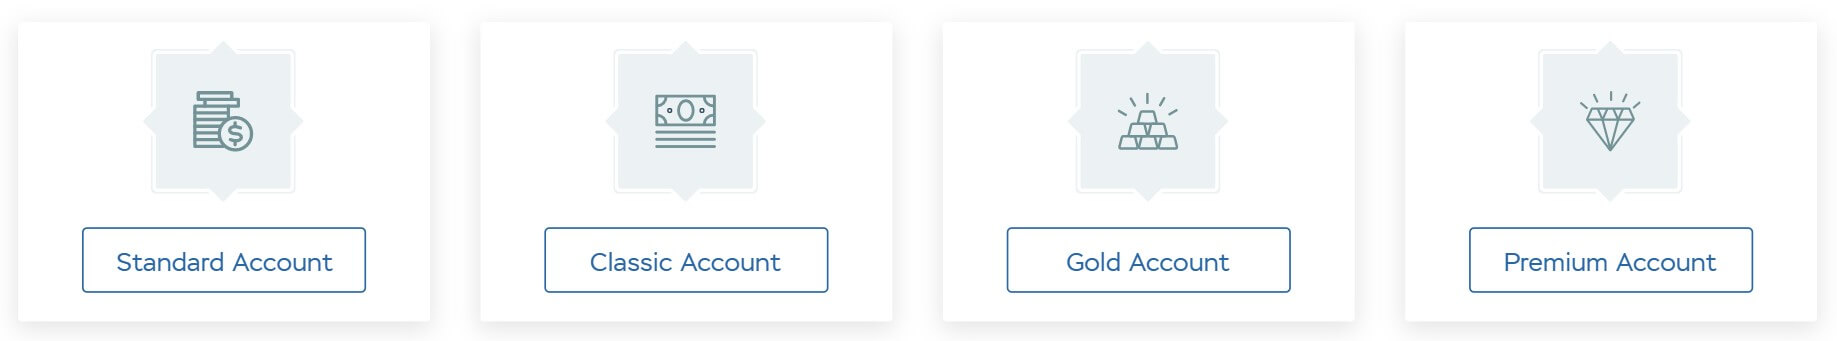
There isn’t an account comparison page so we do not have any information for this section. However, as we go through the review, in each section we will outline any potential differences if there are multiple accounts. Otherwise, all the information provided in this review will be relevant to the accounts available.
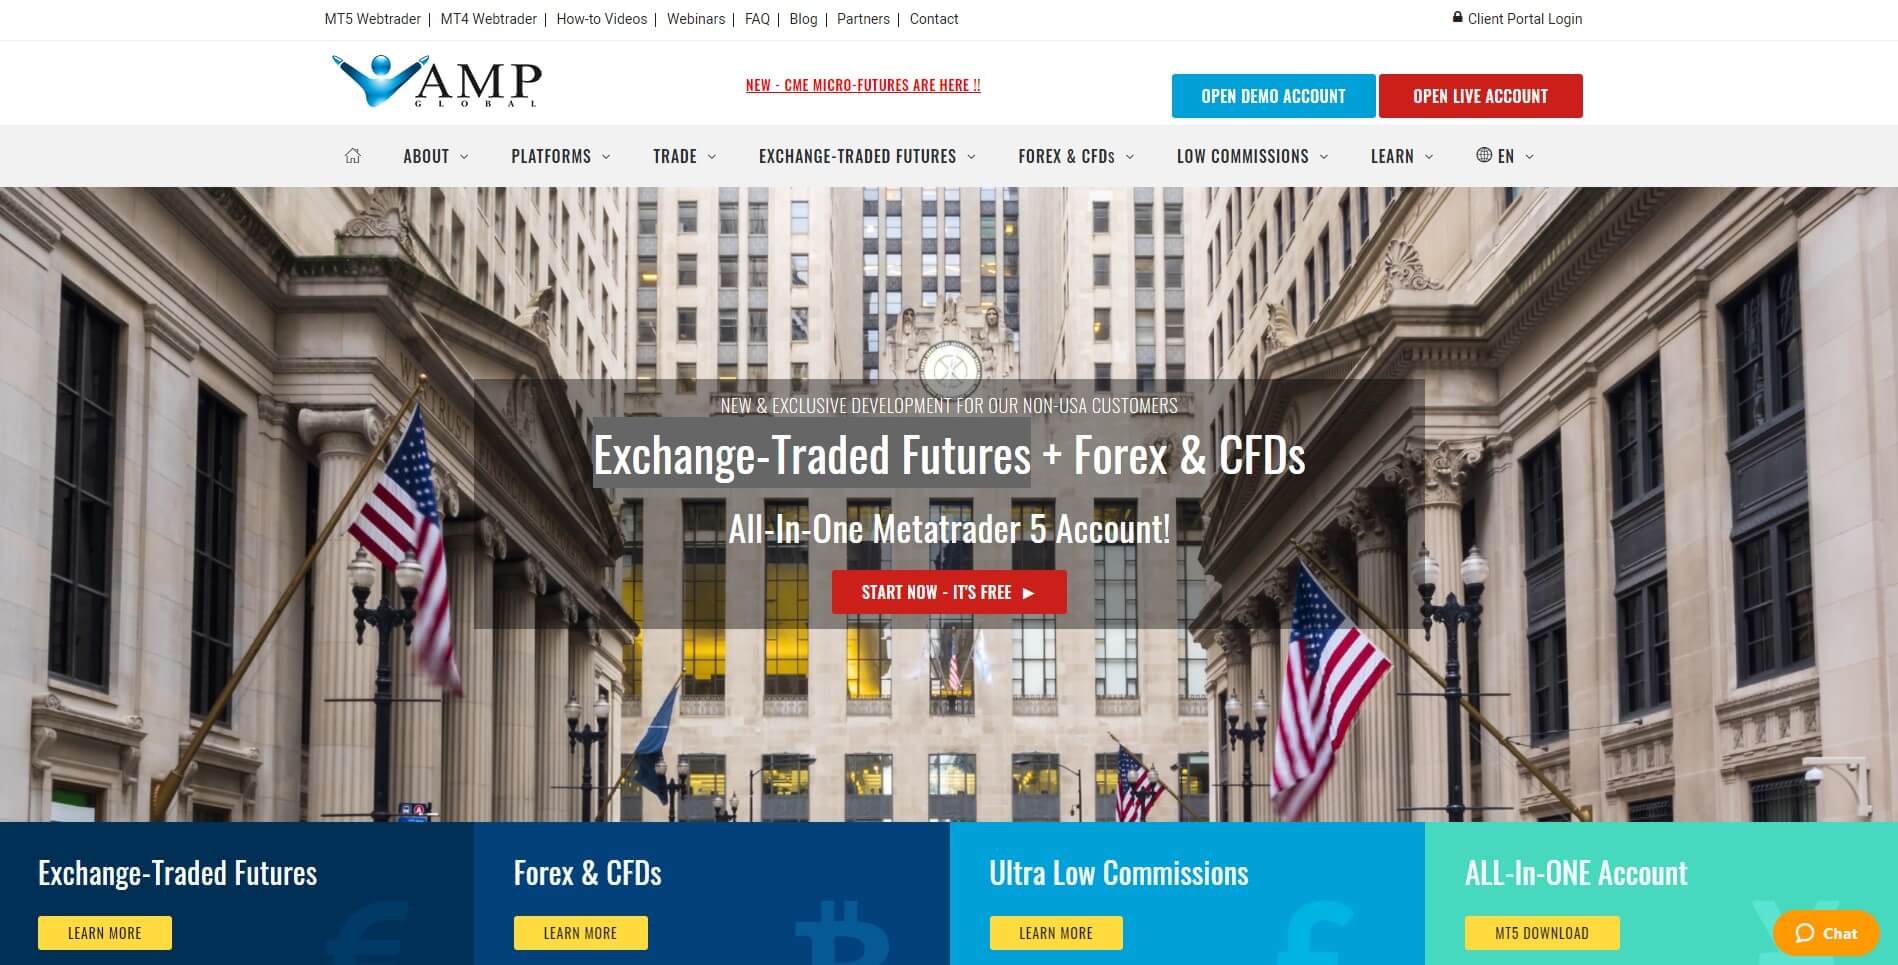
Platforms
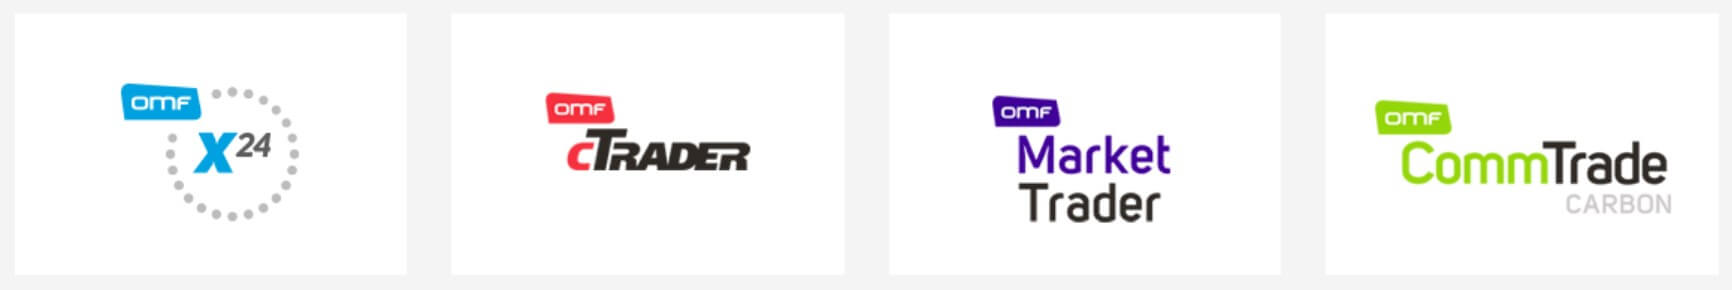
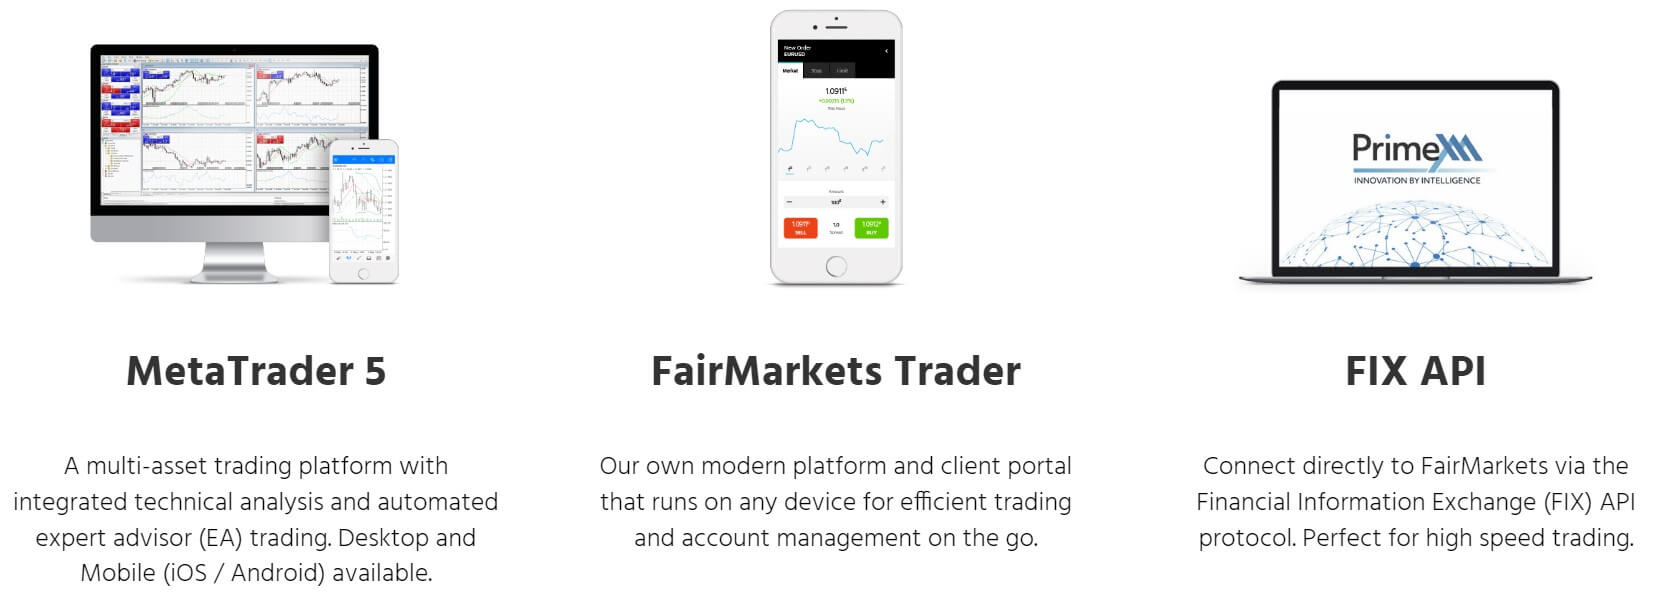
There are a number of different platforms available, we have outlined them below along with some of their main features.
 x24:
x24:
This platform offers the ability to proactively manage volatile currency markets. OMFx24 is a platform that removes the hassle from sending and receiving payments overseas. A full range of FX tools allows you to effectively manage your currency risk so that you can focus on building your business. Manage your positions, track balances or view margin requirements online. The real-time environment provides you with a complete overview of your FX account.
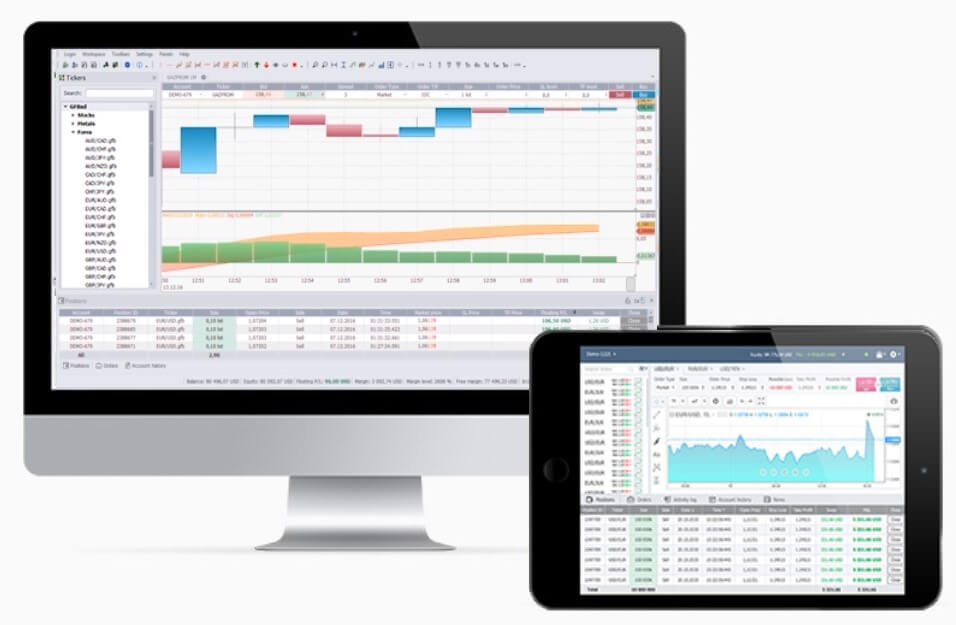
cTrader:
This platform gives you Straight Through Processing (STP) access to the forex market right from your own P.C., tablet or smartphone. Designed for professionals and novices alike, OMF cTrader is a groundbreaking trading tool, developed to give you secure access to major foreign exchange markets from any location. The platform is highly sophisticated yet extremely user-friendly and intuitive. The STP environment routes all your trades directly to prices aggregated from many prominent banks, avoiding the need for market maker type intervention and doing away with the potential for manipulation and re-quotes.
MarketTrader:
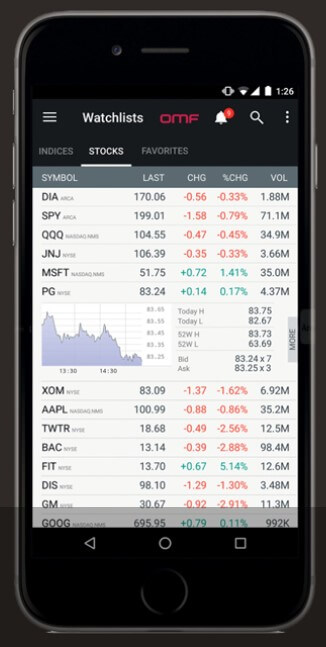
MarketTrader provides direct access to equity markets around the world. Trade listed equities, options, ETFs/ETNs and CFDs in multiple currencies all from the one account. Chart equities, indices, futures and options. Compare and overlay different products. Candlestick, bar and line charts are available on a 30 second to the multi-decadal timeframe. OMF MarketTrader’s customizable overlays, indicators, and moving averages, with the ability to chart option implied volatility, meets the needs of the most demanding technical analyst.
CommTrade:
CommTrade provides a facility where live pricing is listed for all available carbon and electricity contracts. Access the latest spot and forward prices, options pricing and historical data across full range products that can be executed via the platform. Buyers and sellers can log in and place orders when the markets are open. Orders can be executed on a spot or forward basis. Access the information you need to stay fully informed of market developments. Our daily market commentary provides an in-depth analysis of the carbon and power markets to keep you up to date.
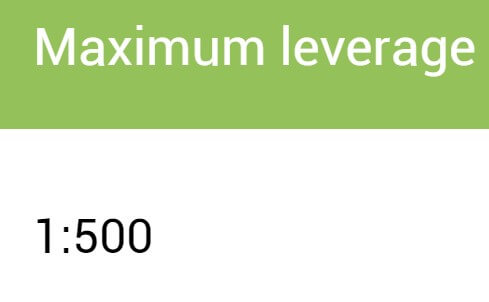
Leverage
While we know that the accounts can be leveraged. We do not actually know what the maximum leverage is, or if it can be changed on an already open account.
Trade Sizes
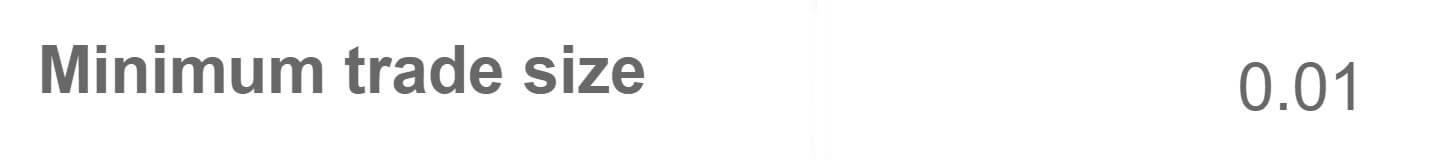
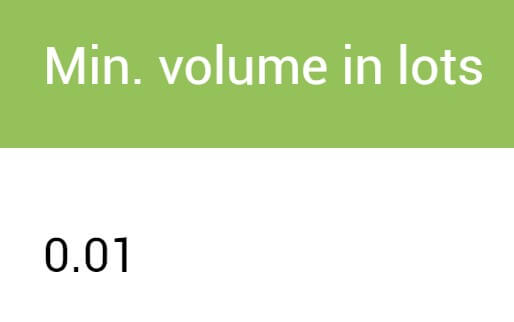
Trade sizes start from 0.01 lots and go up in increments of 0.01 lots so the next trade would be 0.02 lots and then 0.03 lots. We do not know what the maximum trade size is or how many open trades and orders you can have at any one time.
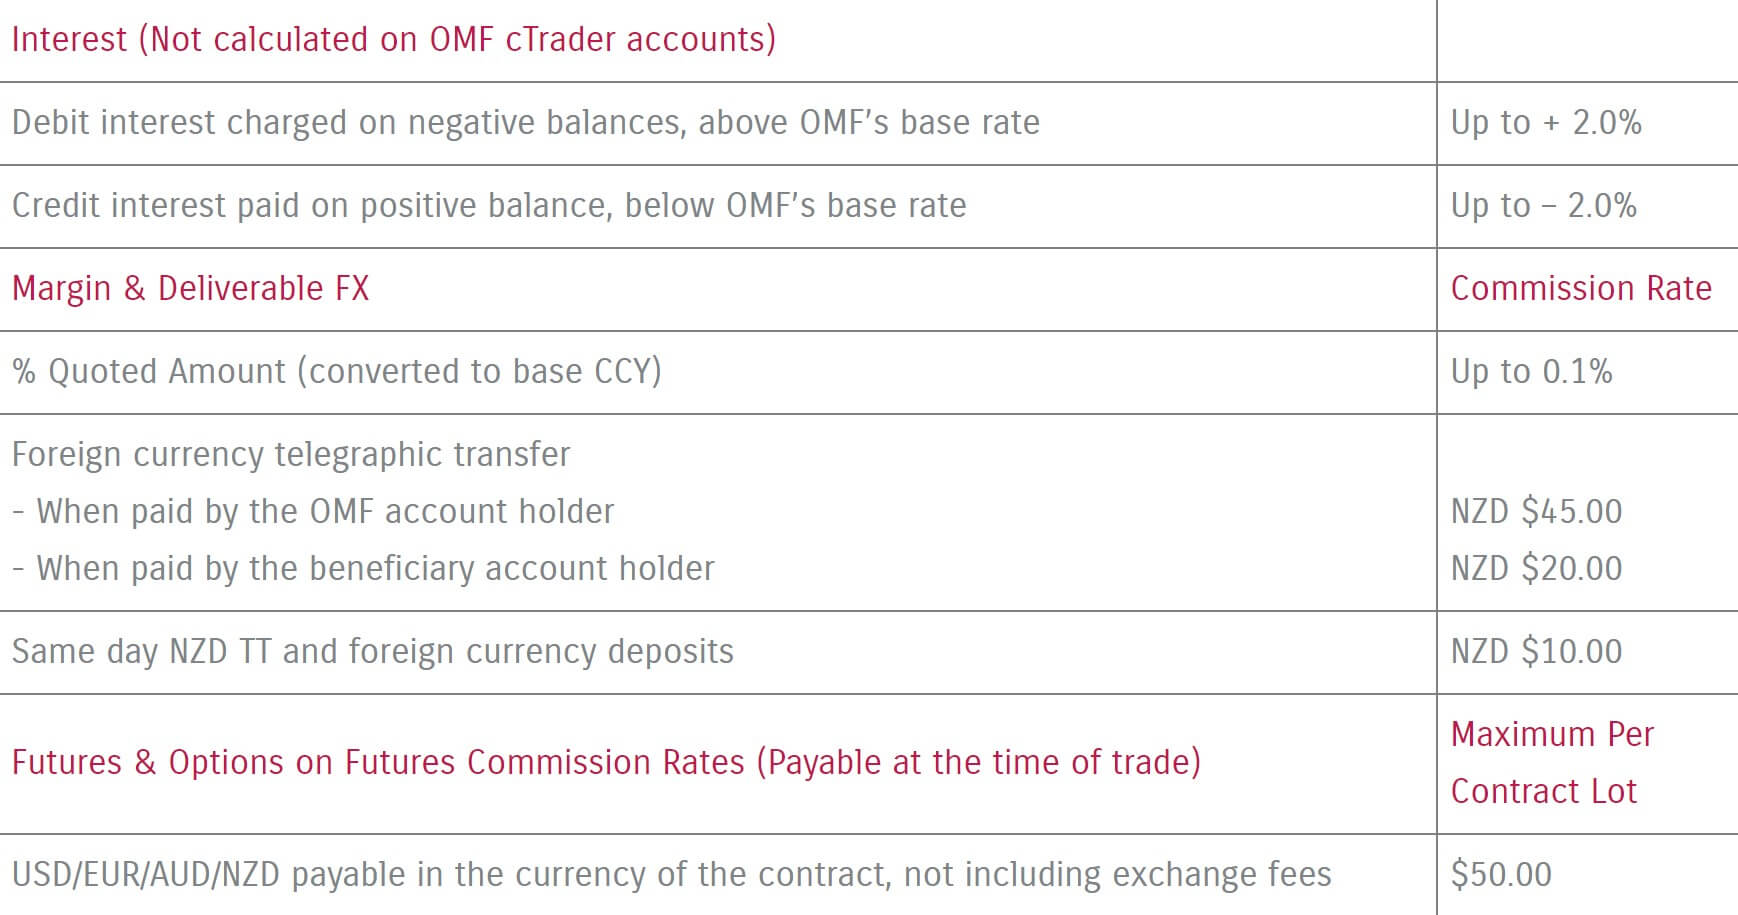
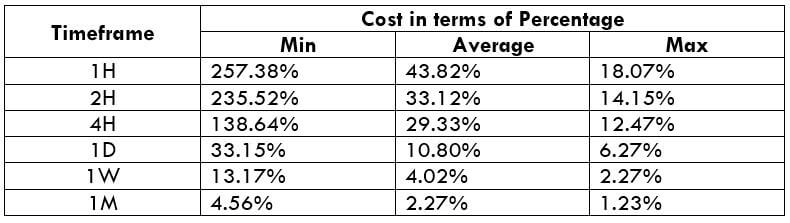
Trading Costs
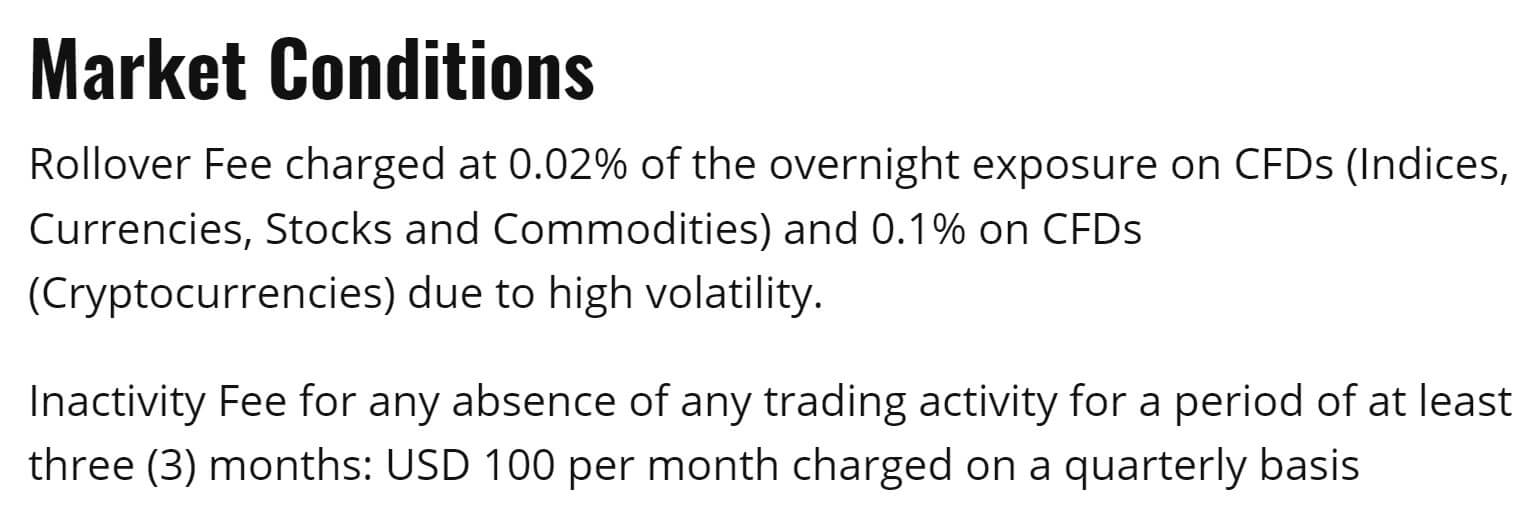
There is a fees and commission page which is a little confusing. We would recommend looking at it yourself as it provides a lot of information. The one that we will point out is that when trading Forex, there is an added fee of 0.1%. Swap charges are present and are charged for holding trades overnight. They can be both positive or negative and can be viewed within the trading platform that you are using.
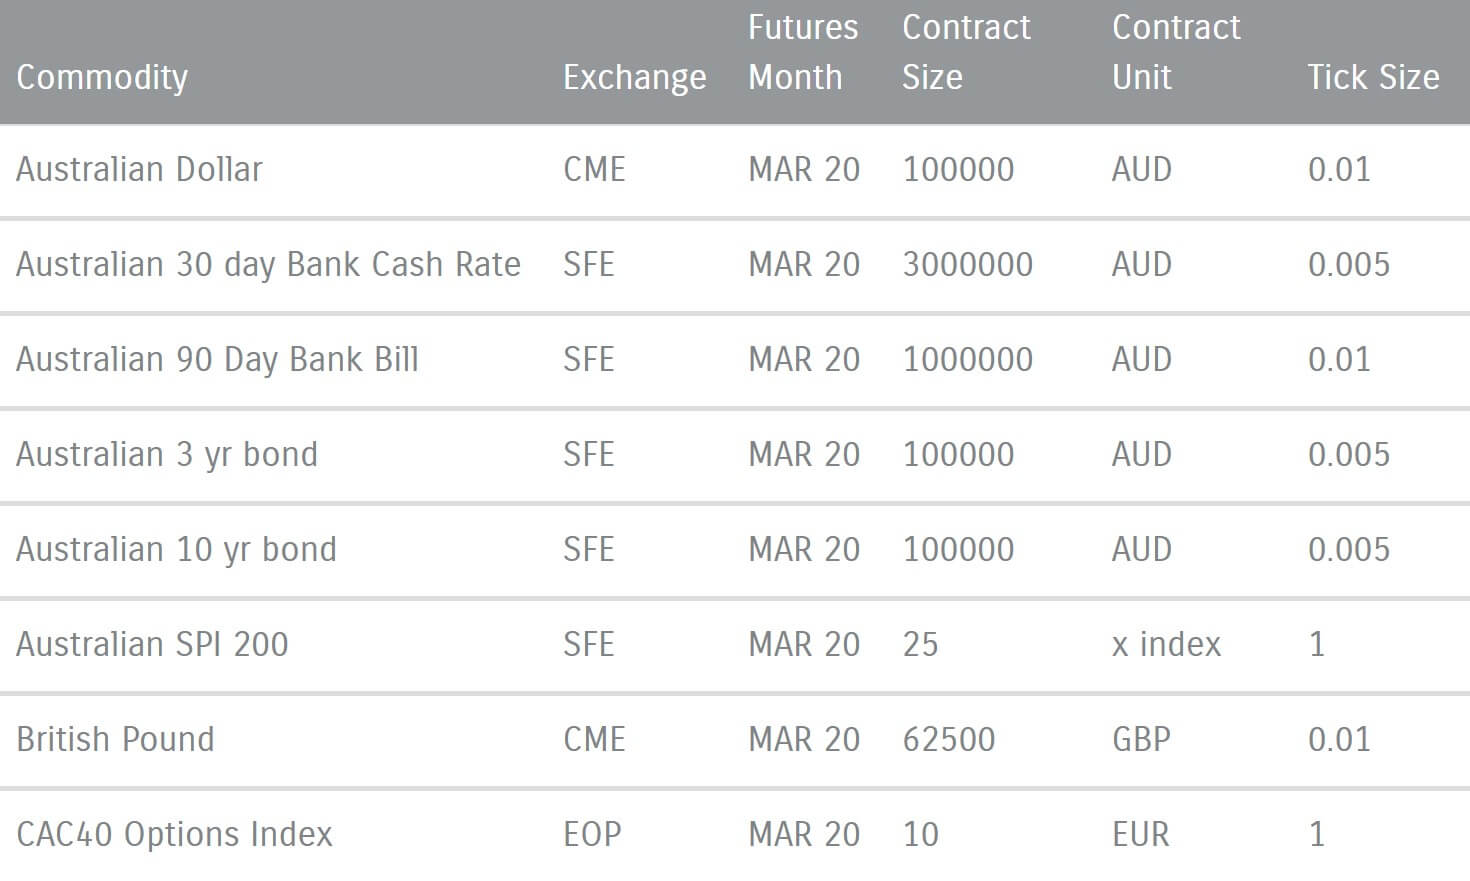
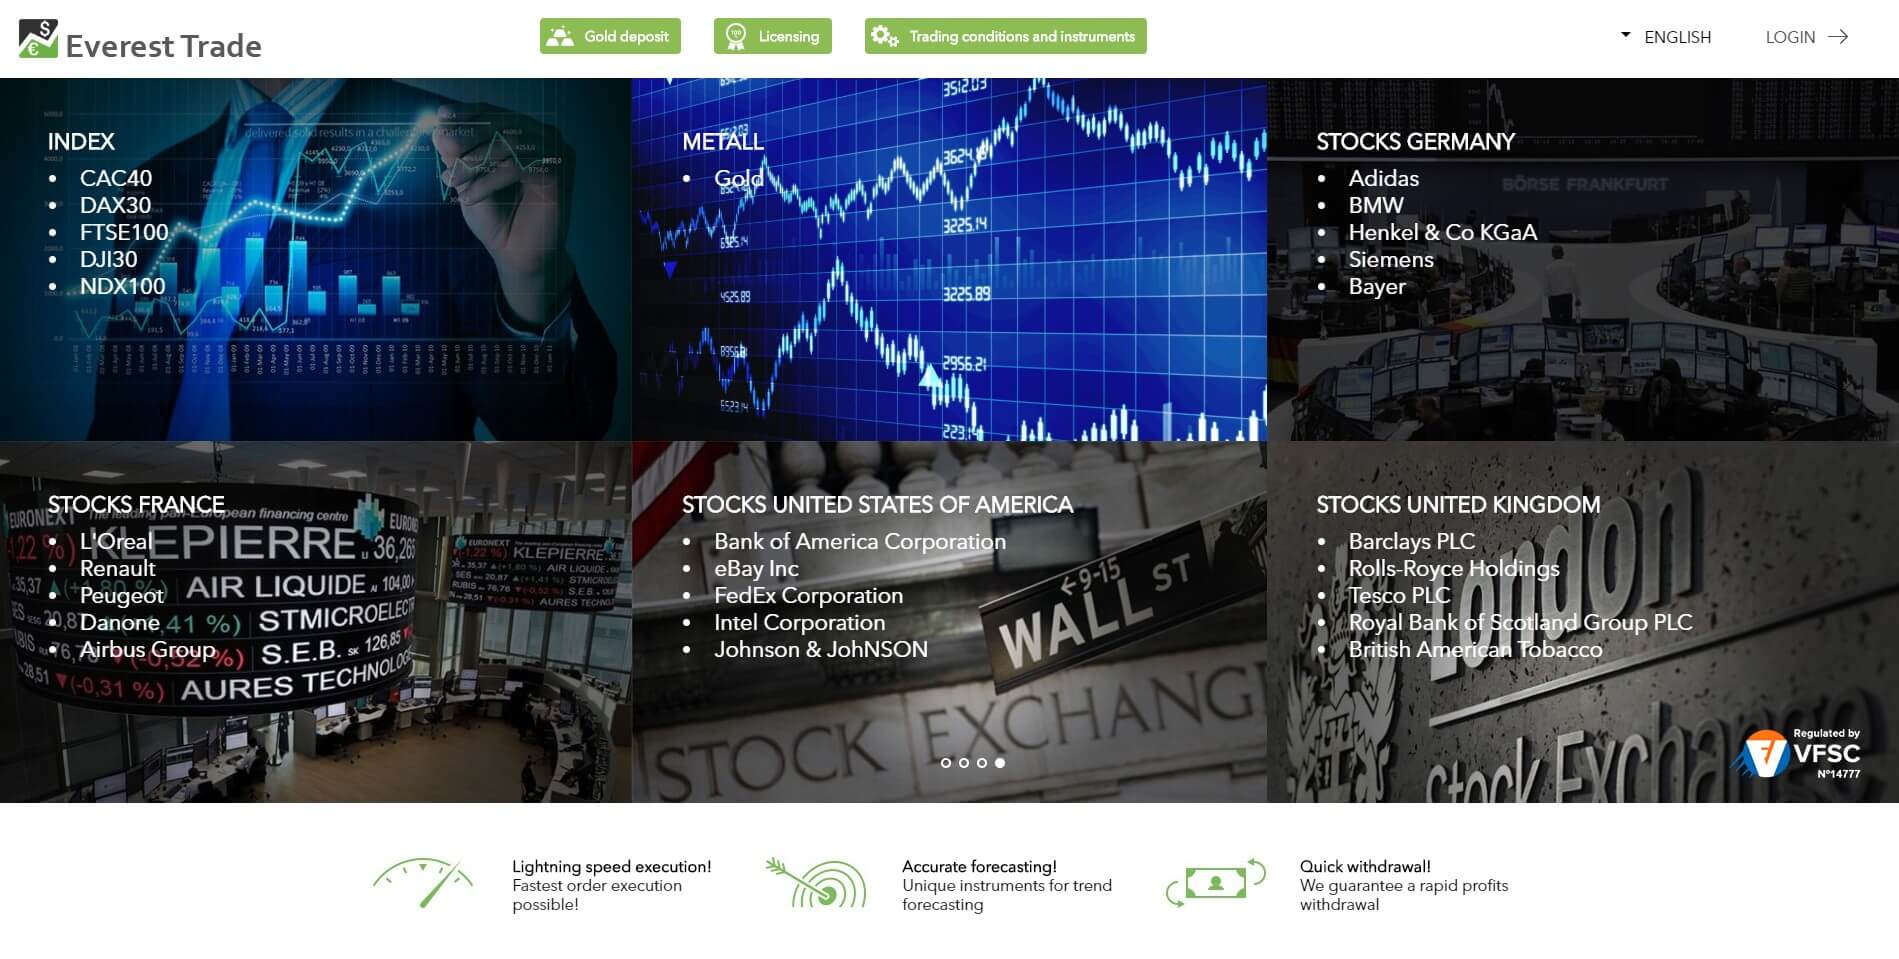
Assets
The assets have been split up into various categories of Forex, Equities, Futures, Carbon, Power, and Dairy. However, there isn’t a breakdown of the available instruments within each category. This is a shame as many potential clients may want to see what instruments are available before signing up, especially if they have their preferred instruments to trade.
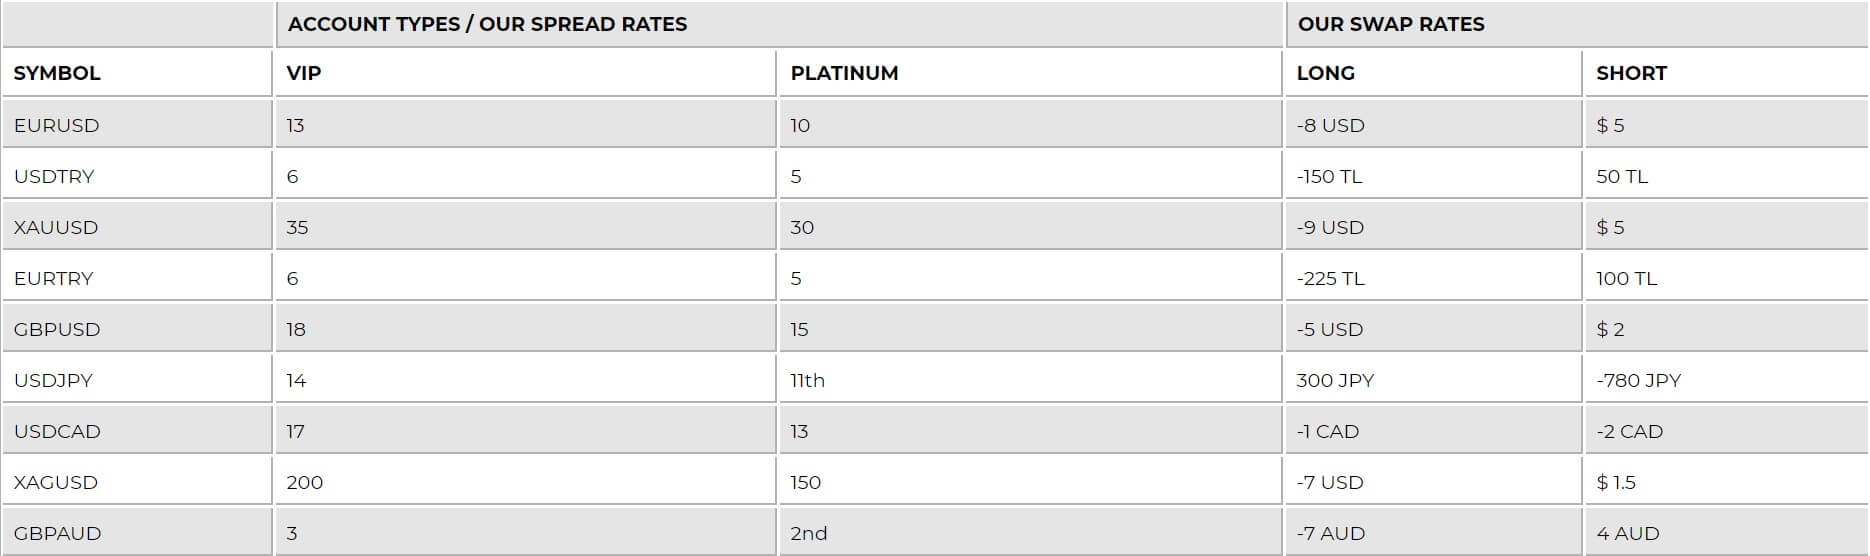
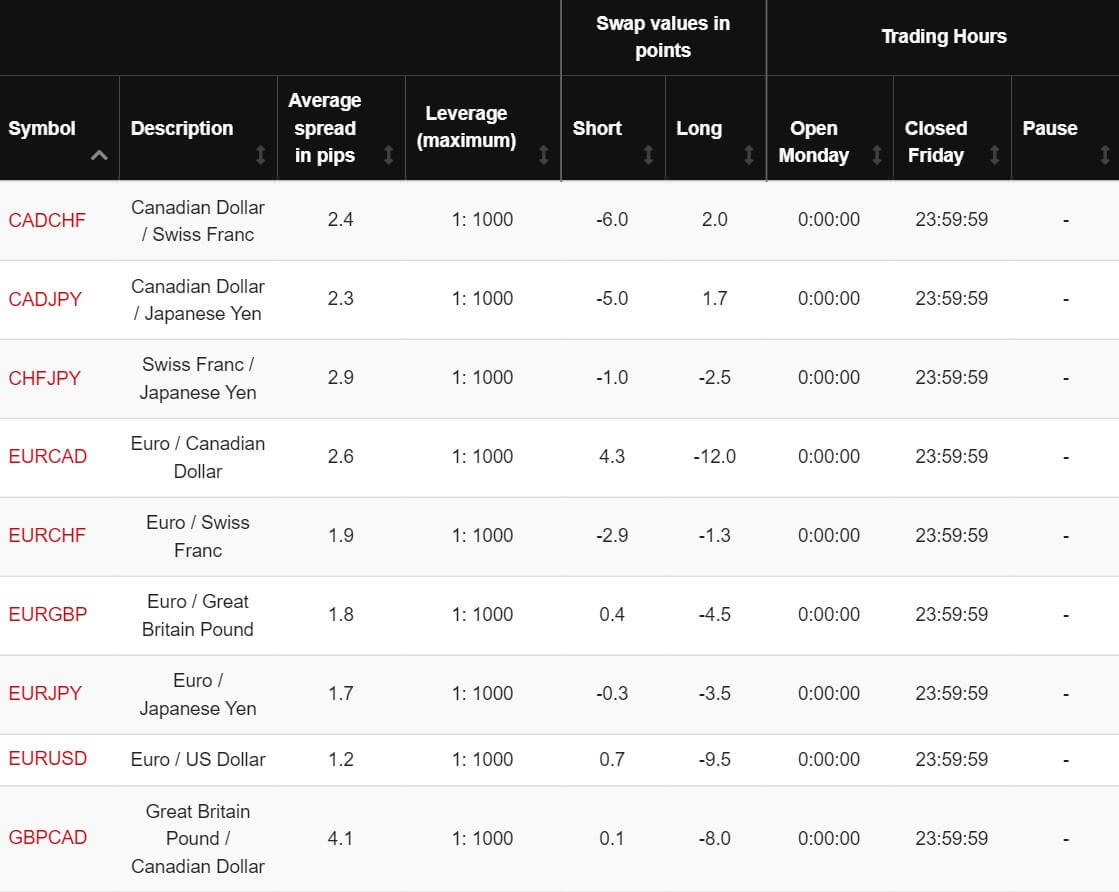
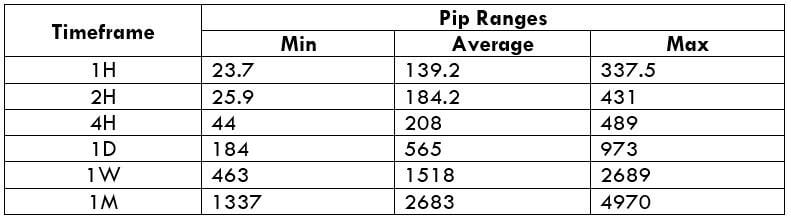
Spreads
The spreads will go as low as 1 pip, this is the lowest that the spreads will go and as they are variable spreads they will often be seen higher as they are influenced by the markets. Different instruments will also have different spreads so while one may be as low as 1 pip, others may not go any lower than 2 pips.
Minimum Deposit
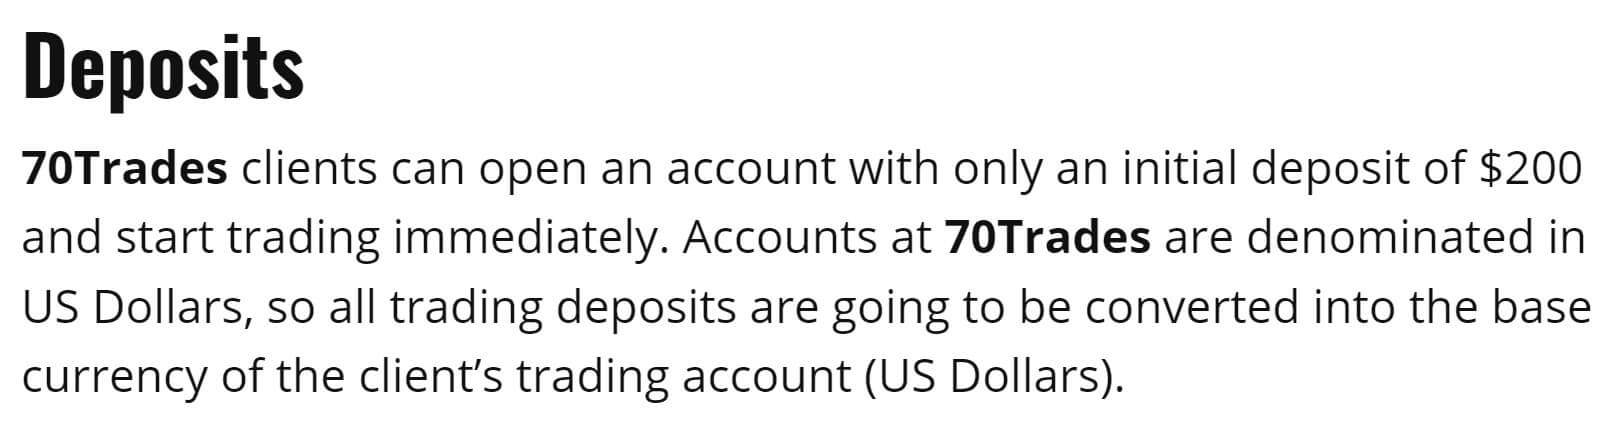
The minimum deposit amount required to open up an account is 10,000 NZD which is a little high and could price out a lot of newer traders. We do not know if this amount reduces once an account has already been opened.
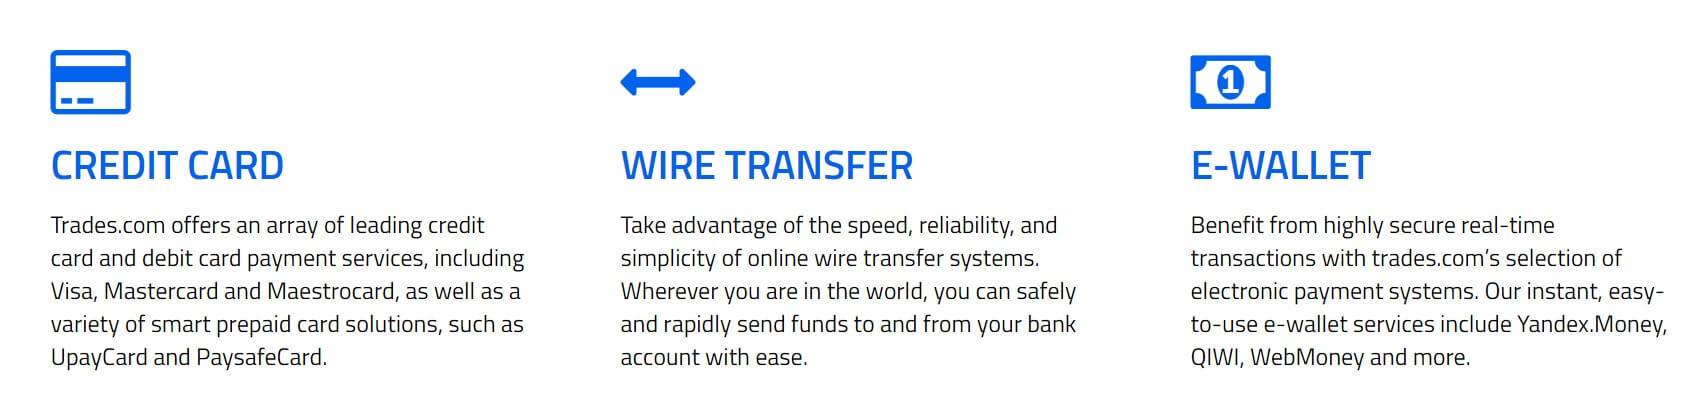
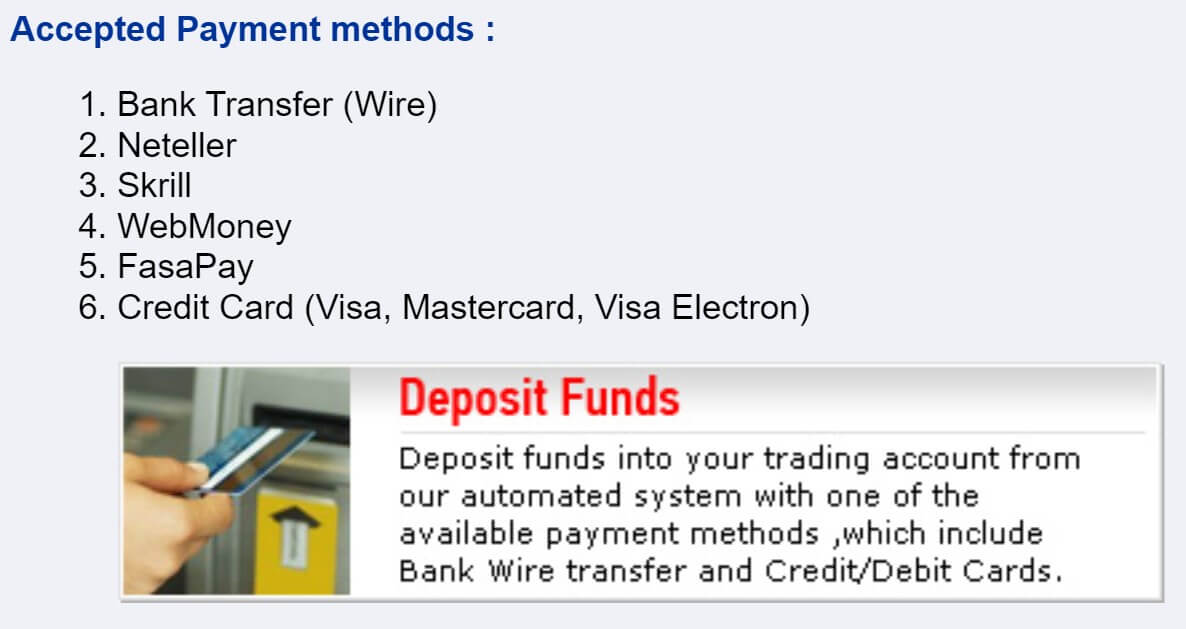
Deposit Methods & Costs
You are only able to deposit using Bank Wire which can limit the number of potential clients as people often like to use other methods. The FAQ states that OMF does not charge for any deposits, but you should check with your own bank or processor to see if they add any charges of their own.
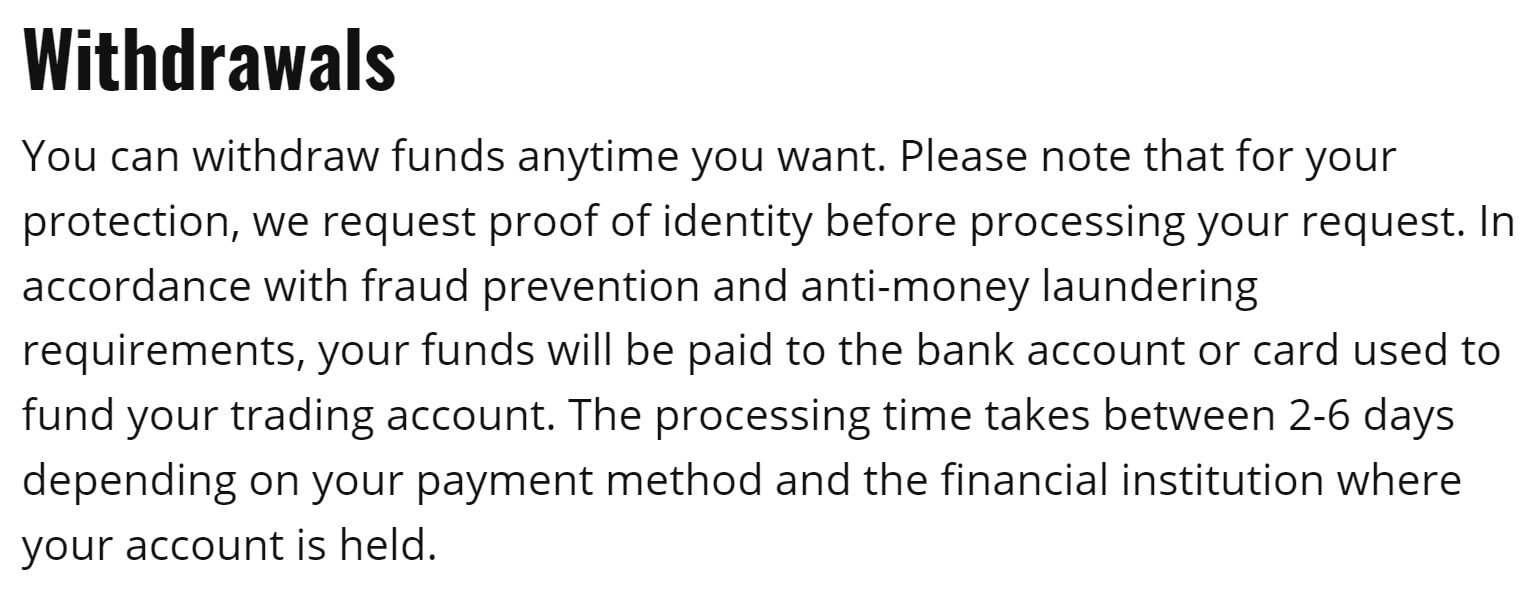
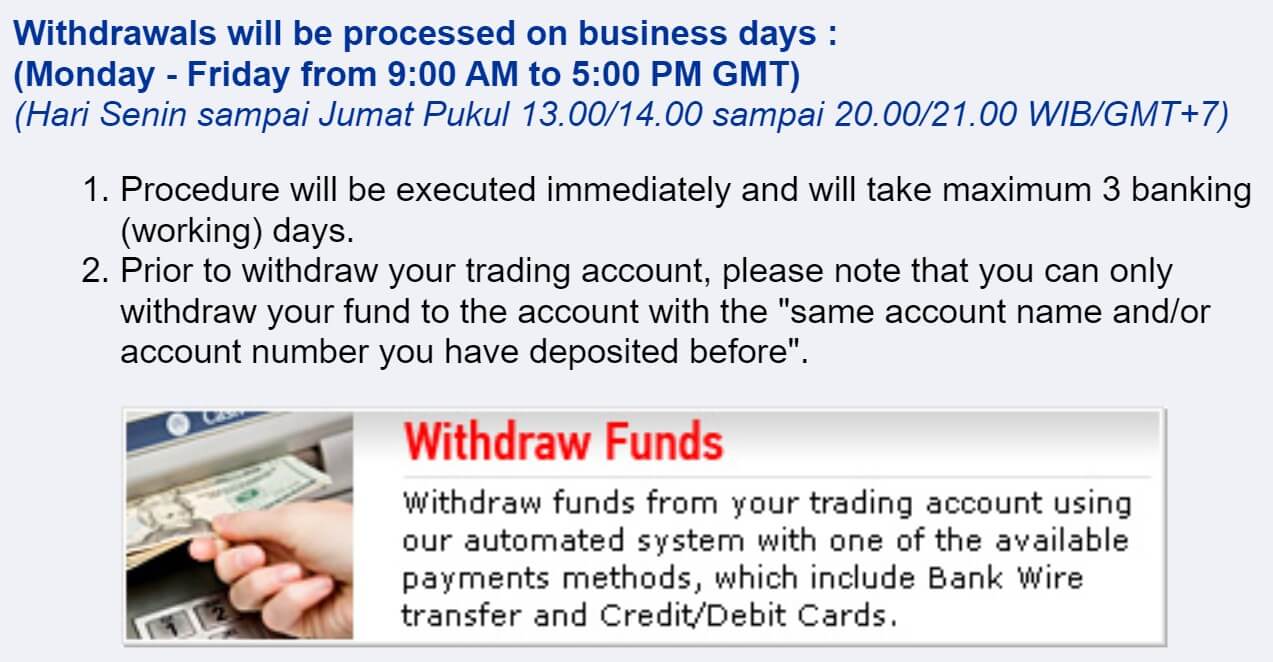
Withdrawal Methods & Costs
The same method is available to withdraw with, so just Bank Wire Transfers. Just like with the deposits, OMF does not charge when withdrawing your funds from them. You should also check your own bank for incoming processing fees.
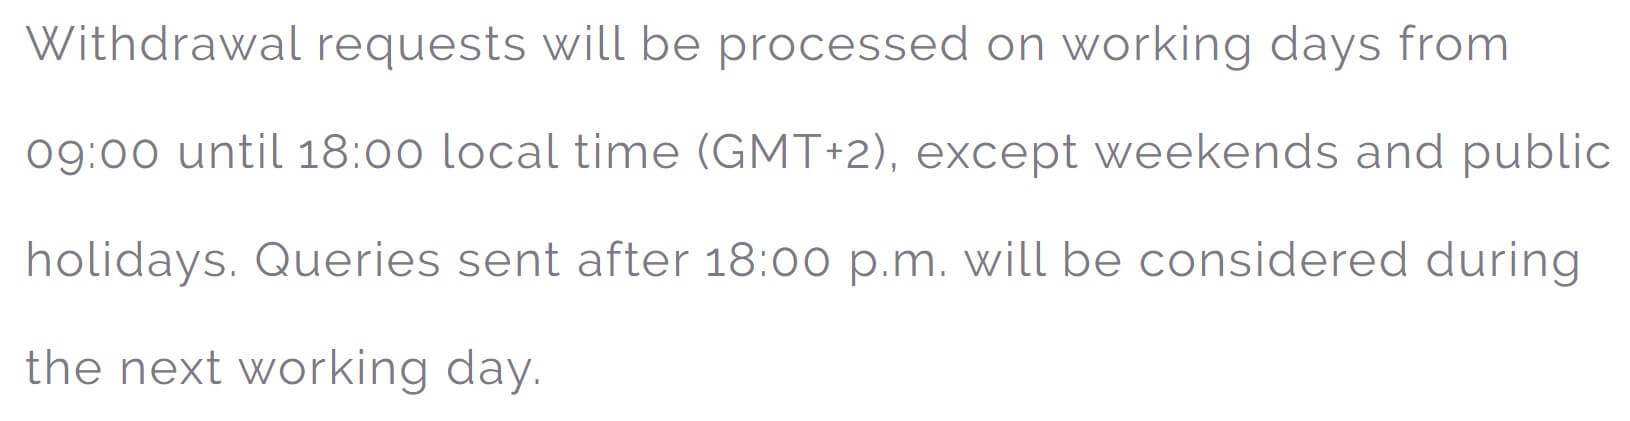
Withdrawal Processing & Wait Time
All withdrawal requests are processed the same day as they are requested, if not then they will be processed on the next working day. It will then take between 1 to 5 working days for your request to fully process depending on the processing speed of your own bank.
Bonuses & Promotions
It does not seem that there are any active bonuses or promotions. There is also no evidence that there have been any in the past.
Educational & Trading Tools
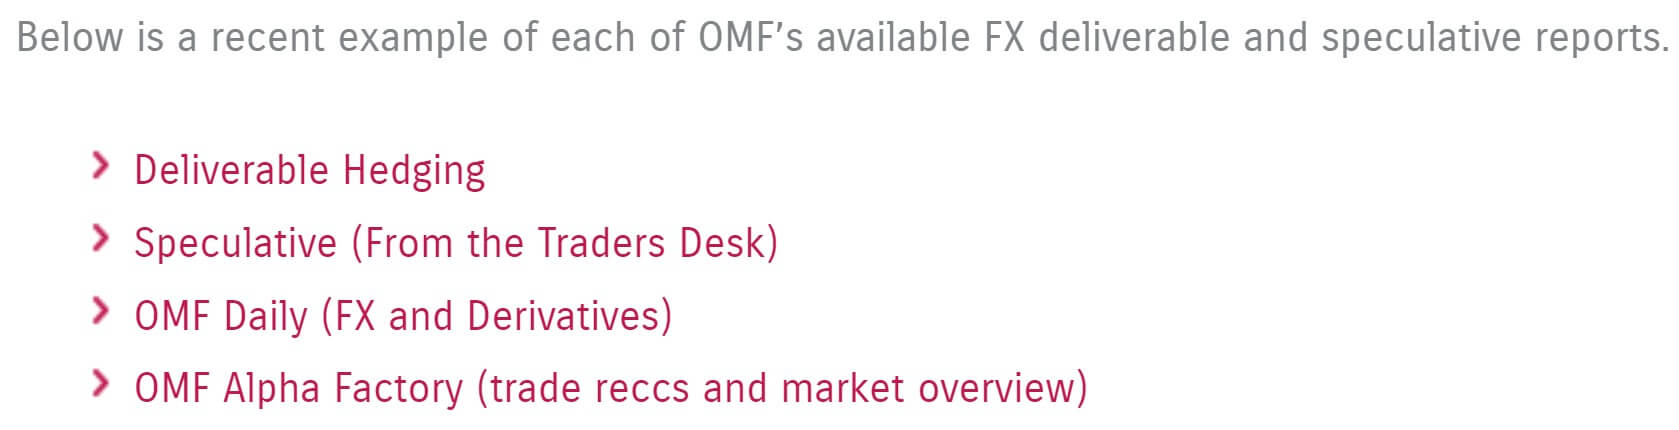
There are four pages that equate to the educational side of the site. The first are some webinars. We do not know how often these occur but the past once is available to watch on the site. They go over different aspects of trading and analysis. The next is Seminars, you will need to contact the support team to book and will need to live in New Zealand to attend. There are some videos about forex and trading however they have not been updated since August 2019. The final page has some financial reports, outlining what has happened in the past and also what they feel could happen in the future.
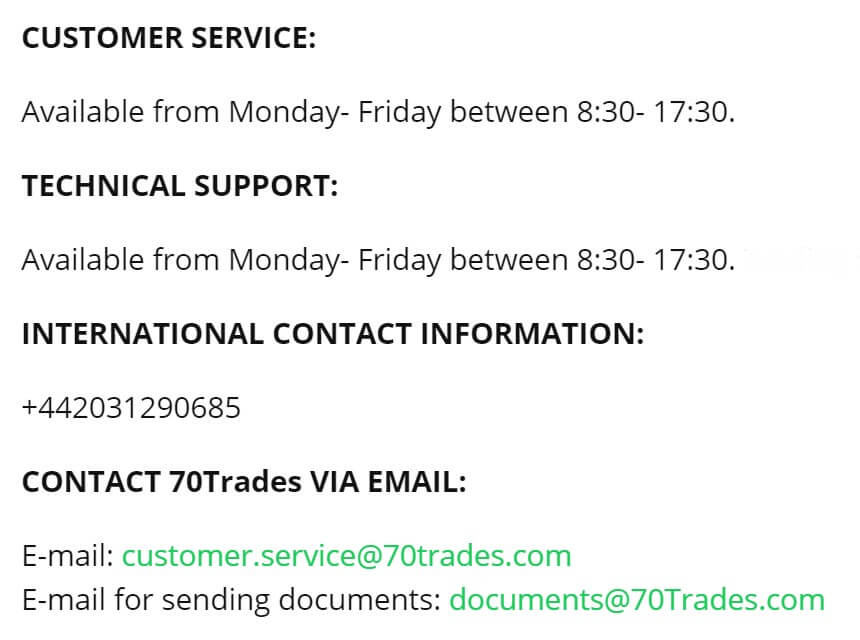
Customer Service
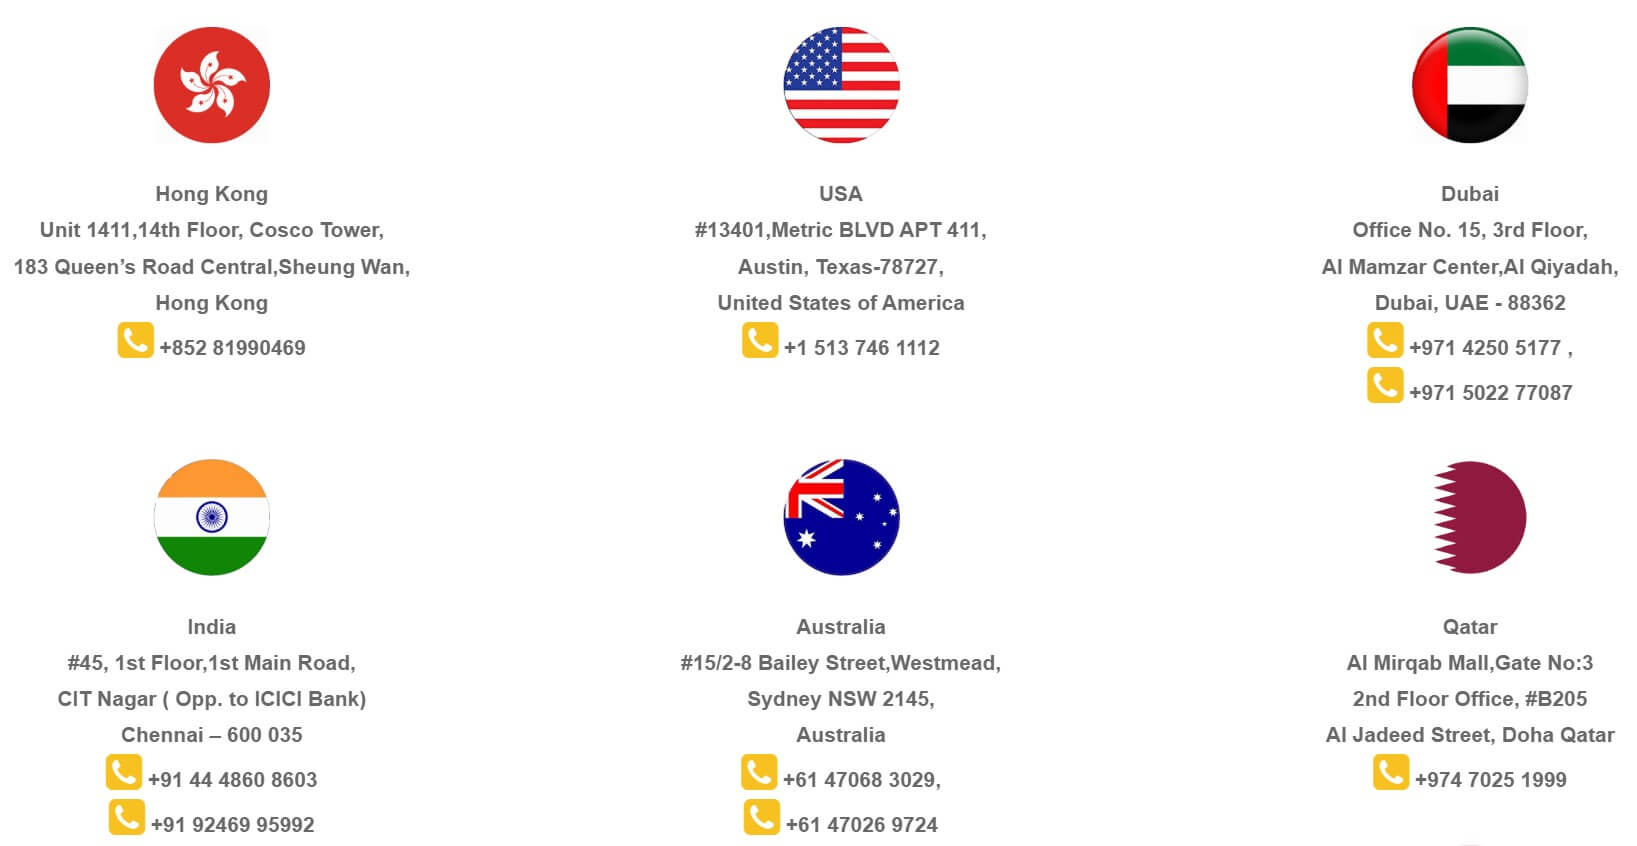
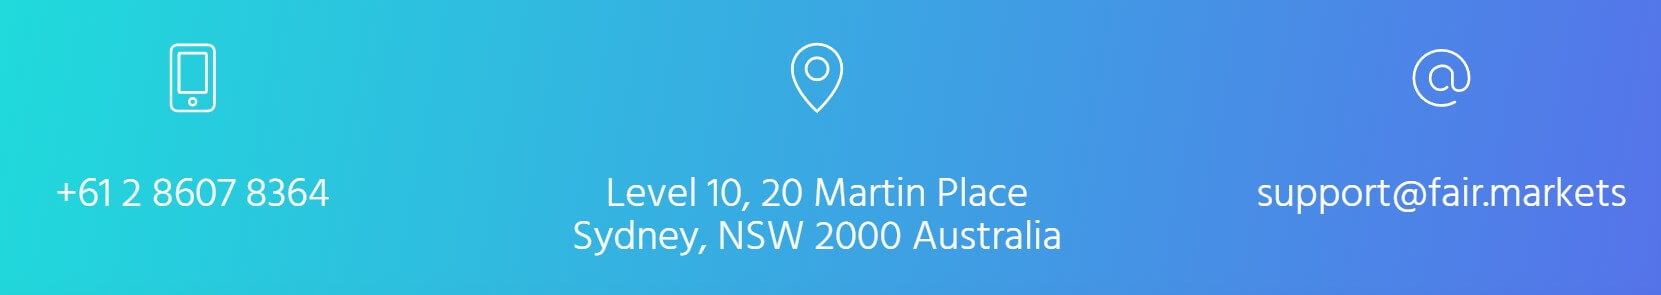
The customer service team is available 24 hours a day 5 days a week and is closed over the weekend and on bank holidays. They have departments in Aukland, Wellington, and Sydney and they provide a postal address, telephone number and email address for each one.
Auckland
Address: Level 2, 37 Galway Street, Britomart, Auckland
Phone: +64 9 520 9310
Email: [email protected]

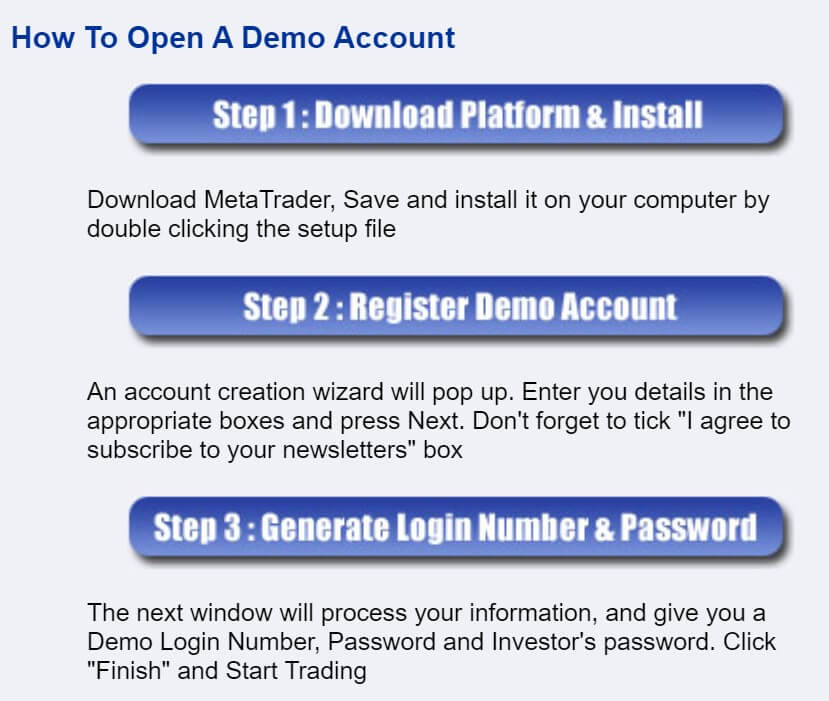
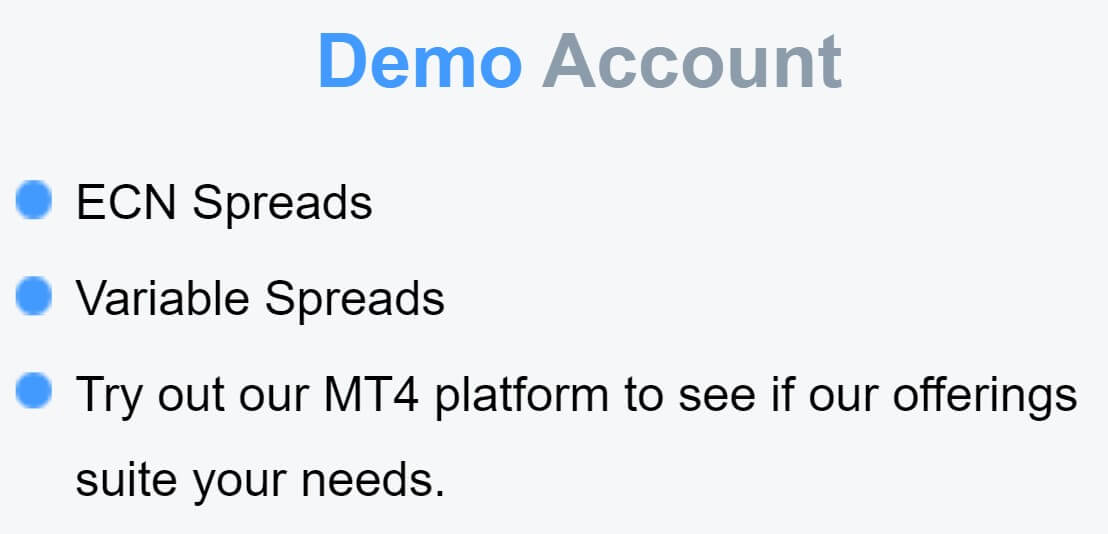
Demo Account
Free demo accounts are available for the cTrader platform, you can signup form on the site with a simple form. The demo account allows you to test out the trading conditions (that we have mentioned throughout this review) and strategies without risking any of your own capital.
Countries Accepted
This information isn’t available, but it seems like OMF is aiming their services more towards those that are living in New Zealand. However, if you are interested in joining, we would recommend contacting the customer service team to ensure that you are eligible for an account.
Conclusion
OMF is aiming its services towards the New Zealand trading community. The minimum deposit if 10,000 NZD which can price out newer traders. There is also just one way to deposit which can be a little limiting. In terms of the trading conditions, the spreads are acceptable, but the commissions have been put in such asway that it can be a little confusing as to how much you will pay. This isn’t made any better with the lack of product specification or breakdown, so we do not really understand how much it will cost and also not what we can actually trade. There are plenty of ways to contact the customer service team which is a plus.


 Assets
 Educational & Trading Tools


 Platforms
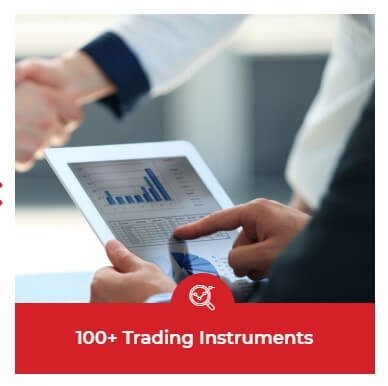
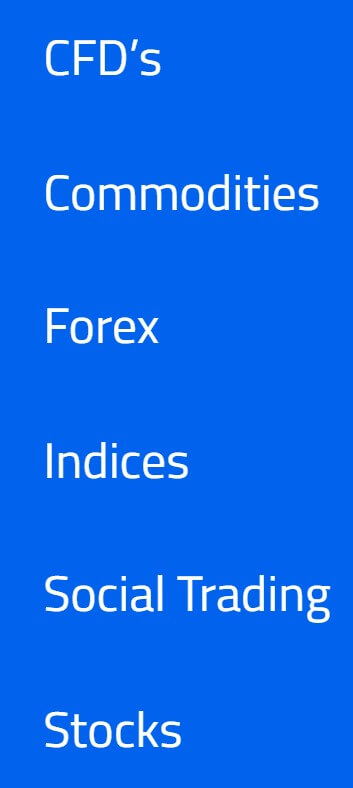 There are plenty of assets and instruments available, and we have outlined them below.
 Phone: +44 208 089 2065
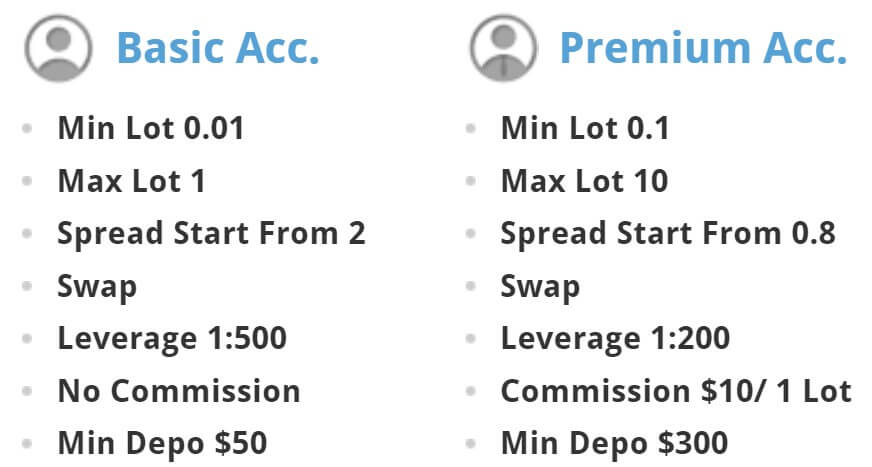
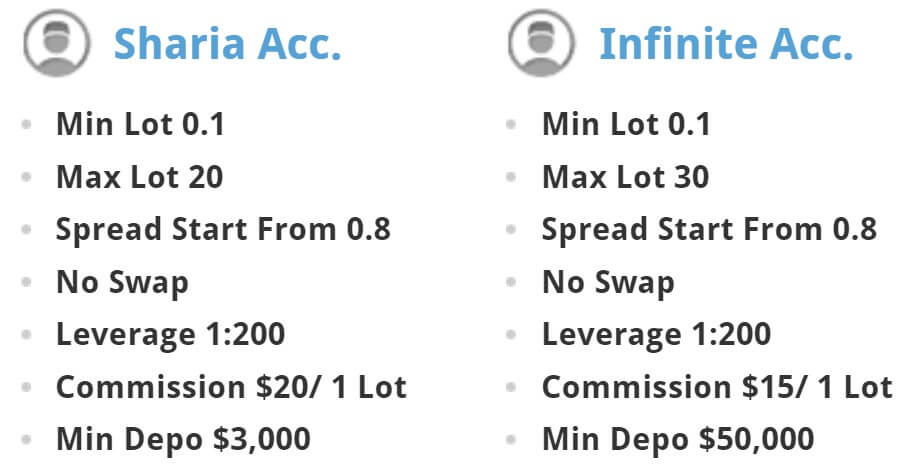
 Account Types


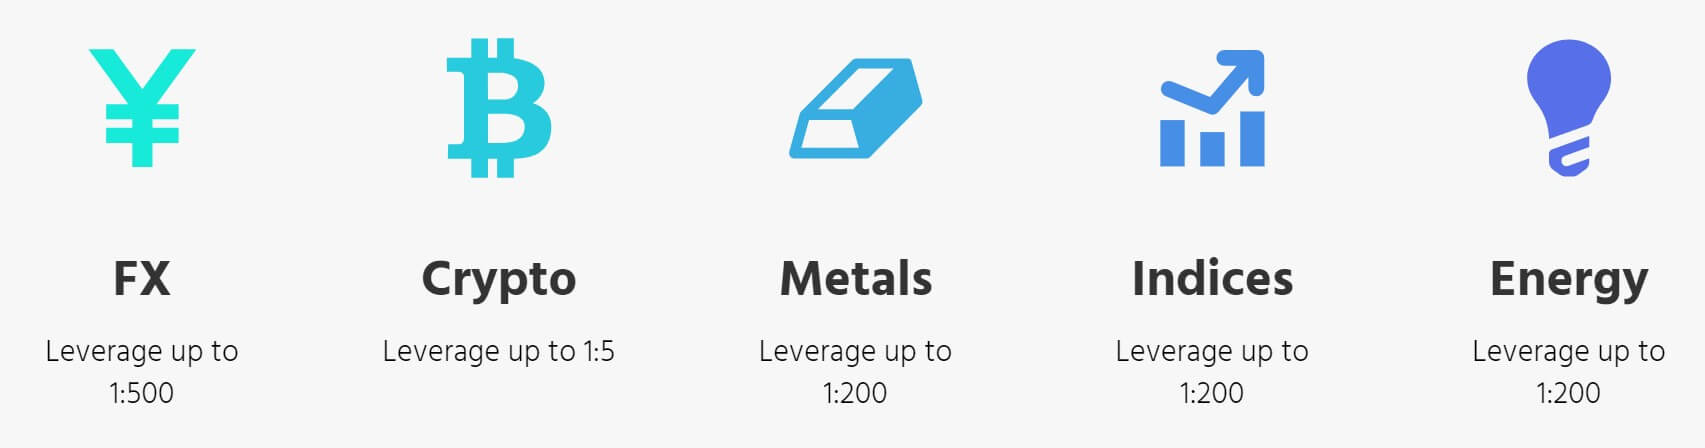
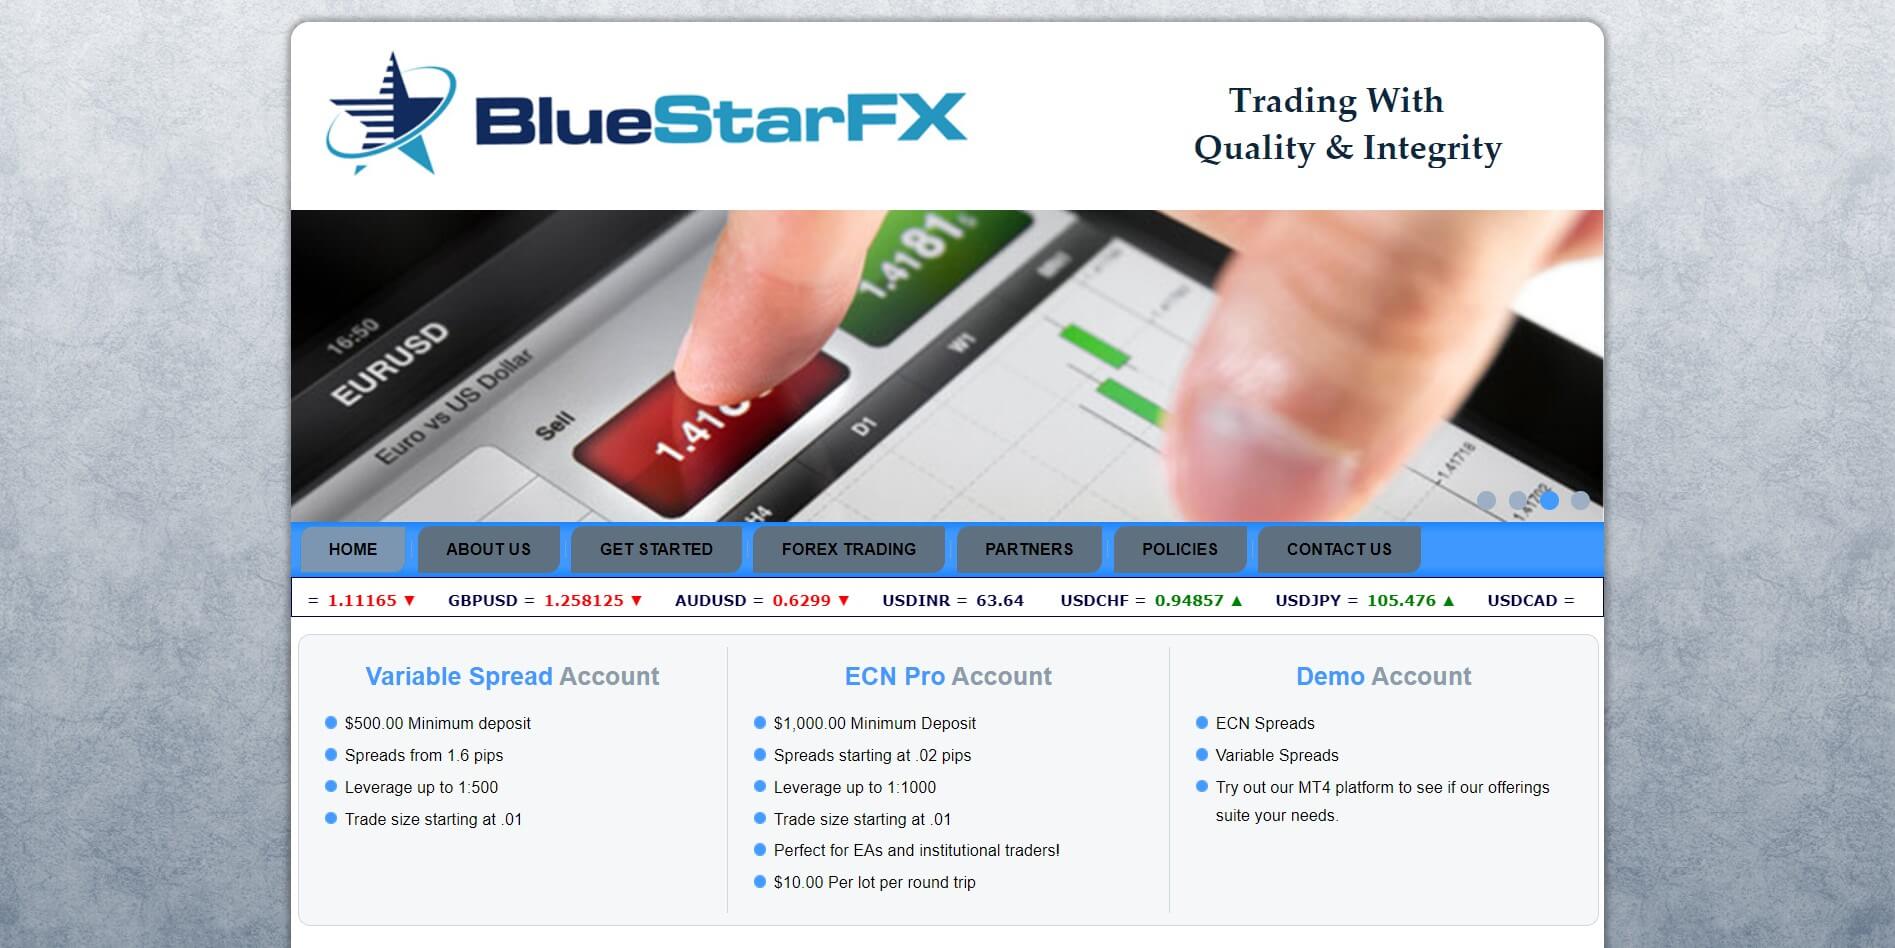
 The leverage stated on the main page of the site is 1:200. This is all we have to go on as the accounts page doesn’t actually detail any differences in trading conditions and there are none mentioned anywhere else so it seems that all accounts have the same leverage. This can be selected when opening an account and we are not sure if it can be changed once an account has already been opened. Typically,
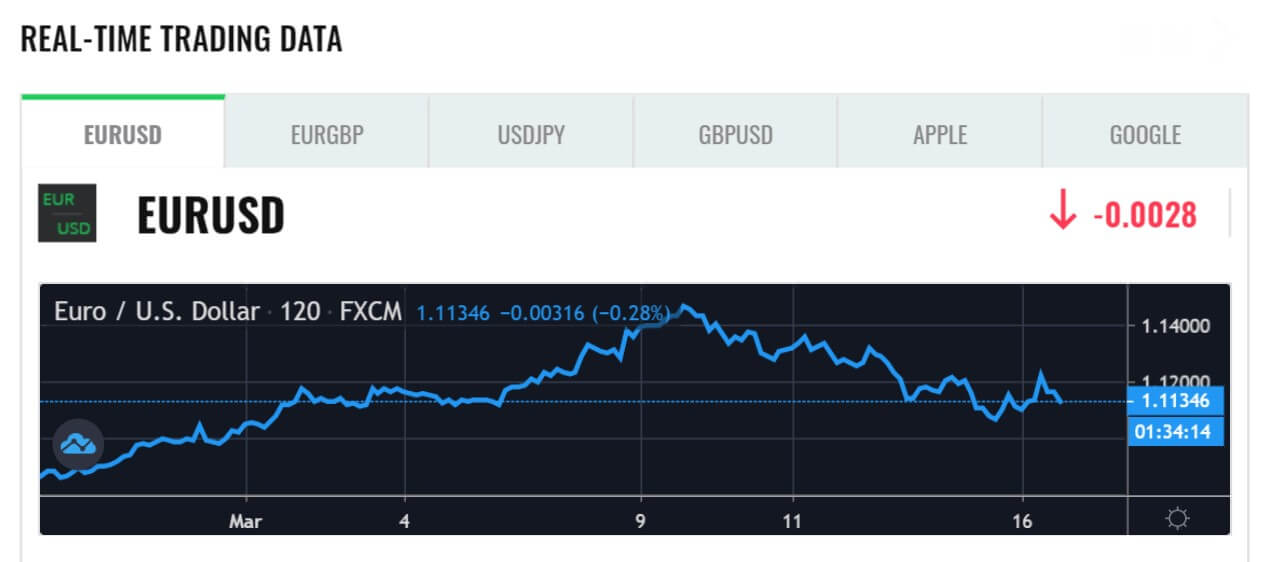
  The only spreads that we have to go on are what is mentioned on the home page of the site. It states that the spread for EUR/USD is 1.6 pips. This is the starting spread as they are variable which means they will move with the markets. Different instruments will also have different starting spreads, 1.6 pips is the smallest they will be. It would be helpful for the broker to provide a full list of average spreads for most of the major assets.
 Sadly there isn’t a dedicated page for funding, the only information we have is some images at the bottom of the website. They indicate that Visa, Maestro, MasterCard, Neteller, and AstroPay are available to use, but we have no confirmation of this. We also do not know if there are any added fees when depositing.
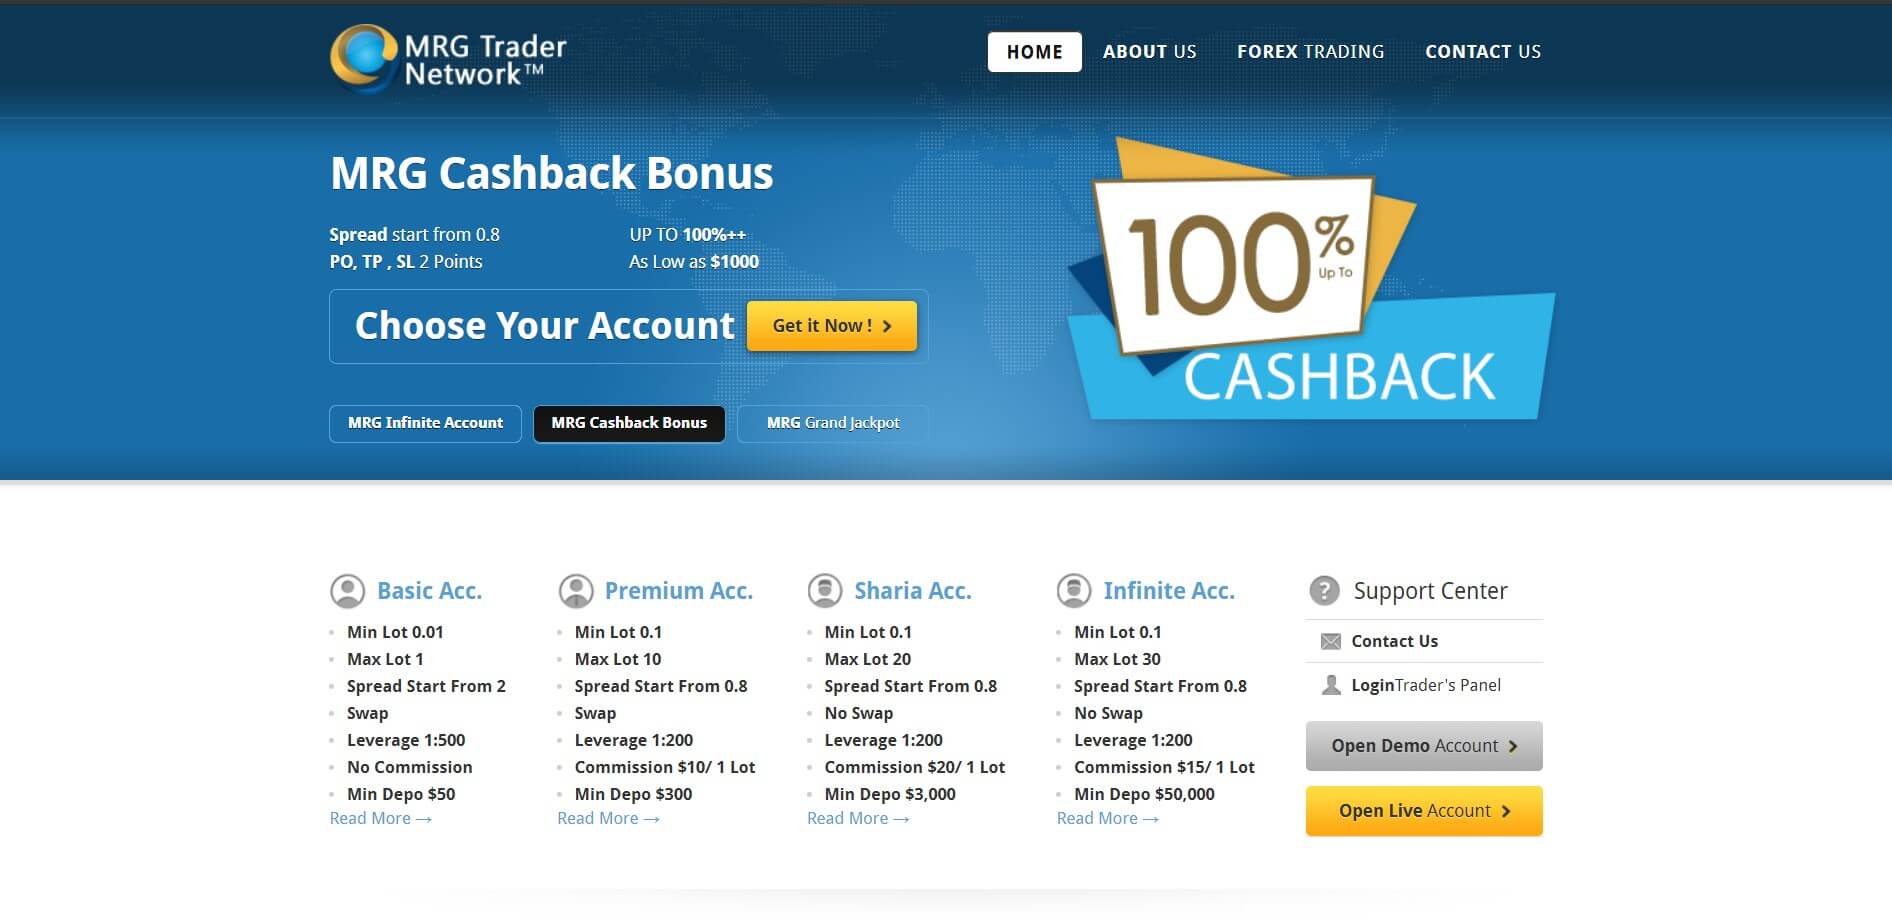
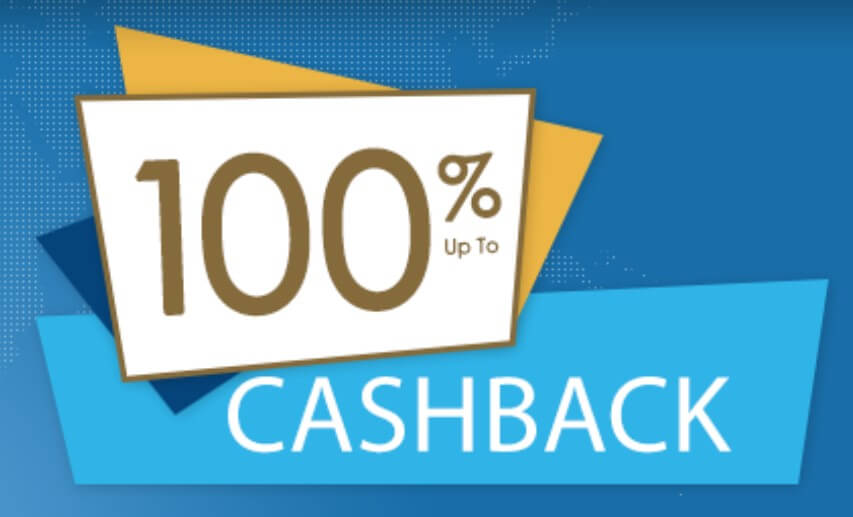
 When signing up for an account there is a bonus mentioned. There is a 100% welcome bonus however the terms of the bonus are rather confusing. It states that if you make a deposit of at least $5,000 you will receive a bonus of $1,500, which indicates that it is a 30% bonus and not a 100% bonus. As there are not dedicate terms and conditions for this bonus we do not know which one actually is or how to convert the bonus funds into real funds.
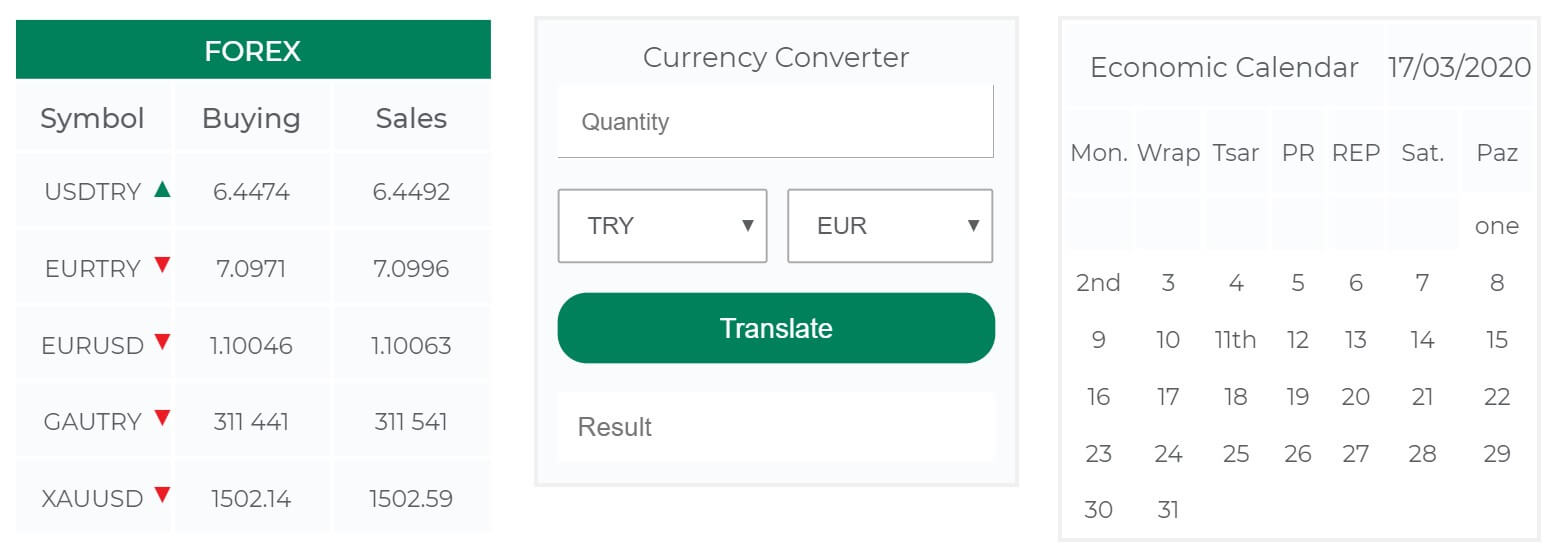
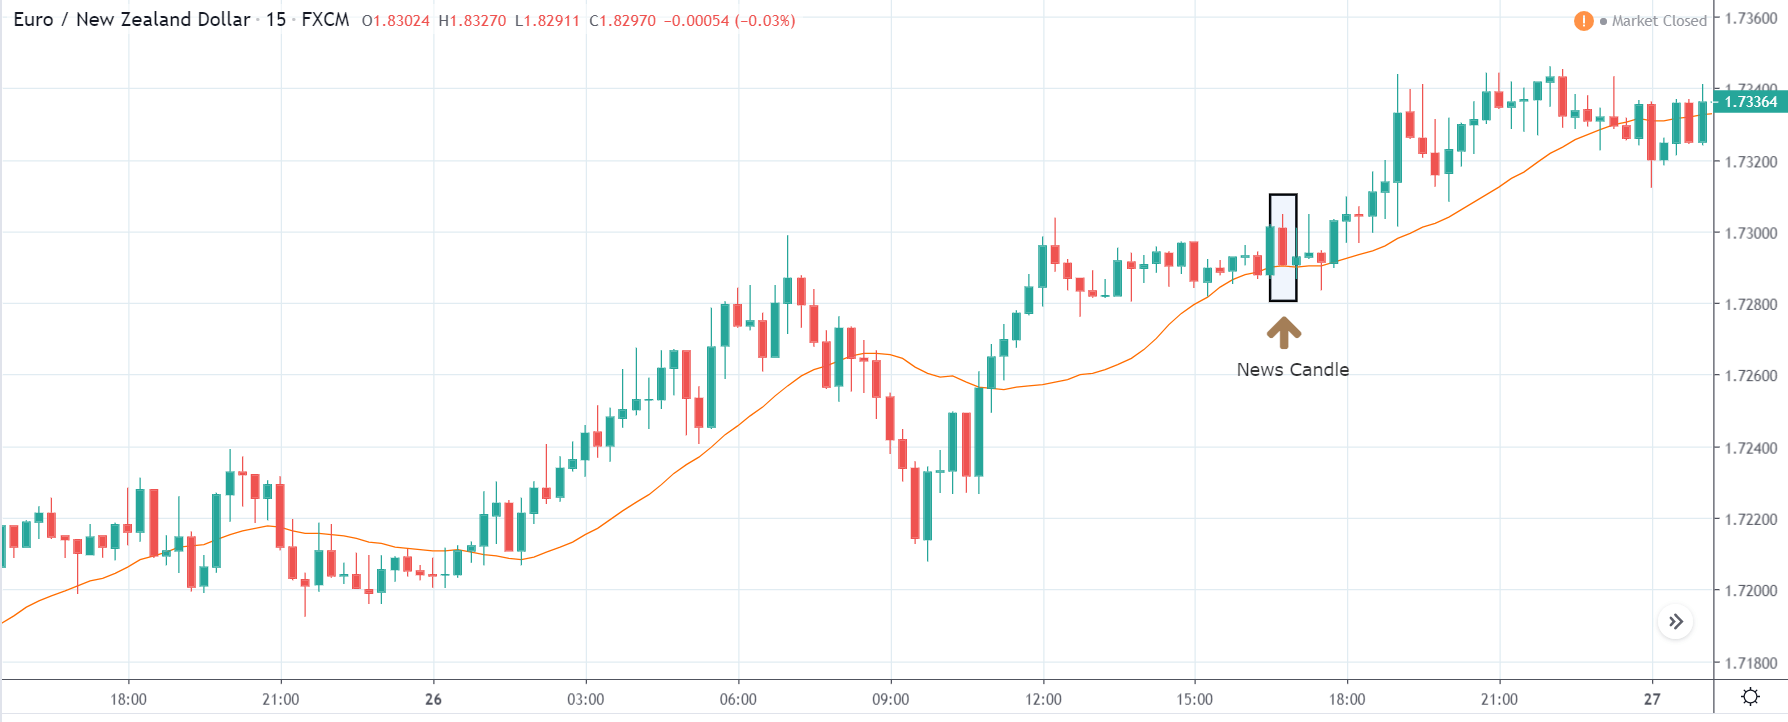
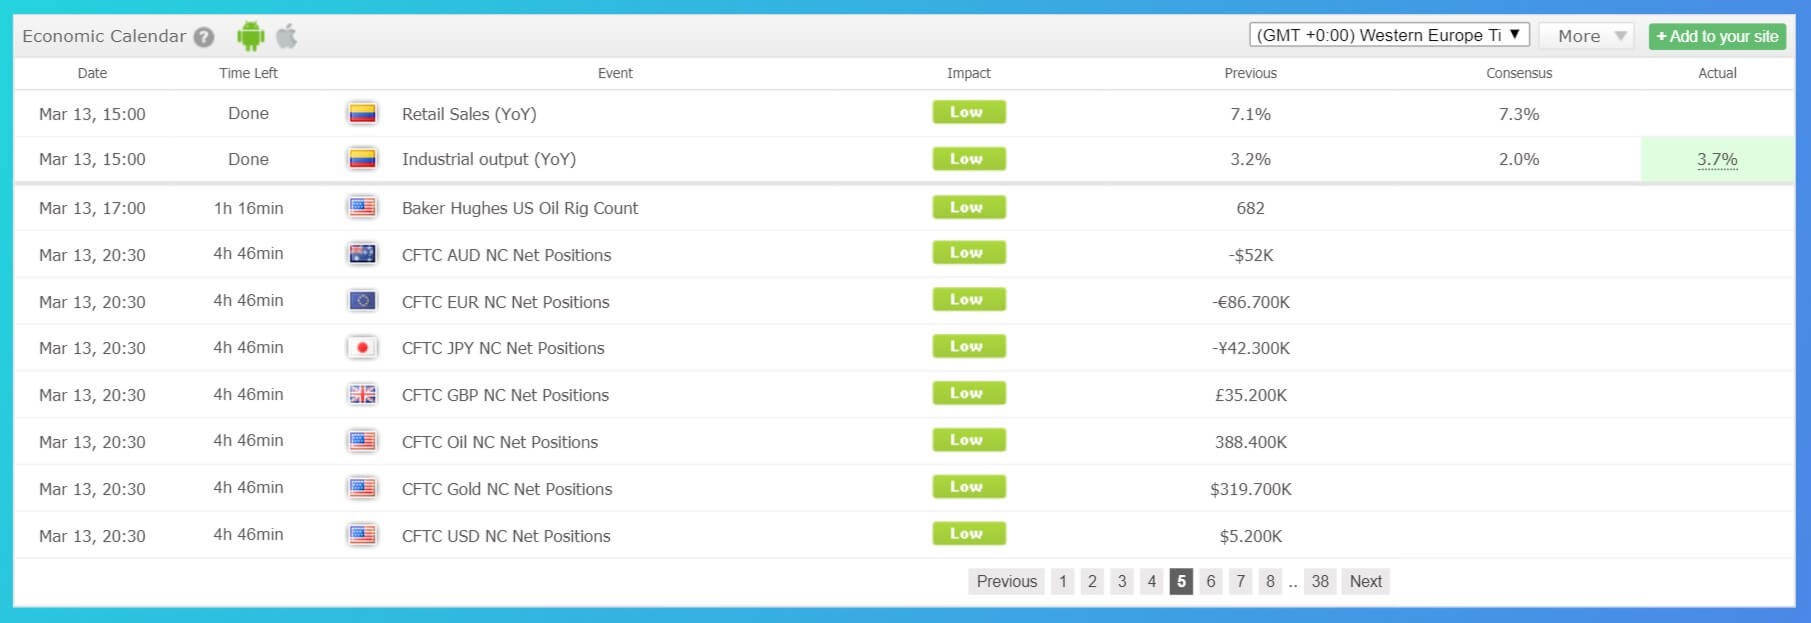
 There is a news section of the site which details news from around the world which could be affecting the markets. There is also an economic calendar available that details different upcoming news events and the currencies or markets that they may affect.

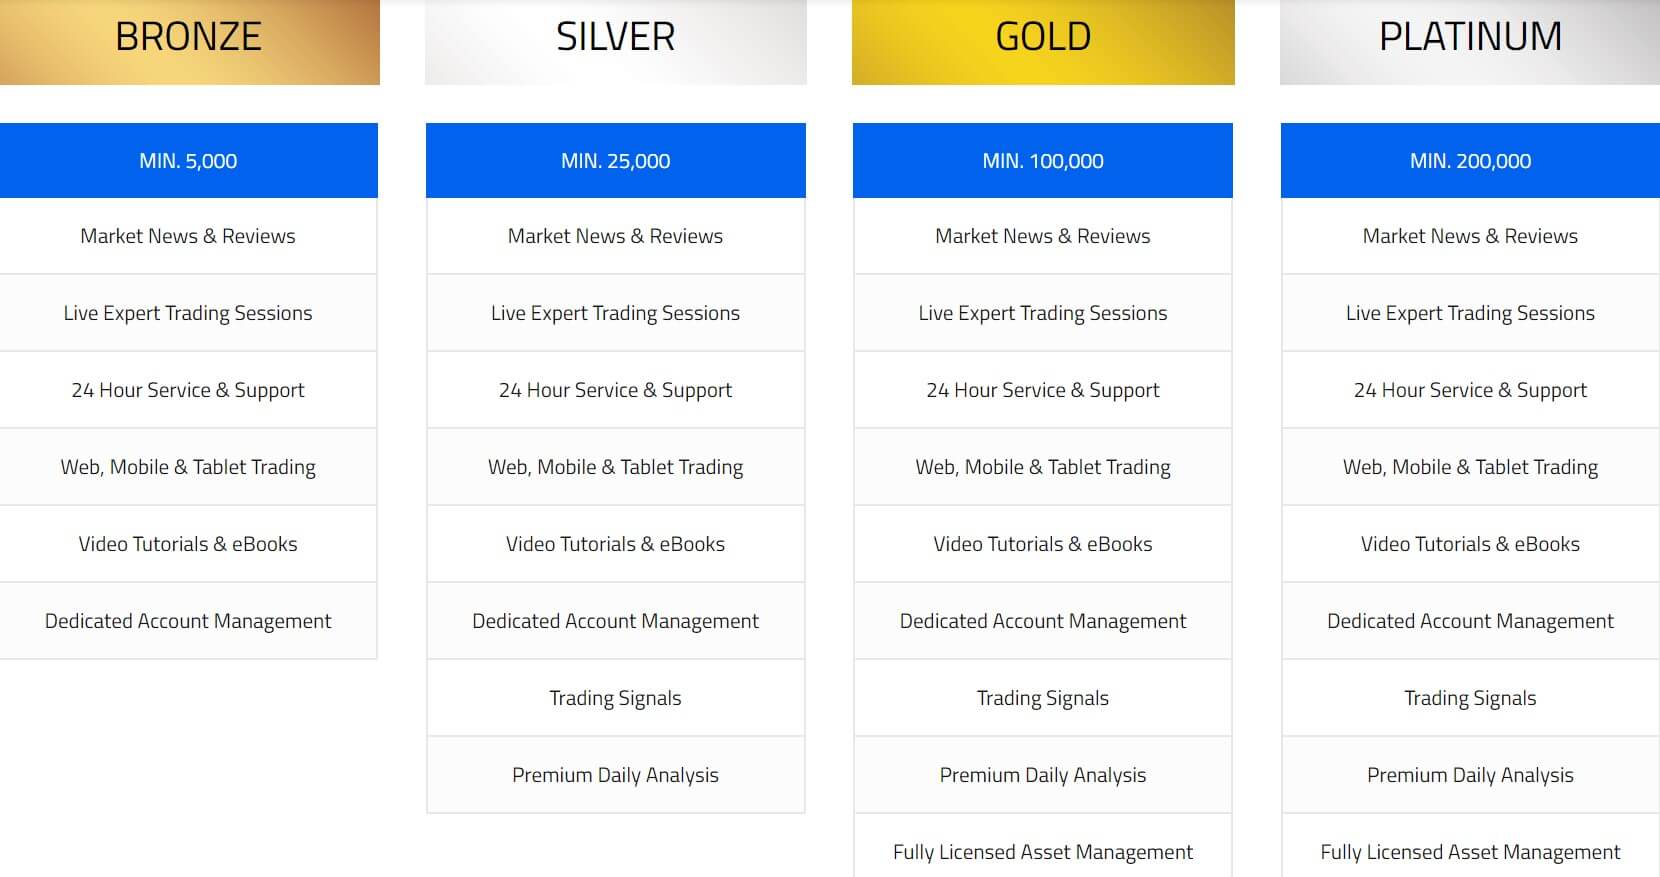
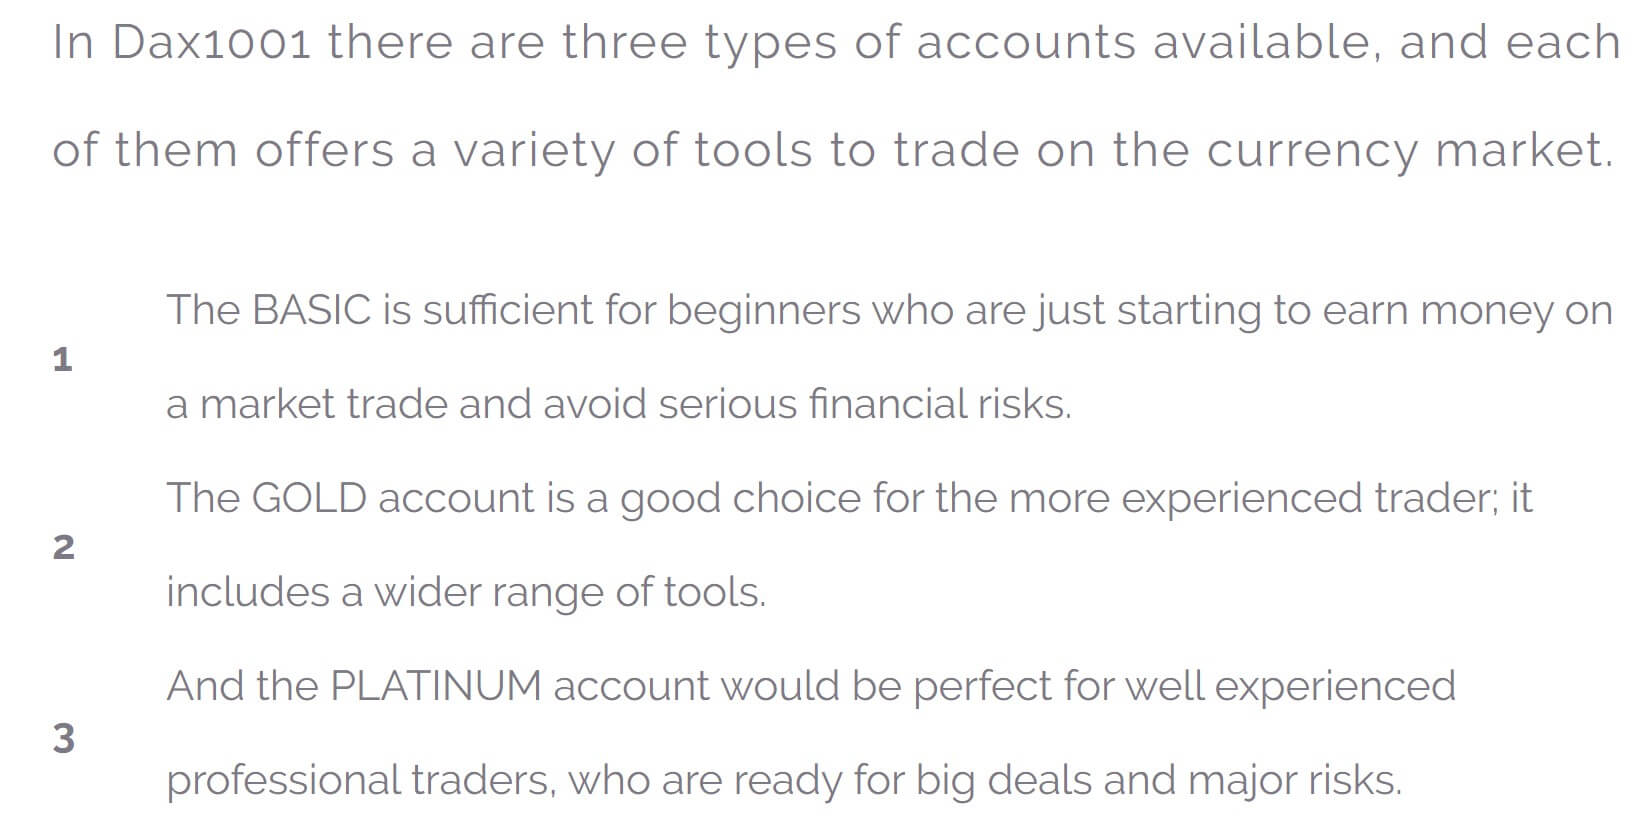
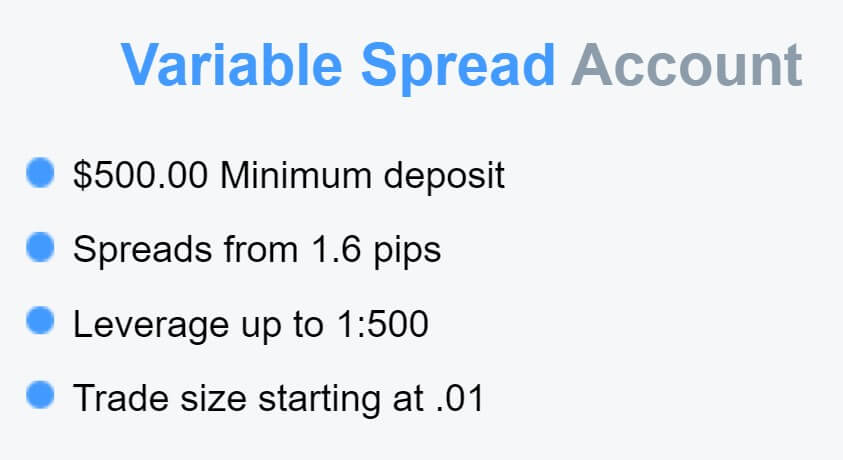
 Entry Account:
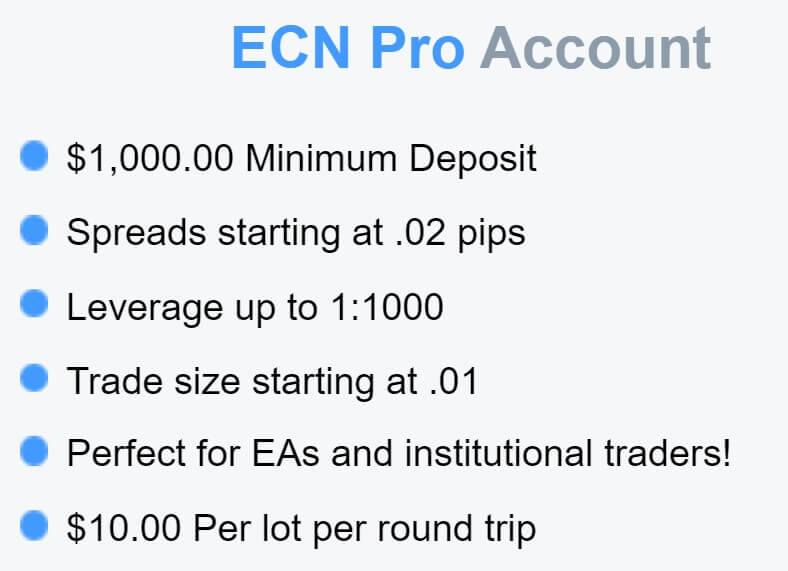
 Pro Account:
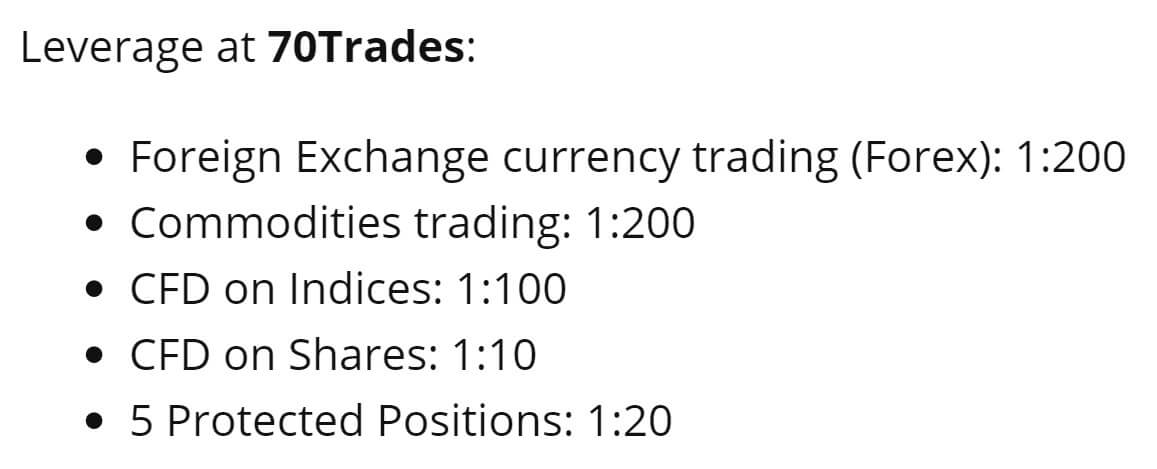

 Trading Costs
 Forex:
 Minimum Deposit
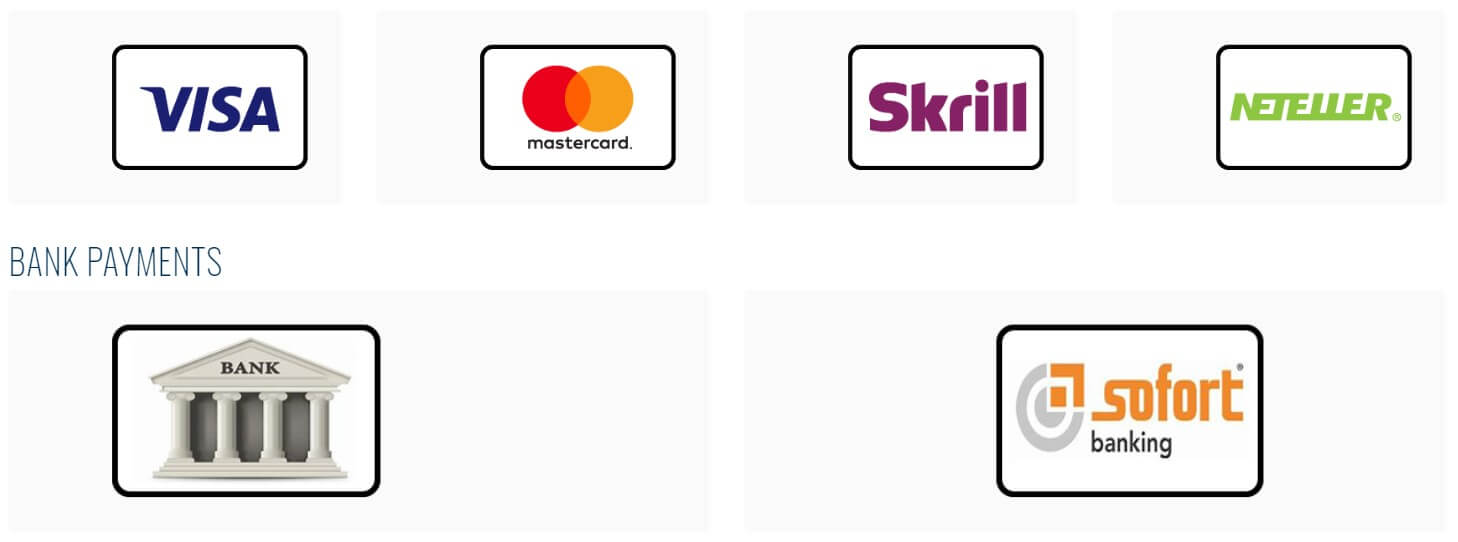

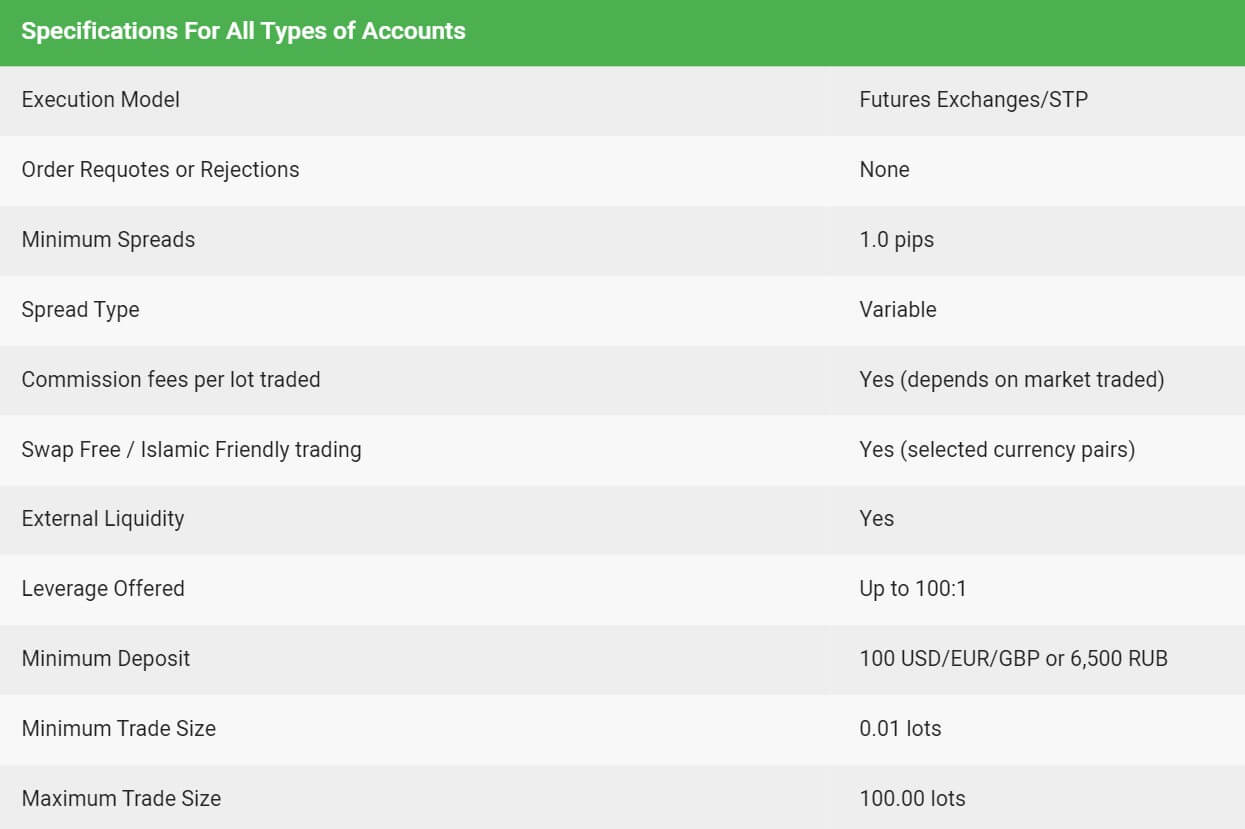
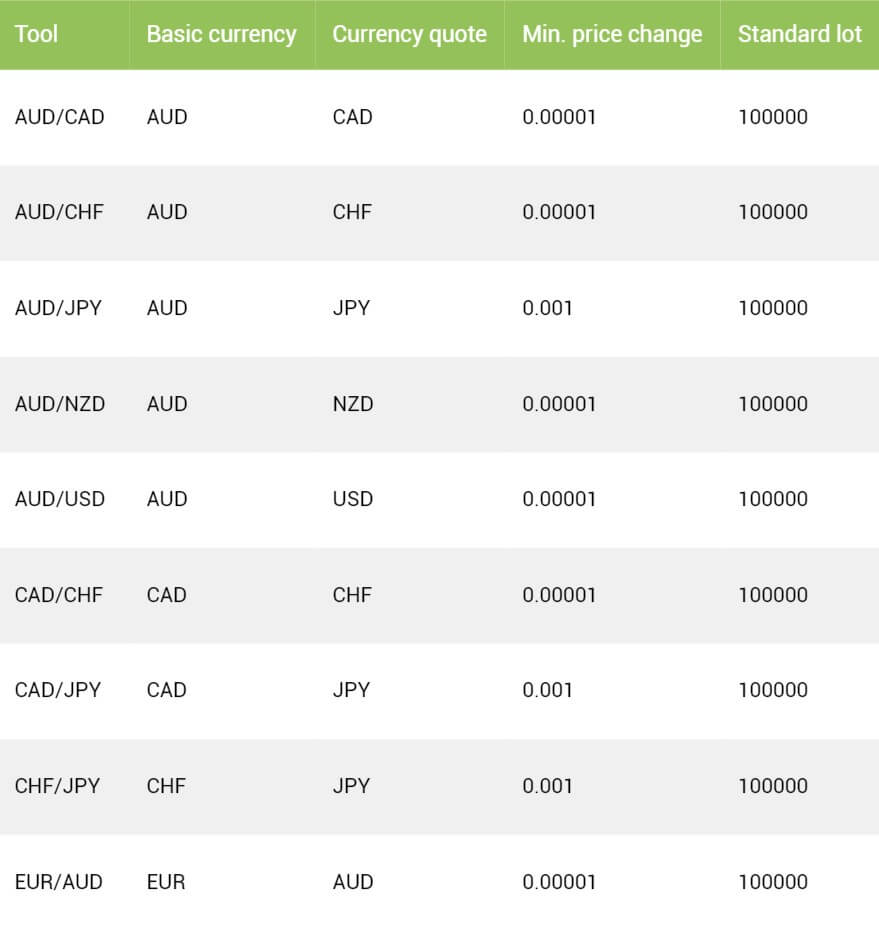
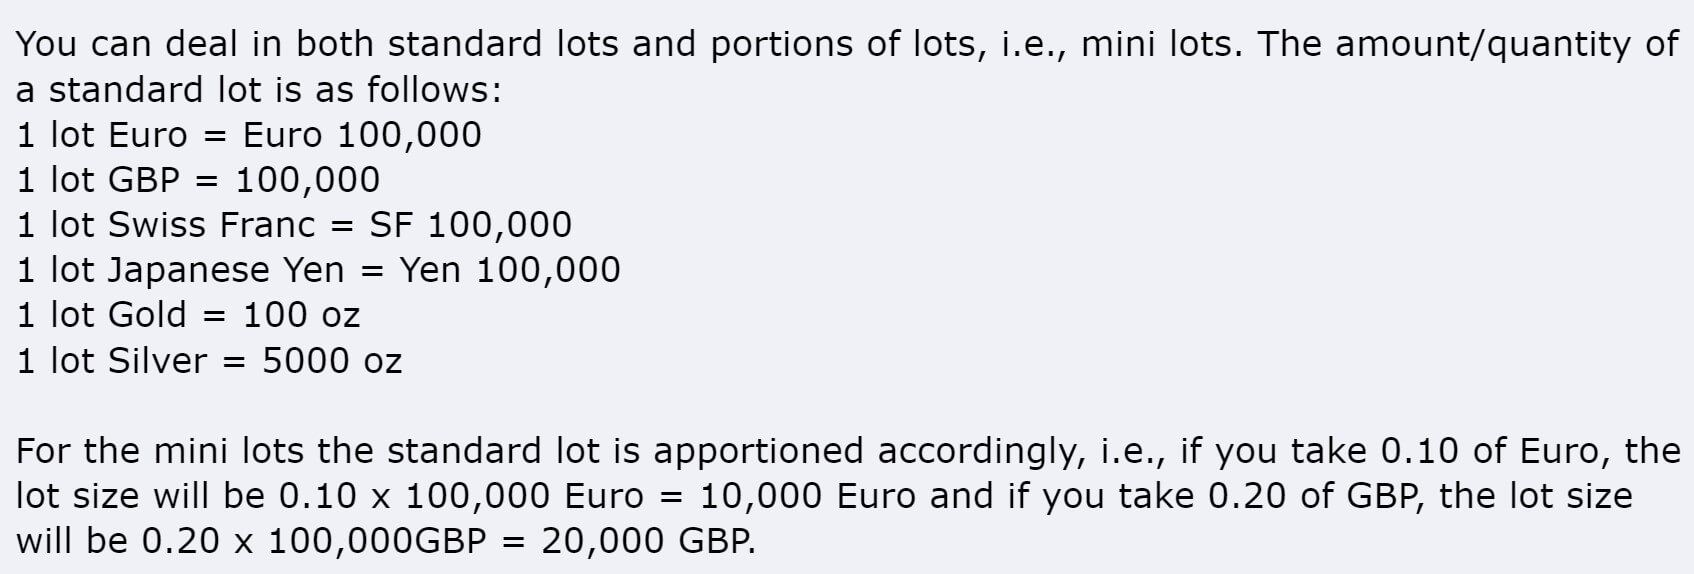
 Demo accounts are available and allow you to test out the servers, conditions, platforms, and new strategies without any risk to your own capital. The demo account offers conditions such as spreads starting from 1 pip, this is a variable spread, it is commission-free, swap-free, can be leveraged up to 1:100, can have a minimum balance of 100 USD/EUR/GBP. The trade sizes start from 0.01 lots and go up to 100 lots with a lot being worth 100,000 base currency units.
 We would advise not trading over 50 lots in a single trade, but instead break up larger requests into smaller trades to help with execution and slippage issues.
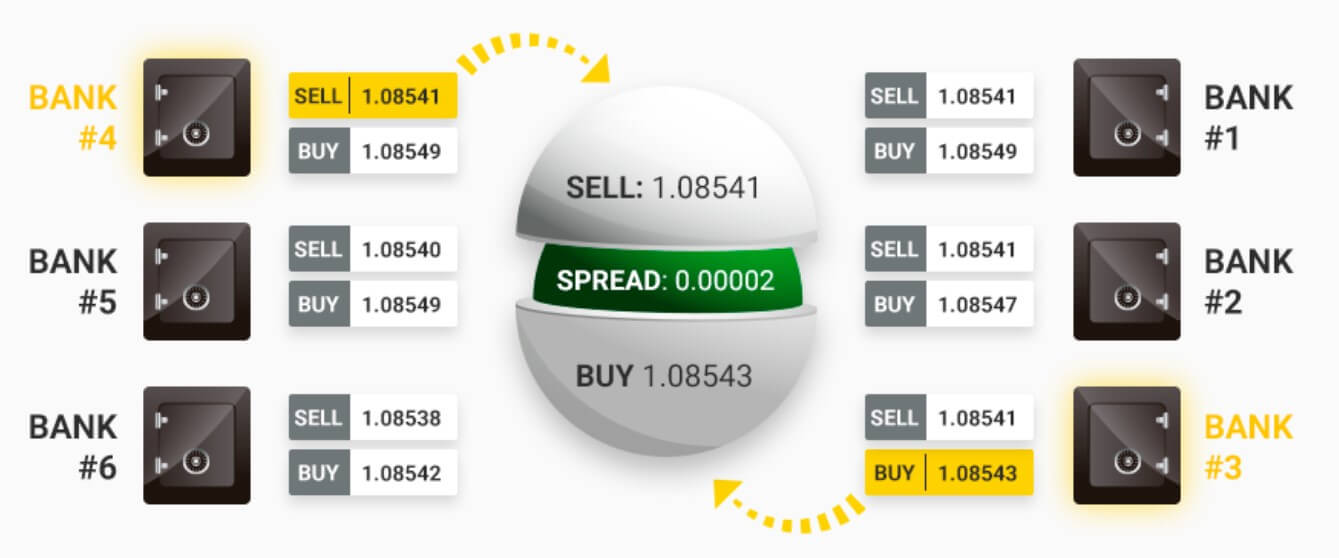


 Leverage
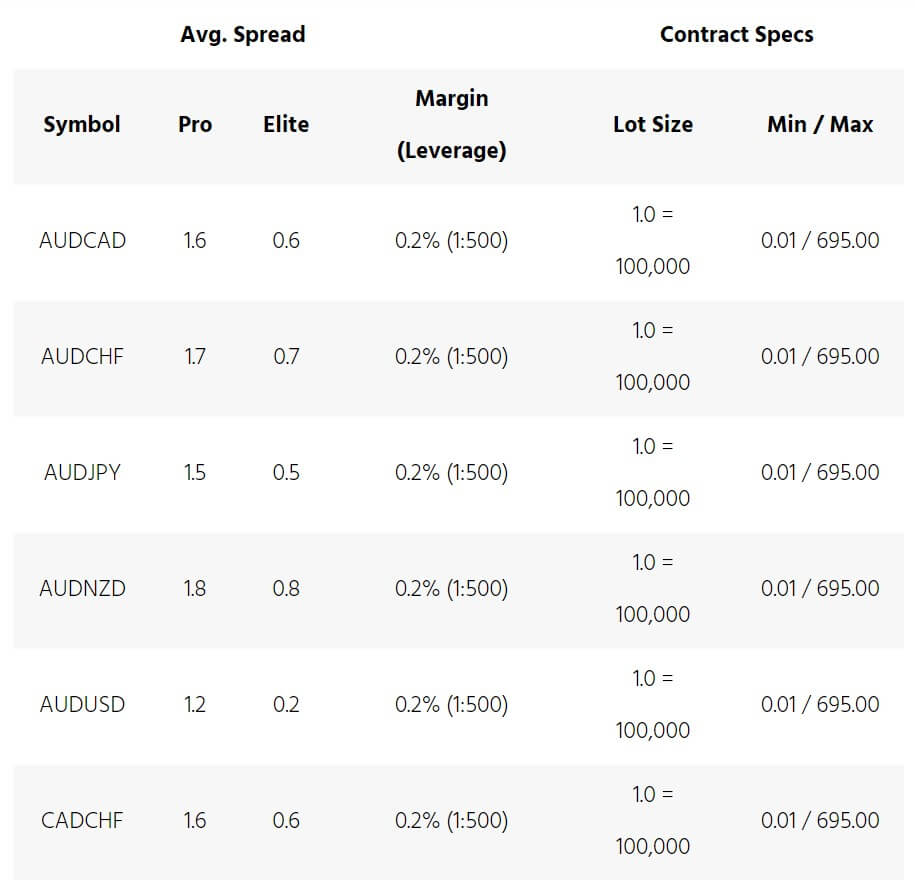
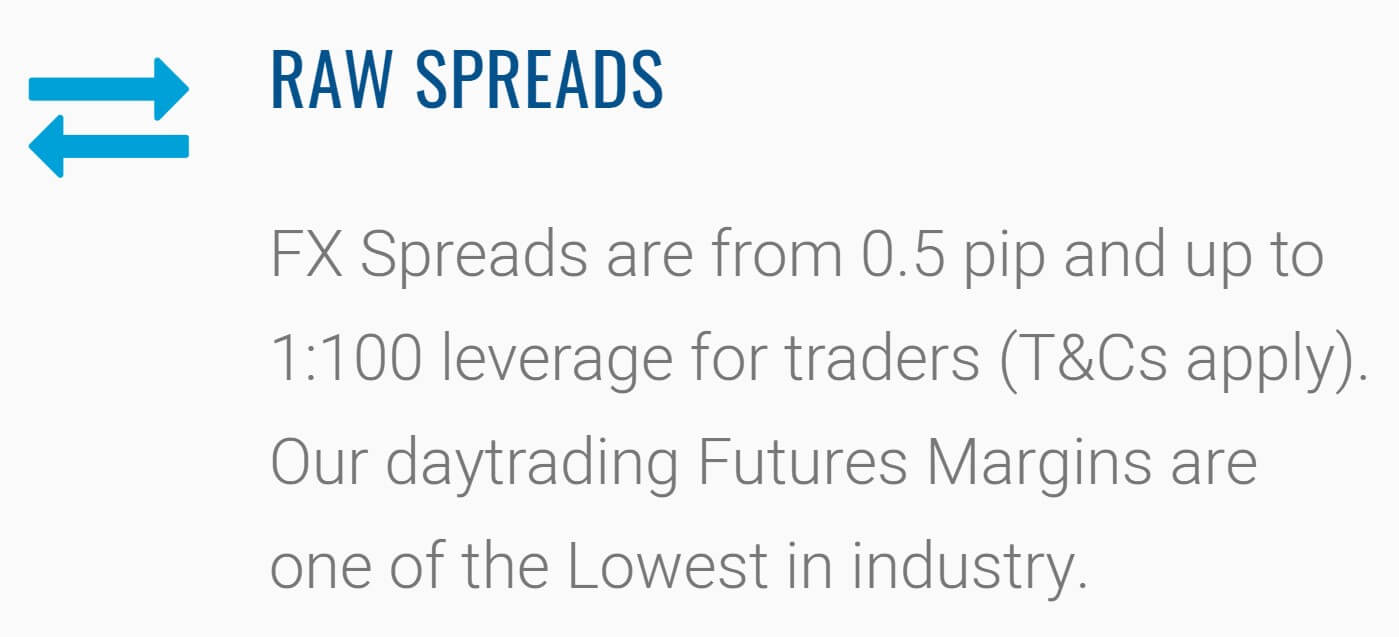
 The spreads you receive depend on a few different factors, the first being the account you are using. The Pro account has spreads starting from 1 pip while the Elite account has spreads starting from 0.1 pips. The spreads are variable (also known as floating) so this means that when the markets are being volatile, the spreads will often be seen higher. It is also important to note that different instruments and assets have different starting spreads. So while EURUSD may start at 1.
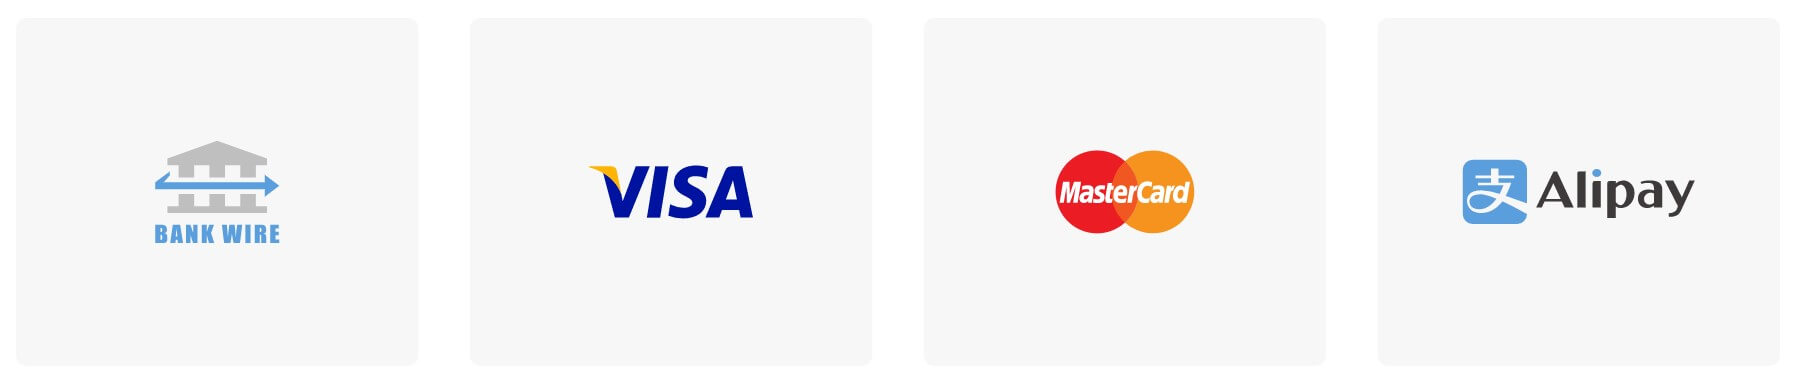
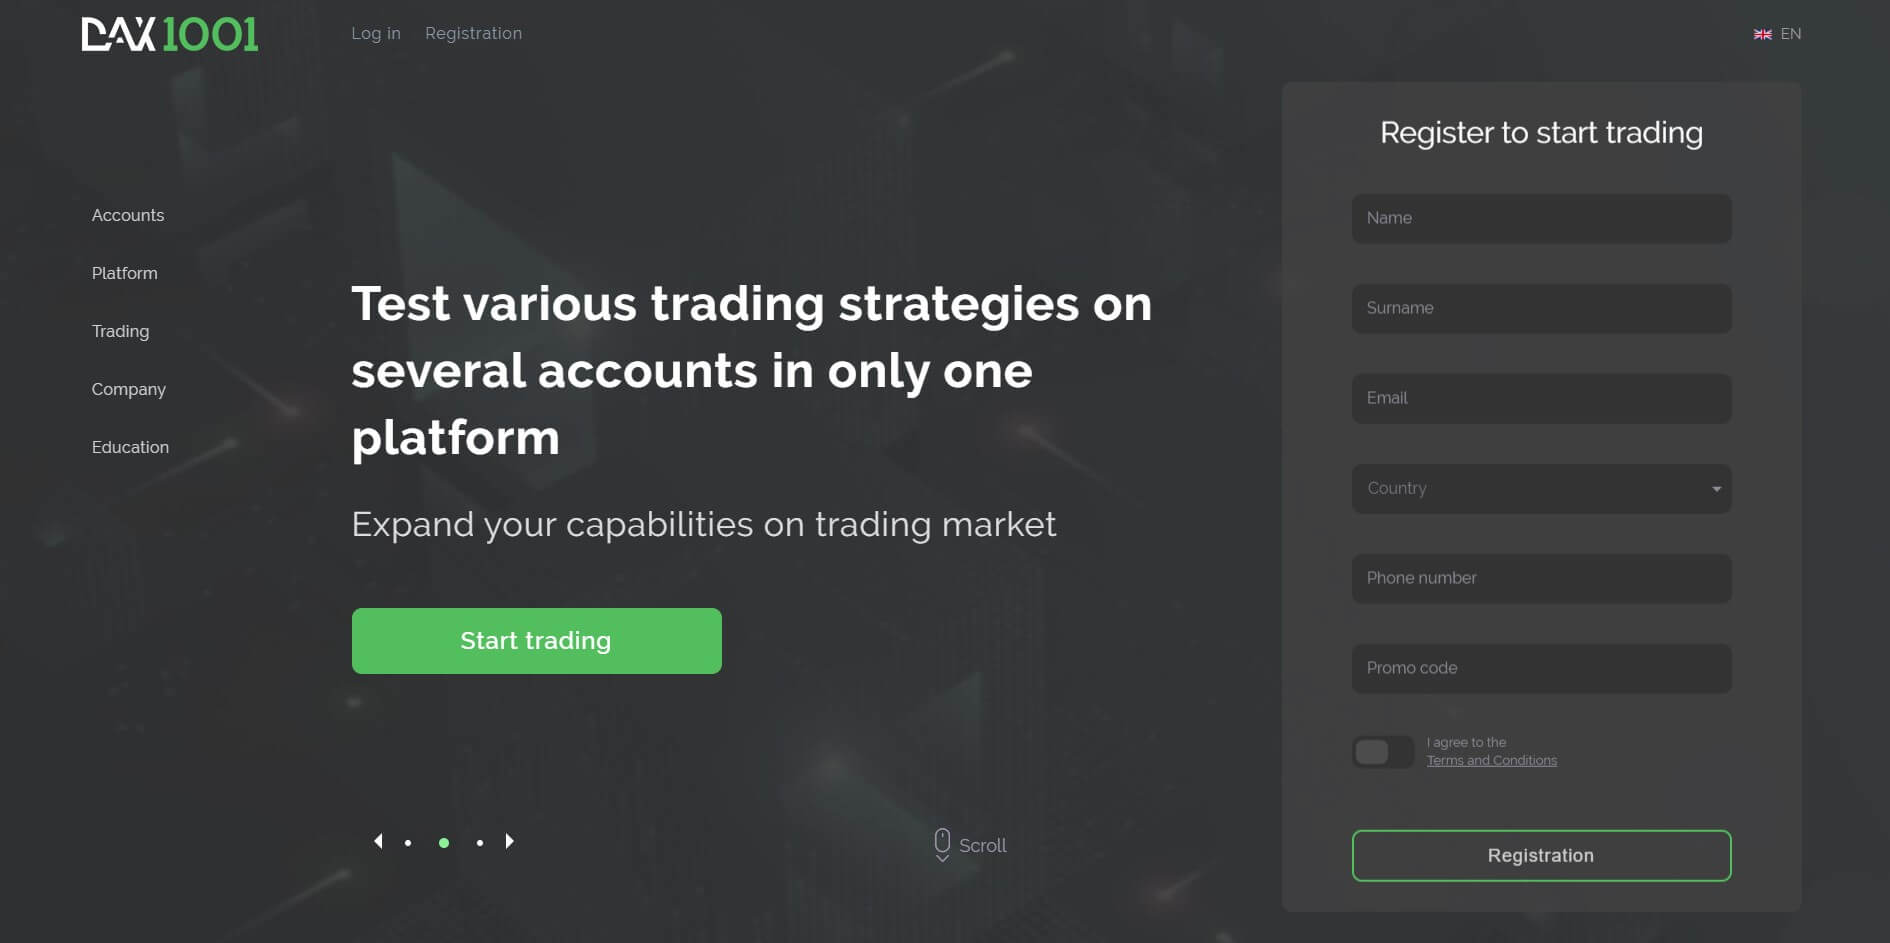
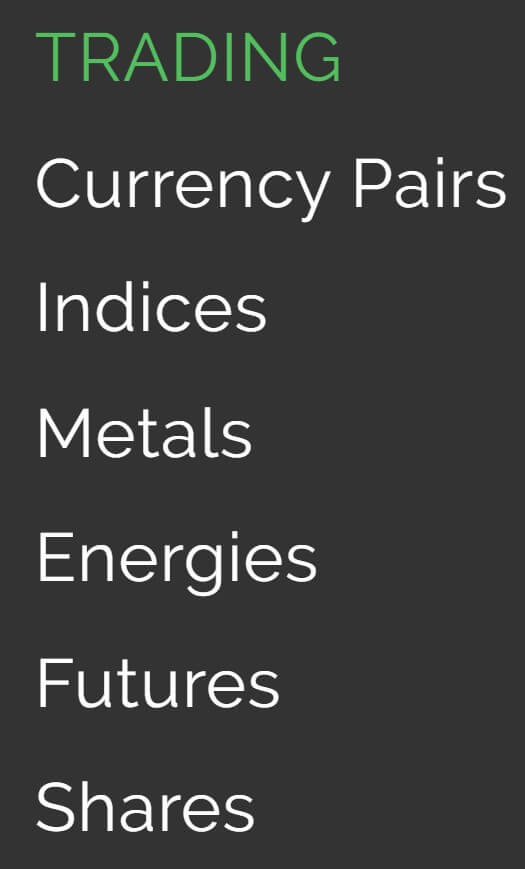 The assets on Dax1001 have been broken down into various categories. Unfortunately, there is not a full breakdown of the available assets. We have outlined the information we do know in each category below.


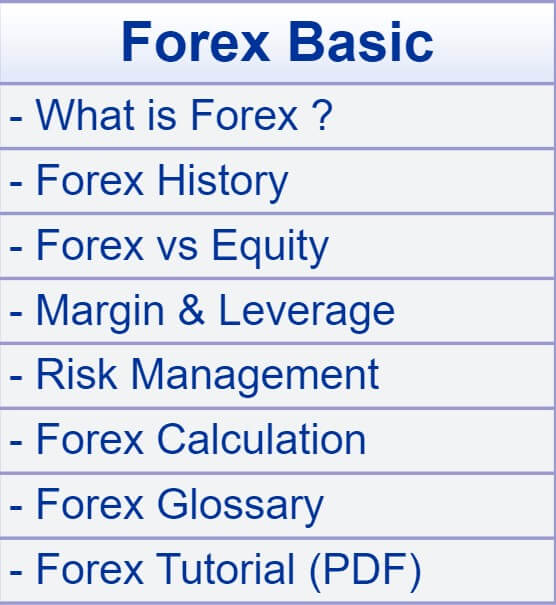 There are some very basic information pages provided which make up the majority of this section, they cover topics such as: What is Forex?, Forex History, Margin & Leverage, What is CFD?, Technical Analysis and Fundamental Analysis. There is also a

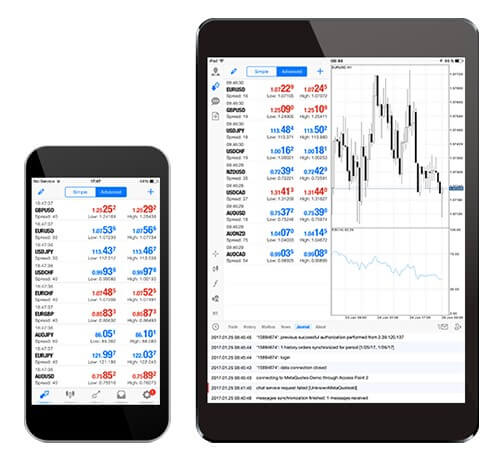
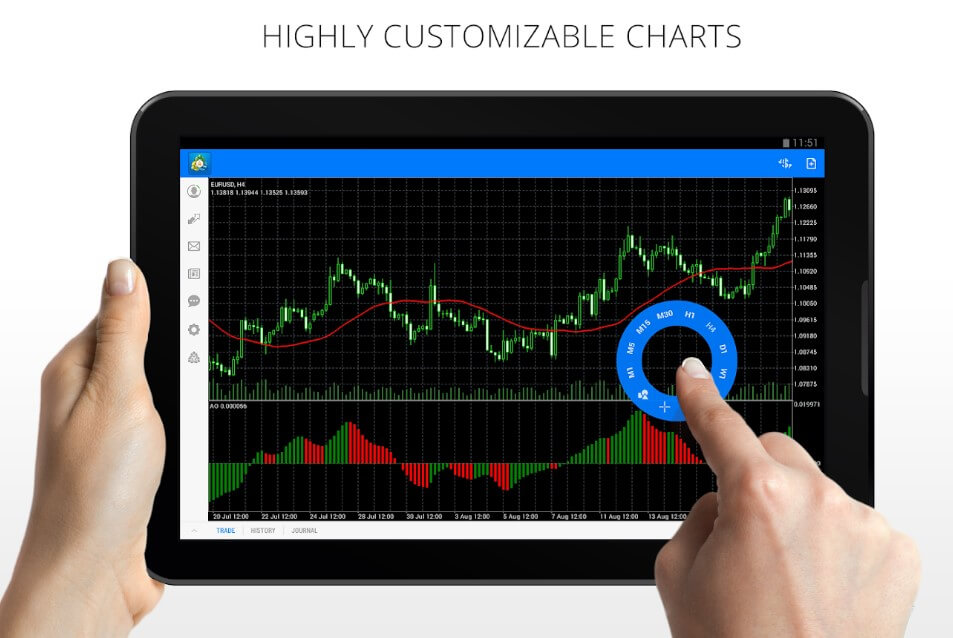
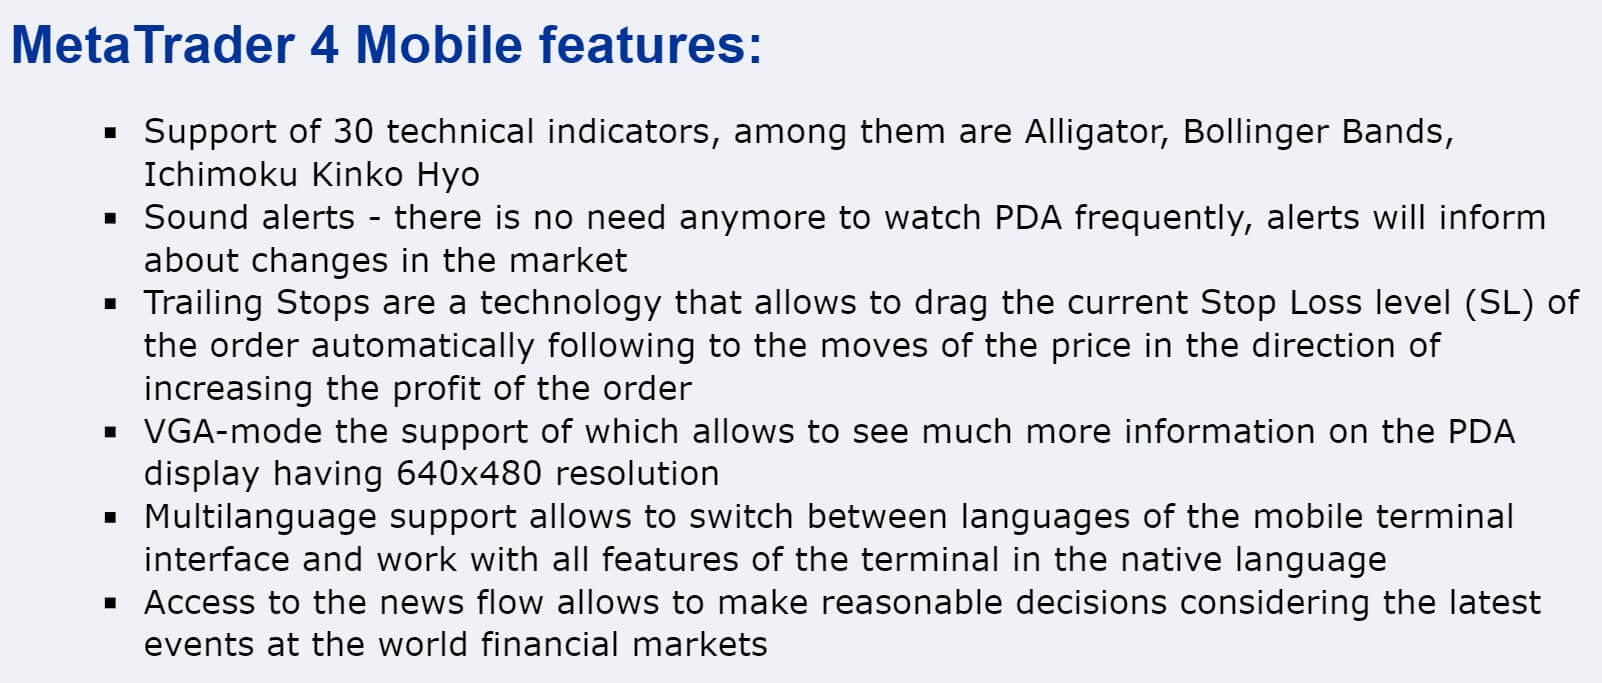
 The only platform on offer is MetaTrader 4 which is a great option to have. MetaTrader 4 is a highly popular trading platform due to its many features. These include its accessibility, it is available as a desktop download, web trader and as an application for your mobile devices. Its distributed architecture, robust security system and convenient mobile trading are some of the core competencies that give MetaTrader 4 its compelling competitive advantages, offering the perfect solution to the even most demanding trading needs.
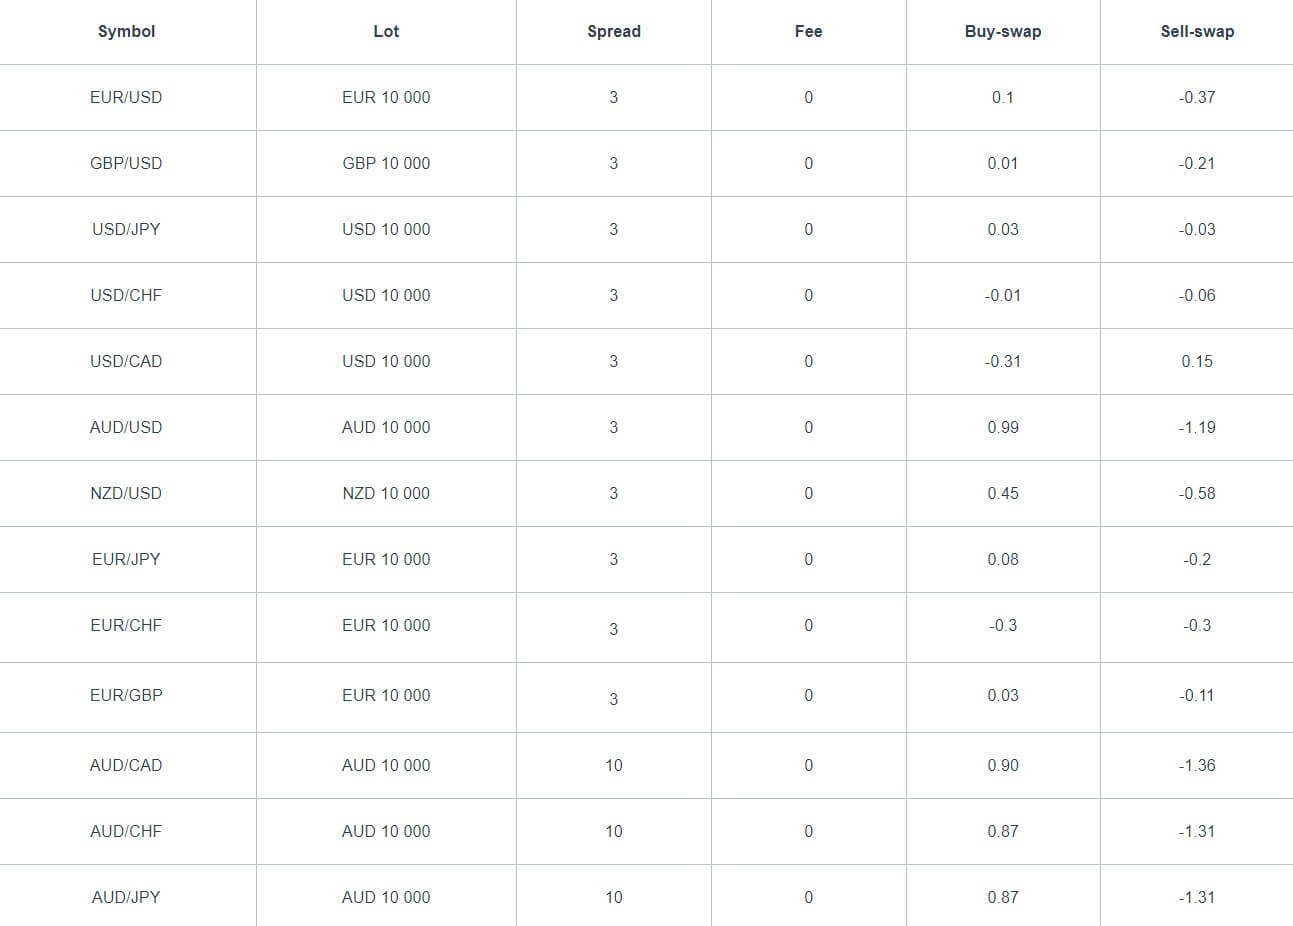

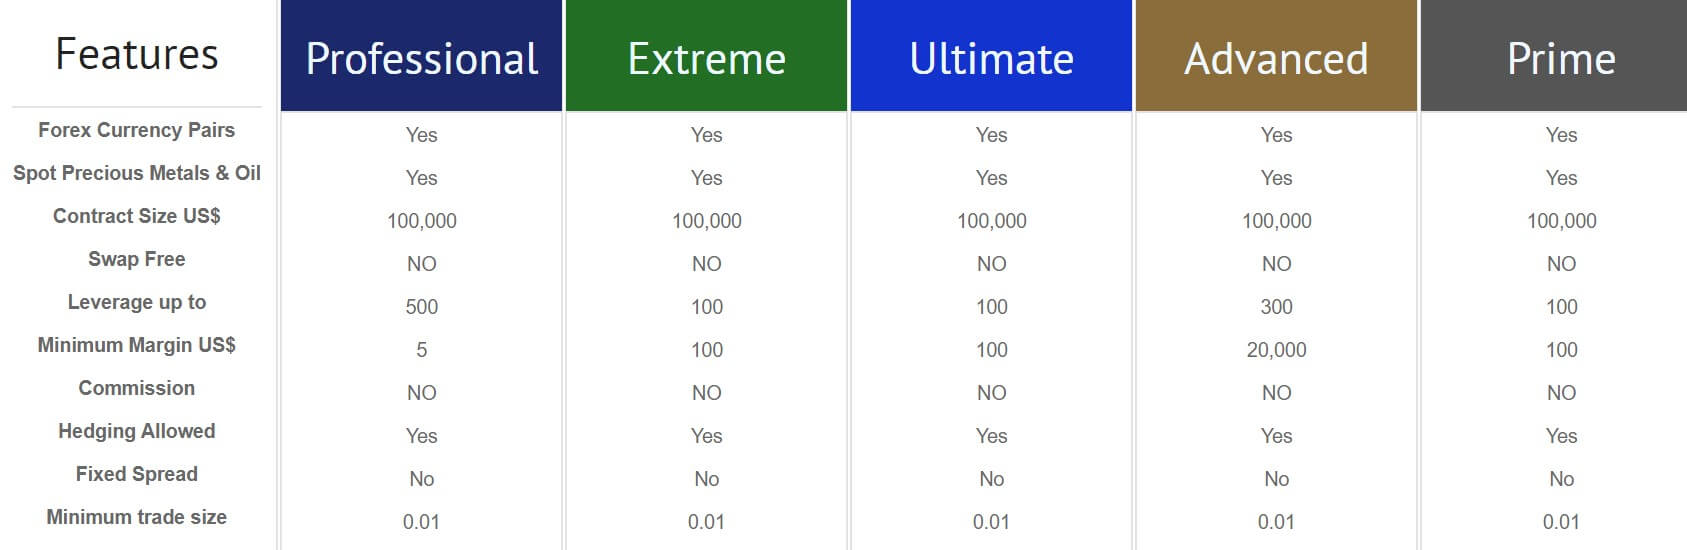
 We have outlined below the different minimum trade sizes as well as the maximum trade size of each account.


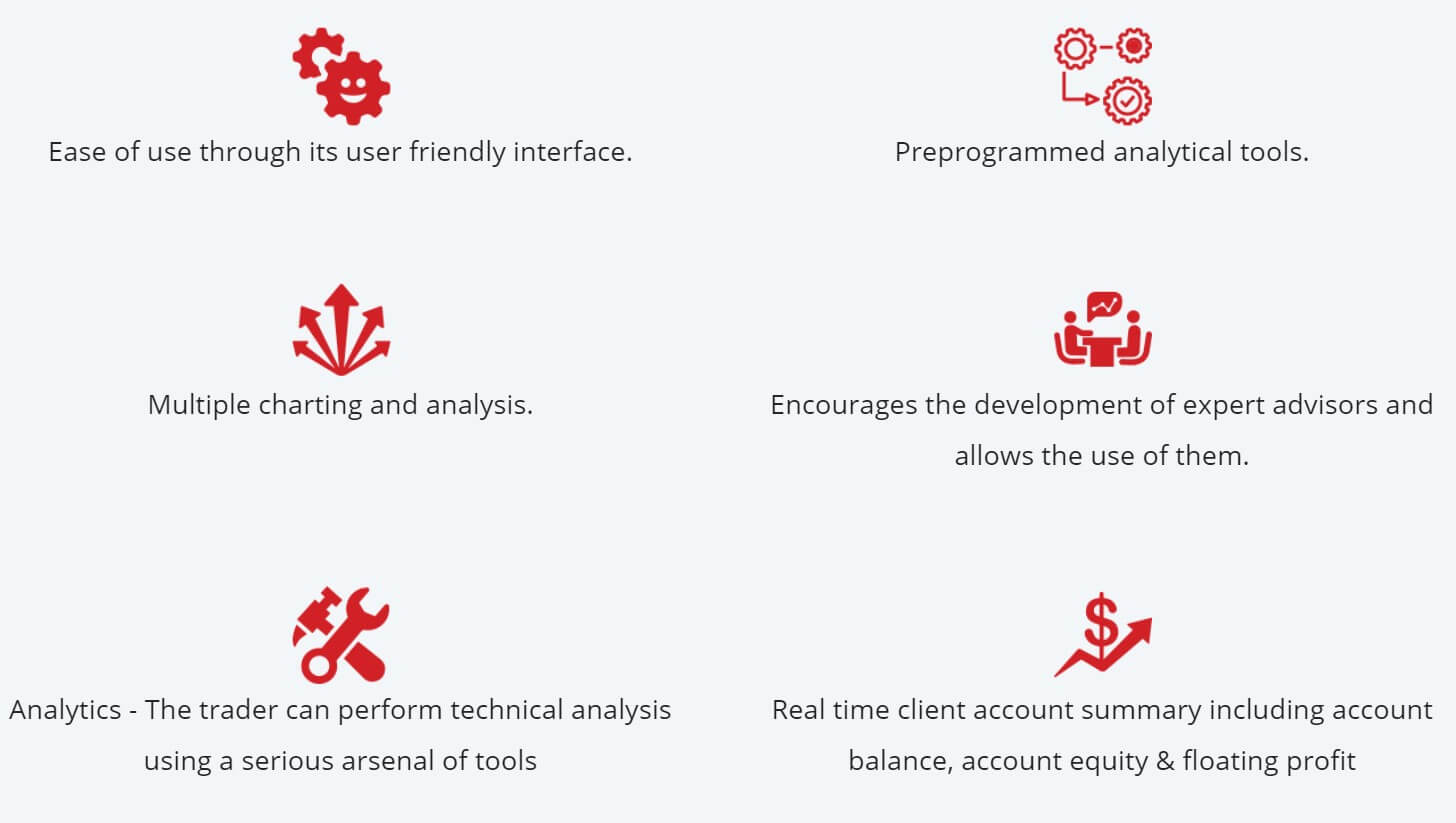
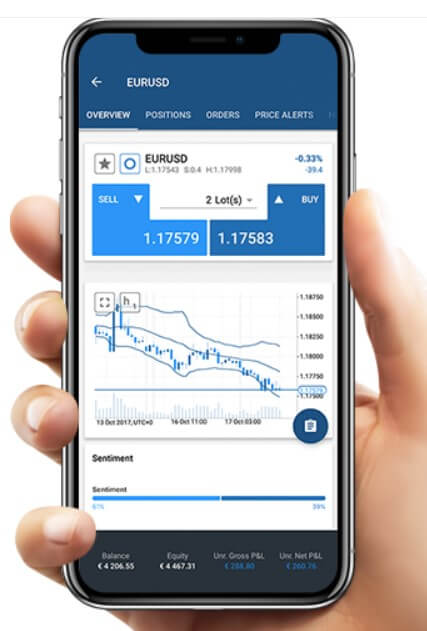 eDeal FX uses MetaTrader 4 from the MetaQuotes company as their only trading platform. It is one of the world’s most popular trading platform and comes with a whole host of features to make your trading life easier. These features include a complete friendly interface for ease of use, news feeds every second to keep traders updated, ready state analytical tools for your requirement, various best in class charts and calculations, developing advises from experts to use them on the go, multilingual platform, anytime account statement, real-time fund details, a summary of portfolios, unrealized/realized profits and loss and allocations and, effective and efficient indicators to determine trade dependencies and trailing stop loss facility. MetaTrader 4 is available on multiple paltforms including desktop, mobile devices and as a trader on your web browser.