

Scalping with the 5-minute time frame!
The methodology in this presentation is to use the 5-minute time frame on the EURUSD and the GBPUSD pairs during lulls in the market. Such lulls or quiet periods tend to occur after the American session and just before the Asians come to market. During the Asian market session traders typically tend to focus on domestic currencies that affect their own countries’ GDP, such as the yen and Australian and New Zealand Dollar. Therefore if the timing is correct, opportunities will present themselves to scalp or look for trades with expectations of only making or losing a few pips at a time in this type of scenario. Should trace spill over into the Asian session, financial institutions will be taking positions with our peers, and volatility will increase, but our technical analysis set up and tight stops should protect us from heavy losses.
And although present market conditions are extremely volatile due to the coronavirus, eventually, the markets will calm down, and opportunities will present themselves to try and make money in calmer markets with this methodology.
The first part of our setup is to observe periods in trading that have not been volatile in the run-up to the closing of the American session. We are looking for periods of consolidation and sideways trading in our two pairs, which should spill over into the Twilight Zone between the American session closing and the Asian session opening.
We want to keep our chart set up to a minimum with as little indicators as possible because they tend to be quite laggy on the 5-minute chart. Price action and Bollinger bands are the key behind this setup.
Example A
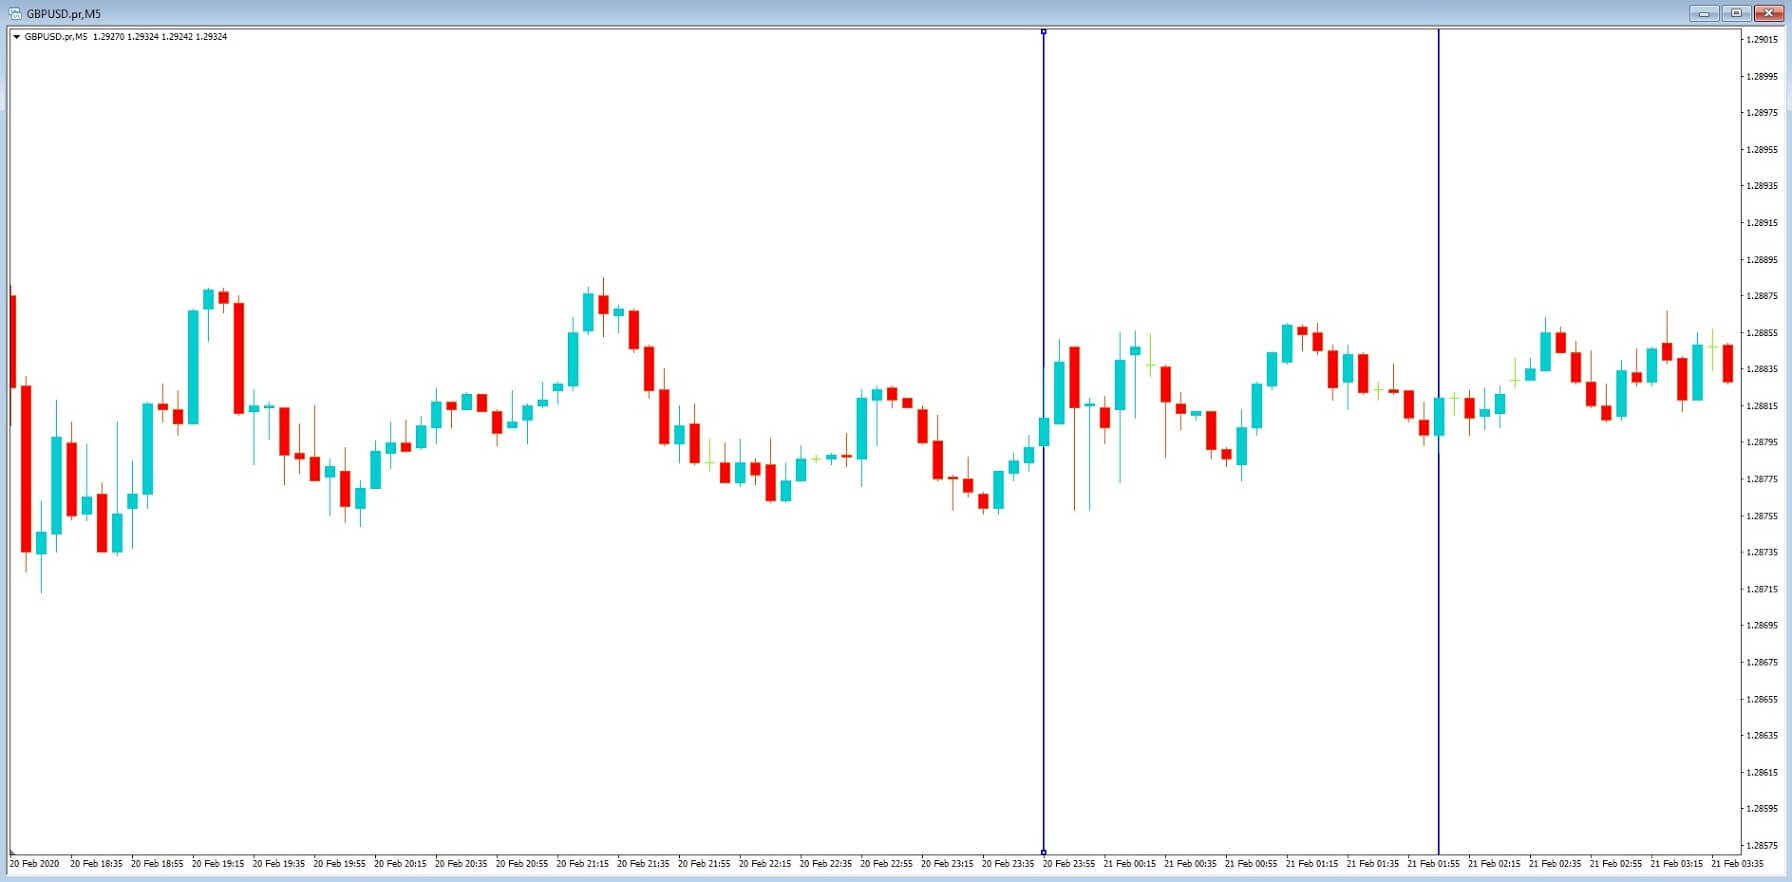
Example A shows the GBPUSD pair on a five-minute chart, and the period between our two vertical lines shows the time zone we are targeting specifically, and please note some brokers use different times on their charts, such as ours, which is two hours ahead of UK time.
First of all, we can see that price action has been very muted in the run-up to the time we are focused on, and should this be the case, there is no reason why you should not enter this trading methodology sooner, should you wish.
Example B
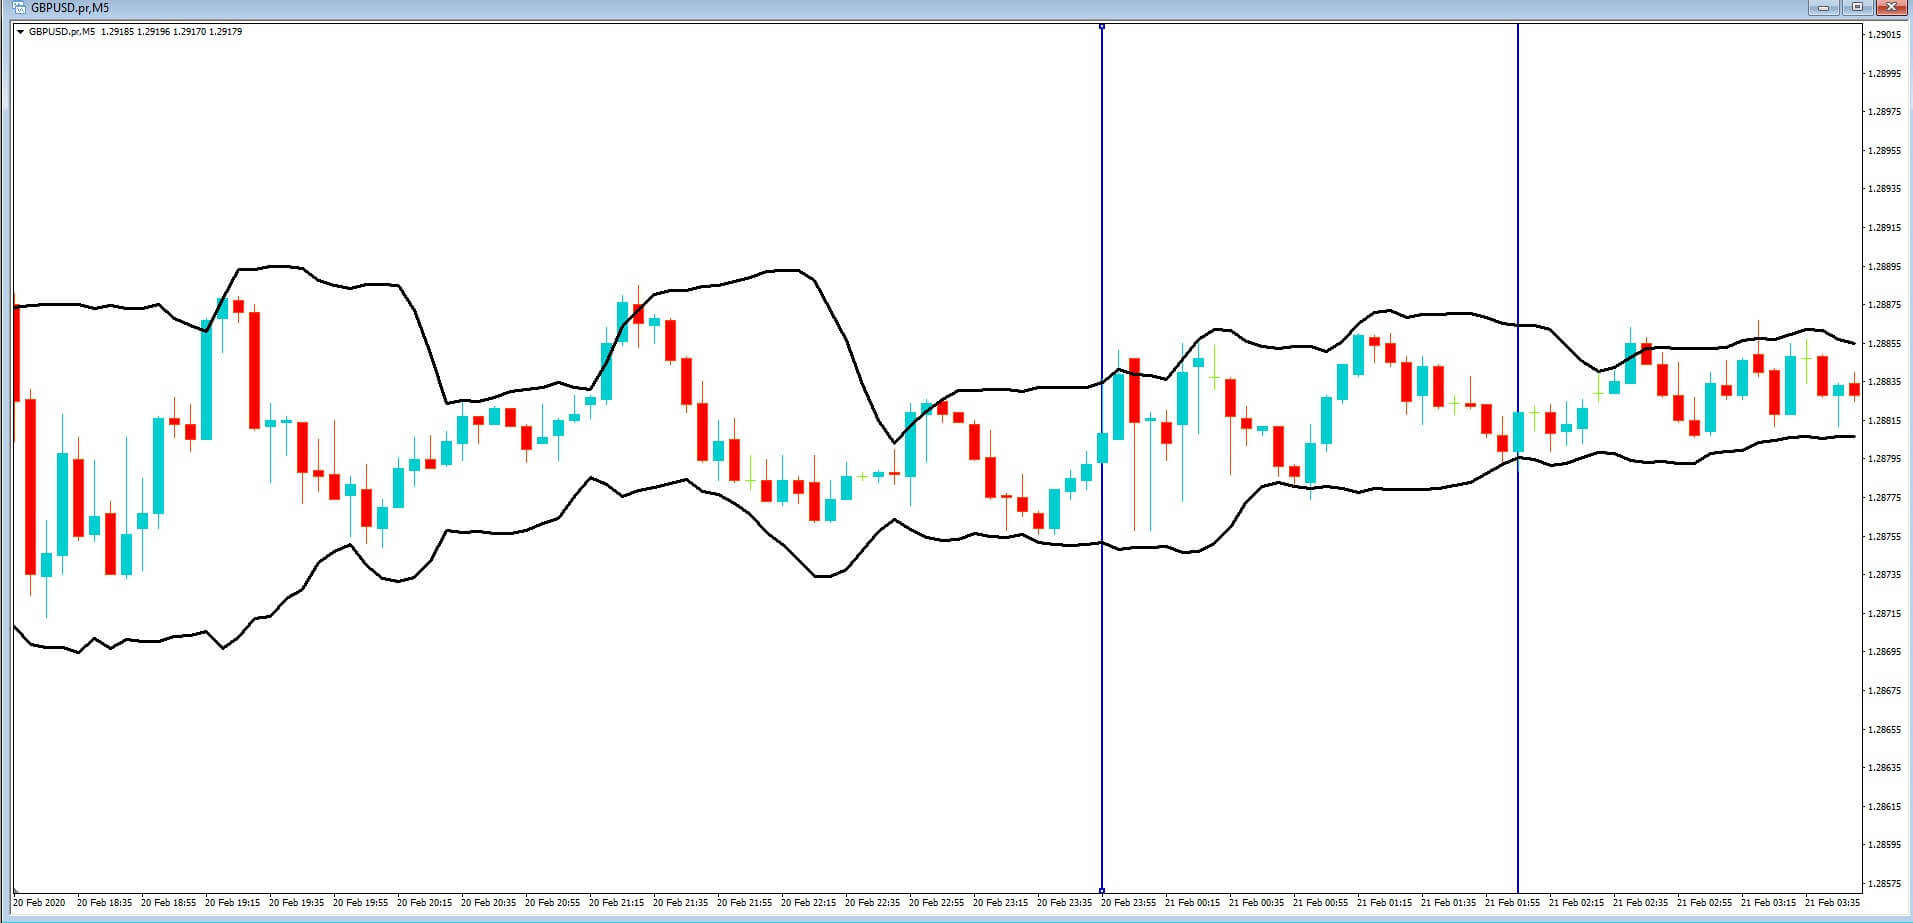
In example B, we have added the Bollinger bands with a period of 13 and deviation set at the standards default of 2.0.
The most critical parts of this setup is that the Bands must be moving sideways.
Example C
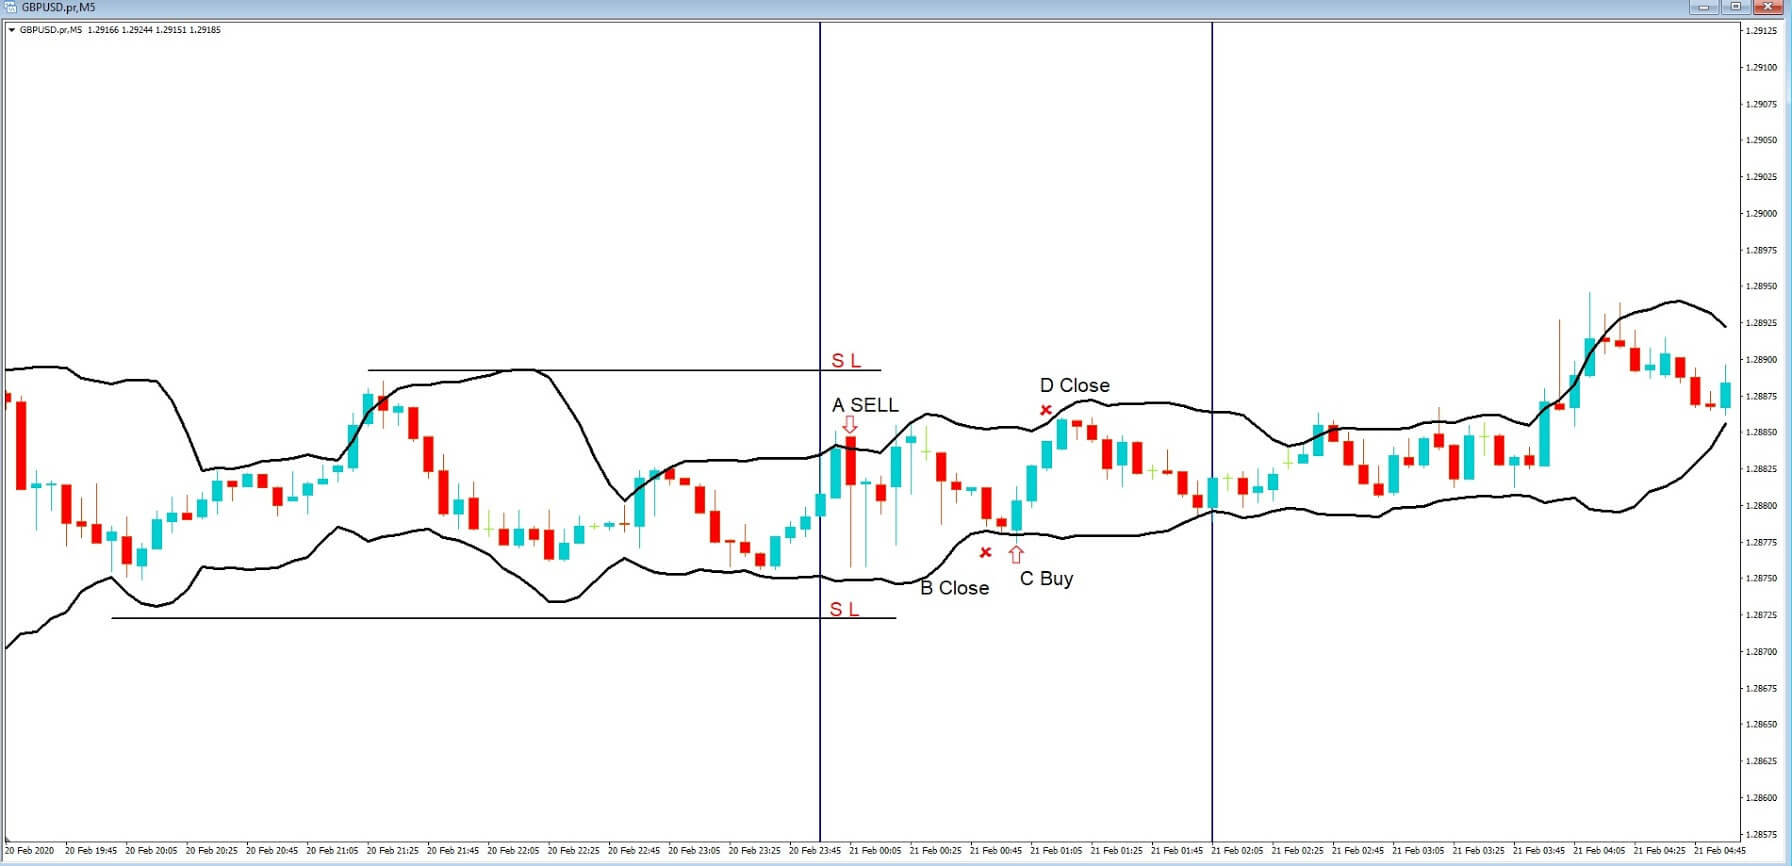
In example C, we can see that price action spikes outside of the Bands at position A, where we have gone short and placed a tight stop loss a couple of pips above the previous high as denoted by our Horizontal line. And when price touches the bottom of the Bollinger band, we need to exit the trade. If price begins to move higher inside the band, which it does at position C, we would enter a buy trade with a target of the upper band and with a stop loss a couple of pips below any low in this consolidation period. In which case, our exit would be at position D.
There are conservatively 15 pips within our highlighted period and a total of over 50 pips within this consolidation period, as presented on the chart as price tops and bottoms from the tops to the bottoms and back of the bands. Tight stops keep losses to a minimum with this setup.