Categories
Crypto Guides

An Introductory Guide To NEAR Protocol

Introduction

NEAR Protocol is a smart contract compatible cryptocurrency, a highly scalable and low-cost platform for developers, allowing them to create dApps or decentralized apps for various purposes. In the cryptocurrency space, the competition can turn out to be vicious. Nevertheless, cooperation is also widespread in the crypto space, particularly because it is a new asset class.

Crypto creators and experts have understood that it is highly beneficial to cooperate rather than to compete for the time being. And you will struggle to find any crypto project better than NEAR Protocol when it comes to cooperation in the cryptocurrency space. If you are interested in understanding what NEAR Protocol actually is, including its elements and features, this post will explain everything you need to know about it. Let’s get started.

What is NEAR Protocol?

NEAR or NEAR Protocol is a cryptocurrency blockchain that features smart contract functionality. NEAR Protocol is designed and developed to facilitate the creation of decentralized applications. It is also developer-friendly and is interoperable with Ethereum as well.

Coming down to its functionality, NEAR Protocol uses a block generation mechanism known as ‘Doomslug’ that processes over 100,000 transactions per second and a Sharding mechanism known as ‘Nightshade’ that splits the entire cryptocurrency network into multiple portions. The transaction fees on NEAR Protocol are so low that it requires a special unit of measurement for quantification called ‘yocto.’

Furthermore, the developers at NEAR Protocol are working to make the platform secure enough to handle valuable assets like identity or money. And with the likes of proof of stake, combined with sharding, the platform can prove useful for everyday customers.

How does it work?

NEAR Protocol is a dedicated proof of stake blockchain, which, to optimize performance, uses sharding. Sharding is quite different in NEAR Protocol as compared to other cryptocurrencies. That is, all shards on NEAR Protocol are considered a part of the same network. Using Nightshade, the cryptocurrency is interoperable with ETH using Rainbow Bridge. The Nightshade works to add a single snapshot of each shard’s existing state on the NEAR Protocol blockchain. Each shard has its own set of validator nodes that broadcast the shard’s existing state each time a block is produced.

Elements and Features of NEAR Protocol

NEAR Protocol comes with numerous functionalities that cater to the validators, end-users, and developers differently.

  • NEAR Protocol allows the developers to prepay and sign the transactions in the end-users’ best interest, significantly reducing the need for the users to know about how the decentralized application works and other technical anomalies.
  • It boasts a ‘Progressive UX,’ which is specifically designed for users so that they can use the platform without requiring to use tokens or wallets.
  • When we talk about the validators, NEAR Protocol allows them to create an assortment of offerings for the users.

Conclusion

It is still too early to say whether people will accept NEAR Protocol or will it dethrone Ethereum. But it is certainly not impossible. Given the features and functionalities of the cryptocurrency, it can be said that NEAR Protocol is the future of the cryptocurrency market, especially because it can help create state-of-the-art decentralized applications.

Categories
Forex Fundamental Analysis

The ‘Sentix Investor Confidence’: Revealing Market Sentiment

Introduction

The economy, financial, and forex markets are mainly driven by sentiment. Abstract aspects of demand and supply primarily drive these markets. A financial asset’s value will appreciate if a majority of investors believe that its future cash flows will increase. Conversely, the value of the asset will lower if these investors have a negative outlook on it. Therefore, knowing how most investors feel about the outlook of the economy can help you plan your future investments properly.

Understanding Sentix Investor Confidence

Investor confidence indexes are usually estimated by conducting surveys on investors and analysts throughout the economy.

In the EU, for example, the investors’ confidence is gauged using the ‘EU Sentix Investor Confidence’ index. Sentix is a German marketing and research firm predominantly dealing with behavioral finance. This index is compiled through a survey of about 2800 investors and analysts from across the 17-EU member countries. The primary role of the index is to obtain the confidence of the business people about the current economic climate and their anticipation about the future economy.

Sentix Investor Confidence Methodology

The Euro area Sentix economic report is categorized into the current situation and Expectations.

Current situation: This part of the report polls how the investors and analysts feel about the prevailing economic conditions. Ongoing geopolitical aspects inform the current economic conditions to the prevailing market conditions.

Source: Sentix

Expectations: As the name suggests, this part of the report concerns the future. Investors and analysts are polled to see what they think the future economic conditions will be. Do they expect the current conditions to improve, remain the same or deteriorate?

Both these parts of the report accommodate various economic indicators about the economy. The investors and analysts are asked their sentiments on various aspects of the economy, from the ease of doing business, labor conditions, interest rates to geopolitics.

As mentioned, Sentix surveys up to 2800 people who are mostly employees and investors in the private sector. The survey is conducted to ensure inclusivity of all economic sectors, thus obtaining a representative perspective about the state of the economy.

The results from the questionnaires are collated and indexed on a scale of -100 to 100. Readings of below 0 indicate that investors and analysts are pessimistic about the economy, with the severity of their pessimism increasing as the index approaches -100. On the other hand, a reading of above 0 shows optimism. The higher the index, the more optimistic the investors are about the economy.

Source: Sentix

Using Sentix Investor Confidence for Analysis

Keep in mind that the polled people for this index are experts – presumably authoritative in their various fields. Therefore, by following

Sentix

level of confidence in the economy can be incredibly helpful in making predictions about the economy at large.

Investments, in any economy, forms a major part of economic growth. When investors have a positive outlook about the economy, current, and future, we can expect them to make more investments in various sectors of the economy. Naturally, these investments create more jobs in the economy, increasing economic output, improving households’ welfare, and growing the GDP.

On the other hand, when the investors hold a negative outlook about the economy, they will halt any further investment plans. Some may go as far as cutting back on their investments. In this scenario, the industries in which they have invested in will be forced to scale down their operations. Consequently, the economy can expect a higher unemployment rate, depressed demand in the economy, reduced output, and a general contraction in the GDP.

Note that the current and the expectations of investor confidence aren’t always aligned. Policymakers can use this knowledge to make informed decisions on monetary and fiscal policies. When investors are confident about the current economic conditions but pessimists about the future, theoretically, governments and central banks could implement expansionary policies. Such policies will stimulate the economy and prevent any job losses, or adverse contractions of the economy in case investors shy away from further investing.

Furthermore, Sentix investor confidence is a vital indicator of recessions and recoveries. Let’s take the example of the ongoing coronavirus-induced recession. Towards the end of the first quarter of the year, investors were pessimistic about the future. They anticipated that the ravaging effects of the coronavirus would severely affect the economy. And true, as anticipated, the economy was ravaged. New investments during the months following the outbreak were at historic lows, and the unemployment levels globally were the highest ever witnessed. The Sentix investor confidence forestalls the current recession.

Similarly, the Sentix investor confidence index can be used to show signs of economic recoveries. Let’s still consider the example of the recent coronavirus pandemic; the Sentix investor confidence has been accurately used to show economic recovery signs. After governments and the European Central Bank (ECB) put in place economic expansionary measures, the Sentix investor confidence became less and less pessimistic. This showed that investors anticipated that the economy would recover.

Source: Sentix

Impact of Sentix Investor Confidence on Currency

As we mentioned earlier, sentiment is one of the major drivers of currency fluctuations. When the investor confidence is highly optimistic or improving from extreme pessimism, the domestic currency will appreciate. This appreciation is because investor confidence signals improvement in the economic condition, followed by lower unemployment levels, better living standards, and higher GDP levels.

Conversely, dropping levels in the Sentix investor confidence leads to the depreciation of the domestic currency relative to others. The depreciation is because forex traders will anticipate that adverse economic conditions will follow.

Sources of Data

Sentix conducts the surveys and publishes the Sentix Investor Confidence index for the Euro area.

How Sentix Investor Confidence Index Release Affects The Forex Price Charts

Sentix released the latest EU investor confidence index on October 5, 2020, at 8.30 AM GMT. The release of the index can be accessed at Investing.com. Since the investor confidence index is a low-impact indicator, low volatility is expected on the EUR.

In October 2020, the Sentix Investor Confidence index was -8.3 compared to -8.0 in September 2020. However, the October reading was better than the expected  -9.5.

Let’s find out how the October 2020 Sentix Investor Confidence index’s release impacted the ERU/USD price action.

EUR/USD: Before the Sentix Investor Confidence Index Release on October 5, 2020, 
just before 8.30 AM GMT

Before the release of the Sentix Investor Confidence Index, the EUR/USD pair was trading in a steady uptrend. The above 5-minute chart shows candles crossing above the 20-period MA and forming further above it.

EUR/USD: After the Sentix Investor Confidence Index Release on October 5, 2020, 
at 8.30 AM GMT 

After the release of the index, the EUR/USD pair formed a 5-minute bearish candle. However, the pair subsequently adopted a strong uptrend. The 20-period MA rose steeply with candles forming further above it. This trend shows that the EUR became stronger after the release.

Bottom Line

In the forex market, the Sentix Investor Confidence index is a low-impact indicator. In the current economic climate, however, this index can prove invaluable in predicting the directions of the economy – to show whether the Euro area economy is bouncing back from the effects of the coronavirus pandemic.

Categories
Crypto Daily Topic

Investing in ICOs – What You Need to Know

An ICO (Initial Coin Offering) is a strategy startups use to raise capital to fund a project by selling digital tokens. The project’s nature could vary from building an app to creating a new service to developing a new cryptocurrency. It is a similar concept to an Initial Public Offering (IPO) – the sale of shares by corporations to raise lump sum capital. 

ICOs, just like IPOs, often excite investors, which is why: at the launch of an ICO, tokens are usually sold at an outrageously discounted price. If the project goes well, the startup will become attractive to investors, and so will be the tokens. At this point, early-bird investors can sell their tokens at much higher prices and walk away with their newly-acquired wealth. This is the same thinking IPO investors have.

Despite the potential to gain massively from these investments, the risk of losing everything always lingers. If the project is a false start, the startup behind the ICO will fail to attract investors, and the tokens will be, at best, a little more than useless.

This article explains ICOs in detail, the benefits of investing, and the risks involved. Read on to know if they are a worthy venture.

How ICOs Work

First, it’s worth noting that cryptocurrency startups typically offer iCOs. Startups have limited access to funding. To make it worse, crypto startups lack the assets to back up liabilities such as credit, and this fact makes them particularly unattractive to creditors. 

When such organizations want to raise capital, ICOs come to their rescue. It all starts with publishing a technical paper detailing their idea. The whitepaper will explain the capital requirements, what the project will achieve at the end, how many tokens investors will keep, how the tokens can be redeemed, and so on. An elaborate paper is crucial in convincing investors to jump aboard. 

During the offering, those who have read the paper and see potential in the idea will buy the tokens using fiat money or crypto. In the future, issued tokens can be redeemed for cash. However, there are cases where the tokens only represent a stake in the organization and only entitle the holders to dividends. 

If the ICO fails to raise the amount needed to pursue the project, the startup may refund investors. Otherwise, it will use the funds collected to implement the proposed project. It is important to note that ICO activities are not regulated – and that’s a huge risk. Luckily, the US Securities and Exchange Commission (SEC) can intervene if it believes the ICO is illegal and may harm investors, as was the case with Telegram’s 2018 ICO. Nonetheless, the SEC’s jurisdiction is limited to the United States, something that you need to keep in mind. 

Comparison with IPOs/ Stocks 

ICOs and IPOs have a lot in common, especially in terms of how they work. Below are some of how the two compare:

  • Both are used to raise funds from the public 
  • Investors receive a token that represents their contribution. In ICOs, digital tokens are issued while IPOs feature shares
  • Both are supposed to be tradeable or redeemable 

Despite the similarities, there are notable differences between the two. For instance: 

  • ICOs are not regulated, while stocks are regulated by government agencies (SEC does this in the US)
  • Returns on IPOs are straightforward – stockholders reap annual dividends. On the other hand, ICO tokens do not grant investors ownership of the project. Still, they can be redeemed at a fixed rate, grant buyers access to the startup’s offices, entitle them to a share of the company’s profits, or whatever the whitepaper says – it’s usually all in the whitepaper.
  • IPOs are restricted to specific stock markets, while ICOs can be purchased anywhere the internet has reached.
  • IPOs usually have a high minimum amount of shares that one can purchase. ICOs, on the other hand, offer more flexibility when it comes to the minimum number of tokens that can be purchased.

How to Participate in an ICO

There is no specific process for venturing into ICOs. However, the general guide below can help you get started.

  1. Search online for upcoming ICOs. Using Google search terms like “upcoming ICOs” should be sufficient. You can also check out icodrops.com. The website provides a summary of active, upcoming, and concluded ICOs. When contemplating which ICO to settle for, take your time to read and understand the whitepaper. If you can, consult an investment expert for advice.
  2. Once you have made a comparison and settled on an ICO of your liking, register with an exchange. Since you are likely to purchase the tokens using crypto, you will need to exchange your fiat money for the said crypto. Most ICOs can be paid for using Bitcoin or Ether – that’s if they are not accepting fiat money.
  3. Buy crypto from the exchange and transfer that to your private wallet. 
  4. Go to the ICO’s official website and follow the participation guide. Most of them have simple well-explained guides. That’s it.

Pump-and-Dump ICO Schemes

Not all ICOs are established with genuine intentions. Like it is the case with any other investment alternative, you should be extra-careful when approaching an ICO investment. Pump-and-dump schemes involve overly hyping an idea to mislead investors into thinking that the proposed project will be super successful. In a typical pump-and-dump scheme, ICO owners will make outrageous claims about the potential of their idea. Then, clueless investors will buy the tokens in large quantities. Naturally, the project will fail after the capital collected has been spent, meaning the startup will have no money to pay investors.

It might be difficult to read the intentions of ICO owners from the start. However, if you see an influencer promoting a certain ICO, you should be vigilant. Using authoritative figures to market ICOs is among the best-known tactics pump-and-dump schemers use.

The ICO Bubble

ICO critics have long speculated that the concept is just a fanfare whose curtains are due to close. In 2017, Wired predicted that the ICO bubble was about to burst, but obviously, it didn’t. In 2018, cryptocurrencies saw an all-time decline in market capitalization, with Bitcoin losing over 70% of its value. The thing is, cryptocurrencies ride on speculation, and speculation cannot be predicted. Therefore, we cannot validate claims of a looming ICO bubble burst. What’s more important is to do your due diligence before diving into this unpredictable business.

Final Thoughts

ICOs present an exciting investment alternative to crypto enthusiasts. They offer many benefits that traditional IPOs lack. For instance, you can invest for as low as a few dollars. You are also not restricted to any country – provided you can access the ICO’s website, you can participate. Generally, ICOs have opened up investment opportunities to more people. However, it would help if you exercise caution when dealing with them. Their unregulated nature means if anything goes wrong, legal redress might be impossible. But since all investments are risky anyway, you might want to give it a try regardless.

Categories
Forex Assets

Trading The AUD/INR Forex Exotic Pair & Analysing The Costs Involved

Introduction

AUD/INR is an exotic currency pair in the forex market, with the AUD representing the Australian Dollar and the INR representing the Indian Rupee. Here, the AUD is the base currency, and the INR is the quote currency. That means that the AUD/INR price represents the amount of INR which 1AUD can buy. For example, let’s say that the price of the AUD/INR is 52.2654. It means that 1 AUD can buy 52.2654 INR.

AUD/INR Specification

Spread

When you go long in forex trading, you have to buy the currency pair from your forex broker. Now, if you decide to sell back the pair to the broker, they will buy it at a lower price than they sold to you. The difference between these two prices – also known as “bid” and “ask” – is the spread.

The spread for the AUD/INR pair is:

ECN: 20 pips | STP: 25 pips

Fees

Some brokers charge a commission for positions opened using ECN accounts. They vary depending on the size of the trade. STP accounts are rarely charged any trading fees.

Slippage

Slippage in Forex is the difference between the execution price of a market order and the price at which that order was placed. The slippage comes about due to increased market volatility or inefficiency on the part of your broker.

Trading Range in the AUD/INR Pair

When a currency pair fluctuates, its volatility varies across different timeframes. The analysis of this volatility in different timeframes is done using the trading range. It can help the trader identify the most suitable timeframes for a particular currency pair.

The trading range is expressed in pips. It shows the value of pips you stand to gain or lose on various timeframes.

The Procedure to assess Pip Ranges

  1. Add the ATR indicator to your chart.
  2. Set the period to 1
  3. Add a 200-period SMA to this indicator
  4. Shrink the chart so you can determine a larger period
  5. Select your desired timeframe
  6. Measure the floor level and set this value as the min
  7. Measure the level of the 200-period SMA and set this as the average
  8. Measure the peak levels and set this as Max.

AUD/INR Cost as a Percentage of the Trading Range

Expressing the total trading costs of a currency pair as a percentage of the trading range helps to understand the trading costs that pair on multiple timeframes. It shows how the trading costs change with volatility.

Below are the trading costs for the AUD/INR  pair on ECN and STP accounts.

ECN Model Account Costs

Spread = 20 | Slippage = 2 | Trading fee = 1

Total cost = 23

STP Model Account

Spread = 25 | Slippage = 2 | Trading fee = 0

Total cost = 27

The Ideal Timeframe to Trade AUD/INR Pair

From the above analyses, we can observe that the lowest trading costs of the AUD/INR pair are on longer timeframes. The lowest trading costs for both the ECN and the STP accounts are when the AUD/INR volatility is at the highest – 518.3 pips. While the shorter timeframes have higher trading costs, intraday traders can take advantage of the maximum volatility periods during these timeframes.

Furthermore, traders can reduce the trading costs by implementing forex limit orders instead of market orders, which are prone to slippages. Here is an example of how the limit orders remove the slippage costs.

ECN Account Using Limit Model Account

Total cost = Slippage + Spread + Trading fee

= 0 + 20 + 1 = 21

You can notice that the forex limit orders lowers the overall costs by making the slippage cost 0. In this scenario, the highest trading cost has been reduced from 389.83% to 355.93%.

Categories
Forex Course

168. Learning To Trade Multiple Timeframes In The Forex Market

Introduction 

In our previous lesson, we discussed multiple timeframe analysis in forex means. Now, let’s find out what forex trading with multiple timeframes means. In case you are wondering, trading multiple timeframes in forex does not mean that a trader is opening several positions using different timeframes. We are not saying you can’t do this, you if you have the money; but that is not what trading with multiple timeframes in forex means.

Trading multiple timeframes in Forex means using different timeframes to establish the trend and support and resistance levels of a currency pair to determine the best point of entry and exit of a trade. Let’s use a few examples to show how trading with multiple timeframes in forex occurs.

As we had mentioned in our previous lesson, the timeframes you use for your analysis depends on which type of forex trader you are. The best way of trading multiple timeframes in the forex market is by using the top-down technique. With this approach, you first observe the longer timeframes for the general market trend, then use the smaller timeframes to establish more current trends.

Let’s take the example of a forex day trader. You will start by using the 1-hour timeframe to establish the primary market trend. Say, a day trader wants to open a position on September 9, 2020, at 11.00 AM GMT, using the 4-hour timeframe, the market shows an uptrend.

4-hour timeframe for EUR/USD

1-hour timeframe for EUR/USD

The 1-hour timeframe confirms that the pair’s intermediate trend is consistent with the uptrend observed in the 4-hour timeframe.

15-minute timeframe for EUR/USD

The 15-minute timeframe can then be used to select the best entry point.

Determining the market limits: the longer timeframes will enable you to determine the support and resistance levels of a currency pair. The resistance levels help you set your exit points while the support levels will help you timing your market entry.

Establish the trend momentum: While the larger timeframe gives you the overall market trend, the smaller timeframes will help you establish the spikes in the price of the currency pair. These spikes will help you to establish the short-term strength of the trend compared to the longer-term trend.

Helps avoid the lagging effect of some technical forex indicators: Most technical Forex indicators are lagging, meaning trend changes signaled by the indicators lags the real change in the price of the currency pair. Therefore, price-action can be said to be leading the technical indicators in the forex market.

We will cover these three reasons in detail in our subsequent lessons.

[wp_quiz id=”89146″]
Categories
Cryptocurrencies

What Venus (XVS) can do for DeFi? 

Project after project is now rushing to cash in on the DeFi wave as the new blockchain-powered industry takes over the space. One of the latest DeFi projects to enter the scene is Venus Protocol, a liquidity pool and money market based on the Binance Smart Chain

What’s Venus all about, and what innovations does it bring to DeFi? Let’s dive in. 

Understanding Venus 

Venus is a DeFi protocol on the Binance Chain that supports digital asset lending, borrowing, and generation of synthetic assets. Venus wants to provide a much better financial ecosystem than both centralized and current decentralized platforms.

The Problem with Today’s Finance Protocols

In the traditional finance system, users have to go through a multitude of steps just to get a loan from KYC processes to a credit history check to days or weeks of awaiting confirmation. Also, the centralized lender can decide to deny you a loan arbitrarily. And let’s not forget about centralized platforms’ security concerns, thanks to their single point of attack. 

For its part, DeFi has revolutionized the crypto space by introducing blockchain-based products and services that are transparent, cryptographically secure, and not controlled by third-party authorities/decision-makers. But there’s a problem with DeFi: most of these platforms are built on Ethereum, which has faced scalability challenges since the beginning. Lack of scalability means slow, costly transactions and a poor user experience.

Again, these protocols lack the high market cap that could attract more users or put them at the top of the chain. There’s also the less-than-obvious issue of some of these platforms being not fully decentralized – mostly at the beginning. Such a platform will have equity investors controlling the platform, not users, and the community. 

Venus’s Solution

Venus seeks to address these problems by providing an environment where a traditional approach is woven into a synthetic stablecoin generation process. Users will be able to enjoy high-speed transactions with low minimal transaction costs on the Binance Smart Chain. The possibilities are many: deposit collateral, earn interest on the collateral, borrow against the collateral, and mint stablecoins in seconds. 

Venus: Highlights

  • Ability to borrow cryptocurrencies without intrusive KYC and credit checks
  • Ability to deposit crypto and stablecoins as collateral and earn good annual percentage yield returns 
  • Mint stablecoins from your collateral, with the collateral having the ability to be used more than 60 million places in the globe.
  • Governed by the Venus token for fair and transparent coin launch and distribution 

How Can You Use the Venus Protocol? 

You can take advantage of the Venus platform in several ways. From depositing assets and earning from them to borrowing crypto at competitive rates. 

#1. Depositing Assets

Venus users can deposit any of several supported digital assets in the protocol. Borrowers will take out these funds and use them to speculate in the market. In return, suppliers of the funds – or stakers, will earn interest on their deposit. 

When users supply collateral, they participate as lenders while contributing to the security of the protocol. All deposited assets are put together in a pool so that users can take out part of/the whole of their supply at any time, provided the protocol balance is positive.

Supplying crypto to the protocol will get you a vToken (vETH, vBTC, vUSDC, etc.) Only vTokens can be used to redeem the underlying deposited crypto. Redeeming the crypto will allow you to hedge against other assets in the market or move them to offline wallets that support Binance Smart Chain.

#2. Borrowing Assets

To borrow assets from the platform, you need to stake in collateral. The collateralized assets should be over-collateralized, making for at least 75% of the amount to be borrowed. The community will determine the collateral ratio through a governance process. Once you deposit the collateral, you can proceed to borrow an amount based on the collateral ratio of the particular asset. 

Usually, collateral ratios are anything between 40% to 75%. For instance, if ETH has a collateral ratio of 75%, it means you can borrow up to 75% of the value of your ETH. But if your collateral value drops below 75%, it could cause your assets to be liquidated. To return the collateral, a borrower must pay the borrowed amount together with the compounded interest.

Protocol Architecture

Venus’s code is forked off both the MakerDao and Compound protocols. The architecture is made of these elements: 

#1. Controller Smart Contract

Binance Smart Chain’s controller contract is much like a 

decentralized processor, facilitating the interactions between all other smart contracts on the platform. The Venus protocol does not automatically support tokens. Rather, it will support specific markets that are whitelisted by the Controller contract. The controller contract accesses whitelist markets by deploying the support Market admin function on the protocol. Every interaction and function on the protocol must be verified on the controller contract before it’s executed. 

#2. Collateral value

When a user deposits, borrows, or mints from the protocol, they’re usually using the underlying asset, usually held as collateral. The underlying assets are held as collateral and have dollar values that are also tied to the vTokens. For this to work accurately, these collateral values are taken from prevailing market rates. 

Governance Approach of Venus

The Venus team takes community governance very seriously. There were no pre-mined tokens for the team, foundation, and developers. As such, users who mine the Venus Token will get to control how the network runs. 

Governance features include, but are not limited to: 

  • The introduction of new assets on the protocol
  • Adjustment of market rates
  • Fixing interest rates for synthetic assets
  • Voting on protocol upgrade proposals

Venus Token

Venus is governed by the platform’s native token, the Venus Token (XVS). The token was designed to be “fair launch,” meaning there were no pre-mined tokens for the team, advisors, or the Foundation. You can only earn tokens through the Binance Launchpool project or by injecting liquidity into the protocol.

Initially, 20% (6,000,000) of the total supply will go to the Binance Launchpool project. The remaining amount will be dedicated to the protocol, with 23,700 000 XVS being mined in the next four years at 18,493 per day. 35% of the award will go to borrowers, 35% to suppliers, and 30% to stablecoin minters. XVS will officially become the governance mechanism of the protocol after 10 million tokens have been mined. In the meantime, an interim token, ‘Swipe Token’ (SXP), is being used to fulfill this purpose. 

Community Growth Strategies

The Venus team is going to implement various strategies in a bid to expand the community. 

  • Conducting Ask Me Anything (AMAs) to shed more light on the project to the community.
  • Regularly publishing DeFi-related news.
  • Hosting/co-hosting DeFi and blockchain events
  • Putting out weekly updates on Medium
  • Engaging with the community and the public via social media
  • Coming up with governance protocols

Future strategies include the following: 

  • Launching a governance protocol
  • Launching an incentive campaign to attract liquidity investors
  • Increasing the number of supported tokens

Tokenomics of Venus

At the time of writing, the Venus token’s market performance was as follows: its price was $3, and its market cap was $12,696,581, which placed it at #453. XVS had a 24-hour volume of $6,606,914, with a circulating supply of 4,227,273 and a total and maximum supply of 30 million. Finally, the token’s highest price ever was $4.77 (Oct 17, 2020), while its lowest ever was $2.22 (Oct 13, 2020). 

Where to Buy and Store XVS

XVS is currently listed on the Binance exchange. 

As a Binance chain token, the XVS token can be stored in Ledger Nano S, Guarda Wallet, Enjin Wallet, Atomic Wallet, Trust Wallet, Edge Wallet, and Coinomi Wallet.

Closing Thoughts 

On the Venus Protocol, users from everywhere can supply crypto and earn returns, take loans, and mint synthetic assets. Since it runs on the Binance Smart Chain, its transactions are fast, low-cost, and transcend the native blockchain. Active participants will get to contribute to the future direction of the protocol in a truly decentralized fashion. Venus joins multiple protocols offering the same product – will it stay ahead of the curve? We’ll be watching to see how it evolves.

Categories
Forex Forex Market Analysis

EURAUD: Can we Profit from the Bear Side?

Overview

The EURAUD cross moves mostly bearish in a downward sequence that began in early October. The price action suggests that the cross could develop a new low before complete the bearish sequence still in progress.

Technical Big Picture

The EURAUD cross penetrated the sideways trading zone developing the second bearish leg of its three-wave movement that looks incomplete. Likewise, once the current bearish wave ended, the cross could start a new rally subdivided into a five-wave sequence.

The following chart represents the EURAUD cross in its 12-hour range, in which the sideways trading range goes between 1.60332 and 1.65744. This consolidation formation found its bottom on June 02nd, and its top corresponds to a pivot level that turned into a long-term key level.

Consequently, as long as the price keeps moving below this level, the short-term bias will continue being bearish. However, the May 29th breakout of the 1.67728 level, when the cross rallied topped at 1.68273, suggests the possibility of a new upward sequence.

Concerning its Elliott wave analysis, the current bearish sequence corresponds to an incomplete wave ((b)) of Minute degree labeled in black, which began when the price found fresh sellers at 1.68273.

Currently, the EURAUD cross advances in its internal wave (c) of Minuette degree identified in blue. Its completion could suggest a new rally that could drive the price toward the October high zone.

The short-term key supports and resistance levels are as follows:
• Resistance 1: 1.66856
• Resistance 2: 1.67824
• Resistance 3: 1.68724
Pivot Level: 1.65744
• Support 1: 1.64608
• Support 2: 1.63565
• Support 3: 1.62565

Technical Analysis Outlook

The short-term outlook for the EURAUD cross and under the Elliott Wave perspective exposes the bearish advance in the third wave of Subminuette degree identified in green, which belongs to the wave (c) of Minuette degree labeled in blue.

The following 3-hour chart shows the intraday consolidation activity that suggests the equilibrium between bull and bear traders. In terms of the wave theory, the consolidation structure should correspond to wave iv of Subminuette degree.

The Elliott wave structure suggests the possibility of a limited upside until 1.6460 and 1.6494, where the price could find fresh sellers expecting to join their limited positions with a potential target in the area between 1.63198 and 1.62201. This decline should complete the fifth wave that belongs to wave (c) identified in blue.

Finally, the invalidation level of the bearish scenario locates at 1.6573.

Categories
Crypto Guides

Looking For Easy Crypto Payment? Switch To NOWPayments!

Introduction

Digital payment has undoubtedly blessed the financial industry by offering a seamless transaction mode. With the inclusion of blockchain, things have become even more efficient. More and more blockchain platforms have been introducing their tokens and coins to facilitate blockchain-based transactions. Crypto holders are making use of their crypto coins to conduct everyday financial transactions.

Owing to the increasing demand for crypto payments, blockchain platforms are designing their currency. ChangNow has also been working to introduce NOWPayments to offer a convenient blockchain payment service that will accept crypto coins all over the globe. In this article, we are going to talk about NOWPayment and everything that has to be discovered regarding this revolutionized payment service.

What is NOWPayments?

NOWPayments is powered by ChangeNOW and has been operating in the industry since 2019. It is also tied up worth Ledger, Binance, and Atomic Wallet to increase its services’ efficiency. NOWPayments has been designed to primarily offer a crypto payment gateway for both customers and merchants and make transactions seamless. It allows merchants to accept crypto payment on their online stores, social media accounts, and website. Being a non-custodial service, NOWPayments will not store funds in any means. It supports more than 50 cryptocurrencies and facilitates transactions at lower fees.

What Are The Benefits of Choosing NOWPayments?

As online/offline merchants and crypto coin holders are increasing at a staggering rate, it has become essential to introduce a hassle-free payment gateway. NOWPayment is that one-stop destination where you can conduct crypto transactions without any hassle. It has partnered with all the popular crypto exchanges to strengthen its potential and meet customers’ needs. Here are a few crucial benefits of using NOWPayments-:

Faster Payments: NOWPayments is known for its lightning-fast payments. Unlike other gateways, NOWPayments will complete the transaction within minutes.

Non-Custodial Services: There are no intermediaries involved in the transactions except holding the fees. So, the payments are directly forwarded to the merchants.

Comprehensive Support: Complete guidance and inclusive support is another major takeaway of this payment gateway. From installing plugins to integrating API, you can get all answers to your queries via a 24/7 support team.

Transparency Compliance: NOWPayment prioritizes the safety of the clients and partners. The legal team dedicatedly works to ensure compliance. It secures all the transactions and safeguards it from illegal acts, and protects the users’ rights.

How To Integrate NOWPayments?

NOWPayment claims to be the easiest and best way to accept crypto payments. The easy-to-use interface makes NOWPayments offers hassle-free, secure, and simple API that you can integrate into any platform. Follow the below steps-:

  • Sign up for NOWPayment with email and set up your account
  • Access the Dashboard after signing up
  • Go to Add New Key and save the API
  • Visit the Outcome Wallet page to access your digital wallet
  • Use the API to send and accept crypto payments

The Bottom Line

NOWPayments has established a safer, reliable, and faster crypto payment gateway that everyone needed. It can be embedded in online stores and websites to make payment easier for customers and merchants. The above mentioned were all the vital information you need to know about this amazing payment gateway.

Categories
Forex Assets

Exploring The Costs Involved While Trading The AUD/KRW Exotic Pair

Introduction

The AUD/KRW is an exotic currency pair where AUD is the Australian Dollar, and KRW is the South Korean Won. This article will cover some of the essential elements of the AUD/KRW pair that you should know before you start trading this exotic pair.

The AUD is the base currency, and the KRW is the quote currency in this pair. Hence, the pair’s price represents the amount of KRW that can be bought using 1 AUD. For example, say the price of AUD/KRW is 795.89, it means that for every 1 AUD, you can buy 795.89 KRW.

AUD/KRW Specification

Spread

In forex trading, your broker will sell a currency pair to you at a higher price than the one they will buy from you if you sold it back to them. These prices are “bid” and “ask,” and the difference between them is the spread. The spread for the AUD/KRW pair is:

ECN: 21 pips | STP: 26 pips

Fees

STP type accounts incur no trade commissions. For the ECN accounts, the fees charged depend on your broker and the size of your position.

Slippage

When placing a forex market order with your broker, that order might be executed at a different price. The difference is slippage and is due to higher volatilities or execution delays by the broker.

Trading Range in the AUD/KRW Pair

The trading in forex aims to show the trader how a currency pair fluctuates across multiple timeframes. This analysis is used to determine volatility associated with the pair.

If. For example, the trading range of the AUD/KRW across the 4H timeframe is ten pips; it means that a trader can expect to gain or lose  AUD 12.6; since the value of 1 pip is AUD 1.26.

Here’s the trading range of the AUD/KRW  across multiple timeframes.

The Procedure to assess Pip Ranges

  1. Add the ATR indicator to your chart.
  2. Set the period to 1
  3. Add a 200-period SMA to this indicator.
  4. Shrink the chart so you can determine a larger period
  5. Select your desired timeframe
  6. Measure the floor level and set this value as the min
  7. Measure the level of the 200-period SMA and set this as the average
  8. Measure the peak levels and set this as Max.

AUD/KRW Cost as a Percentage of the Trading Range

Here, we calculate the total trading costs that a trader can incur trading the AUD/KRW across different timeframes under different volatility.

The trading cost is expressed as a percentage of the volatility, which is in pips.

ECN Model Account Costs

Spread = 21 | Slippage = 2 | Trading fee = 1

Total cost = 24

STP Model Account

Spread = 26 | Slippage = 2 | Trading fee = 0

Total cost = 28

The Ideal Timeframe to Trade AUD/KRW Pair

From the above analyses, we can observe that the highest costs in both the ECN and the STP accounts are incurred at the 1H timeframe when volatility is at the minimum 58 pips. Although the trading costs decline as the timeframe becomes longer, you can notice that the costs are lower when volatility is at the maximum across all timeframes. Therefore, for intraday traders trading the AUD/KRW pair when volatility approaches, the maximum will help lower the costs.

Using the forex limit order types can also help to reduce the overall costs since it eliminates the risks of slippage encountered in market orders. Here’s an example.

ECN Account Using Limit Model Account

Total cost = Slippage + Spread + Trading fee

= 0 + 21 + 1 = 22

Notice how the overall trading costs have been lowered in all timeframes. When volatility is at the minimum at the 1H timeframe, the highest trading cost has declined from 406.78% to 372.88%.

Categories
Crypto Videos

The Amazing Chainlink – Solving Real-World Problems!


Chainlink – Beginners Guide

During the long and hard crypto winter of late 2018, many projects failed to stay afloat, but during all this, Chainlink managed to actually keep growing and defied the bearish market. At the moment, Chainlink is one of the leading cryptocurrencies in the DeFi sector. How did it manage to grow as consistently, and what sets is apart?

Problem

Blockchains use math–cryptography and practically guarantee security, trust, and decentralization. However, the problem is that each blockchain is its own universe, which means that getting information from and to another blockchain would require a trusted source. To retrieve information about event outcomes or even something as simple as Bitcoin’s price meant that you are required to trust a source to tell the truth.

What is Chainlink?


Chainlink figured out how to get any type of information in and out of a blockchain while remaining secure and decentralized, but also trustless. Sources of data between the blockchain and the “outside” world, known as oracles, are no longer a single point of failure for a smart contract. Chainlink created a network of nodes that can provide information to and from the blockchain, which created a vital part of smart contract infrastructure as a result. This “blockchain middleware” meant that Chainlink oracles could provide essential information without sacrificing on decentralization or security.
Chainlink essentially created a secure bridge to the “outside” world.
To minimize the potential failure of the aforementioned oracles, Chainlink focused on the distribution of data sources, distribution of oracles, as well as the use of trusted hardware.

Origins of Chainlink

Chainlink was founded by the current CEO Sergey Nazarov and the current CTO Steve Ellis. The project started in Sept 2017, when the project raised $32 million in an ICO, thus creating 1 billion LINK tokens. In May 2019, Chainlink launched on the Ethereum mainnet. At the moment, Chainlink is the 7th largest cryptocurrency by market cap, as well as the largest DeFi cryptocurrency by market cap, and is very close to the $4 billion dollar mark.

Use Cases

Chainlink is different from most projects in terms of having real use cases, as it is demonstrated by its list of partners, with most notable being Polkadot and Synthetix from the crypto sector and SWIFT and Google coming from the traditional business world.
As an example, Chainlink could be used to send a real-world money transfer from SWIFT and via Chainlink. The proof the payment could then be sent back via Chainlink to SWIFT. This use of Chainlink by SWIFT has created a seamless interaction between the traditional world and the crypto world, all while minimizing the potential points of failure.

So how does it all work?

Chainlink can be defined as a decentralized oracle network that consists of purchasers and data providers. Purchasers request data, while providers return it in a secure way.
Purchasers select the data they want to obtain, while providers bid to provide that data. Providers have to commit a stake of LINK tokens when making a bid, which serves as proof that they are honest. Once providers are selected, their job is to bring the correct answers on the chain.

Chainlink uses something called “oracle reputation system” to aggregate as well as weigh the data provided. If everything goes well, providers get paid, and everyone is happy, but if the providers misbehave, they lose their stake.

How do you get Link tokens?

The Chainlink network uses an Ethereum-based ERC-677 token that inherits the ERC-20 token standard’s functionality while allowing token transfers to contain a data payload. This token protocol is also used for payment of data providers who are bringing and translating data into the blockchain.
Besides earning LINK tokens by being a provider, you can also buy LINK tokens on various exchanges, such as Coinbase, Binance, and Huobi.

The Future of Chainlink

Two of the key objectives Chainlink focused on to ensure the security of its network are the distribution of data sources and the distribution of oracles. Like all networks, Chainlink’s main goal is to add more people and operators to become more robust and valuable.

Categories
Forex Videos

Halloween Forex Week – Don’t Trade Until You’ve Seen This!

Halloween for forex traders – the scariest event on the calendar for a long time!

Trading in the financial markets is inherently risky. And professional traders will try and mitigate risk by using an economic calendar to either deliberately trade risky events such as interest rate decisions by central governments or gross domestic product announcements, etc. or to avoid them at all costs.
But now and then, risk events come along that truly worry professional traders and investors. The financial week commencing the 2nd of November 2020 has the potential to cause a tsunami of price action movements in financial assets, including currencies, stocks, and bonds, metals, cryptocurrencies, oil, and commodities. Essentially, everything that can be traded will undoubtedly see volatility during this week.

So why should traders be worried about this week?

The financial markets are in a state of flux with large investors and institutions looking to mitigates risky forthcoming events. This means juggling their portfolios in order to diversify against the risk of a huge stock market falls, especially in the United States should Joe Biden become the next president. This is due to fears that he will have a negative impact on the markets with regard to democrats’ policies, including higher taxation and increased regulations for businesses across the USA.

We have already seen increased volatility in the financial markets, especially with currencies where the US dollar has broadly strengthened against other currencies, especially the major currency pairs. While some of this may be attributed to the month-end readjustment by financial institutions and upcoming planning for year-end rebalancing, the bulk of this activity is due to the forthcoming and tightly contested key economic calendar event for this year, which is the US presidential elections on the 3rd of November.

This just happened to coincide with the Japanese monetary policy meeting minutes being released on Tuesday, as well as the Reserve Bank of Australia releasing its interest rate decision. While the election winner will not be announced on the same day, markets will be braced for when the announcement eventually does come. The completely different styles of presidency being offered by both parties are said to have positive and negative impacts for stock markets, with President Trump’s policies of low taxation and low corporate red tape seen as positive for the economy and where Biden’s policies are the opposite and thus create a negative sentiment for the economy.
This event, which is dynamic and has the potential to cause huge market swings on its own, but it happens to coincide with an increase in the Coved transmissions globally, and where a second wave of the pandemic is sweeping across Europe and the United States, where last week 70,000 cases of the infection were reported in a single day.

It also coincides with the United Kingdom, Germany, and France initiating lockdowns for their peoples to try and contain the virus. As if that wasn’t enough to contend with, financial traders have to keep an eye on the Brexit future trade deal negotiations, which are a critical junction, with just a few days remaining to allow the United Kingdom and European Union to agree on a tariff-free future trade deal. If they are unable to do so, the United Kingdom will exit the transition period at the end of December without a formal trade deal with its European friends, and this, coupled with the economic situation unfolding due to the coronavirus, will be seen as a boot on the throat of the ailing British economy, which is struggling because of the ongoing Covid crisis.

And if you have been looking at your economic calendar for the forthcoming week, the sea of red, in terms of high impact events, continues on Thursday with the Bank of England interest rates decision and the United States federal Bank interest rate decision also compounding nervousness for the jittery markets.
And as if it needed a cherry on the top, on Friday, the US non-farm payrolls for October numbers are released. Historically a huge market-moving event could cause spikes as volumes lessen due to risk and where this would impact liquidity, causing wide spreads.
The best thing is to trade with tight stops, expect the unexpected, and even better still, sit back if you don’t need to trade and watch this incredible week unfold.

Categories
Forex Course

167. Multiple Timeframe Analysis – Key to your Success

Before defining what multiple timeframe analysis is, we first need to understand what timeframe in forex means.

What is Timeframe in Forex?

In the forex market, the timeframe shows the change in a currency pair’s price over a given period. For example, a 1-minute timeframe shows how the price of a given currency pair changes minute by minute, while a 1-month timeframe shows monthly changes in the pair’s price.

No matter which trading platform you use when trading forex, there are several timeframes provided. For example, the screengrab below of an MT5 platform shows the different timeframes provided to forex traders.

Therefore, in the forex market, multiple timeframe analysis is a chart analysis technique that involves observing a currency pair’s trend under different timeframes.

Importance of Multiple Timeframe Analysis in Forex

Another type of forex trader would employ a different timeframe analysis to determine their trade entry and exit positions. Any forex trader knows that the price of a currency fluctuates continuously. Thus, the trend observed in a 1-minute timeframe will be different from the 5-minute timeframe and so forth. The table below shows different timeframes for different types of forex traders.

In timeframe analysis for forex markets, it is advisable to adopt a top-down technique. This technique involves beginning your analysis with a larger timeframe, depending on your trading style, to establish the overall price trend. Subsequent smaller timeframes then follow to show how the observed trend can be broken down to find preferable entry points.

Let’s take a forex day trader, for example. Such traders do not hold an open position overnight. Thus, for their timeframe analysis, they would start with the 8-hour timeframe, then to 4-hour the 1-hour timeframe.

With multiple timeframe analysis in forex, the larger timeframes, like the 1-month timeframes, are used to show a longer-term trend of a currency pair. In a single glance, you can see how the pair has been trading for years.

GBP/USD 1-Month Timeframe Analysis

From the above 1-month chart of the GBP/USD, you can notice the pair’s longer-term downtrend from August 2014 to August 2020. Short timeframes are ideal for showing the more recent changes in the price of a pair. Most forex traders use shorter timeframes to find opportunities to enter a trade and identify ideal exit points.

[wp_quiz id=”89128″]
Categories
Crypto Daily Topic

Why Bitcoin is Here To Stay

Let’s face it – at some point, we all thought that Bitcoin was going to collapse, but it didn’t. Since its inception in 2009, this cryptocurrency has shown tremendous resilience throughout its lifetime. Bitcoin has had meteoric rises and falls, having gone to the highs of $20,000 at some point and plunged as low as $5,000 within months. PayCoin, SpaceBit, and many other digital currencies have collapsed, and so, the idea of a cryptocurrency failing is not foreign after all. So what makes Bitcoin special? Does this pioneer crypto really have nine lives, or is it a matter of time before it vanishes into the nether world? 

Critics say it shall end in tears; analysts say Bitcoin is here to stay. But let’s settle this debate by looking at the factors that give Bitcoin its resilience and evaluating whether they are solid enough to see it through crypto’s uncertainties. 

This article presents Bitcoin’s history of fluctuations and reasons it is likely to survive the test of time.

The 2018 Bitcoin Crash

If there’s a time Bitcoin’s doomsayers were almost right in their predictions, it must have been 2018. After reaching almost $20,000 in December 2017, Bitcoin crashed to just $5,000 in December 2018. Cryptocurrencies were undergoing a rough time. During this period, a series of events led to widespread speculation about the fate of digital currencies.

  • In January 2018, it was rumored that South Korea was planning to ban cryptocurrencies in the country. As a direct consequence, Bitcoin lost 12 percent of its value.
  • Exactly 2 weeks later, Coincheck, then Japan’s largest crypto exchange, was hacked, and the cyberpunk made away with NEM equivalent to USD 530 million. Crypto enthusiasts across the globe momentarily lost trust in the security of digital currencies. Within a couple of days after this news broke, Bitcoin lost 50% of its value.
  • In March of the same year, someone stole Binance’s API keys and attempted to make fraudulent transfers. Binance detected the unusual activity and immediately suspended withdrawals. Panic had already spread.
  • In the same month, Facebook, Twitter, and Google banned all ICOs and token sales ads. This was the final piece of evidence doomsayers needed to prove their case.

For the remainder of the year, cryptocurrencies struggled to remain afloat. Some exchanges suspended trading, and some currencies collapsed. By November 2018, Bitcoin was exchanging at $5,500.

The Comeback

From the beginning of 2019, Bitcoin started to show signs of recovery. In fits and bursts, the currency rose in both trade volume and price. By June 2019, it had already reached $10,000. Between June 2019 and October 2020, the coin has fluctuated between $14,000 and $5,000. The comeback was not the strongest. However, it brought hope that Bitcoin was permanently poised for recovery and stabilization. 

Why Bitcoin Is Likely to Survive the Test of Time

We have seen Bitcoin’s unpredictable fluctuations over the years. One question we need to answer is what makes it always recover even after an epic fail. Below are some of the reasons.

#1 – It solves real-world problems

This is arguably the main reason Bitcoin has survived for a decade. Bitcoin has real utility – you can use it to pay for goods and services, you can send it to another person, and you can invest in it as if it were an asset. While it was possible to achieve all this even before Bitcoin’s creation, its invention has made these transactions more versatile and cost-effective. 

It has also opened new use cases that were previously impossible. For instance, activists are increasingly relying on Bitcoin to bypass government restrictions and receive donations. Of course, criminals and terrorists are also abusing the network to raise funds for nefarious activities, but that does not negate the fact that Bitcoin comes in handy when an unrestricted movement of funds is desirable. 

#2 – It is (relatively) simple to understand and use

Compared to other cryptocurrencies, Bitcoin is relatively easy to understand and use. For comparison, Ethereum and Ripple, Bitcoin’s closest competitors, include complicated concepts (smart contracts and payment infrastructure, respectively) that confuse neophytes. Bitcoin is simply a currency. Even a person with modest internet skills can begin using it in a short time. 

Bitcoin’s simplicity is on the user front – the mechanisms behind how it works remain as complex as those for other cryptocurrencies. Thus, none of the security, decentralization, and network stability benefits are compromised.

#3 – It is highly consistent with our past payment experiences

Bitcoin’s compatibility means you can easily plug it into traditional financial systems, and it blends seamlessly. It is accessible from mobile apps and other platforms that we are all already used to. Its acquisition and usage are also consistent with our past experiences. For instance, when checking out on an eCommerce site, you can pay for your goods by simply selecting Bitcoin, if it is listed. This is what you’d normally do with your credit card, PayPal, and so on.

So how does compatibility make Bitcoin resilient? Glad you asked. After a crash in volume, Bitcoin users can easily pick up where they left and continue using the currency like it never crashed. For emphasis, just imagine if, after abandoning its usage, you have to re-register, get a new wallet, find another exchange because the other one collapsed, and so on before you start using the currency again. It might not sound like much, but such complexities can impede the recovery of a cryptocurrency.

#4 – The pioneer advantage

Having entered the cryptocurrency market before any other currency, Bitcoin enjoys the pioneer advantage. It has been and will always be the trendsetter for cryptocurrencies. For instance, when Bitcoin activity slows down due to Bitcoin-specific adverse events, the entire crypto world is shaken. But Bitcoin does not necessarily suffer such instabilities when other networks go down. 

The pioneer advantage creates the impression that Bitcoin can be trusted more than any other cryptocurrency. This makes it easier for Bitcoin to bounce back after a slump because crypto enthusiasts will likely continue to trust it even when cryptocurrencies are undergoing tumultuous times. It is a good thing anyway, as the lifeline of cryptocurrencies heavily relies on Bitcoin trends.

#5 – It is globally available 

Bitcoin’s global presence contributes a great deal to its resilience. Each world region is characterized by a different economic and regulatory environment. So, when Bitcoin activity slows down in the Eurozone due to Brexit (if there’s such a cause-effect relationship), it could be pretty much business as usual in the rest of the world. Of course, changes in Bitcoin activity in certain regions have a high likelihood of impacting the rest of the globe. Even so, we must agree that having Bitcoin everywhere spreads and thus mitigates its risk of collapsing.

Final Thoughts

Bitcoin was created over a decade ago, and despite multiple scares that it was collapsing, the cryptocurrency still stands tall. It experienced its worst slump in December 2018, but its resurgence thereafter was a clear demonstration of its resilience. For the critics out there, Bitcoin’s high volatility is not necessarily a symptom of extinction – as it has been shown time and again. Lastly, although Bitcoin has seen countless rises and falls in its lifetime, one thing remains clear: after a fall, it shall rise.

Categories
Cryptocurrencies

GoChain (GO): Where Reputation Matters

Blockchain has so much potential to transform not just how we do business but society itself. Its qualities of decentralization, immutability, and distributedness make for transparent, trustless, and fraud-free interactions. 

And while this potential is huge, blockchain is currently hindered by issues like low scalability, lack of true decentralization, and excessive consumption of power. 

GoChain is a decentralized platform that wants to bring blockchain closer to businesses while solving the issues encumbering it. The platform is designed for its apps to be immediately integrable with Ethereum. 

Before we delve deeper into Gochain, let’s see why the current blockchain setup is problematic.

The Issues With Existing Blockchains

#1. Speed and Volume

Current blockchains suffer from slow transactions and low throughput. For instance, Bitcoin can process just 7 transactions per second, while Ethereum can process 15, at the time of writing. On top of that, it can take anything from minutes to hours to verify a transaction. This is a sharp contrast with Visa, which can process 1700 transactions per second. This demonstrates that the current blockchain setup is too slow for real-world and high volumes of transactions. 

#2. Power Consumption

As in proof of work (PoW consensus, the process of approving and verifying transactions gobbles up massive amounts of energy. The computational work that goes into the process is meant to protect the network against bad actors, but it comes at a cost. For instance, Bitcoin today uses the equivalent of the power that would run 3.5 million US households. This is just unsustainable in the long run.

#3. Questionable Decentralization

Decentralization is a central tenet of cryptocurrencies. Decentralization means any single company or government does not control a blockchain network. However, true decentralization remains a pipe dream. For example, the largest number of Bitcoin miners is situated in China, where electricity is cheap. In true decentralization, miners would be spread proportionately all over the world. 

#4. Rigid Contracts 

Ethereum supports smart contracts, which are contracts that are self-verifying and enforcing. Smart contracts operate so that all parties must commit to a set of rules before the contract is enforced. However, smart contracts are not that smart in some ways, especially when it comes to a fast-paced world. The parties to a smart contract cannot change the contract in any way, whether to upgrade the terms or fix a security bug. Smart contracts are also known to have been victims of attacks, meaning they’re not as safe as touted.

What’s GoChain?

GoChain is a decentralized, peer-to-peer network that uses Proof-of-Reputation consensus mechanism to power smart contracts and DApps. The network is 100% compatible with Ethereum wallets, and it had the mission of being “10x more decentralized, 100x faster and 1000x greener than Ethereum.” By greener, GoChain means utilizing a consensus model that does not consume as much power as PoW. 

Here are some of the main features of GoChain: 

  • GO-20 tokens, which are compatible with Ethereum
  • 1300 transactions per second with low to very minimal gas fees
  • A Proof of Reputation (PoR) consensus mechanism that relies on participants’ good reputation to secure the network
  • ‘Authorized Signers,’ who are 50 reputable companies picked from various industries and countries
  • Malicious nodes can be removed from the network

GoChain’s Fees and Rewards

Just like on Ethereum, GoChain users need to pay ‘gas’ to conduct transactions on the network. Authorized signers are in charge of creating, signing, and distributing blocks to nodes, for which they earn GO tokens in return. Reward tokens were 4.4% of the total supply, and they will decrease over time. 

The Voting Process 

GoChain will use a two-phase voting process. Initially, GoChain will have the first 50 signers enforcing decentralization and protecting the network against any outside interference. These signers will be picked from varying industries and jurisdictions. This is in line with the PoR consensus mechanism, in which a signer must already possess a reputation that’s too valuable to jeopardize/lose. When these signers are established, the network will hand complete control to them in a true self-governing version. 

GoChain will choose signers based on these credentials: 

  • Number of years in operation
  • Number of company employees
  • Annual revenue
  • Brand recognition
  • Company’s annual revenue

Proof of Reputation

GoChain uses a Proof of Reputation consensus mechanism to keep the network secure. A participant must already have a reputation that’s too prized to risk with any dishonest behavior. It’s why the PoR mechanism chooses larger companies – which have more to lose, over small companies. 

Once a company submits its reputation credentials, they may be voted in as an authoritative node, after which they can approve and verify blocks. GoChain is based on Ethereum’s network because the team believes that it’s “much more than just a store of value.” As well, Ethereum apps such as wallets and tools will be interoperable with GoChain. 

Why Reputation? 

GoChain relies on reputation because it’s one of the most crucial aspects of a business. For a company, acting unethically could bring consequences such as fines, a customers’ walkout, PR disaster, and so on. Trust is a key part of any business, and once that trust is lost, it can take years to repair. 

Hence, GoChain utilizes this model to keep companies in check and keep the network secure. PoR works for more risk-averse companies and wouldn’t be inclined to a PoW or Proof of Stake (PoS) consensus model. In PoR, everyone knows who the other is, and they know who they’re trusting with their data. 

GO Tokens 

GO is the native token of the GoChain ecosystem. The token’s distribution was done this way: 

  • Private and public sale: 51%
  • Team tokens: 10%
  • Advisor tokens: 6%
  • Token treasury: 10%
  • Marketing and legal expenses: 14%
  • GoChain fund: 10%

Key Metrics of GO Token 

Go token rounded up at these figures on October 14, 2020. Its price was $0.008448, with a market cap of $8,800,176, which placed it at #522. It had a 24-hour volume of $489,598 and a circulating supply of 1,041,653,540, and a total supply of 1,106,653,550. The token has an all-time high of $0.116462 (July 09, 2018) and an all-time low of $0.003994 (Mar 13, 2020). 

Where to Buy and Store GO

You can find GO listed on several popular exchanges, including Binance, VCC Exchange, KuCoin, Bilaxy, Bittrex, CoinDCX, DragonEx, Beaxy, and Coinall. BTC, USDT, and ETH are some of the currencies it’s listed against. 

For storage, options include ZenGo, CoolWalletS, Coinomi, Trezor Model T, and Ledger Nano S. 

Final Thoughts

GoChain is a solution for the persistent issues in blockchain, and its ready-to-go approach makes it an immediate DApp and smart contracts solution for users across the globe. GoChain promises a faster, more scalable, and more decentralized blockchain. The only caveat is, it’s not the first or the last project to offer that promise. Will it stand the test of time in the competitive crypto space? Only time will tell. 

Categories
Forex Market Analysis Forex Videos

Forex – New Zealand Dollar Set To Remain Powerful! How to Trade The Coming Weeks…


Is the New Zealand dollar bucking the trend?

Thank you for joining this forex academy educational video. In this session, we will be taking a look at some technical analysis for the New Zealand dollar.

As many countries in the western world are still in the grip of the Coronavirus pandemic, and with many western countries now seeing a second wave, New Zealand has managed to maintain a low infection rate.
The New Zealand dollar, also known as the kiwi, is a major currency and one of the top currencies traded against the United States dollar.

Other major currencies have seen huge swings against the United States dollar and other currencies. The kiwi has remained one of the best performers.

In this yearly chart, if we go back to the beginning of the year, we can see that the pair topped out around 0.6700 before being sold off heavily in the middle of march, and this was largely attributed to the United States dollar being bought as a safe-haven currency and before the pandemic really began to take hold in the US.

Since then, the New Zealand dollar has climbed up to record highs for the year to a peak in September at 0.6765, and although it is off of that high, a clearly defined line of support can be seen on the chart, and where this support line is moving higher, potentially offering a squeeze back to the resistance line and possibly beyond.
At the time of writing, the exchange rate was 0.6610, and with a high of 0.6765, it represents a fall from the high of only 155 pips.

If we now take a look at the EURUSD pair, we can see that while the NZDUSD pair was peaking at its high, the EURUSD pair was also peaking at a defined area of resistance at 1.1940. It subsequently pulled back to its current low of 1.1647, which may become an official support line if it moves higher, and where this move is -293 pips or almost twice the fall in pip value of the NZDUSD pair. This is another indication that traders believe the kiwi is worth buying.
This was further helped this week by the reserve bank of New Zealand, which stated that it would begin to cut back on its government bond purchases and that the economic activity was rising while the coronavirus was under control.
Safe-haven currencies saw some buying with continual downward pressure on the USDJPY pair last week, which tried to hit the key 104.00 level, and the US dollar also becoming a safe-haven currency, moving to fresh highs of above 94.00 on the DXY index, and yet again this did not cause a huge sell-off in the New Zealand dollar, as it held to the support line.

The week ahead is a monumental one with potentially a change in leadership for the US presidential office, and it is extremely difficult to predict where things might go from here. However, once the dust has settled, the economic indicators favor the New Zealand dollar, and we believe this will become a bid currency.

Categories
Forex Market Analysis Forex Videos

Forex & The US Presidential Election – How To Trade Biden VS Trump!

The US Presidential Election – what to expect from the Forex space?

Thank you for joining this Forex academy educational video. In this session, we will be looking at the upcoming US Presidential Election and what could happen in the Forex space in the run up to it and after the winner is announced.

It is a time of uncertainty in the global financial markets, with many Western countries seeing a second wave of the coronavirus, with massive unemployment and peaks and troughs in global gross domestic product, where no sooner can an economy begin to get back on its feet than a second lockdown offers the prospect of greater unemployment, more economic uncertainty and whereby governments are required to bail out their citizens and businesses with vast amounts of quantitative easing, which will see huge debt burdens emerge for generations to come.
Add to this the most contentious US presidential election ever, and it can only mean one thing: uncertainty. And traders and investors, including institutions, do not like uncertainty. It means that they have to diversify their portfolios in order to mitigate against risk.

The basic premise is that should Donald Trump managed to secure a second term in office, he has pledged to continue with the corporate reforms, and he has promised and to continue easing taxes. Whereas Joe Biden has promised to raise corporate taxes, and where he will undoubtedly increase liability on corporations with regard to further reforms and red tape, which has the effect of strangling the performance of the business. Not what you need in times like these.

Before the pandemic took hold in the United States, President Donald Trump was riding high with record-breaking high levels of employment, and record-breaking values in stock markets, largely because of his tax and corporate red tape roll backs and reforms. The investors loved him. He was undoubtedly one of the most successful presidents of all times in terms of the economic performance of the USA.

Fast forward a few months, and he could potentially go down as one of the worst presidents, and this has largely been down to what has been termed by many journalists, economists, and analysts, as well as great swathes of the population in the United States, has having lost grip of the pandemic to the point that he wilfully ignored the damage that it could do in terms of health to its citizens and to the health of the economy.

The polls suggest that he will pay the price and lose the election to Joe Biden.

And because we may see higher taxation and a rollback of reformed policies should Joe Biden become the next president of the United States, this is why we are seeing a pull-back in the US equities markets, and here we can see that the Dow Jones industrial average of the 30 leading companies had made incredible rebounds from the lows of middle of March when the pandemic really hit America hard, add where we almost saw a 100% rebound of the record-breaking high from February of over 29,000 for the index, on the basis that the market believed that the US federal reserve bank was handling the coronavirus well in terms of its interest rate policy and the amount of stimulus being offered by the government and hopes that a vaccine would quickly help the US to recover to pre-crisis levels and beyond.

In this yearly US dollar index chart, which measures the value of the US dollar against the most other widely traded currencies, the so-called majors, including the yen, euro, pound, Swiss franc, and Australian and New Zealand dollars, we can see that it found support at 92.00 in September, after heavily losing out against the majors, and more recently found support at 93.00 before pushing above 94.00. This is what we might expect as the US dollar has often been bought as a safe haven asset in uncertain times, and while the markets try to determine the amount of risk of the unknown, which is what would happen if Joe Biden and the Democrats took power. The dollar is also being bought and stocks sold because the democrats and republicans have not yet been able to reach an agreement on a much-needed extension to the financial stimulus aid package to help keep American firms and the public afloat.
Therefore, no stimulus deal could possibly now be agreed until after the elections, which will lead to more uncertainly, therefore more of the same for stocks and the dollar.
But if Donald Trump is elected for a second term, stocks should rally, and this might have the effect of a stronger US dollar and softer counter currencies, including the majors, perhaps with the exception of the British pound, but only in the event that the UK and EU manage to secure a free trade deal, and also perhaps with the exception to the New Zealand dollar, which is currently being very resilient to the recent upswing in the US dollar.
But if Joe Biden takes power, we would highly likely see extreme market volatility in all financial assets and where the fear of the unknown would offer no real directional bias for the markets in the short term. We also should look at the possibility that even if Biden swept to power, the markets might believe that he could handle the pandemic better than Trump, be less provocative to foreign powers – which could help investment in the USA – and this might also bring back investors into the equities space as a direct result. With the democrats then holding all the aces in Congress, a stimulus deal would be more likely to get through more quickly, and more stimulus should, theoretically, mean a softer US dollar, in which case traders will be looking for opportunities to short it against the majors in particular.
One thing is for certain; the markets are in for a bumpy ride. Traders, be warned.

Categories
Forex Basic Strategies Forex Daily Topic

Trade Ranges Like A Pro with this Effective Forex Trading Strategy

Introduction

The market does not move in random directions. It either trends or consolidates. As many would not know, the market is like a closed circle, and the same states keep repeating over and over again. Thus, in trading, one must learn how to become pro at reading these market states.

On that same note, we shall be going over an effective strategy when the market is in a consolidation/ranging state. However, before jumping right into the strategy, it is important to understand the basics and related concepts.

What is a consolidation phase in a market?

There are several ways to comprehend the consolidation phase of the market. There is logical reasoning behind the occurrence of this state, and is not simply a random pattern that shows up quite often.

The consolidation state is that phase of the market when the market moves in a sideways direction. This state is also referred to as a range. The reason for its occurrence is related to the strength between bulls and bears.

Comprehending a Range

There are two parties in the market – the bulls and the bears. Their strength is what describes the state of the market. In a trending market, either of the parties is powerful. For instance, if the market is going up, it simply means that the bulls control the market. In a consolidation state, both bulls and bears show equal strength. The bulls show strength by pushing the market higher, while the bears show power by taking the price right back down. As a result, the prices in both directions – which we refer to as a range.

How to draw a range?

To trade this range strategy, it is vital to understand how a range is drawn. A range is made up of two levels:

  • Support
  • Resistance

Thus, drawing the correct support and resistance levels will result in a perfect range.

Another point considered is the size of the range. The larger the range, the better. The other small consolidations in the market are ignored. Following is an example of how we pick an ideal range.

In the above example, both are ranges as the market is moving in a sideways direction. However, we do not consider range-1 as a range for our strategy. This is because a single line going up and down fails to depict the market’s price action.

Supply and Demand Range Strategy

What is the usual approach to trading a range? It is to buy at the support and sell at the resistance. But we’re going to step the game a little bit. The supply and demand range strategy uses the same principles of a typical range, in addition to other factors.

Step by step procedure to trade the Supply and Demand Range Strategy:

  1. Find a legitimate range in the market. Mark the Support and Resistance levels appropriately.
  2. Determine the direction of the market prior to the range.
  3. Find a potential supply/demand level.
  4. Get in when the market breaks through the range and reaches the supply/demand zone.

Buy Example

Consider the below chart of GBPCHF on the 4H timeframe. We see that the market has been ranging between 1.1902 and 1.1800. Observe that the support and resistance levels have been marked by cutting off the false market breakouts.

To trade this market, our job is not simply to hit the buy at the support and sell at the resistance. As mentioned, we take into account the preceding direction and the supply and demand levels around it.

The direction of the market prior to the range was an upside, indicating that the bulls were in control previously. A point to note is that, despite the market being in a range, it does not change the fact that the bulls are still powerful. Thus, we rather look for buying opportunities than shorting signals.

To do so, we wait for the price to drop below the bottom of the range and hold at any one of the demand zones. Once the market begins to reverse its direction from south to north around the demand zone, we can go long. The same scenario has been illustrated in the chart below.

Placements

Stop Loss – Well below the demand zone would be decent.

Take Profit – Top of the range would be an ideal spot to take profits.

Sell Example

Consider the chart of CAD/JPY on the 15min timeframe shown below. The recent market price action depicts that the market is moving sideways. The market’s overall trend is down, indicating that the bears are in control of the market.

Since the scenario is opposite to the previous example, we wait for the market to break through the resistance and reach any potential supply level. In the below example, we can see that the price broke through the resistance twice reacted off from the supply, as shown. Thus, we can look for entries when the market begins to switch direction to the downside.

Placements

Stop Loss – Above the supply zone

Take Profit – Bottom of the range

Conclusion

The only way to trade a range is not by buying and selling from the top and bottom of the range. It can be professionally traded with the application of other factors. And this range strategy particularly dealt with the strength of the bulls and bears and the concept of supply/demand.

We hope you were able to comprehend our Supply and Demand Range strategy. Do test them out for yourself and let us know your results in the comments below. Happy trading!

Categories
Forex Education Forex System Design

How to Optimize a Trading Strategy

Introduction

Once the developer successfully ends both the multi-market and multiperiod test of a trading strategy, he can move to the optimization process. However, there are some risks associated with its execution that the developer should recognize.

In this educational article, we’ll present the different stages of a trading strategy’s optimization process.

Preparing for the Optimization

After passing the multimarket and multiperiod test, the developer has verified that the trading strategy works. Therefore, he could move toward the next stage that corresponds to the trading strategy optimization.

Optimization is used to determine the optimal parameters for the best result of a specific process. In terms of trading strategy, the optimization corresponds to selecting the most robust parameter set of a strategy that would provide the peak performance in real-time markets. 

Nevertheless, selecting the highest performance that provides the most robust set of parameters can result in challenging work. This situation occurs because each set of parameters will correspond to a specific historical data range used in each simulation.

In this regard, the developer’s top parameter selection must be part of a set of evaluation criteria defined before executing the optimization process.

Risks in Optimization

The optimization has pitfalls that the developer must consider at the time of its execution; these traps can lead to increased risks when applying the trading strategy.

The first risk is overconfidence that the results obtained during optimization will produce the same market results in real-time. The developer must understand the strategy and each effect of the results obtained in each part of the optimization stage.

The second risk involves excessive overfitting of the strategy’s parameters. This risk is due to the execution of the optimization without considering the guidelines and appropriate statistical procedures.

Finally, using a wide range of parameters can lead to obtaining extremely positive backtested results. However, such positive returns generated during the optimization stage do not guarantee that they will happen in real-time markets.

Optimizing a Trading Strategy in MT4

In a previous educational article, we presented the development process of a trading strategy based on the crossings of two moving averages, which corresponds to a linear weighted moving average (LWMA) of 5 periods and a simple moving average (SMA) of 55 periods. 

This example considers the execution of an optimization corresponding to both moving averages, and the optimization’s objective will be to find the highest profit.

Before executing the optimization, the developer must select the Strategy Tester located in the toolbar, as illustrated in the next figure.

Once picked the trading strategy to optimize, it must select “Expert Properties,” where the developer will identify and define the parameters to optimize.

The next figure illustrates the “Expert Properties” box. In the first tab, the developer will select the Testing properties, where the “Custom” option will provide a broad range of outputs for each scenario obtained during the simulation stage. 

After the Testing selection criteria, the developer can select the parameters to optimize during the historical simulation. In the example, the parameters to optimize will be the fast (LWMA(5)) and the slow (SMA(55)) moving averages. The developer must consider that as long as it increases the parameters to optimize simultaneously, the simulation will increase its length of time.

Once the “Start” button is pressed, the Strategy Tester in the “Optimization Results” tab will reveal each parameter variation’s output. In the case illustrated in the following figure, the results are listed from the most to less profitable. 

The results also expose the Total Trades, Profit Factor Expected Payoff, Drawdown ($), and Drawdown (%), and the inputs for each historical simulation.

In conclusion, the trading strategy based on the cross between LWMA(6) and SMA(192) in the historical simulation returned $1,818 of profits with a Drawdown equivalent to 5.77% or $688.17. Likewise, these parameters are valid only for a 4-hour chart

Nevertheless, analyzing the criteria described by Robert Pardo, which considers that a trading strategy should provide three times the drawdown, the strategy should generate three times the dropdown, in this case, the parameters applied into the model returned 2.64 times more profits over the drawdown. 

Next Tasks After the First Optimization

Once the first optimization was performed, the developer should analyze the trading strategy behavior with non-correlated assets and its performance in other timeframes. 

If the strategy passes this stage, the developer could make a walk-forward analysis. Among other questions, the strategist should answer whether the strategy will make money in real-time trading.  He also should evaluate the strategy’s robustness, where he would determine if the strategy is sufficiently robust and ready to trade in real-time.

Finally, once these stages are successfully passed, the trading strategy should be tested with paper money before its implementation in the real market.

Conclusions

In this educational article, we presented the steps for executing a simple optimization corresponding to a trading strategy based on the cross between two moving averages.

Before starting to optimize a trading strategy, the developer must weigh both the risks involved by the optimization process and the optimization analysis’s objective as the results that the study will generate.

Finally, although the optimization process reveals that the trading strategy is robust, the developer must continue evaluating if it can generate real-time trading profits.

Suggested Readings

  • Jaekle, U., Tomasini, E.; Trading Systems: A New Approach to System Development and Portfolio Optimisation; Harriman House Ltd.; 1st Edition (2009).
  • Pardo, R.; The Evaluation and Optimization of Trading Strategies; John Wiley & Sons; 2nd Edition (2008).
Categories
Forex Videos

Forex Position Sizing 11 Part 2


Forex Position Sizing 11 Part 2

In Part I, we have discussed how position size should depend on the trading system’s quality and how that quality can be assessed. Then, we presented a practical method to simulate nine different systems with SQN from 1 to 5, to be used in our position size simulator. In part II, we will explain how to simulate 10,000 years of trades and the maximum position size required for a desired max drawdown level.

Risk of Ruin

The term “ruin” is usually associated with the burn-out of a trading account. In this case, we will associate it with the odds of reaching a determined level of drawdown. The level at which a trader no longer would trust the system or considers himself unfit to trade.
Since this drawdown figure is particular to every trader, we will consider drawdown points starting from 5% and up to 50% in 5% steps.

The study

We have designed a computer simulation using Monte Carlo resampling of the original 10,000 trades computed for every system created. The simulation will create 10,000 resamples of 500 trades, each simulating one year of activity, thus creating 10,000 years of market activity.
We initially created a range of position sizes, starting from 0.2% up to 10% in 0.2 steps. As we saw that the max position sizing was below 5%, we have created a second round using position sizes from 0.2% to 5% in 0.1% steps and defined as ruin if in more than 1% of the 10K simulations the max drawdown reached the predefined level (from 5% to 50%). The table shows the max position size allowed for a defined max drawdown (ruin).

We have made a second simulation using 10% instead of 1% as the trigger level. Thus, the later table summarizes 10% odds (1 in 10 years of activity) that the max drawdown of a system touches the predefined levels.


Discussion

Considering both tables, a novice trader should be cautious and go to the safe side while learning the job. Thus, If I were new to trading, I’d assume the system’s quality to be low for two reasons. One, My system is the combination of technical signals and my interpretation of them and random factors. Also, the theoretical results of a back-tested system are always higher than the real-time results. Two, being new in this field, I still do not know my psychological reactions to losing streaks and drawdowns.

Thus, my first choice would be SQN 1 and 10% drawdown using the second table, which gives me one year in ten of 10% drawdown and one in 100 years of a 15% drawdown, but usually much less than 10%. That will mean my preferred position size will be 0.5% risk on the current account balance. After achieving 100 live trades and experience with drawdowns, we should recalculate our strategy’s parameters and consider a new position size.

A trader with 2-3 years of forex experience would prefect his strategies and reactions to the market action. Thus, an SQN 3 system is within reach. He would also accept up to 25%-30% drawdown risk. For a trader like this, a 2.5% risk would be quite reasonable.

Successful traders with over ten years of forex experience, combining fundamental and technical analysis with his trained intuition, will likely reach an SQN 4 level and taking the slight risk of 40% drawdown. To successful traders, a position size of 4-4.5% is acceptable if they feel the right pair begins moving as they planned.

As we can see, your personal experience, risk tastes, and system performance are the variables you should consider when deciding which position size best fit your needs.
Finally, this study considers that the trades are made one by one; therefore, the position size should be split into the number of open trades usually taken by the system.

Categories
Crypto Daily Topic

What is Ripple, and Should You Buy It?

Introduced in 2012, Ripple aimed to facilitate seamless, fast, and cheap global money transfers. It is different from other cryptocurrencies in the way it works and what it aims to achieve. Bitcoin came as a digital currency and Ethereum as a smart contracts platform. But Ripple entered the scene as a payments infrastructure. Today, its digital currency is among the most popular – only surpassed by Bitcoin and Ethereum in market capitalization.

In this article, we take a deep dive into this fascinating cryptocurrency network. We will look at how Ripple works, its pros and cons, compare it with Bitcoin, and even look at how you can use it. Read on to find out more about Ripple.

Understanding Ripple

We’ve just said that Ripple is different because it is a payment infrastructure. But what exactly is a payments infrastructure? In the interest of simplicity, let’s say it is any platform that facilitates the transfer of funds between individuals. For Ripple, this transfer happens in real-time and on an individual order basis. In other words, this network is a real-time gross settlement (RTGS) system. 

The Ripple platform consists of the XCurrent messaging technology and the XRP currency. SWIFT is currently the most popular inter-bank funds transfer system. However, the recent adoption of the XCurrent messaging technology by some leading global banks has created uncertainty over SWIFT’s future. 

Ripple was created by Ripple Labs Inc. Unlike another crypto, which is usually generated through mining, Ripple Labs created the entire 100 billion XRP that circulates within the network. The company, strangely, holds 55 billion of these. 

While Ripple runs on open-source software, the network is not really decentralized – which the executives of Ripple Labs’ vehemently refute. The CTO is quoted saying that the XRP ledger existed even before Ripple Labs was founded, and that XRP will continue to circulate even if the company collapses. Cryptocurrencies are loved because they are decentralized. For Ripple, the company’s involvement in developing the network complicates the matter. Nevertheless, it remains the third most popular crypto going by total value of coins in circulation. 

Current Applications

Ripple’s utility extends beyond sending crypto from one person to another – the company’s recent partnership with Banco Santander demonstrated its potential in facilitating RTGS in mainstream banking. According to the Financial Times, this partnership allows the bank’s customers to send money across the globe in different currencies. That said, Ripple is mainly used for currency exchange and remittances. 

While the banking industry may be shy in adopting XRP because it’s volatile – like all other cryptos, it is likely to embrace Ripple’s payment infrastructure. Should that happen, Ripple will enable banks to make instant transfers and in different currencies while avoiding the high costs associated with SWIFT.

Ripple Versus Bitcoin

Ripple and Bitcoin are both blockchain-based technologies. This similarity should not make you think that Ripple is simply another cryptocurrency, just like Bitcoin. These two fundamentally differ in the following ways:

  • Mining: Bitcoin miners get rewarded with new coins. Ripple is not mined as all the coins were created when the network was built.
  • Underlying technology: Bitcoin transactions are verified using the proof-of-work concept (mining), while Ripple uses an iterative consensus.
  • Speed: Bitcoin takes an average of 10 minutes to commit transactions, while Ripple needs only 5 seconds. Ripple’s fast speed is what makes it suitable for RTGS.
  • Transaction cost: Bitcoin charges upwards of $2 per transaction, while Ripple costs about $0.004. The low transaction fees give Ripple an edge over SWIFT for remittances.
  • Supported currencies: The Bitcoin network supports only once currency while Ripple was built to support any currency.
  • Ownership: Bitcoin is decentralized, while Ripple is controlled by Ripple Labs Inc.

How to Use Ripple

Ripple can be used by both individuals and financial institutions. For individuals, it works like other cryptocurrencies – you can invest in it or use it to make payments. For banks, Ripple’s usefulness lies in its payment infrastructure technology. Let’s take a closer look at how the platform plays out in these two scenarios. 

For Individuals

As mentioned above, you can invest in Ripple (XRP) or use it for payments – just as you would with any other crypto. For this, you will need a digital wallet that supports XRP. There is a good review of XRP wallets on this page. Secondly, you need to identify a reliable exchange from where you can buy XRP; Bitstamp, Kraken, and GateHub are good options. Most of the exchanges offer XRP/USD, XRP/EUR, and XRP/BTC exchange pairs. Also, most of them will deposit the purchased XRP on your account on that website. Always ensure you move the funds to your private wallet soonest possible. 

For Banks/ Financial Institutions 

Ripple was developed with banks and other financial institutions in mind. The aim was to make cross-border fund transfers fast, cheap, and transparent, which banks have been unable to achieve for decades. 

Ever since, banks have been using SWIFT, an interbank telecommunication system, to send money across borders. SWIFT is expensive. Also, its transfers take about 1-4 business days to reflect. People seeking to make cross-border remittances have had to endure this reality for the last four decades. However, things are changing. Several major banks have seen the light and are now using Ripple’s messaging system to achieve the same function as SWIFT, but faster, more cheaply, and transparently. 

Just like SWIFT, Ripple’s payment infrastructure does not hold any funds – it is simply a messaging system. This means that banks do not have to overhaul the entire remittance process when adopting Ripple, and thus, the switch to Ripple should be swift (no pun intended).

Having cheap, instantaneous cross-border transfers is everyone’s wish, but until all banks adopt Ripple’s platform, such transfers will have to stay on the wishlist. 

Ripple’s Pros 

  • Fast transactions – Transactions on Ripple are among the fastest among cryptocurrency networks. Within 3-5 seconds, the transfer of funds from person A to person B can be complete.
  • Supported by a reliable technical team – Ripple is supported by a team of world-class engineers because the company can afford them.
  • Reliability – The platform has been tested by some of the world’s largest banks, meaning it is a reliable solution.
  • Low cost – Transaction fees on Ripple are very competitive.

Ripple’s Cons

  • Centralized – Ripple Labs owns 55% of the total coins in the network, which makes it too powerful. Decentralized governance is one of the characteristics that have made cryptocurrencies attractive. 
  • Focus on banks/ financial institutions – Ripple was largely designed to benefit banks and financial institutions. Individuals might be unable to leverage the platform’s full range of capabilities. 

Closing Remarks

Ripple is an original, fresh, and unique solution to the age-old problem of cross-border money transfers and, as a digital currency, an alternative to Bitcoin. We have seen that the crypto network is primarily focused on financial institutions. However, you can still use XRP to make payments or invest in it. So, if you are a crypto enthusiast, XRP is a good alternative to other altcoins. 

For financial institutions, Ripple introduces speed, low-costs, and transparency in international money transfers. Many of the world’s largest banks have already tested its payment infrastructure – giving it the seal of approval that other financial institutions can rely on. Ripple promises faster and cheaper money transfers. However, we might have to wait for long as banks consider its adoption. Until then, we will have to endure the slow and costly SWIFT transfers.

Categories
Forex Videos

Forex Position Sizing 11 Part 1 – System Quality and Max Position Size!

Position Sizing XI- System Quality and Max Position Size

In this video presentation, which will be made in two parts, we will analyze the role the quality of a system has over how much risk we can have on trades, and compute the position sizes needed to avoid surpassing a desired max drawdown level.
It seems quite understandable that the system’s quality is directly correlated to the amount of potential profits it can deliver. What is less evident to many traders is it is also related to the drawdowns, and thus, to the risk amount it can withstand before drawdown goes below the trigger point beyond which a trader feels it is too much.

Measuring the quality of a system

To evaluate the quality of a system, we need to acquire a certain amount of past trades, so as to have enough data points to apply simple statistical tests. It is recommended to have a minimum of 100 trades, although as more trades are collected, the statistical results would be much accurate.

There are several ways to compute the quality of any system. The more common takes the ratio of the mathematical expectation (ME) over its standard deviation (SD) multiplied by the squar e root of n, the number of trades. This method’s results, though, vary with the n. For the purpose of evaluating the performance of trading systems, it is better just to take the ME/SD ratio and multiply it by ten. This is the method proposed by Van K. Tharp, which he calls System Quality Number (SQN)

SQN = 10 x ME/SD

SQN makes the system quality evaluation Independent of the number of trades. The only requirement is to ensure a collection of at least 100 trades.

Normalising the data

Of course, for this method to have sense, the data collected has to be normalized. That means, all trades must be normalized to one trading unit, that is, all trades must be taken at the same position one lot ( or one mini, micro-lot). To further normalize it we should take the reward/risk ratio instead of the raw profits.

Let’s say we have a list of trades, made using the same position size. Thus the collection can be normalized with the following Python code:

loss = [ x for x in trades if x < 0]    # the collection of all losing trades
avloss = -np.mean(loss)    # taking the average of loses ( sign changed)
norm_trades = [trade/avloss for trade in trades]

Now, we have all trades normalized for the application of the average and standard deviation. Furthermore, the average obtained will reflect the expected one-dollar-risk average profit on every trade.

Position Size and Downside Potential

in our previous videos on position sizing, we have already shown that all things being equal, the position size is what determines the max drawdown of a determined sequence of trades. Being capital preservation the primary goal of every trader, knowing how much downsizing will deliver a specified system is critical to optimize the returns, but taking care drawdowns do not pass the psychological point beyond which the trader considers the system has failed.

Simulating a trading system

To generate a synthetic trading system of the desired quality, it is relatively simple in Python. All trading systems can be modeled by two parameters: The winners’ percent and the payoff, or average reward/risk ratio. To make it more standardized, we have set the percent winners in all the generated systems to 50%, modifying only the payoff.

We created nine systems with SQN figures from 1 to 5 in 0.5 steps. The first system is of low quality, but perfectly tradeable. In fact, we consider SQN 1 to be an average trading system. SQN 2 is already a very nice system. All systems beyond SQN 2 are great systems, and if by chance you own an SQN 5 type system, please keep it safe because it is a real gold mine.
The basic Python code to make 10,000 trades with 50% winners is:

t = np.random.binomial(1, 0.5, 10000) # Creating a random sequence of heads and tails

This is half the job. We need to add a payoff to complete it. In the case of SQN 1 this is the code:

payoff = 1.27
trades = [payoff * x if x > 0 else -1 for x in t ] # creating the W-L sequence


Please note that, even when we aimed at 50% profitable trades, the inherent randomness of the process resulted in only 49.09% of them profitable. Also, we used the same sequence for the payoff application and get the different SQN figures; this makes this analysis more robust, as only one parameter was changed.


Categories
Forex Market Analysis

Australian Dollar Prepares for Interest Rate Decision and Retail Sales Data Ahead

Overview

The Australian Dollar will face two high volatility events; the first one corresponds to the interest rate decision, for which the analysts’ consensus foresees a rate cut to 0.1% from the current 0.25%. The second one corresponds to September’s Retail Sales figures, where the consensus expects a recovery. Nevertheless, the price action suggests a new decline before reversing.

Market Sentiment

From a fundamental perspective, the Australian Dollar will have two high volatility events that will drive the next week’s oceanic currency movements.

The first event corresponds to the Interest Rate Decision, which will occur on Monday the 2nd during the overnight session. The analysts’ consensus foresees a reduction from the current rate of 0.25% to 0.10%. 

The last interest rate cut by the Reserve Bank of Australia’s broad members occurred in March 2020, where policymakers decided to cut the reference rate from 0.5% to 0.25%.

The second high impact will occur in the overnight trading session of Tuesday 03rd, where the Australian Bureau of Statistics will release the Retail Sales (MoM) data corresponding to September. The analysts’ consensus foresees a decline to 1.5%. 

Although the analysts’ polled foresee a contraction for September, they expect an improvement in the retail sector after falling 4% in August.

On the market sentiment side, the GBPAUD cross in its daily chart exposes the 90-day high and low range, which reveals the short-term participants’ sentiment. 

The previous chart illustrates the price action moving in an upward sequence that began on September 11th that pushed the cross from the extreme bearish sentiment zone toward the extreme bullish sentiment zone. 

In fact, the 60-day moving average movement below the price confirms the bullish bias that carries the cross. The next supports locates at 1.82688, which corresponds to the extreme bullish sentiment zone support, and 1.81227 corresponds to the 60-day moving average that acts as a dynamic support.

In summary, considering the pessimistic forecasts by the Australian data analysts and the extreme bullish sentiment unveiled in the GBPAUD cross, there exist the possibility of further weakness in the oceanic currency.

Technical Analysis Outlook

The big picture of the GBPAUD cross under the Dow Theory exposed in its 2-week log-scale chart reveals the price is moving mostly sideways since early March 2013, when the price touched its bottom of 1.43811. Once the cross found buyers, the price raised until 2.23722 reached in mid-August 2015. 

Once the March 2015 high was reached, the pair started to correct the Primary trend finding support at 1.57896 in late October 2016. This correction accomplishes the Dow Theory rule that says that the Secondary trend retraces between 33% to 66% of the Primary trend. 

The same situation occurs with the ascending sequence that advances from 1.57896 toward 2.08522 reached in mid-March 2020, which retraces beyond 66% of the previous decline. 

Likewise, the GBPAUD cross started to develop a downward sequence, which found a bottom at 66% of the previous rally. Nevertheless, considering the price and time relationship between the last decline and the previous two movements, we conclude that this decline corresponds to the Minor trend of the Secondary upward trend, which looks incomplete. 

The GBPAUD outlook under the Elliott Wave Theory exposes the progress in a downward five-wave sequence, which advances in its incomplete wave 4 of Minor degree labeled in green. This corrective structural series currently moves in its wave ((a)) of Minute degree identified in black.

Considering the elliott Wave theory, the current wave in progress should develop three internal segments and advance until the zone between 1.86783 to 1.90442, where the cross could find resistance and start its wave ((b)) in black.

Likewise, considering that the third wave of Minor degree is the extended wave, the fifth wave should fail to reach a lower low than the end of the third wave of Minor degree located at 1.74935. Finally, the invalidation level of the bearish scenario is located above 1.95100.

Categories
Forex Course

166. Introduction To Obscure Currency Crosses & Why It Is Very Risky To Trade Them?

Introduction

Trading currency crosses an excellent way to make money from forex trading when major currency pairs do not make a good move due to the US economy’s corrective momentum. However, the US dollar is a global reserve currency of every country. Therefore, it can provide enough liquidity to make money where the obscure currency crosses have some risks due to insufficient liquidity.

What is Obscure Currency Cross?

We can find currency crosses when we eliminate the US dollar from major and commodity currencies. However, among the cross currencies, the Euro and the Japanese Yen are mostly traded. Therefore, if you trade any Euro and Yen related cross pair, you might see the price to have adequate liquidity. But, what happens if the currency cross does not have Yen or Euro?

Any cross currency pairs that do not have Japanese Yen or Euro as a first or second currency is called an Obscure currency cross. Examples of obscure currency crosses are GBPCHF, NZDCAD, AUDCHF, CADCHF, NZDCHF, NZDCAD, etc.

Why are Trading Obscure Currency Crosses Risky?

The forex market is run through a decentralized network where no one can dominate any market. Therefore, the movement of a currency pair depends on the supply and demand of that currency pair. When the supply or demand increases, the currency pair starts to move. On the other hand, when there is less volume, the currency pair may move within a correction.

The liquidity remains lower in the obscure currency pair than major, commodity, and EUR/YEN related currency pairs. Therefore, there is a risk of market volatility and correction. In some cases, obscure currency pairs consolidate for a long time, and if we take any trade on that pair, we might have to hold the trade for a considerable time.

Conclusion

In conclusion, we can say that trading obscure currency pairs have some reason to worry due to not having enough liquidity to provide a decent movement. However, it is a great way to make money from obscure currency pairs if we can read the price action well and identify the price is moving within a trend. Overall, maintaining a profitable and robust trading strategy is the key to make a consistent profit from the forex market.

[wp_quiz id=”86520″]
Categories
Cryptocurrencies

Introducing Electra (ECA)

Before blockchain, people had to contend with slow and expensive cross-border transactions, and merchants had to give up high percentages of their revenue in the payment process. Well, it’s still pretty much that way, but it doesn’t have to be any longer. The revolutionary features of blockchain, such as decentralization, high-level security, and transparency, should change the game. 

Electra (ECA) is a blockchain effort that seeks to revolutionize how the world views payments. Founded in 2017, Electra is a financial management system that will allow merchants everywhere to use an alternative payment method free from intermediaries or centralized control. The protocol will offer users what traditional systems have failed to do for ages: friendly fees, instant transactions, immediate access to funds, state-of-the-art security, and more. 

The Electra protocol is embedded with the Lightning Network, atomic swaps, and PoS 3.0e. In the future, it intends to integrate SegWit as well as smart contract functionalities. 

Understanding Electra

Electra (ECA) is an open-source crypto and blockchain project for facilitating peer-to-peer payments across the globe. The project wants to provide a secure, cost-effective, and more flexible alternative to the traditional payment model where merchants pay up to a 3% processing fee. 

Using Electra, merchants can pay for transactions at the negligible rate of 0.0001 ECA. This is compared with the flat merchant discount rate (MDR) rate that gives businesses, especially small businesses, the shorter end of the stick. And, they usually have to wait for days to receive payments. 

Electra seeks to facilitate micropayments. To achieve this, the Electra blockchain can process up to 800 transactions per second (TPS) with a confirmation time of 64 seconds. This allows merchants to receive payments in milliseconds. Just like on Bitcoin, merchants can ultimately decide their transactions’ finality based on how many blocks have passed. Electra also removes the need for intermediaries between merchants and customers, providing for a leaner and more cost-effective process. No intermediaries mean more secure transactions as well, since the possibility of fraud is vastly reduced. 

Electra: Existing Products

Over the years, Electra has rolled out various products to realize its mission of more affordable and secure payments. Let’s look at each one by one. 

#1. ElectraPay

This is a tool that allows merchants from anywhere in the world to register and accept e-commerce payments. When they sign up, they generate an API key – a unique identifier that authenticates payment and billing requests. Currently, Electra supports the WooCommerce plugin. The WooCommerce plugin can be used on WordPress sites. 

With the plugin, a merchant can track the status of every order via the portal. They can also track their account information and update it if necessary. Finally, they can see all changes made in the order records and by whom. Transactions via the Electra network can be seen by both the merchant and the customer in near real-time. 

#2. Point-of-Sale System

Electra also supports a Point-of-Sale solution that’s directly linked to the ElectraPay merchant account. This integration allows the merchant to plug in on both the online and physical environments. 

User Benefits

The Electra protocol provides multiple benefits for users – whether active users or just fans of the project: 

  • Ability to join the community and contribute to the monetary value and market standing of the project and coin
  • Seamless installation of ElectraPay complete with a plugin for both online and offline environments
  • Enjoy safe and secure payments based on the NIST5 algorithm.
  • Negligible transaction fees of 0.00001% – way lower than debit or credit card options
  • Near real-time transactions with a 64 seconds confirmation time
  • Worldwide ATMs for easy integration with the Electra debit card
  • Zero exchange fees
  • Rewards upon staking Electra coin

Key Metrics of Electra Coin (ECA)

ECA is the native cryptocurrency of Electra. It plays a pivotal role in the ecosystem, from facilitating payments to staking. Let’s see the coin’s current market standing: 

As of October 16, ECA traded at $0.000173, with a market cap of $4,954,908 that placed it at #713. The coin had a 24-hour volume of $383.80, a circulating and total supply of 28,712,458,937, and 29,579,615,490, respectively. The coin’s all-time high was $0.010651 (Jan 04, 2018), while its all-time low was $0.000001 (Dec 01, 2017). 

Where to Buy and Store ECA

ECA is listed on several legit exchanges, including CoinFalcon, Crex24, HitBTC, Coindeal, STEX, Fatbtc, Altilly, and Coinbene. 

The Electra team provides several official wallets, including a Windows Wallet (32 and 64 bit), MacOs wallet, Linux/RPi wallet, and wallets for Android and iOS. The team also recommends these third-party wallets: Magnum, My Staking Wallet, Ellipal and Secux. 

Closing Thoughts

Electra is one of several blockchain projects that are making things easier for merchants all over the world. With near real-time settlements, fast speeds, and incredibly cheap transactions, it helps bring blockchain benefits to real-life use. Hopefully, projects like these can push blockchain to wider use and acceptance.

Categories
Crypto Market Analysis

BTC/USD Chart Overview + Possible Outcomes

In this weekly BTC /USD analysis, we will be looking at the most recent events, the current technical formations, as well as discussing possible outcomes.

Overview

Bitcoin has spent another week pushing towards the upside. This time, it has passed the resistance zone at ~13,200 and pushed further towards the 2019 yearly high of $13,900. Breaking this level signifies a crucial move towards reaching all-time highs as the zone between $13,900 and the $20,000 level has close to no volume, meaning that it is “air-filled.” The moves in this zone will include a lot of volatility due to people taking profits as well as FOMO-ing in.

Technical factors


Bitcoin has conquered the ~13,200 zone after a week of trading above it and a couple of retests. However, a new high is in sight, the 2019 yearly high of $13,900.

Bitcoin is booming with bullish indicators, with its downside being guarded by the 21-period moving average, as well as hash ribbons making a crossover into miner capitulation (a huge bullish signal).
Hash Ribbons are great for detecting market bottoms or preparations for another spike, and it is one of the indicators that has provided traders with the most stable and predictable returns (and with low drawdowns).

However, the technicals factors will have no effect on the strength of the move once it happens, and Bitcoin’s short-term direction will remain unclear until it confidently breaks or pulls back from the $13,900 level.

Likely Outcomes

Bitcoin has two main scenarios it can play out, which will depend on how the “fight” for $13,900 ends.
1: If it confirms its position above the level, we can expect the unexpected, as there is close to no sell pressure above. However, many will start taking profits so unexpected downswings might happen. With that being said, the most likely target after breaking $13,900 is $13,640, which is one of the small consolidation points which happened during the 2017/2018 spike.
2: The other scenario is just as likely, and involves Bitcoin rejecting $13,900, thus creating a double top and a short-term pullback. This pullback might end at the $13,200 zone, which historically has a lot of buy and sell pressure, or even further down towards $12,470.

We also have to note that, whichever of these scenarios play out, Bitcoin’s overall sentiment is extremely bullish and that investors that do not like trading should just stick with what they are comfortable with.

Categories
Forex Course

165. Knowing More About Trading The Euro & Yen Crosses

Introduction

In cross-currency trading, the Euro and Japanese Yen are the most traded currency. Therefore, after major currencies, EUR and JPY has the highest liquidity in the forex market. Overall, trading in the Euro and Yen crosses are secure compared to the other cross currencies.

Understand the European Economy

When trying to trade in any Euro cross pairs, we should understand the European economy even if we only follow technical analysis. In technical analysis, traders can make decisions based on previous price movements. Therefore, many traders think that there is no need for fundamental analysis.

However, in trading, we aim to increase the probability of our analysis. Therefore, when we add Europe’s economic condition, we will have a better outlook of trading Euro crosses like- EURCHF, EURAUD, EURNZD, etc.

The European economy consists of several countries, including France, Italy, Germany, etc. Therefore, trading in the Euro cross requires to know interest rate decisions, retail sales, employment export-import, GDP, and other economic releases of these countries.

Moreover, in Euro cross trading, we should focus on other currencies that combine with the Euro. For example, if we want to trade in the EURCHF pair, we should focus on Switzerland’s economic condition.

Understand the Japanese Economy

In Yen cross trading, we should have extensive knowledge of the Japanese economy. Japan is an export-oriented country. Therefore, it tries to depreciate its value against other major currencies by keeping the interest rate lower.

Overall, any increase in interest rate, retail sales, employment, and GDP are suitable for the Japanese economy.

Besides the Japanese economy, we need to understand the economic condition of the Japanese Yen combination. For example, trading in the CADJPY pair requires a fundamental analysis of both the Japanese and Canadian economies.

Conclusion

Overall, the Euro and Japanese Yen cross are mostly traded currency in currency crosses. Therefore, to trade Euro and Yen crosses, we should know these two countries’ economic conditions. Even if we don’t trade based on fundamental analysis, having good knowledge is essential to have an overall outlook of the economy. Cheers.

[wp_quiz id=”86515″]
Categories
Cryptocurrencies

What’s Alpha Finance Lab (ALPHA)?

DeFi is the hottest topic in the crypto and blockchain space now, and the reason it’s so popular is the countless benefits it affords users. Financial instruments have been a preserve of the top few elites for too long, and DeFi is set to change that. As of now, we have multiple DeFi projects aiming for the top spot in terms of offerings, user experience, and more. 

Less than a year old, Alpha Finance Lab is one of many DeFi contenders emerging. The Alpha tram wants to empower people to “reclaim control over their digital presence.” So what does it offer potential users? We answer that question in this article. 

Breaking Down Alpha Finance Lab 

Alpha Finance Lab is a DeFi ecosystem that will integrate various products and bring users the experience of different blockchains, starting with Binance Smart Chain and Ethereum. The Alpha team wants to “drive cross-chain DeFi and cross-chain liquidity through building interoperability among Alpha products and integrating with leading ecosystem partners to drive the next stage of DeFi.” 

The Alpha team wants to achieve the following: 

  • Sustainable yield generation upon users’ depositing of supported assets
  • Eliminate or reduce the risk if impermanent loss (IL)
  • Facilitate privacy-oriented asset exchange
  • Support lending with already-provisioned interest rates 

Alpha: Existing Products 

The Alpha platform is building a mix of products that will be interoperable across Binance Chain and Ethereum and will support more blockchain platforms in the future. With that, let’s look at the platform’s current offerings: 

#1. Lending

Alpha supports lending through its Alpha Lending protocol. On the protocol, users can earn interest by depositing supported assets. Deposited assets will be transferred into a smart contract that will allow users to borrow money for trading. When borrowers pay back interest, it will be pooled and proportionately awarded to liquidity providers depending on their contribution. 

If you want to be a lender, they can deposit any of the supported tokens, e.g., Ethereum, into the protocol. After this, you’ll receive aITokens (such as aIETH), which are interest-generating tokens that will represent your share of the deposited ETH. 

#2. Borrowing

If you wish to borrow from the Alpha protocol, you first have to deposit supported assets as collateral. After that, you’ll receive aITokens. Assets eligible for collateralization have been assigned a Loan-to-Value (LTV) ratio. Let’s say the LTV for ETH is 70%. If you deposit ETH as collateral, you can borrow any asset in the pool and up to 70% of the value of the ETH you deposited. 

#3. Interest rate 

The interest rate will be determined by the asset’s utilization rate; in other words, the amount of deposited assets that have been borrowed. The bigger the utilization rate, the higher the interest rate. 

#4. Risk and Liquidation

Risk of liquidation is when the total value of the assets you borrow exceeds the maximum value you can take. Due to the volatility of cryptocurrencies, it’s recommended that you borrow at a lower value than the maximum value you can borrow. This will cushion you against the risk of liquidation. 

#5. Alpha Homora 

This is a protocol that allows users to leverage their position in liquidity mining pools. As a user, you can participate in the protocol as a yield farmer, lender, or liquidator. You can also participate by finding bugs in the protocol for which you’ll earn rewards. 

ALPHA Token 

ALPHA is the native cryptocurrency of the Alpha protocol, and it has the following current and planned roles: 

  • Liquidity mining: Users can earn ALPHA tokens for providing liquidity to the platform
  • Staking: Token holders can stake ALPHA tokens and get a share of the platform’s revenue
  • Governance: ALPHA token holders can participate in the governance of the platform by voting on project proposals

The Alpha token was distributed in the following manner: 

  • Binance launchpad sale tokens: 10%
  • Binance launchpool tokens: 5%
  • Private sale tokens: 13.33%
  • Liquidity mining tokens: 20%
  • Team and advisors’ tokens: 15%
  • Ecosystem tokens: 36.67%

Community Strategies of Alpha Finance Lab

The Alpha team intends to conduct several strategies to expand the growth of the project. 

These strategies include: 

  • Hosting and co-hosting DeFi conferences and related events to engage with potential users
  • Publishing blog posts every two weeks to update the community on technical updates
  • Engaging with the community via social media channels 

Future strategies include: 

  • Launching the Alpha Finance Lab Program to promote partnerships with similar projects
  • Launching yield farming programs 
  • Launching joint yield farming programs with other industry players

Key Metrics

The ALPHA token was trading at $0.034681 on October 16, 2020. It had a 24-hour volume of $2,489,546, an all-time high of $0.106884 (October 10, 2020), and an all-time low of $0.033573 (October 16, 2020) per Coinmarketcap

Where to Buy Alpha Tokens 

ALPHA has been listed on Coinone, Binance, and VCC Exchange. 

Closing Thoughts 

The Alpha team wants to push DeFi to the next level by focusing on cross-chain interoperability. Like many other DeFi protocols, Alpha provides an opportunity for people everywhere to make money by simply staking in crypto. The project is still young, so let’s see its future innovations. 

Categories
Crypto Guides

Secure Trades using Safex- A Decentralised, Open-Source Crypto Marketplace

Introduction

If you are frequently updated with the blockchain trend, then you must have come across Safex. Unlike most blockchain technologies used for security and transactional purposes, Safex is focused on e-commerce. Even since Bitcoin emerged as a P2P electronic cash system (peer-to-peer), the idea of a decentralized system on which people could easily trade with each other without requiring a centralized governing body has been at the forefront of every technological leap in the blockchain industry.

Living up to crypto enthusiasts and professionals’ expectations of wanting a truly borderless and open P2P trading system that helps both sellers and buyers. Safex is a community and a decentralized protocol built and designed on the original concepts of the individual rights to control, security, and privacy over transactions.

Let’s understand why Safex is the real attraction for crypto investors all across the globe.

What is Safex?

Safex is a privacy-based, decentralized, and open-source e-commerce marketplace designed to help both sellers and buyers and make transactions hassle-free. It allows you to create powerful web stores that are powered by blockchain. Safex has been using the heavily modified blockchain technology called cryptonote that leads to a world-class marketplace. What’s interesting about Safex is that the platform boasts a unique type of commerce-focused smart contract function.

Since data breach is the major vulnerability suffered by most centralized commerce platforms, Safex primarily focuses on privacy, addressing issues like opaque and unfair system for visibility of listings and trades, snooping on online behavior, unwarranted collection of personal data, and arbitrarily large and non-transparent commissions.

Industry experts claim that Safex has revolutionized the e-commerce sector by streamlining the processes and providing the e-commerce ecosystem with sheer privacy, which was previously not there.

More than 10,000 individuals have already invested in Safex Token and Cash after recognizing the project’s potential.

Why Safex?

Credit card fraud, privacy issues, and unfairness to small to medium-scale sellers are a few of the many problems affecting everyday users. With Safex, users get a solution in the form of secure online payment, an embedded privacy coin for free, and a marketplace on a blockchain. Safex combines Shopify, Upwork, and Amazon’s functionalities into a single platform, creating a new future for online shopping that eliminates the difficulties and challenges that users have to deal with every day.

Safex Features and Functionalities

With Safex, small sellers from across the world will have access to a global client base.

Engine for E-Commerce – Safex offers a decentralized database and an integrated global payment engine, which adds security and a privacy layer to online stores.

Safex Marketplace – Safex is a decentralized marketplace on a privacy blockchain, allowing sellers to gain exposure to the wide network of Safex users.

Privacy Blockchain -Safex uses functionalities like One-Time Address and Ring Signatures to maintain the senders’ anonymity and recipients of transactions.

Conclusion

Safex has already developed a strong community of users who believe in the project. Since blockchain is the future of online payment, Safex can prove to be a game-changer in how people carry out online transactions.

Categories
Forex Course

164. Do You Know What A Synthetic Currency Pair Is?

Introduction

In institutional trading, traders usually take trades with a more significant volume, which often makes trading impossible in some currency pairs due to not having enough liquidity. Therefore, institutional traders create synthetic currency pairs to take trades on those pairs.

What is a Synthetic Currency Pair?

If an institutional trader finds a possibility of a decent upward movement of AUDJPY pair, but due to not having enough liquidity, they might be unable to take a buy trade. However, the alternative option to take the trade is to buy both AUDUSD and USDJPY as there is enough liquidity in these pairs. As a retail forex trader, we can take similar action as institutional traders. If we perform AUDUSD and USDJPY trades at the same time, we are trading in synthetic currency pairs.

In our current world, Internet connectivity makes trading easy; therefore, many brokers offer to trade currency pairs like CHFJPY or GBPNZD. However, these pairs have some issues regarding the spread and overnight fee. In some cases, cross-currency pairs like AUDCHF, GBPNZD, and CHFJPY move within a consolidation for a specified period. Therefore, trading in these pairs is costly, even if the broker allows.

How to Create Synthetic Currency Pairs?

Creating synthetic currency pairs need to open two trading entries with its margin. In synthetic currency trading, there is a common currency bought in one currency pair and sold in another currency pair. Overall, we will eliminate the common currency by buying and selling; therefore, the ultimate currency pair will remain that we are expecting to buy.

Is Synthetic Currency Pair Trading Profitable?

Trading in synthetic currency pair requires an additional margin, which is not wise to use. Moreover, in the present world, most brokers allow maximum currency pairs that reduce the hassle of trading two currency pairs at a time. Therefore, it is not recommended that traders trade in synthetic currency pairs if the broker has an option to take trades on the main currency pair.

Conclusion

Synthetic currency pair is a combination of the currency pairs where a single currency is bought in one pair and sold in another pair. In the present world, most Forex brokers allow trading cross and exotic currency pairs that eliminate the need for synthetic currency pairs. However, if any broker does not allow trading in a specific pair, we can use this method.

[wp_quiz id=”86510″]
Categories
Forex Daily Topic Forex Price Action

How to Professionally Deal with Fake Breakouts!

In today’s lesson, we are going to demonstrate an example of an H4 breakout at the weekly low. The price consolidates after the breakout and produces a bearish reversal candle right at the breakout level. It is a matter of time for the sellers to go short and drives the price towards the South. Let us find out what actually happens.

The chart shows that the price makes a good bearish move. It finds its support where the pair is traded for a while. The pair closes its week by producing a bearish candle. By looking at the chart, it looks that the sellers are going to keep their eyes on the chart next week.

The pair produces a bullish engulfing candle to start its trading week. The buyers on the minor charts may push the price towards the North. However, the H4 chart is still bearish biased.

The chart shows that the price may have found its resistance. The price has been in consolidation for a while. The last candle comes out as a bearish engulfing candle. The price may make its move towards the South now.

The chart produces consecutive bearish candles and makes a breakout at the last week’s low. The pair is traded below the breakout level for two more candles as well. The sellers are to wait for the price to consolidate and produce a bearish reversal candle followed by a breakout at the consolidation support to go short in the pair.

The chart produces a bullish engulfing candle closing within the breakout level. The next candle comes out as a bearish inside bar. The sellers would love to get a bearish engulfing candle closing below the bullish candle’s low. However, a breakout at the consolidation support would signal the sellers to go short in the pair. By drawing Fibonacci levels on the chart with Fibonacci extension, we see that the price finds its support at the level of 38.2% and finds its resistance at the level of 23.6%. In a word, the stage is getting ready for the Bear to make a move.

The chart produces a bullish candle. It is not a good sign, but the sellers still have hope. If the chart produces a bearish reversal candle again followed by a breakout at the level of 38.2%, the game is on for the sellers.

Now, the chart produces another bullish candle and heads towards the North. The sellers must be very disappointed since it seemed such a nice trade setup for them. The reality is it often happens to all traders. No point in being disappointed, but it must be dealt with professionalism.

Categories
Forex Market Analysis

US Dollar Index Advances Boosted by Surprising Economic Growth

Overview

The US Dollar Index accelerated its gains on Thursday’s trading session boosted by the surprising economic recovery in Q3 2020 that advanced 33.1%, beating analysts’ expectations. Nevertheless, although Greenback’s intraday recovers, the price could see a new decline in the coming trading sessions.

Market Sentiment 

The US Dollar Index (DXY) raises on Thursday trading session by 0.54%, boosted by Q3’s GDP growth rate, which beat the analysts’ expectations.

The US economy expanded in the third quarter by 33.1% in Q3 2020, beating the analysts’ consensus of a 31% raise. This reading is the biggest expansion in the economy following the previous  Q2 period, which unveiled a record 31.4% plunge triggered by the coronavirus lockdown.

The following chart exposes the US Dollar Index in its daily timeframe. The figure unveils the 90-day high and low range, the price action moving mostly sideways in the bearish sentiment zone. 

Likewise, the intraday activity develops a strong bullish movement during its Thursday’s trading session, which looks accelerating, supported, as already said, by the surprising Q3 GDP growth, whose figure was released on Thursday before the US session’s opening bell. 

In summary, the US Dollar Index context shows that the big picture of the market is on the bearish side. However, the intraday activity reveals an upward thrust representing an upward correction of the Greenback’s primary bearish trend.

Technical Analysis Outlook

On the technical side, the US Dollar Index unveils its price movements in an incomplete corrective formation, which still could visit fresh lows.

The next weekly chart and in log scale reveals the DXY under the perspective of the Dow Theory, which exposes to its primary trend developing an incomplete correction of the rally that the Greenback began in early May 2011 and found resistance at 103.82 in late December 2016.

Once the Dollar Index found fresh buyers, the public activity raised, driving the price towards the level of 103.82, where DXY began to develop a corrective move, which remains in progress. The first decline fell to 50% of the previous rally, finding support at 88.25, where the price reacted, developing an upward sequence.

Actually, the price action develops a consolidation structure following a sideways formation, which is in progress since early January 2018. The third segment, which looks in place, accumulates a retracement of around 66% of the corrective formation’s second internal leg. This reading leads us to observe that the current decline could be in an exhaustion stage.

The long-term Elliott Wave perspective for DXY marks its advancement in an incomplete flat pattern (3-3-5), which currently advances in its wave C of Minor degree labeled in green. This current leg could see further declines in the coming trading sessions.

As illustrated in the next 2-day chart, DXY advances its wave ((iv)) of Minute degree identified in black. According to the alternation principle, the internal segment should take more time than wave 2. In this regard, the level of complexity of this corrective formation should be higher than on the second wave. In other words, the fourth wave could be a triangle formation or a double or triple correction.

Finally, the wave C’s potential bearish target can be located below the mid-February 2018 low; it is near the 87.5 level, where the Greenback could start to develop a new bullish cycle of upper degree. The invalidation level of the current bearish scenario is placed at 98.50.

Categories
Crypto Daily Topic Cryptocurrencies

What’s PIVX All About?

Bitcoin has inspired thousands of cryptocurrencies. At the moment, there are 7,434 cryptocurrencies, according to Coinmarketcap. Each cryptocurrency comes with aspirations of being better than the last one in one way or another. Others want to solve the issues inherent with Bitcoin, such as lack of complete privacy, scalability issues, etc. 

PIVX is one of such cryptocurrencies. Launched in 2016, PIVX was the first to use a two-tier staking reward model and both cold and hot staking. 

This article explores the PIVX protocol and what innovations it brings to the space. We’ll also see its native token and how it fits in the puzzle.

Understanding PIVX

PIVX, Private Instant Verified Transaction (Tx), is a decentralized, Proof-of-stake (PoS) cryptocurrency dedicated to privacy, fungibility, community governance, and real-world utilization. PIVX wants to achieve this with the power of several key characteristics: 

#1. Dash/Bitcoin core source-code: The PIVX protocol is forked off of the source code for Dash, which in itself forked off Bitcoin’s source code. Dash’s code is fortified with a tailored PoS algorithm and an enhanced privacy protocol.

#2. Customized PoS algorithm: PIVX’s improved PoS is intended to achieve true decentralization while using as little energy as possible. This PoS also implements a community governance system to be “the ultimate people’s fungible cryptocurrency.” After transitioning from Proof of Work (PoW), PIVX has solely relied on PoS to generate new blocks. Block generation is done by holders of the PIVX token

#3. Masternode network: PIVX features a second-tier network of masternodes through which users can set up specialized full-node wallets if they stake in at least 10,000 of PIVX tokens. The masternodes are entitled to network governance, a role for which they are rewarded with more PIVX. All payouts are done in a completely decentralized manner.

How Does PIVX Differ From Other Blockchain Networks? 

PIVX distinguishes itself from other blockchain networks with the following characteristics: 

#1. Private and Public Staking:

PIVX utilizes a customized Proof of Stake model in which users can stake in PIVX using both hot and cold wallets. Through this, users can mint new tokens and get rewards. Masternodes are also rewarded for every new block that’s minted.

#2. Cold Staking: 

This feature allows users to store coins in one wallet, with the possibility of delegating those coins for staking by another node. This means a staker can have their wallets online and still stake without necessarily having spending access to the coins. Cold staking ensures security for coins and ensures the user can still stake and get rewards even if their coins are stored offline.

#3. Sapling

This is a faster and more efficient replacement for the Zerocoin protocol. 

#4. PIVX Foundation:

PIVX features its own legal footprint, which supports the project legally and financially. The foundation stepped in in 2019 as a subset of the Sustainable Development Goals Impact Fund (SDG) – a Public Charity Donor Advised Fund (DAF). This DAF is the only one in the US that’s not controlled by a bank, uses cryptocurrency, and is focused on helping advance the United Nations’ SDGs. 

How to Stake PIVX

There are two ways to stake PIVX (PIV). One is hot staking, which involves installing PIVX’s core desktop wallet and unlocking it in Staking Only mode. When you deposit coins, they’ll start when they gain 600 confirmations. Hot staking requires that the wallet be online for the process to take place. 

The other method is cold staking, which can be done by installing the core desktop wallet, depositing crypto, and delegating the staking of those coins via the Cold Staking tab to an offline staking address. That address could either be your own wallet or one belonging to a third-party cold staking service provider.

Specs of the PIVX Token 

  • Proof-of-Stake consensus algorithm (both hot and cold staking)
  • Block size of 2 MB
  • Block time of 60 seconds (which re-targets after every block)
  • 173 transactions per second (TPS)
  • Stake-able, with rewards for ownership
  • Masternode support upon staking 10,000 PIV

Key Metrics 

As of October 16, the PIVX token traded at $0.368337, ata market cap of $20, 914, 580, placing it at #337. PIVX has a 24-hour volume of $705, 146, and a circulating and total supply of 56, 781,166. The token’s all-time high was $9.20 (Jan 23, 2018), while its all-time low was $0.000422 (Feb 16, 2016), per Coinmarketcap.

Where to Buy and Store PIV

Today, you can find PIV listed on a variety of exchanges as a market pair of BTC, KRW, ETH, EUR and USDT. Some of the exchanges include Binance, Finexbox, VCC Exchange, Bithumb, Bittrex, KuCoin, Graviex, YoBit, LiteBite.eu, Birake Network, HotBit, Txbit, and VALR. 

You can hold PIV tokens in the PIVX core wallet (Desktop), PIVX Light wallet (desktop), Ledger Nano S (hardware), PIVX Mobile, Coinomi (Mobile/Desktop), and Satowallet (Desktop/Mobile/Web). 

Final Thoughts

PIVX manages to provide something novel for the crypto space, whether its pioneering the Zerocoin protocol or supporting both cold and hot staking. However, its place in the market is not exactly enviable at this point, and if it means to stay relevant, it will need to up its game or risk being relegated to oblivion. 

Categories
Forex Course

163. Trading Currency Crosses Using Fundamentals

Introduction

In fundamental analysis, we can interpret two countries’ economic data of a cross-currency to predict the upcoming price movement. On the other hand, even if we ignore the US dollar, it has some shadow effect on a currency cross.

How to Trade Fundamentals with Currency Crosses

Let’s say Australia’s economic condition is good, and the Reserve Bank of Australia increased the interest rate. As a result, the primary expectation is that the AUD will be stronger against other currencies. On the other hand, we can find other currencies that are facing economic difficulties. Let’s say Eurozone is struggling, and ECB provided some dovish tone to provide an outlook of the current economic condition.

In this situation, we can evaluate the Eurozone’s economic condition and Australia to determine which country is doing well. If Australia shows a better than expected employment report, our first aim would be to buy AUDUSD. However, what happens if the USA showed a strong employment report?

Yes, AUDUSD might consolidate, and the difference between supply and demand would not change. In this situation, it is better to find other currencies that are weaker than in Australia.

Is Fundamental Trading Profitable for Currency Crosses?

In Forex trading, we predict a currency pair’s upcoming movement based on the technical and fundamental analysis. When we see that one currency has reason to become stronger than other currencies, we anticipate the price towards the stronger currency. The fundamental analysis is a process to find a stronger or weaker currency in a currency pair.

Due to having a lot of equity and market participants’ involvement, any fundamental news works well in USD related currency pairs. However, it does not mean trading currency crosses with fundamental analysis is not profitable.

We can quickly evaluate the UK and Japan’s economic conditions to identify the price direction of GBPJPY. Therefore, we can apply the same theory to every currency cross, like AUDJPY, AUDCHF, NZDCAD, or AUDNZD.

Concussion

Fundamental analysis is a process to anticipate the movement of a currency pair based on the two countries’ economic conditions. However, making an analysis ideally is the primary tool to make a profit from the forex market. Therefore, we should focus on money management, risk management, and trade management to get the ultimate trading result.

[wp_quiz id=”86506″]
Categories
Cryptocurrencies

Secalot wallet Review: Is It The Safest Hardware Wallet Yet?

Secalot is an all-in-one, security-focused crypto hardware wallet developed and launched into the Crypto market in 2017. It takes the form of a USB dongle that packs a wide range of operational, security, and privacy features. Unlike most USB-like hardware wallets characterized by an OLED on-device screen, Secalot uses a remote screen. It nevertheless has two buttons for authentication of crypto transactions.

Most of Secalot hardware wallet features are spread between the USB dongle and its software/mobile app companions. We will detail them all in this Secalot hardware wallet review, outline the step-by-step guide on how to activate the crypto vault, vet its ease of use, and list its pros and cons.

Secalot wallet key features

Remote screen: Given that the Sacelot hardware device doesn’t have an on-screen device, it relies heavily on a remote screen hosted on the Sacelot mobile app. This lets you view and manage your digital assets, though the private keys never leave the hardware device.

OpenPGP smart card: Secalot’s unique design equips you with the capability to perform cryptographic actions using the OpenPGP smart card. These include file encryption and signing, logging into computers under Linux, signing and encrypting email,  as well as encrypting hard disks using TrueCrypt.

On-device buttons: The USB, like Secalot hardware wallet dongle, features two on-device buttons that are used to not only navigate the wallet but also authorize outbound crypto transfers.

Compatible with MyEtherWallet: Though the Secalot wallet is a multi-currency wallet, it is biased towards the Ethereum blockchain network, as evidenced by the fact that it is compatible with MyEtherWallet.

Portfolio tracker: The Secalot wallet app also features balance and transaction history tabs that let you monitor your digital assets portfolio in real-time.

Secalot wallet security features

PIN-protected: Secalot hardware wallet is secured and encrypted with a PIN code.

Recovery seed: When activating the wallet and creating a user account, you will be presented with a 24-word recovery seed to restore lost wallets and recover private keys.

U2F + OTP: The hardware wallet hosts the Universal Second Factor (U2F) feature that can be used to generate the one-time-passcode (OTP) for signing into sensitive websites like Google, GitHub, Facebook, NextCloud, and numerous other websites. This features compliments (and can be used alongside) Google’s Authenticator app.

Hierarchically deterministic: Secalot is a hierarchically deterministic hardware wallet that auto-generates a new wallet address for each transaction. This privacy feature helps throw crypto trackers off.

Open source: The Secalot hardware wallet, software, and app are all open-sourced. You can download to view, audit, or suggest improvement on this source code from the official Secalot wallet website or their GitHub page.

Non-Custodial + Cold storage: Secalot is a non-custodial wallet that stores your private keys and other personal data in the cold offline storage – the USB like dongle device. You have absolute control over these private keys.

Encrypted communication: All Secalot hardware wallet communications with third-party systems and Secalot wallet app/software are highly encrypted. They communicate via the ultra-safe SSL/TLS channel that eliminates the possibility of a man-in-the-middle hack.

How to set and activate the Secalot wallet (Bitcoin or Ethereum wallet)

How to activate a Secalot Bitcoin wallet

Step 1: Start by downloading the modified version of the Electrum wallet on Secalot’s official website.

Step 2: Install and launch the Electrum Wallet.

Step 3: On the initializing page, click on “Create New Wallet” and create a unique user name for your crypto wallet.

Step 4: Chose the type of wallet you want to create (between a standard wallet and a Multi-signature wallet)

Step 5: Connect the Secalot hardware device and copy the 24-word recovery seed generated.

Step 6: Create a PIN Code for your hardware wallet device

Step 7: The wallet is now active and ready to use

How to activate a Secalot Ethereum wallet

Step 1: After purchasing the Secalot hardware device, open their official website and download the modified MyEtherWallet

Step 2: Follow the installation prompts as dictated by the “Secalot Control Panel GUI.”

Step 3: Connect the hardware wallet device.

Step 4: Copy the 24-word recovery seed generated.

Step 5: Create a PIN code for the hardware wallet

Step 6: The Secalot Ethereum wallet is now active and ready to use

How to add/receive crypto into your Secalot wallet

Step 1: Log in to the modified Secalot account you want to use, Electrum for Bitcoin or MyEtherWallet for Ethereum and ERC-20 tokens

Step 2:  On the user dashboard, click on the receive button

Step 3:  Copy the wallet address or the QR code displayed by the deposit window and forward it to the party sending you coins.

Step 4: Wait for the coin to reflect on your account.

How to send crypto from your Secalot wallet

Step 1: Log in to the modified Secalot account you want to use, Electrum for Bitcoin or MyEtherWallet for Ethereum and ERC-20 tokens

Step 2: Click the “Send” icon on the user dashboard.

Step 3: Enter the wallet address for the recipient and the number of coins you want to send

Step 4: Confirm the transaction and hit send.

Step 5: Connect the Secalot hardware dongle into the computer and log in by keying in the PIN code.

Step 6: Authorize the transaction

Secalot wallet ease of use

Though Secalot hardware wallet stacks a ton of features and advanced security protocols, it isn’t user-friendly, especially to crypto beginners. We consider its onboarding process quite complicated, especially since it requires you to download, setup, and maintain two different online wallets to store two cryptocurrencies and a handful of Eth-tokens.

Further, the multilingual hardware wallet fails to integrate such basic features as a crypto exchange or swap platform.

Secalot wallet supported currencies.

Secalot hardware will only support Bitcoins, Ethereum, and ERC-20 token. Note that the two popular cryptos are also hosted on different Secalot wallets.

Secalot wallet cost and fees

You can order a Secalot hardware wallet from its official website. It currently retails at €50.

When sending Bitcoins or Ethereum and the ERC-20 tokens to another wallet or exchange, you will have to part with a variable transaction fee collected by blockchain miners and administrators.

Secalot wallet customer support

There are two primary ways of accessing the Secalot hardware wallet’s customer support team. You can choose to send them an email or direct message them on Facebook and Twitter.

What are the pros and cons of using the Secalot wallet?

Pros:

  • Secalot is highly secure as it embraces advanced security features.
  • Advanced features.
  • It is competitively priced.
  • The hardware wallet is highly transparent in that its source code is fully open-sourced.
  • Secalot is highly versatile and available as a hardware dongle and software wallet app.

Cons:

  • Secalot hardware wallet relies on third-party wallets like electrum and MyrEtherWallet.
  • It supports a limited number of coins.
  • The hardware wallet packaging doesn’t include a user manual/installation guide.

Comparing Secalot wallet with other hardware wallets

Secalot wallet vs. Trezor hardware wallet

Secalot and Trezor hardware wallets share more than a commitment to the safety and privacy, and integrity of their client funds. They both are also characterized by ultra-light hardware dongles and highly intuitive user interfaces. Moreover, they have embraced several high advanced operational and security protocols like the recovery seed, two-factor authentication, and maintaining offline cold storage for client private keys.

But while the Trezor Wallet has a relatively easy and straightforward setup process, Secalot Wallet’s activation process is rather complex. Furthermore, Trexor Wallet supports a broader range of cryptocurrencies and tokens (1000+), while Secalot will only support two digital currencies.

Verdict: Is Secalot Wallet safe?

Yes, Secalot is a considerably safe hardware wallet. Not just because your private keys and all other data stored never leaves their offline storage but also because of the numerous and highly advanced security and privacy measures the wallet developers have put in place. For instance, they ensured that the wallet is hierarchically deterministic and provided the option of setting up a multi-signature wallet. It serves as a U2F authenticator, and both its firmware and software are fully open-sourced.

Categories
Crypto Videos

New Wave Of Crypto Banks Will Destroy Fiat Banks in 3 years!

“Crypto Banks Will Eat Fiat Banks in 3 years — or even less” – Opinions of a CEO


Mark Binns, the CEO of BIGG Digital Assets Inc., believes that the future of crypto will be a bit different than what most people think. He believes that the crypto sector will become a safe, compliant, and regulated environment. He voiced his opinions in an article published by Cointelegraph, where he spoke of the future of crypto he imagines.
Binns said that a future where customers are going to be able to walk into any bank and gain access to credit products, investments, and savings accounts that can host both crypto-assets and fiat assets.

Kraken, a San Francisco-based cryptocurrency exchange giant, has become the first-ever cryptocurrency business in the US to become a bank. At the moment, being an officially chartered bank would mean that Kraken will be able to offer even more banking and funding options to existing customers than it is offering now. It also means Kraken Financial will be able to operate in multiple jurisdictions without any fear of having to deal with state-by-state compliance.

Kraken is currently working with Silvergate Bank in hopes of offering its US customers SWIFT and FedWire funding options. More and more partnerships such as this one will become the status quo in the future. Binns is calling out traditional banks, saying that now is the time for the ones lagging behind to start paying attention to the market development.


Silvergate Bank is one step ahead of the rest at the moment, as it is currently having almost 900 digital asset companies as clients. Those clients have made deposits of over $1.5 billion with the bank. While this is still a small amount of money in relative terms, clients dipping their toes in the crypto sector will almost certainly choose this bank. Consumers will most likely define a “full service” bank as one that offers financial services in fiat as well as crypto.

Blockchain forensics tools


Just like crime scene investigators can use a black light or fingerprint powder to detect all kinds of evidence, blockchain forensics investigators can do similarly to Bitcoin and other blockchains. People claiming that Bitcoin is completely private has been dispelled again and again. In fact, blockchain-based cryptocurrencies are much more open to investigative methods than regular fiat currencies. Binns said that, as it is certainly possible to uncover blockchain transactions’ origins, blockchain will become a part of the traditional banking system rather than “putting banks out of business.”

Blockchain forensics tools already exist. They allow investigators to follow digital paper trails across multiple addresses, wallets, transactions, blockchains, and other digital entities, all by using clustering and heuristics techniques. Companies in the blockchain forensics space are developing proprietary searching algorithms designed specifically to detect concealed funds’ origins. On the other hand, traditional fiat is still the currency of choice for most money laundering professionals, simply because it is very hard to track.

DeFi is not for everyone


The decentralized finance sector has been the hot topic of the crypto sector for a while now, as it holds virtually endless promise. While yield farming may be all the rage, the DeFi sector is so much more than just that.
Some examples of DeFi usage are:
 Allowing you to take technical and fundamental trading advice from experienced traders and only pay a fee if the call is correct.
 You can put your capital into various digital investment portfolios without having to pay fees to mutual funds.
 Investors can hold derivatives of their desired cryptocurrencies without having to switch between blockchains.
These innovations are just some of the opportunities that DeFi provides. As the market continues to mature, more DeFi projects will allow us to do things that we aren’t even thinking about right now.

However, there is one fundamental problem with all the benefits decentralized finance provides: the average banking customer isn’t going to engage with DeFi protocols for decades. While the most avid crypto enthusiast knows how to dig up the contract address of an ERC-20 token, then trade it on decentralized exchanges, and then invest that token through lending platforms or liquidity pools, the average person will still likely want to talk to a banker from time to time. On top of that, governments around the world are already working on their own government-backed digital currencies, which the average consumer will go for instead of DeFi, at least at first, and simply due to the trust people have in the government.

What if banks don’t comply?

Binns said that any bank that is still approaching cryptocurrency with fear over the next 18 months is at great risk of finding itself dead in the water, while Kraken and other banks that enter the market will create a huge advantage for themselves.

Categories
Forex Videos

UK FTSE looking to retest May’s low?

UK FTSE looking to retest May low?


Thank you for joining this forex academy educational video. In this session, we will be looking at the FTSE 100 index.

In this yearly chart, we can see the red highlighted low of 5,750, which was the low point from March having crashed down from January’s peak of just under 7,600 as a result of the Covid related pandemic causing the UK to go into lockdown. And while the higher peak shows a sharp rebound to 6,500 at the beginning of June, the value of the top 100 UK firms has been falling steadily since then to the current 6,000 at the time of writing.

Buy sharp comparison this is the Dow Jones industrial index yearly chart, showing a record high for the index in February of 29500 falling to a low of just above 18000 before a V-shaped recovery took it back to over 29,000, where practically 100% of the original crash was reversed. The NASDAQ fared even better, as did the S&P 500, both of which moved to all-time highs.
While it is impossible to suggest that the two economies are identical, the USA has enjoyed a bull run while the FTSE 100 has faded. And while the US economy is very slowly showing signs of a recovery, the numbers by no means suggest the economy of the USA is in a better shape than before the pandemic. So, what is the driving factor for one and effectively put the breaks on the other?

This can largely be put down to sentiment: the American economy is perceived to have the ability to achieve the same growth as before the pandemic, once the virus is defeated. Therefore, traders and investors have taken a long-term view that the US economy will recover and go on to see growth, and they are taking the risk that the stock market will reflect this at some point in the future. In other words, they see the economy catching up with the stock market rather than the traditional view that the stock market reflects the value of the economy.

However, investors in the British economy are slightly more subdued because of the worries that the British government and the European Union are at loggerheads heads with regards to any future trading relationship now that the UK has left the EU. This is because the European Union wants more regulatory alignment with Britain regarding its future trading arrangements and whereby financial services regulations need to be reflective of both economies and where, for example, safety standards and hygiene standards, remain level pegged, because the European Union has a duty to ensure that the citizens of the EU do not receive substandard services, or substandard food and food substances, or substandard electronics and motor cars and equipment, etc.

The EU has also placed pressure on the British government regarding fishing rights for the EU in British waters and where there seems to be no possibility of an agreement on this subject. And also another major stumbling block is the fact that Ireland is a part of the EU you and Northern Ireland is a part of the United Kingdom, and there is no border in place, in which case unchecked goods and services could move between the two areas, leaving the door open for infringements, including tax revenue losses and the movement of people without passports and livestock movements without regulatory checks by the EU. The whole thing is extremely complicated. But the bottom line is if these issues cannot be agreed upon in the next few weeks, there is a distinct possibility that no official trade agreements will be set in place, where the United Kingdom was hoping to have a free trade deal with the EU and in which case the UK will need to revert to world trade organization trading rules, which will be more expensive for the United Kingdom economy in the long run.
So where now?

The FTSE 100 is currently in a critical area, which is of psychological importance: 6,000. Should price action fall just under and then push up and find that the 6,000 area becomes a line of resistance, we could see price action fall down to the previous low of early September of 5,800 and, then, perhaps a retest of May’s low at just above the 5,700 level.

The longer that the EU and UK remain at loggerheads and cannot agree on a future trading relationship, the more chance we will see that this index will push lower and if the UK ends the transition period without a formal agreement at the end of December this year, the pressure will be on the FTSE 100 to fall even lower because we are still in the grips of the pandemic, coupled with WTO trading rules and no formal trading agreements in place with the EU or the USA, which will leave investors wondering how badly this will affect the British economy in the next 12-months.

Categories
Cryptocurrencies

Everything You Need to Know About RCHAIN (REV)

We always hear how blockchain is poised to change the world. But in reality, the technology hasn’t really penetrated the real world in any significant way. The reason for this is flaws within the original blockchain setup, such as low scalability.

RCHAIN is a project that wants to bring blockchain to real-life utilization. The RCHAIN team has big dreams, such as solving the unprecedented problems of our time. But how does it intend to do this? We’ll examine that in this article. 

Understanding RCHAIN

Launched in 2016, RCHAIN is a blockchain-based effort that wants to solve the problems of lack of scalability, low speeds, and safety in the current blockchain. The RCHAIN team believes that these and other shortcomings hinder the mainstream success of blockchain and that the blockchain concept needs to be rethought.

For that end, the RCHAIN team has imagined a better design for blockchain: 

#1. Speed 

RCHAIN can support the processing of up to tens of thousands of transactions per second (TPS). The initial goal was 40,000 transactions, and the ultimate goal is 100,000 TPS. 

#2. Developer Tools

The RCHAN team will avail developer tools unparalleled by any current offerings in the space. Developers of all backgrounds and coding languages will easily acclimatize to the platform.

#3. RCHAIN Cooperative

RCHAIN Cooperative is a public entity comprising RCHAIN developers, investors, and users. Through the outfit, members can access and interact with the open-source blockchain. The RCHAIN Cooperative offers a climate of community, giving members the ability to contribute to the platform’s future.

#4. Trust

RCHAIN will empower developers from everywhere to create more secure, scalable, fast, and fraud-proof decentralized solutions.

RCHAIN: Goals

Aided by these functionalities, the RCHAIN team wants to achieve the following goals: 

  • Provide solutions for the most challenging global solutions and crises
  • Achieve unprecedented scalability and speed to solve the biggest issues of our time
  • Unlock blockchain solutions to empower people to work in a holistic fashion
  • Connect with thriving communities to unlock solutions for complex global challenges

How RCHAIN Works 

The RCHAIN network was built with scalability in mind. It can support multiple blockchains at once, secured through a Proof of Stake consensus mechanism. RCHAIN provides support for both public and private blockchains. With that, let’s see some of the core features of the platform: 

#1. Rho Virtual Machine Environment

RCHAIN features the Rho Virtual Machine Execution Environment, which lends speed and scalability to the platform’s applications. The Execution Environment can run several Rho Virtual Machines simultaneously. The Rho Virtual Machines are also capable of creating replicas of themselves to handle extra loads. 

RCHAIN has a multi-chain architecture that enables its blockchain to operate in a coordinated and parallel manner. Each virtual machine can also execute an independent set of smart contracts on a yet independent set of blockchain networks. 

#2. Smart Contracts

The RCHAIN platform uses its proprietary smart contract language – Rholang, which is short for reflective higher-order language. Rholang supports internal concurrent programming and allows contracts to be fast and versatile. 

RCHAIN’s smart contracts have to go through a verification process to make them highly scalable before being compiled and executed by the Rho Virtual Machine.

#3. Namespaces

RCHAIN is different from other blockchains that use public keys to distinguish virtual identities. RCHAIN achieves this by dividing its virtual address space into namespaces. In very general terms, a namespace is a set of named channels that can report a particular network resource location.

Namespaces enable smart contracts on one blockchain to be visible by system contracts on other network parts. Namespaces also allow developers to come up with various security tools and protocols for the network.

The RCHAIN Cooperative

The RCHAIN Cooperative is a development and governance platform for the community. Members of the entity are fully responsible for the open-source platform, and they can offer and implement suggestions and updates for the platform. 

Anyone can join the Cooperative after paying a one-time membership fee of $20. This fair amount was chosen so that people of all financial backgrounds can join it and that in the spirit of decentralization, there’s not a barrier for joining. 

Joining the Cooperative gives you the following benefits: 

  • Ability to join and interact with other community members on RCHAIN’s Discord channels
  • Ability to participate in governance
  • Ability to vote on project proposals and budget allocations in a fair process of one vote per member, regardless of how many REV tokens they possess

The Cooperative has a Board of Directors, where different board seats have different term lengths of one, two, and three years. 

RChain Use Cases 

RCHAIN can support countless applications of many types, including but not limited to, the following: 

  • Wallets
  • Exchanges
  • Oracles and external adapters
  • Custom protocols
  • Smart contracts
  • Smart properties
  • Decentralized Autonomous Organisations (DAOs)
  • Social forums
  • Marketplaces 

The RCHAIN Team

The RCHAIN team is composed of a team of diverse backgrounds. The core team members are:

Founder Greg Meredith, who is also co-founder, board member, and president of the Cooperative. Meredith has thirty-plus years of experience with thought-leading tech projects. He was also the leading architect behind key projects for Microsoft and AT&T. 

Eykhholt is a co-founder and board member of the Cooperative, having under his belt more than thirty years of experience in the tech industry. He has been the principal architect of multiple tech projects in various companies, including Microsoft and Alston Grid. Eykhholt is also the founder of LivelyGig.

Board member and CEO of the Cooperative Kenny Rowe has years of experience in blockchain governance community building. Rowe is also the head of operations at MakerDAO and is a senior consultant of Coin Fund. 

Secretary and General Council Evan Jensen has experience in crypto-related law. Jensen holds a J.D. and Master’s in law from Seattle University. 

CFO Lisa Rice has twenty-plus years of experience in finance, from planning to accounting to corporate treasury.

RHOC, REV, and RCHAIN’s Private Token Sale 

RCHAIN held a private token sale on August 29, 2017, hitting a high of $15 million in under two weeks. 

RHOC tokens were selling at $0.2. While the sale did not have a maximum purchase cap, it had a cap on the highest amount – $50,000. 

RHOC tokens were ERC20 tokens before the mainnet launch. After RCHAIN moved to its own mainnet, RCHAIN token holders had to convert them into REV at a rate of 1:1. 

REV tokens play several roles in the ecosystem, including:

  • Staking
  • As payment for transaction fees
  • Facilitate the deployment of smart contracts
  • As a governance mechanism for the DAO

Tokenomics of REV

As of October 15, 2020, the Rchain token traded at $0.020066, with a 24-hour high and low of $0.021509 and $0. 019151, with a 24-hour volume of $256,578, a market cap of $9,689,508, and a market rank of #496. REV has a circulating and total supply of 482,890,386 and 870,663,574, respectively. 

REV tokens can be bought at MXC, Uniswap, CryptalDash, HotBit, and many more exchanges. 

Closing Thoughts

RCHAIN wants to not only improve blockchain but also bring it to solve real-life issues. The project’s team seems to know their stuff, and they seem to have quite forward-looking features and ideas. If the project keeps innovating and succeeds, it will be good for the blockchain space and society. 

Categories
Cryptocurrencies

Introducing Flamingo (FLM): A Beginner’s Guide

As DeFi becomes more and more of an indispensable idea, blockchain platforms are rushing to capitalize on the wave. DeFi provides endless opportunities for users: lucrative gains on staking, instant borrowing, fraud-proof transactions, and more. 

Blockchain platforms are now incorporating DeFi to not just accord users more value but also to remain relevant. Neo, the blockchain platform founded in China, is one of the latest to integrate DeFi in its offerings. 

Neo’s DeFi platform is known as Flamingo, and it stepped into the space just September this year. This article will bring into focus everything you need to know about the platform. 

Understanding Flamingo

Flamingo (flamingo.finance) is a decentralized finance protocol built atop the Neo blockchain. The platform integrates various modules to offer a comprehensive DeFi architecture, where users can take part as traders, stakers, borrowers, and liquidity providers. Flamingo is a pillar of the Neo DeFi’s ecosystem, and it comes with innovative solutions for the space such as the following:

#1. Friction and lack of cross-chain interoperability: Flamingo will be powered by the Poly Network to support cross-chain asset transfer, ensuring single market limitations are a thing of the past

#.2 Limited efficiency due to fragmented capital sources and overcollaterization: Flamingo will integrate the automated market maker (AMM) protocol and collateral asset pool, which will ensure capital is utilized to the maximum

#3. Short community participation periods: Flamingo will incentivize users with FLM tokens to reward them for their participation in the community

Project Features

The Flamingo platform will be guided by these three key elements: 

#1. Interoperability

Flamingo will heavily feature interoperability, a factor that lacks in most DeFi platforms. Through the Neo-owned interoperability protocol Poly Network, Flamingo will be collected with various blockchain networks such as Ethereum, Ontology, and Cosmos-SDK. Flamingo users can capitalize on this interoperability to access more assets within a broader DeFi ecosystem. 

#2. Capital Efficiency

Flamingo is designed to integrate its Swap feature’s liquidity pool with Vault’s collateral pool. In the existing AMM decentralized exchanges, capital efficiency is usually held back by Liquidity Provider (LP) tokens, which causes some AMMs to be provisioned way below the baseline. 

Flamingo will maximize capital efficiency by letting liquidity providers stake LP tokens in Vault while simultaneously minting Flamingo USD (FUSD).

#3. Fair Launch

Flamingo will distribute FLM tokens as transparently as possible, with no pre-mine launch or some reserved for the team. The community will decide the long-term distribution formula via voting.

Flamingo: Components

Flamingo is defined by several core features, which are: 

#1. Wrapper

This is a multi-chain asset gateway for blockchains such as Bitcoin, Ethereum, Neo, Ontology, and Cosmos-SDK. You can wrap tokens like BTC, ETH, NEO, USDT, and ONT , upon which they’ll become NEP-5 tokens (nETH, nNEO, nUSDT, nONT, and so on.) You can also unwrap tokens back to their original form. 

#2. Swap

Swap is Flamingo’s automated market maker and makes wrapped assets, FLM, and NEP-5 tokens. The swap works much like Uniswap by adopting the Constant Product Market Maker (CPMM) model. On Swap, users can exchange tokens or provide liquidity to a quality pool of their choice by simply depositing tokens. 

#3.Vault

This an asset manager by the Flamingo team. On Vault, users can stake in NEP-5 assets and get FLM token rewards. 

#5. FUSD

This is a synthetic stablecoin mintable by users. FUSD is pegged to the price of the US dollar. Users will be offered FLM that’s in proportion to the amount of FUSD minted. 

#6. Perp

This is an AMM-based contract exchange. Just like on Swap, traders can exchange perpetual contracts using the CPMM model, this time with a ten times average. Stakers need to deposit FUSD, upon which they’ll receive FLM as rewards. 

#7. DAO

DAO is a protocol for governance on the Flamingo platform. The Flamingo team intends for decision-making to be taken over by the community. Cabinet members can contribute to the platform using Flamingo Improvement Proposals and Flamingo Configuration Change Proposals. On the DAO, FLM token holders can vote on critical decisions such as increasing/decreasing tokens, software upgrades, parameter configurations, etc. Voters who contribute to governance are awarded FLM tokens. 

What’s Flamincome?

Flamincome is Flamingo’s dedicated platform for the new trend in DeFi, known as liquidity mining. Flamincome provides pretty much the same services as in Yearn.Finance (YFI). The tool features both an optimizer and normalizer. An optimizer increases yield by converting original assets (USD, USDC, DAI, ETH, wBTC, wETH, etc) to interest-focused assets (fUSDT, fUSDC, fDAI, fwETH, fwBTC, etc). 

A normalizer changes back interest-bearing assets into original assets. Interest-bearing assets such as fUSDT, fUSDC, fDAI, fwETH, fwBTC, etc are changed into synthetic assets (nUSDT, nUSDC, nDAI, nwETH, nwBTC, etc). This conversion takes place on a 1:1 peg ratio to the underlying asset. The synthetic assets can be used in other DeFi platforms for more yield farming. 

Is Flamingo Audited?

Yes, the Flamingo platform is audited. Several independent auditing outfits have audited various stacks of the platform: 

  1. Normalizer contracts on Flamincome: PeckShield and Red4Sec
  2. Flamingo contracts: PeckShield
  3. Poly Network: Certik 
  4. Poly Network Neo contracts: PeckShield
What are the Risks of Interacting with the Flamingo Platform? 

While Flamingo is thoroughly audited, mistakes/bugs are bound to occur. While there’s no inherent risk in Vault’s staking process, using the Swap module can set you up for impermanent loss (IL). 

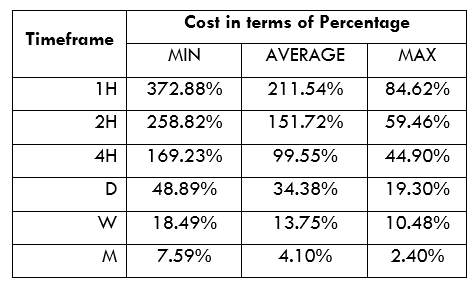
However, as Neo founder Da Hongfei noted, this risk is often overestimated: “Only by providing liquidity to Swap may you bear IL. After all, IL is not as terrible as many people think. To provide liquidity to a trading pair A/B, after a period of time if the price of A has fallen by 50% relative to B. How much do you estimate the impermanent loss to be? The answer is 5.72%. This means you would only lose 5.72% by providing liquidity compared to holding A/B in your wallet. That’s not as bad as most people’s intuition.”

How is the Flamingo Platform Secured? 

The Flamingo network is NEP-5-compliant. NEP-5 is Neo’s token compatibility standard, which means Flamingo is secured by the underlying Neo blockchain. Neo itself is secured by SHA-256 (the hash algorithm that secures Bitcoin) and RIPEMD-160 hash function. 

Community Growth Strategies of Flamingo

The Flamingo team intends to implement several strategies to expand the growth of the community. These strategies include the following: 

  • Conducting physical marketing events and meetups
  • Engaging with users via social media platforms
  • Conducting online Ask Me Anything (AMA) to engage with current and potential users 

Future Strategies include: 

  • Conducting daily weekly progress updates
  • Kicking off the Developer Grant program 
  • Initiating voting functionalities for the Flamingo decentralized autonomous organization (DAO)

Future of Flamingo

Flamingo wants to be the stepping stone for the acceleration of DeFi in the Neo ecosystem. The Neo team doesn’t plan to stop at Flamingo but intends to launch other products like lending, insurance, and asset management products. 

For now, the team is exploring ways to introduce more asset types, decide which oracle implementation to integrate, and examine how the governance mechanism will function in the future. The Flamingo team encourages input from the community. Users can submit proposals on how to optimize the platform and build a more robust protocol.

The FLM Token

The FLM token is the native token of Flamingo. Holders of the platform can participate in decision-making for things like new tokens issuance, platform parameters, etc.

Other uses include: 

  • Staking multi-chain assets 
  • Staking LP tokens, minting FUSD
  • Depositing FUSD to trade in perpetual contracts

The Flamingo token was distributed in the following fashion: 

  • Binance Launchpool tokens: 4.17%
  • Mint Rush tokens: 29.17%
  • LP Token Staking: 53.33%
  • FUSD Minting: 10%
  • Perp Margin Rewards: 3.33%

Flamingo: Key Metrics

The FLM token price was $0.254369 while ranking at #3587 on October 16, 2020. The token’s 24-hour volume was $7,296,347, with a total supply of 150 million. FLM had an all-time high of $0.307385 (Oct 9, 2020) while it’s all-time low was $0.249290 (Oct 11, 2020). 

Buying and Storing FLM

The FLM token is listed as a market pair of USDT, BTC, BNB, USDT, BUSD, NEO, and PERP in exchanges such as Binance, OKEx, MXC, HotBit, Binance, BitZ, LBank, Hubi, Switcheo Network, VCC Exchange, and FTX. 

FLM tokens can be stored in NeoLine (Chrome Extension), O3 desktop wallet (supports Ledger), MetaMask Chrome Extension, Cyano Chrome Extension, and ONTO mobile wallet. 

Categories
Forex System Design

Starting the Testing Process of a Trading Strategy

Introduction

The development of a trading strategy requires steps to evaluate its reliability during its execution in real markets. To achieve this, the developer must develop a testing process to determine its robustness and viability as a previous step before its optimization.
In this educational article, we’ll introduce the steps of a trading strategy’s testing process.

Getting Started with Testing the Trading Strategy

Once the developer completed the programming of a  candidate trading strategy, it’s time to confirm if the strategy works as the conceptual model assumes. In this regard, the strategist should follow the following steps:

  1. Verify the preliminary profitability of the trading strategy.
  2. Assessing the robustness delivered by the strategy.

The robustness concept relates to the ability to continue generating substantial profits despite adverse market conditions, such as trend changes or extremely volatile conditions. An alternative method for verifying the strategy’s robustness is by assessing if it continues being profitable under a wide basket of markets.

Another critical part of the testing process is to verify the trading rules. As the strategy’s complexity increases, rules also increase in complexity. In this context, the developer must validate that the execution of the buy and sell signals happens at the levels triggered by the strategy’s rules. The verification of entry and exit signals will allow the developer to identify any programming error.

Analyzing Profitability

Once the programming stage is verified, the developer should estimate the trading strategy’s profitability considering a reasonably lengthy historical price series. 

As a guide, a short-term strategy may be tested using two years of price data, a mid-term would need up to four years, and a long-term up to eight years of historical data. Nevertheless, the window size may vary depending on the strategy type or the market conditions.

With this information, the strategist will have a panoramic overview of the trading strategy’s profitability and risk. In this regard, if the strategy’s performance is deemed acceptable, the developer could advance to the next stage of the testing process.

Nevertheless, if the strategy has a poor performance, the developer should judge if it could be redesigned or discard it.  

Finally, for a proper evaluation, the strategy must be run using a standard one unit trading size. This way, the profits would result in multiples of the risk.

The Multimarket and Multiperiod Test

The multimarket and multiperiod test corresponds to the last stage of the testing strategy’s performance. During this historical simulation, the developer must study a set of parameters of the strategy considering a small basket of diversified markets over a broad range of historical periods. In other words, the developer must develop a historical simulation taking a group of different assets using different timeframes.

The developer must select a small portfolio of non-correlated assets; in other words, markets that don’t relate to each other. An example of a non-correlated portfolio is a mix of a commodity, a bond, and a stock index.

Concerning the length of the test period, Robert Pardo suggests that to obtain solid results, the developer should use ten years of historical data for each market. However, it could start from five years of historical prices. Pardo’s figures are related to long-term stock trades using daily timeframes. Intra-day trading systems, as already stated, would require smaller data ranges.

The results obtained from the historical simulation will provide an objective overview of the trading strategy’s profit and risk.  Depending on the results obtained, the developer may terminate if the strategy is robust and produces reasonable returns or if it performs poorly and should be rejected. Likewise, the strategist may observe that the strategy presents mixed results, so it should not be rejected entirely.

Conclusions

During the testing process of a trading strategy, the developer must evaluate a broad range of aspects that ensure the correct work during its evaluation.

For example, the developer must verify if the opening and closing trades’ programming rules execute as the strategy requires. After this step, the robustness degree will drive the strategist to conclude if it is viable in real markets, needs improvements, or should be rejected.

Finally, on a multimarket and multiperiod test, the developer must evaluate the strategy’s performance in a small non-correlated portfolio using different timeframes. Once this historical simulation is made, the strategist would be able to confirm if the strategy is robust and viable or reject it before continuing with the optimization stage.

Suggested Readings

  • Jaekle, U., Tomasini, E.; Trading Systems: A New Approach to System Development and Portfolio Optimisation; Harriman House Ltd.; 1st Edition (2009).
  • Pardo, R.; The Evaluation and Optimization of Trading Strategies; John Wiley & Sons; 2nd Edition (2008).
Categories
Forex Market Analysis

Dow Jones Turns Bearish As the US Presidential Election Approaches

Overview

The Dow Jones Industrial Average holds its bearish bias expecting the US presidential election scheduled next November 03rd. Throughout this year, the Industrial Average has declined over 6% (YTD). Although the latest decline looks like a short-term top, the US leading benchmark could resume its advances.

Market Sentiment Overview

The Dow Jones Industrial Average (DJIA) accelerated its declines on Wednesday’s trading session, backed by the market participants’ expectations before the US presidential election scheduled next November 03rd.

The following daily chart exposes the short-term market movements of the Industrial Average. The figure shows the penetration below the psychological level of 27,035.1 pts, which indicates the Dow Jones penetrating the bearish sentiment zone.

Simultaneously, the price action reveals its consolidation below the 60-day weighted moving average, which confirms the bearish bias. On the other hand, the re-test of the previous low located at 26,541 pts increases the likelihood of further declines.

The next daily chart unveils the 90-day high-low range of the Dow Jones Volatility Index (VXD). The figure shows the advance of VXD in the bullish sentiment zone, which confirms the bearish sentiment observed in the Industrial Average, as an increasing (bullish) volatility is mostly associated with declining prices.

Therefore, considering both the Industrial Average as the Dow Jones Volatility Index, the short-term market sentiment bias for the DJ-30 remains on the bearish side. The likelihood of extended declines would drive the DJIA toward the extreme bearish sentiment zone.

Technical Analysis Outlook

The big picture of the Industrial Average reveals that the retracement experienced during the last two weeks belongs to the bullish sequence that began on March 23rd when the Dow started its recovery, following the massive mid-February sell-off.

The DJIA’s technical outlook under the Elliott Wave Theory is unveiled in the following log-scale daily chart. We can see that the primary bullish trend that began with March 23rd’s low located at 18,213.5 pts, which is currently in progress.

In the figure, we see DJIA’s price consolidating in a sideways formation. This stage began once the Industrial Average topped at 29,193.6 pts on September 03rd.

On the other hand, we should consider that the sideways formation moves above the 25,570.2 level, or 33% of the bullish sequence of the primary trend. Therefore, the upward trend remains intact right now, and the current correction represents a pause and not a deeper correction for the US benchmark.

The below 4-hour chart shows the Industrial Average under the Elliott Wave perspective, developing an incomplete flat pattern (3-3-5) of Minute degree labeled in black that looks incomplete.

Currently, Dow Jones completed its wave (iii) of Minuette degree labeled in blue, which belongs to wave ((c)) of Minute degree. This structural series that remains in progress moves inside the wave B or 4 of Minor degree labeled in green.

Considering that the flat pattern looks incomplete, the Industrial Average should see a new lower low, which would reveal a bullish divergence on the MACD oscillator confirming the progress on the fifth wave of Minuette degree. After this move, the Dow Jones should develop a wave C or 5 of Minor degree with an internal five-wave sequence.

Therefore, short-term, we may expect a limited decline, likely toward the 26,050 pts, from where Dow Jones could start to develop a new rally in five waves.

Categories
Forex Course

162. Currency Crosses Are Trendier Than You Think

Introduction

Currency crosses are a combination of major and commodity currencies without the US Dollar. Therefore, it is an exciting source of earning money when the US dollar moves within a correction. However, the global economic activity has been increasing day by day, and many business activities are happening without the intervention of the US dollar that might make the cross-currency trading trendy.

Is Cross Currency Trading Profitable?

In every international transaction, the US dollar plays a vital role as it is the reserve currency of every country. Moreover, the valuation of commodities and agricultural products are made through the US dollar. Therefore, most of the trading volume in the forex market comes through the US dollar only. As a result, many traders think it is often hard to profit in trading currency pairs where there is no US dollar.

However, the real scenario is not the same. Currency crosses are an extensive way of earning money from the forex market. If the US dollar remains corrective, most US dollar-related pairs will make less movement, which would be difficult to anticipate the price for traders.

On the other hand, if the Eurozone and Australia’s economic activity moves well, the EURAUD pair will provide a decent movement without the intervention of the US dollar. Nowadays, as the businesses are expanding, cross-currency trading became profitable day by day.

Cross Currencies are Trendy

In financial market trading, portfolio diversification is an essential way to ensure maximum safety of the investment. If one trading instrument does not perform well, there are other instruments to make a profit from. It is the best way to keep the investment active even if some trading instrument is moving within a correction. Therefore, it is best to trade in cross currency pairs when the US dollar is moving within the correction.

On the other hand, cross pairs do not require the US trading session every time. If our technical and fundamental analysis allows, we can profit from London and Asian trading session by any cross pairs like GBPJPY, EURAUD, etc.

Summary

In the above section, we have seen how trading in a cross pair can be profitable. Moreover, every currency pair has some unique characteristics that a trader should understand. A trading strategy’s profitability depends on how a trader is implementing the strategy with strong money management.

[wp_quiz id=”86502″]
Categories
Cryptocurrencies

SafePal S1 Hardware wallet Review: How Safe Is Safepal T Hardware Wallet?

SafePal S1 hardware crypto wallet was introduced to the crypto community in 2019. And though it’s relatively new, SafePal is a highly innovative wallet that seeks to provide crypto users with a “Secure, Simple, and Enjoyable crypto management solution.” The wallet has the backing of prominent crypto industry players like Binance Exchange. It has also integrated a host of operational and security features to help it achieve this goal.

According to the SafePal S1 website, the wallet was developed by a group of software, cybersecurity, and hardware experts, with the blessings of Binance. And one of its approaches to solving the constant challenges faced by other crypto hardware wallets was making it a 100% cold storage wallet.

This review will detail its features, understand how it works, vet its ease of use and fees. We will also provide you with a step-by-step guide on how to use SafePal Hardware Wallet before telling you if SafePal S1 is indeed the safest hardware wallet yet.

Key features

High-resolution screen: SafePal S1 hardware wallet has a sleek design that takes the shape of an MP3 player. It features a relatively wide and high-resolution color screen and a D-pad controller that you use to navigate the wallet. It also features a camera whose key role is scanning QR codes for other wallets and exchanges.

Mobile app compatible: SafePal hardware wallet developers have also come up with the SafePal wallet app that you can use to manage your crypto balance and facilitate crypto exchanges.

Monitor crypto portfolio: The SafePal mobile wallet app features the balance and activity tabs that you can use to monitor your crypto portfolio in real-time. For instance, the activity tab outlines your crypto transaction history (inflows and outflows) and, in turn, helps shape your crypto budget.

Integrated exchange: One of SafePal’s key partners is Binance – the largest crypto exchange in the world. And this partly explains why SafePal Wallet mobile app features BinanceDEX that SafePal users can use to trade and exchange different cryptos and exchanges.

Send crypto via social media: SafePal’s innovativeness is best highlighted by the wallet user’s ability to send crypto via the different social media networks. A SafePal wallet user can, for instance, send altcoins and tokens to an individual (regardless of whether they have a SafePal wallet or not) via social media.

Security features

Pin code: SafePal hardware wallet is secured with a PIN code that you set when creating a user account. It is also fitted with the number randomization tool that helps you avoid key loggers and other spying tools.

Password + pattern for the app: The SafePal mobile wallet app, on the other hand, is secured with a password or a pattern.

Recovery seed: SafePal will also present you with a backup and recovery seed for your wallet and private keys. When creating a user account on the platform, you will be presented with either 12 or 24 random phrases that form your wallet’s recovery seed. Write them down and save them offline.

Secure element: The SafePal hardware wallet is also fitted with a hack-proof EAL5+ secure element. This is a global finance industry-grade crypto chip that stores your private keys.

Two-factor authentication: All crypto transactions initiated via the SafePal mobile app must be signed and authenticated using the hardware device.

Key-deletion tool: SafePal S1 wallet features a key deletion tool that allows you to add and delete cryptos and tokens with ease.

Tamper-proof: The hardware wallet’s package features two tamper-proof seals, and so does its secure element. In the case of a suspected cyber hack or if someone tried to tamper with its secure element, the key deletion and self-destruct features will be triggered.

Offline cold storage: SafePal S1 hardware device is a 100% offline vault that connects to your phone or computer via a USB cable. It doesn’t maintain wireless (Wi-Fi, Bluetooth, or otherwise) connections with internet-connected devices.

How to set and activate the Safepal S1 Hardware wallet

Step 1: Download the SafePal S1 mobile app after purchasing the SafePal S1 hardware device

Step 2: Install and launch the app.

Step 3: Create a password and pattern for the mobile app

Step 4: Connect the SafePal S2 hardware device to the computer and choose your preferred language.

Step 5: Open the SafePal app and click on the ‘Add Wallet’ icon. Alternatively, tab the scan button on the top-right corner of the app.

Step 6: Follow the setup wizard prompts to create a user account.

Step 7: Chose a recovery seed (between 12-word seed and 24-word seed) and write it on the mnemonic cards that accompany the hardware wallet package.

Step 8: Verify that you’ve correctly copied this mnemonic phrase.

Step 9: Create and verify a PIN code for the mobile device

Step 10: Scan your wallet’s QR code using the mobile app to connect the two.

How to add/receive crypto into your SafePal S1 Hardware wallet

Step 1: Log in to your SafePal S1 wallet mobile app on click on the “Receive” icon

Step 2: Copy the wallet address and forward it to the party sending you crypto coins.

Alternatively:

Step 3: Have the party sending you cryptos/tokens scan your wallet’s QR code.

Step 4: Wait for the funds to reflect on the wallet.

How to send crypto from your SafePal S1 Hardware wallet

Step 1: Log in to the SafePal S1 mobile wallet app and click on the “Send” button.

Step 2: From the list of hosted cryptocurrencies and tokens, select the coin you want to send

Step 3: Enter the recipient’s wallet address or scan their QR code and the number of coins/tokens you wish to send

Step 4: Select the fee level.

Step 5: Confirm that the transaction details are correct and hit the send button. The app will then display a dynamic QR code specific to that transaction.

Step 6: Use the SafePal S1 hardware wallet to authorize the transfer. Simply use the hardware wallet’s camera to scan the app’s QR code and enter the PIN to sign and authorize the transaction.

Step 7: Confirm that the transaction has sailed through on the mobile app via the

SafePal S1 Hardware wallet ease of use

Though lengthy, SafePal S1 has a straightforward onboarding process. The wide display screen on the hardware wallet and easily navigable mobile wallet app interface has made interacting with the crypto vault, receiving, and sending cryptos relatively easy.

SafePal S1 hardware wallet is also available in over ten international languages.

SafePal S1 Hardware wallet supported currencies and countries.

According to the SafePal S1 website, the hardware wallet can support 1000+ cryptocurrencies and tokens. Wallet addresses are also generated offline by the hardware device.

SafePal S1 Hardware wallet cost and fees

SafePal S1 hardware wallet costs $59.99, but the company behind the brand is currently running a limited-time discount of $39.99.

The only other charge you will have to part with is the blockchain network’s network fees for transaction verification and confirmation.

What are the pros and cons of using the SafePal S1 Hardware Wallet?

Pros:

  • Very safe as it stores all your private keys offline in a tamper-proof secure element
  • SafePal S1 is cheaper than most other crypto hardware wallets
  • The hardware wallet supports a wide range of both cryptocurrencies and tokens
  • It features the largest and most liquid crypto exchange
  • The hardware is tamper-proof and embraces stringent security measures

Cons:

  • One may consider the wallet’s activation process quite laborious and not beginner-friendly
  • It maintains a rather complicated crypto transfer process

Comparing Safepal S1 Hardware wallet with other hardware wallets

Safepal S1 Hardware wallet vs. Ledger Nano S

SafePal S1 and Ledger Nano S are both highly advanced crypto hardware wallets. Their similarities include the fact that they both host 1000+ crypto coins and tokens. They store the client’s private keys offline and employ multi-layer protection tools around all the wallets, including two-factor authentication and offline wallet address generation. Both are also compatible with mobile apps and feature on-device screens that help ease navigation.

The two are also different in the pricing and mode of operation. For instance, while the Ledger Nano S hardware wallet costs around $60.00, SafePal S1 costs a paltry $39.99. Similarly, while the SafePal hardware device and its mobile app companion will only communicate through the hack-proof QR Codes, Ledger Nano S connects to its app companion via a wireless Bluetooth connection that is susceptible to man-in-the-middle attacks.

Verdict: Is Safepal S1 Hardware wallet safe?

SafePal S1 is a safe hardware wallet. It has embraced several highly effective security and privacy measures to safeguard the integrity of the device and private keys held therein. And it all starts with tamper-proof packaging with two proprietary seals. It has also employed multiple security features, including two-factor authentication, offline generation of wallet addresses, and a 6-digit passcode for the hardware device and password + pattern for the SafePal S1 mobile wallet app. You only have to part with the $39.99 wallet cost.

Categories
Crypto Guides

An Introductory Guide To ‘Yield Farming’ In The World of Cryptocurrencies

Introduction

Lately, the topic of Decentralized Finance or DeFi in the cryptocurrency space has been the most talked-about concept among crypto enthusiasts. While the general populous has been hunkering down on the economic uncertainty, people in the field of cryptocurrency have been excited about decentralized finance’s one of the latest, riskiest, and dynamic investment strategies – Yield Farming.

The concept is quite new, even for the crypto nerds. But it has the potential to change the dynamics of how people deal with cryptocurrencies. Some people may confuse it with liquidity farming, but Yield Farming is a different concept. Simply put, it is the process of finding the best returns (yields) that the cryptocurrency world has to offer.

One of the great things about Decentralised Finance is that they are permissionless. That is, anyone with an internet connection and a supported crypto wallet can interact with them, even a smart contract. This has given rise to Yield Farming. So, what is it? How does it work? Who can use it? We will answer all these questions and more in this post. Keep on reading.

What is Yield Farming?

Yield Farming is a process of generating rewards with crypto holdings using permissionless liquidity protocols. Simply put, Yield Farming means holding and locking cryptocurrencies and getting rewards. According to experts, Yield Farming bears a resemblance to staking. Nevertheless, it is a lot more sophisticated than you can think. In most cases, Yield Farming works with users known as liquidity providers (LP) who add capital to liquidity pools.

A liquidity pool is a smart contract containing funds; when liquidity providers provide liquidity to the pool, they get a reward. The reward received by the liquidity provider will be either generated from the fees of the underlying Decentralized Finance platform or some other sources. In some cases, liquidity pools use multiple tokens to pay their rewards. These tokens can be deposited to other liquidity pools to earn more rewards. This means that as a liquidity provider, you will contribute to the liquidity pools and earn rewards in return.

Yield Farming is done using Ethereum (ERC-20 tokens), and the reward generated is also some kind of ERC-20 token. Yield farmers move their funds quite often between different protocols, looking for higher yields. Experts believe that Decentralized Finance platforms may provide providers with other economic incentives to attract more capital.

How Does it Work?

Yield Farming is based on the Automated Marker Maker (AMM) principle that includes liquidity pools and liquidity providers. Suppose you are a liquidity provider. You deposit funds into a liquidity pool. This liquidity pool of yours is a whole marketplace where users can exchange, borrow, or lend tokens. As the user uses these tokens, they will have to pay a certain fee to the liquidity provider, that is, to you. This is how AMM works.

Conclusion

As simple as it sounds, Yield Farming is a complex phenomenon. The strategies involved are highly complex and are suitable for only advanced users. Also, experts suggest that it should be deployed by those who have a lot of capital.

Categories
Forex Fundamental Analysis

Everything You Should Know About ‘Home Loans’ Macro Economic Indicator

Introduction

The real estate market has always been an integral part of the economy – any economy. Where the real estate sector flourishes, economic development follows. It can be argued that entire economies, from the pre-renaissance period, have been built on the back of a thriving real estate. The strategic economic importance of the real estate market is that, where houses are built, other infrastructure developments follow, social amenities, and market places. In the current age, the flourishing of the real estate sector can be taken as a leading indicator of household demand; and this is why monitoring home loans is essential.

Understanding Home Loans

A home loan is also known as an owner-occupier home loan. These loans are given to people who fully own their current home outright or have a mortgage on their existing primary residence. The home loans are usually meant to either fund the purchase of a second home or conduct renovations and improvements on the current home.

Therefore, home loans can be categorized into two; home equity loan or a mortgage.

Home mortgage: In this type of home loan, a financial institution lends money to an existing homeowner to fund the purchase of another home or to make renovations on the existing one. In this case, you transfer the deed on your current house to the banks, which is used as collateral. The financial institution can fund up to 80% of the value of your home. i.e., if your home is worth $100000, you can receive up to $80000 in the loan. Note that you will only get this type of mortgage if you outright own the home. In case you have an existing mortgage, you can opt for a home equity loan.

Home equity loan: If a mortgage funded your primary residence, you could take a second mortgage if you have enough equity on the current home. Whenever you pay down the first mortgage on your home, the value of your home equity increases. Let’s say your current home is worth $300,000, and you have an outstanding mortgage worth $100,000; this means you have equity of $200,000. Here, the equity represents the value you will remain with if you were to sell the home. Therefore, when you take a home equity loan, you will receive a lump sum amount equivalent to the equity you have on your current home.

In both types of home loans, your primary residence is the collateral. The lender is entitled to foreclose on these homes if you default on the repayment.

Using Home Loans for Analysis

As a significant indicator in the real estate market, home loans data can be used as an indicator of the overall demand in the economy. Let’s take an example of an increase in home loans.

When home loans are growing, it can be taken to mean that households have increased demand in the real estate market. Home loans are primarily used to conduct renovations on existing homes or fund the purchase of second homes. Since both these activities are not essential needs for a household, an increase in home loans can only mean that households have satisfactorily taken care of their primary and intermediate needs. Therefore, the welfare of households can be said to be improving when home loans are increasing.

Furthermore, since one is required to make a predetermined repayment on home loans or risk foreclosure, it would imply that households have a steady stream of income when they take these loans. On a macroeconomic level, an increase in the home loans would imply that unemployment levels are down or that households receive higher wages. Lower levels of unemployment and increased wages tend to increase disposable income.

In such cases, an increase in aggregate demand is expected hence overall economic growth. Note that in most economies, households’ demand for goods and services account for almost 70% of the GDP. Therefore, an increase in the demand for houses implies that almost every other sector has also experienced increased demand. These sectors range from those providing essential to intermediate goods and services to households.

The home loans data can also be used to show the economic cycles recessions to recoveries. If the economy has gone through a period of recession, an increase in home loans can sign that money is flowing through the economy. Low economic activities characterize the economic cycles of recessions and depressions; therefore, an increase in home loans can be taken as a sign of increased economic activities. This increase can be an indicator that the economy is going through periods of recovery.

Source: ABC News Australia

Impact on currency

The forex market is forward-looking. This attribute means that for every economic indicator released, the forex market tends to anticipate how these indicators would influence the future interest rate.

When home loans are increasing, it could mean two things. Either household has access to cheaper financing, or the economic growth has increased the flow of money. In the forex market, a continuous increase in home loans can be seen as a potential trigger for contractionary monetary policies like increasing the interest rate. Such policies result in the appreciation of the currency relative to others.

Conversely, a continuous drop in the home loans leads to depreciation of the currency relative to others. In this case, governments and central banks could view the drop in home loans as a sign of the economy slowing down. Expansionary monetary and fiscal policies could be implemented to prevent the economy from going into recession.

Sources of Data

In Australia, the Australian Bureau of Statistics (ABS) is responsible for the publication of the home loans data. Trading Economics has a historical review of the Australian home loans and a global comparison with other countries.

How Home Loans Data Release Affects the Forex Price Charts

The latest publication of the home loans data by the ABS was on October 9, 2020, at 1.30 AM GMT. The release can be accessed at Investing.com. From the screengrab below, the AUD’s moderate volatility should be expected when the home loans data is released.

The home loans MoM change for August 2020 was 13.6%, an increase from 10.7% in July 2020.

Let’s see what impact this release had on the AUD.

AUD/JPY: Before Home Loans Data Release on October 17, 2020, 
Just Before 1.30 AM GMT

The AUD/JPY pair was trading a mild downtrend before the release of the Australian home loans data. From the above 5-minute chart, the 20-period MA is slightly falling with candles forming just below it.

AUD/JPY: After Home Loans Data Release on October 17, 2020, at 1.30 AM GMT

The pair formed a 5-minute inverted bearish ‘hammer’ candles immediately after releasing the home loans data. Subsequently, the AUD/JPY adopted a subdued bullish trend as the 20-period MA began rising, and the candles crossing over it. As expected, this trend showed that the AUD became stronger after the increase in home loans.

Bottom Line

From the above analyses, we can conclude that although the home loans data is a moderate-impact economic indicator, it significantly impacts the forex price charts. This indicator’s impact can be said to have been amplified since it signals the rebounding of the real estate sector from the coronavirus-induced recessions.

Categories
Forex Assets

What Should You Know Before Trading The CAD/EGP Forex Exotic Pair

Introduction

The CAD/EGP is an exotic currency pair with the CAD representing the Canadian Dollar, and EGP – the Egyptian Pound. Forex trading in such an exotic currency pair is accompanied by higher volatility. The CAD is the base currency, while the EGP is the quote currency in this pair. Therefore, the price attached to this pair shows the amount of EGP that 1 CAD can buy. Let’s say that the price of CAD/EGP is 11.7692. This price means that for every 1 CAD, you can buy 11.7692 EGP.

Spread

In the forex market, the difference between the buying and selling prices of a currency pair is called the spread. The spread for CAD/EGP is: ECN: 3.7 pips | STP: 8.7 pips

Fees

There are no broker fees associated with the STP accounts. For the ECN account, however, the trading fee is determined by your broker.

Slippage

Slippage in forex is the difference between the price that a trader requests the broker to complete a trade and the price that the broker executes the trade. This difference is determined by the brokers’ speed of execution and market volatility.

Trading Range in the CAD/EGP Pair

Forex traders endeavor to know the average number of pips that a particular currency pair moves within a given timeframe. The trading range represents the volatility of a currency pair within a particular timeframe. The knowledge of a pair’s trading range makes for a useful risk management tool.

If, for example, during the 1-hour timeframe, the CAD/EGP pair has a trading range of 10 pips, then someone trading this pair can expect to gain or lose $8.5 within this period. Below is a table showing the minimum, average, and maximum volatility of CAD/EGP across different timeframes.

The Procedure to assess Pip Ranges

  1. Add the ATR indicator to your chart
  2. Set the period to 1
  3. Add a 200-period SMA to this indicator
  4. Shrink the chart so you can determine a larger period
  5. Select your desired timeframe
  6. Measure the floor level and set this value as the min
  7. Measure the level of the 200-period SMA and set this as the average
  8. Measure the peak levels and set this as Max.

CAD/EGP Cost as a Percentage of the Trading Range

In the forex market, trading costs include brokers’ fees, slippage, and spread. i.e.

Total cost = Slippage + Spread + Trading Fee

Below are analyses of percentage costs (in pips) to be expected when trading the CAD/EGP pair using either the ECN or the STP account.

ECN Model Account

Spread = 3.7 | Slippage = 2 | Trading fee = 1

Total cost = 6.7

STP Model Account

Spread = 8.7 | Slippage = 2 | Trading fee = 0

Total cost = 10.7

The Ideal Timeframe to Trade CAD/EGP

As can be seen from the tables above, trading the 1-hour timeframe with either the ECN or the STP account carries the highest trading costs. We can deduce that during times of low volatility, the trading costs are higher. However, for short term traders, timing their trades when volatility is above average during the 1H, 2H, 4H, and the 1D timeframes ensure they incur lower trading costs with the CAD/EGP pair.

The higher timeframes provide the longer-term traders of the CAD/EGP pair lower trading costs. Forex traders can reduce the trading costs by using limit order types, which removes the risks of slippage. Here’s a demonstration of how this works in the ECN account.

Total cost = Slippage + Spread + Trading fee

= 0 + 3.7 + 1 =4.7

Notice that when the slippage cost is eliminated by using limit orders, the total costs are significantly reduced. The highest cost, for example, reduces from 113.56% to 79.66%.

Categories
Forex Videos

Forex! USDJPY Forecast – Support & Resistance Areas Explained!

Where next for USDJPY – Support and Resistance areas explained

Thank you for joining this Forex academy educational video. In this session, we will be looking at a daily chart of the US dollar Japanese yen pair and looking at support and resistance lines.

It has been a tumultuous few months for the US dollar Japanese yen pair. With a high in February of 112.00 down to a low a few weeks later in March of 101.16. Many investors will have been completely caught offside, and wins and losses for those who got it right or wrong will have been substantial.
When analyzed on the daily chart adding simple support and resistance lines, we see clear patterns emerging of price action and where the exchange rate forms peaks and troughs.
The fall in the pair from position A to position B was down to the coronavirus’s impact and where the Japanese yen is favored in times of such crisis due to its safe-haven status. However, this huge move had to become oversold, and of course, it did just above the key 101.00 level, and where we saw a rally back to position C, which incidentally is a step lower than position A. Typically, we find that institutional traders will pull out of a huge upside momentum trade slightly before a previous high, or a previous low if the situation was reversed because they fear that in this situation sellers are lurking at the previous high level, and that is proved when the pair pulls lower.


We then see a period of consolidation between positions D E and F. And a subsequent lower step to G and where the pair only manages a following high at position H, again a defined step lower than the previous high of position F.
Now things become interesting because price action fades in a tight consolidation period and at position 1 does not reach the previous high of position H and collapses down to position I. Again, we have a shift lower to position J and where we again see price not able to pull back to that resistance line at position 2, and price again begins to fade down to position K which incidentally is a double bottom formation aligned with position I.
These fading areas of price action are unable to reach previous highs, as shown by positions 1 and 2 and very strong telltale signs that price action is about to move lower. Obviously, the opposite applies. But with the USDJPY pair, we are looking for reasons to go short due to the overall fading trend and the nature of the yen being bought in times of uncertainty.


And with the market being extremely volatile right now and US elections only a few weeks, we can reasonably expect a continuation in the strength of the Japanese yen and, therefore, more movement to the downside in this pair.
Add these simple trend lines of resistance and support to your own charts and look out for fading price action to these lines, such as described in positions 1 and 2.

Categories
Crypto Videos

OneCoin Scam Getting It’s Own Movie & TV Show!


Kate Winslet Starring in a Movie About OneCoin

HOLLYWOOD, CA/USA – JULY 9, 2016: Kate Winslet star on the Hollywood walk of fame.

Even though the well-known OneCoin Ponzi scheme is still being processed through the courts, a movie on how this project came to be is in development. Not only that, but its lead star is the lead from the movie Titanic.
As reported by Deadline, a famous Hollywood actress Kate Winslet has signed on to both star and produce Fake!, a movie based on the unpublished book written by Jen McAdam and Douglas Thompson. McAdam, as a writer of this book and a victim of the OneCoin scheme, will produce the film.

Fake! will be written as well as directed by Scott Z. Burns, the man who helmed The Report, a political drama that was based on the CIA’s report on torture after the 9/11 event. He is also known for writing the 2011 pandemic movie Contagion, also starred by Kate Winslet.

OneCoin was founded in 2014 during the expansion of the crypto industry. It was created by Ruja Ignatova in Bulgaria. The project followed the typical structure of a multilevel Ponzi marketing scheme but had a cryptocurrency twist. It was promised OneCoin is the next Bitcoin, even though it wasn’t backed by a blockchain or a decentralized network. Despite several warnings coming from the crypto industry insiders and government agencies, OneCoin became one of the most popular projects, fostering an ‘us vs. them’ mentality. Even after OneCoin failed, it left the market with several “clones” which did pretty much the same thing it did, but with a twist here or there.


McAdam, who started a support group for numerous OneCoin victims, said that both she and her friends and family invested and lost over 250,000 euros, equating to around $300,000, before she learned its server was not even a blockchain and that it was all a scam.
Ignatova was charged with multiple charges, including wire fraud, securities fraud, as well as money laundering, on May 7 of this year, but she has not been seen ever since 2017. Her brother Konstantin Ignatova, an ex-executive in OneCoin, was also charged with the same in March of this year. He has since agreed to testify against his sister on the matter. Defrauded investors have sued OneCoin, alleging losses of up to $5 billion.

The movie Fake! is not the first artwork inspired by the OneCoin Ponzi scheme. A TV show coming from the British Broadcasting Corporation (BBC) about Ignatova and OneCoin is also in development.

Categories
Forex Course

161. Learning To Trade Interest Rate Differentials

Introduction

In forex trading, every trader anticipates the upcoming price of a currency pair in several ways. Traders and analysts use market analysis tools like capital flows or price action to predict the currency pair’s future direction. However, some use interest rate differentials to predict the upcoming price movement of a currency pair.

What is the Interest Rate Differential?

In trading a currency pair, buying towards the currency with a higher interest rate and selling the currency with a lower interest rate is a way to make money from the forex market, which is known as interest rate differential or price appreciation.

The interest rate differential makes the forward point that makes up a forward currency rate. The forward rate is created by adding or subtracting the current exchange rate and making a new rate. At that rate, traders can buy or sell a currency pair in the future. Let’s have a look at the example of interest rate differential.

If we want to sell the USDJPY 10 year in the future, we have to make a payment to the buyer. The amount should be based on the difference between the US interest rate and the Japanese interest rate. Later on, we will make payment to the buyer at the current spot rate plus interest rate differential between the US interest rate and the Japanese interest rate.

How to Make Profit from Interest Rate Differential

The higher interest rate of a country has a higher demand for holding currencies than the country with a lower interest rate. The main reason behind the differential is that it costs a trader to hold on to a currency that has a lower interest rate.

Using this concept, we can predict the future price of a currency pair. If the US interest rate goes higher or the Japanese interest rate goes lower, the USDJPY price will move towards the direction of interest rate differential. Similarly, if the US interest rate goes lower or the Japanese interest rate increases, the USDJPY price will likely move lower.

Conclusion

In forex trading, we take trading decisions based on probabilities, and interest rate differential is one of these probabilities. Traders can take the ultimate trading decision by considering this element besides the fundamental and technical analysis.

[wp_quiz id=”86464″]
Categories
Cryptocurrencies

What’s Dusk (DUSK) All About?

Bitcoin actualized the idea of a decentralized currency, one that is beyond the control of any controlling authority and which lets users transact in a purely peer-to-peer fashion, removing the need for intermediaries. Built on top of the novel tech, ‘blockchain,’ Bitcoin inspired countless other cryptocurrencies and decentralized applications (DApps). 

However, Bitcoin’s creator did not envision some of the problems that impede it today, such as lack of anonymity – a highly prized factor in today’s world. There’s also the issue of extreme energy consumption that’s required to maintain and secure it. Then there’s the issue of not-so-guaranteed security, which has been another point of contention. The network’s 51% hypothetical attack hovers over it throughout. 

Throughout the years, the Bitcoin community has tried to come up with various solutions, but these either proved flawed or did not stand the dynamic nature of the blockchain space. Others presented with solutions but still missed the mark – e.g., by still lacking in robust security. 

Dusk is a blockchain and cryptocurrency protocol that attempts to meet the main challenges facing the space today, with the bonus of providing auditability of transactions. 

We’ll explore the Dusk protocol in detail while getting a closer look at its native token, DUSK, and how it fits in the puzzle. 

What’s Dusk? 

Launched in 2018, Dusk is a privacy-oriented blockchain protocol that wants to provide privacy, seamless programmability, and the ability to audit smart contracts. Based in Amsterdam, Dusk is the brainchild of a team that collectively has a wealth of experience in entrepreneurship, engineering, and blockchain, and have worked in some of the biggest companies in those fields, like Amazon, Mozilla, Reaktor, Zcash, NEO Research and so on. 

Dusk Network will be a blockchain protocol that will facilitate easy deployment of programmable DApps, hence becoming the backbone of a global and permissionless DApp ecosystem. The Dusk team hopes to eliminate the technical barriers that have held back crypto’s mainstream adoption. 

Some of the project’s highlights include: 

  • Private proof of stake consensus model through which block producers can stake in DUSK anonymously
  • Implementation of ZeroCaf, which allows it to achieve fast, safe, and elliptic curve-secured transactions
  • Built by a team of entrepreneurs, engineers, and blockchain experts with a work history at some of the most elite companies 

The Dusk team wants to guarantee on-chain privacy and programmability without compromising on scalability. The network can achieve this thanks to the following features: 

  • Private Proof-of-stake: The network implements a private version of the Proof-of-stake consensus protocol, a Segregated Byzantine Agreement (SBA) that runs on a ‘Proof of Blind Bid’ that enables block producers to stake in private
  • Decentralization: This means centralized staking pools do not apply in the staking process. Instead, participants are encouraged to do so autonomously.
  • Replaceability: Block generators are chosen in a random fashion without reference to earlier outcomes

For their part, these features are enabled by the following characteristics: 

  • A three-layered consensus model consisting of block generation, block reduction, and block agreement.
  • ZeroCaf for efficient, fast, and elliptic curve-secured operations 
  • Poseidon, a zero-knowledge hash function
  • Browser nodes that facilitate zero-knowledge verification and support Dusk’s virtual machine architecture
  • Instant Transaction Finality: On the Dusk protocol, transactions are final – as in they’re verified and recorded on the blockchain as soon as they’re produced

Value Proposition of Dusk

The Dusk team has designed Dusk to be an open-source network to become “the privacy infrastructure of choice for an entire ecosystem of solutions, whether in finance governance, cybersecurity, or something completely new.” With that, the value proposition of Dusk included the following: 

#1. Privacy: The Dusk network provides speed and decentralization without sacrificing on decentralization. DApp issuers on the platform can create zero-knowledge proofs, checks, and balances.

#2. Permissionless: The Dusk network is permissionless, meaning anyone from anywhere can join the network without requiring permission from any centralized party

#3. Public: Users do not need authorization from a trusted party to take part in the Dusk platform. They also need minimal processing power and inexpensive IT resources to join the network. Users that have staked in DUSK can participate in the network’s consensus.

#4. Compliance: By using zero-knowledge proofs, users can design real-life applications that adhere to legal requirements while simultaneously offering top security for them. And they vastly reduce costs by doing this on-chain. 

Compliance: through zero-Knowledge proofs, companies and projects can create real-world applications that can adhere to strict compliance requirements while still offering data privacy. This increases the ability to perform business processes on-chain, leading to significant cost reduction.

A Unique Consensus Model

Dusk implements a unique three-layered consensus mechanism to secure and maintain the network. 

These layers are as follows: 

Blind Bid Phase:

In this phase, network participants who wish to be block generators stake in DUSK tokens to get access to the block generation lottery. The staking process is known as a ‘blind bid’ because the amount staked and the staker’s identity are kept private and confidential. The blind bid is stamped with a secret number chosen by the block generating algorithm. This way, the stake owner can claim their transaction anytime while still preserving the privacy of their identity and the staked amount. 

Block Generation and Selection Phase:

For each round, block generators use their blind bid to enter the lottery. After that, they run a score, which is positively affected by the number of tokens staked. Since the protocol relies on zero-knowledge proof, the Blind Bid is significantly more secure than public Proof-of-stake systems while still exhibiting equal resilience to Sybil attacks. The candidate with the highest score is finally selected. 

Block Reduction Phase: 

After the block generators selection phase, a committee of participants known as ‘Provisioners’ conduct ‘Block Reduction,’ which is a process of gathering signatures and establishing the candidate block if the signatures pass a 75% threshold. The block reduction phase is also the Block Agreement phase, which is an additional phase designed to provide instant finality to the selected block and protect it against any attacks. 

The DUSK Token

  • DUSK is the native cryptocurrency of the Dusk network. It plays several roles, including the following: 
  • As a staking mechanism in order to participate in network consensus
  • As payment for on-chain transactions, deployment of DApps, and as gas fees
  • As an incentive/reward for consensus participants
  • As a governance mechanism, through which token holders can vote on critical decisions affecting the network

Key Metrics

The DUSK token posted the following metrics as of October 27, 2020. First off, it traded at $0. 039706, while ranking at #478. It had a market cap of $10,872,265, a 24-hour volume of $131,695, a circulating supply of 273,821,673, and a total supply of 500 million. DUSK had an all-time high of $0.614791 (July 22, 2019) and an all-time low of 0.011059 (March 13, 2020). 

Where to Buy and Store DUSK 

DUSK tokens are currently listed on a variety of legit exchanges, including Binance, HotBit, CoinDCX, Bittrex, Bitfinex, Binance DEX, Switcheo Network, and LiteBit.eu. In these exchanges, the token is listed against BTC, USD, BNB, ETH, EUR, and USDT.

The DUSK tokens can be stored in any Ethereum-compatible wallet, with choices including MetaMask, Guarda, Atomic Wallet, Trust Wallet, Parity, Ledger Nano, and Trezor. The network also provides an official Command Line Interface (CLI) wallet for the more tech-savvy. 

Final Thoughts 

The Dusk network brings novel concepts to solve some of the most persistent issues in blockchain. Its zero-knowledge proof implementations assure users of high-level security, and its three-way block consensus protocol ensures the process is as unbiased, legit, and safe as possible. Dusk ushers a new era of auditable smart contracts, ensuring users can make necessary upgrades to them anytime. Here’s to hoping the Dusk team holds more surprises for the future. 

Categories
Cryptocurrencies

Keevo Hardware Wallet Review: How Does Paperless Recovery Work & Is It Safe?

Keevo is a hardware crypto wallet developed by a San Francisco-based Fintech Company – BitKey Technologies Inc. And according to its developers, Keevo has its focus set on providing users with a hardware wallet that offers the right balance between security and usability. It is highly innovative and offers standard-setting solutions to some of the challenges facing the crypto industry like continuity after death and paperless crypto backup and recovery.

On their website, the Keevo hardware wallet is described as a “Swiss bank vault in your pocket, but without the bank,” as well as a simple, intuitive, and secure crypto wallet.

But how true are these bold claims? How secure is the Keevo hardware wallet? More importantly, how effective are such revolutionary features as paperless recovery and beneficiary service? We answer all these questions and tell you everything else you need to know about the crypto vault in this Keevo hardware wallet review.

Keevo wallet key features

On-device color screen: Keevo hardware wallet device has a large, high-resolution color display as its most prominent feature. This screen is large enough to fit a wallet address; it’s easily navigable and touch-sensitive.

Durable casing: Keevo hardware wallet’s casing is made from precision-cast zinc alloy and glass fiber, and reinforced steel for maximum durability. These also ensure that the wallet is protected from elements of nature like dust, temperature, and water.

Desktop app companion: Keevo hardware wallet is also compatible with the keevo desktop app that lets you view your crypto activity and your digital assets easily.

Multi-wallet vault: Keevo is a multi-wallet crypto vault in that there is no limit to the number of wallet addresses or private keys you can store in the wallet.

Beneficiary service: Keevo offers the revolutionary beneficiary service that allows your heir to inherit your digital assets when you pass. This solves the dead man’s conundrum that has seen an estimated 4 million Bitcoins lost forever since their holders didn’t leave clues about the wallet passwords or recovery seed before death. To achieve this, Keevo allows you to name a beneficiary and have them create a separate login option (PIN + Fingerprint) on your Keevo carbon key. Upon your passing, Keevo will verify your death before handing over the login credentials to your heir.

Keevo wallet security features

Passcode + Fingerprint sensor: Keevo hardware wallet is protected by a multi-layered security system. You start by creating a PIN code and reinforce it with a Fingerprint. This ensures that even if a hacker gained access to your PIN, they can’t transact without your Fingerprint.

Two-factor authentication: Every outbound crypto transfer initiated by Keevo hardware wallet must be subjected to two-factor verification. It takes the PIN and Touch ID to authorize crypto transfers to other wallets or exchanges.

Dual chip architecture: Keevo claims to use double CPUs that embrace the highest data encryption levels and segregation as used by leading banks and finance industry players.

No storing private keys: Regardless of all these safety and privacy measures employed by Keevo, the company claims that it does not store your private keys. Rather, it calculates the digital assets associated with the login credentials every time you log in.

Proprietary multi-signature system: Keevo wallet developers are in the final stages of patenting a multi-factor/multi-signature transaction authentication system that will then be integrated into the Keevo hardware wallet.

Carbon Key: This refers to a proprietary private keys recovery system designed and populated by the Keevo hardware wallet. It is a four-step and paperless authentication system that backs up your wallet and helps you recover private keys, effectively replacing the recovery seed system used by most wallets. The carbon key is a secondary hardware device that stores encrypted copies of your hardware wallet’s PIN code, Fingerprint, and wallet data. You start by sending this data to Keevo, and they will create a personalized Carbon key and ship to you or store it in one of the ultra-secure 1400+ vaults maintained by Iron Mountain data handlers for a small fee.

How to set and activate the Keevo Hardware wallet

Step 1: Order your Keevo hardware wallet

Step 2: Download and install the Keevo desktop wallet app.

Step 3: Complete registration by choosing a username and creating a password

Step 4: Turn on the Keevo hardware wallet device and connect to the computer via the provided USB cable.

Step 5: Once paired, create a PIN for the device and scan your Fingerprint.

Step 6: Keevo will now display your wallet address and QR code

Step 7: The wallet is now active and ready for use

Note: You will need to contact the Keevo wallet development team to activate the beneficiary service and subscribe to their service plans.

How to add/receive Crypto into your Keevo Hardware wallet

Step 1: Log in to your Keevo desktop app and click on the “Receive” icon.

Step 2: From the display window, copy the wallet address or its QR code and forward it to the person sending you altcoins

Step 3: Wait for your funds to reflect on your account.

How to send Crypto from your Keevo Hardware wallet

Step 1: Log in to your Keevo desktop wallet and click on the “Send” icon.

Step 2: Select the altcoin you wish to send

Step 3: Enter the recipient wallet address and the amount of funds to transfer in the transfer window

Step 4: Connect the hardware device to the wallet

Step 5: Log in to the hardware device and verify that the transaction details are correct.

Step 6: Hit send.

Keevo Hardware wallet ease of use

Despite playing host to several premium features, Keevo maintains one of the most interactive and easy to use user interfaces. Both the desktop wallet app and the hardware device feature a clean user and easily navigable user interface. And plastered throughout the website, especially on the FAQ page of the Keevo website and blog, is a host of explanatory guides teaching you how to interact with the wallet and most of its features.

Keevo Hardware wallet supported currencies and countries.

Keevo supports all the popular cryptocurrencies, and plans are underway to incorporate as many altcoins and tokens as possible.

The wallet is designed and assembled in the US but can be shipped to virtually any crypto-friendly country across the world.

Keevo Hardware wallet cost and fees

Keevo hardware wallet costs $299.

There are, however, two other charges associated with the use of the Keevo hardware wallet. First is the blockchain network fees you have to pay every time you send Crypto to other wallets or exchanges. It is mandatory and is collected by the respective blockchain miners or network administrators.

Second is the subscription cost for the service plans offered by Keevo that is paid monthly/annually. The fee is optional and only applies to individuals who wish to enjoy the beneficiary service and have their carbon key (wallet backup) stored in the ultra-secure Iron Mountain vaults.

Keevo Hardware wallet customer support

Keevo has an active and highly responsive customer support team that you can call, text via the Live chat feature on the website of and desktop app, email, or direct message via the different social media platforms.

The Keevo wallet developers also host regular Ask Me Anything (AMA) sessions on their telegram channel, where you get to interact and engage both its developers and experienced Keevo Wallet users.

What are the pros and cons of using the Keevo Hardware wallet?

Pros:

  • Keevo wallet employs key security measures around the wallet, including storing your carbon key in Iron Mountain vaults.
  • The beneficiary system ensures that your digital assets aren’t lost when you die.
  • Its carbon key simplifies the backup and recovery process.
  • The wallet features advanced security and operational features.

Cons:

  • You have to verify your identity to access their beneficiary system.
  • One may consider Keevo wallet’s price restrictive.

Comparing Keevo Hardware wallet with other hardware wallets

Keevo Hardware wallet vs. Trezor Model T wallet

Keevo and Trezor Model T hardware wallets are highly innovative hardware wallets with a relatively large and high-resolution touch screen. Both feature an intuitive user interface and embrace such effective security and privacy measures like two-factor authentication and backup/recovery options. Further, swallets addresses are generated offline by a hierarchically deterministic system.

But while Trezor will only embrace the industry standard operational and security features, Keevo has introduced several innovative and proprietary security features. For instance, Trezor stores your private keys online and comes with a card for storing the recovery seed. Keevo, on the other hand, doesn’t store your private keys in its secure element. And in place of the backup and recovery seed, it introduces the revolutionary carbon key.

Verdict: Is the Keevo hardware wallet safe?

Yes. Keevo hardware wallet has employed highly effective safety and privacy measures around the wallet. Most of these are proprietary, highly innovative, and fit for eventual adoption as the new industry standard. These include the innovative paperless carbon key that serves as a wallet backup and recovery option, the patent-pending multi-factor authentication, the dual-chip architecture that does not store private keys in the wallet, and the revolutionary beneficiary system that ensures your cryptos don’t die with you upon your passing.