Categories
Forex Assets

AUD/HRK – Analyzing The Costs Involved While Trading This Exotic Pair

Introduction

The abbreviation of AUD/HRK is Australian Dollar, paired with the Croatian Kuna. Here AUD is the official currency of Australia and is also the fifth most traded currency in the Foreign Exchange market. In contrast, HRK stands for the Kuna, and it is the official currency of Croatia. The Croatian National Bank issues this currency.

Understanding AUD/HRK

In the Forex market, to determine the relative value of one currency, we need another currency to compare. Here, when we buy a currency, which is known as the base currency and simultaneously sell the quote currency. The market value of AUD/HRK helps us to understand the strength of HRK against the AUD. So if the exchange rate for the pair AUD/HRK is 4.5571, it means to buy 1 AUD, we need 4.5571 HRK.

Spread

A spread is defined as the difference between the purchasing & selling price of a Forex pair. In simple words, it is the difference between the bid price and the ask price of an asset. Below is the spread charges for ECN and STP brokers for AUD/HRK pair.

ECN: 40 pips | STP: 43 pips

Fees

A Fee is the charges that we traders pay to the broker for executing a trade. Fees to a much depend on the type of broker(STP/ECN) we use.

Slippage

When we want to execute a trade at a particular market rate, but instead, the trade gets executed at a different rate, and that is because of the slippage. Slippage occurs when we counter a volatile market, and when we execute a large order at the same time.

Trading Range in AUD/HRK

The trading range here will determine the amount of money we will win or lose in a given amount of time. In the below table, we have the representation of the minimum, average, and maximum pip movement in a currency pair. Here we will use the ATR indicator that indicates the price movement in a currency pair. We will evaluate it merely by using it with 200-period SMA.

Procedure to assess Pip Ranges

  1. Add the ATR indicator to your chart
  2. Set the period to 1
  3. Add a 200-period SMA to this indicator
  4. Shrink the chart so you can assess a significant period
  5. Select your desired timeframe
  6. Measure the floor level and set this value as the min
  7. Measure the level of the 200-period SMA and set this as the average
  8. Measure the peak levels and set this as Max.

AUD/HRK Cost as a Percent of the Trading Range

The cost of trade depends on the broker type and varies based on the volatility of the market. The overall cost of trade includes spread, fees, and sometimes slippage if the volatility is more. To decrease the cost of the trade, we can use limit orders instead of market execution.

ECN Model Account

Spread = 40 | Slippage = 3 |Trading fee = 5

Total cost = Slippage + Spread + Trading Fee = 3 + 40 + 5 = 48

STP Model Account

Spread = 43| Slippage = 3 | Trading fee = 0

Total cost = Slippage + Spread + Trading Fee = 3 + 43 + 0 = 46

Trading the AUD/HRK

AUD/HRK is an exotic currency pair. As we can see, the average pip movement in 1hr is 133, which implies higher volatility. The higher the volatility, the higher is the risk and lower is the cost of the trade and vice versa. Taking an example, we can see from the trading range that when the pip movement is lower, the charge is high, and when the pip movement is high, the charge is low.

To reduce our costs of trade, we may place trades using limit orders instead of market orders. In the below table, we will see the representation of the cost percentages when limit orders are used. As we can see, the cost of slippage is zero. In doing so, the slippage will not be included in the calculation of the total costs. And this will help us in reducing the trading cost by a considerable margin. An example of the same is given below.

ECN Model Account (Using Limit Orders)

Spread = 40 | Slippage = 0 |Trading fee = 5

Total cost = Slippage + Spread + Trading Fee = 0 + 40 + 5 = 45

Categories
Forex Daily Topic Forex Fundamental Analysis

Everything About ‘Home Ownership Rate’ & Its Impact On The Forex Price Charts

Introduction

Home Ownership Rate is an economic indicator that is extensively used by both the public and private sector organizations to predict the demand for different types of Houses. It also forms a part of the index of leading economic indicators and thereby is used by the Federal Government and economists to forecast the economic health of the country. It is useful for investors from abroad also to gauge the standard of living or wealth per individual or financial health of a country.

 What is Home Ownership Rate?

Home Ownership Rate is the proportion of households that are owners. In simple terms, it is the ratio of the number of houses occupied by their owners to the total number of occupied houses in the region. The region can be country, state, or a metropolitical area.

Hence, the Home Ownership Rate is given by the following equation:

In the above equation, a housing unit can be a house, apartment, condo, or single room or group of rooms that are occupied or intended for occupancy as separate living quarters. In the United States, the Home Ownership Rate is provided by the United States Census Bureau for the entire U.S., states, regions, for the 75 largest Metropolitan Statistical Areas (MSAs).

The Census Bureau collects using a probability selected sample for about 72,000 housing units, both occupied and vacant. Households from all the 50 states and the District of Columbia are part of the survey for the four consecutive months.

How can the Home Ownership Rate numbers be used for analysis? 

The Home Ownership Rate tells us the number of householders that are owning a house. Owning a home signifies a lot of things. Firstly, owning a home means that either you are wealthy enough to own a home or at least have an income source (job or business) whose prospects you are confident about.

An individual or family decides to take home only when their financial prospects are looking confident, in most cases. When more people have their own homes, it indicates healthy liquidity of the economy, where enough people have had enough money to own a home, which is not cheap at all.

The below two graphs are the Quarterly Home Ownership rates and Real GDP growth rate. It is easily seen that when the economy is seeing improvement in Home Ownership rates, there is a correlating increase in GDP. During the downtrends also the same mirroring is observable in GDP and the Ownership rate. Hence, this becomes a leading economic indicator to predict a growing or contracting trend for the economy.

When the Home Ownership rate decreases, it indicates fewer and fewer people can afford to own a home, or more people are selling off their homes to secure their future. When the people of the country are not confident about their economic prospects, then they would prefer to save for a rainy day than take a risk with a big mortgage and own a house for which they may or may not be able to pay the bills consistently.

Decreasing Ownership rates are indicative of tight lending environments where higher interest rates discourage householders from procuring mortgages for homes. It is an indication that the government is pulling money out of the system to deflate the economy. Increasing Home Ownership Rates are indicative of the lending environment that is currently prevailing in the economy. An increase in the rates is indicative of loose monetary policy enabling the banks to lend out money at lower interest rates, thereby making it more affordable to the potential buying householders.

Loose monetary policy from the Central Authorities is intended to spur economic growth, which translates to such effects (increase in rates of ownership). Such a stimulus generally tends to keep the economy either going or growing in most cases, possibly avoiding any deflation.

Impact on Currency

The Home Ownership Rate is a leading proportional economic indicator. When the number of Households owned and occupied number increases, it is accompanied by signs of an expanding or growing economy, which is appreciating for the currency. An increase in the Home Ownership rate is appreciating for currency for the coming quarters and vice-versa.

The impact of the Home Ownership Rate is mild as more frequent reports like Building Permits overshadow it that indicates before houses are even built. Building Permits reports are monthly, and hence, the trends are spotted in advance before it is also confirmed by the Housing Starts, Housing Completion, and Home Ownership Rates.

Economic Reports

The Census Bureau publishes quarterly and annual reports on its official website for the United States along with other reports like Rental and Housing Vacancy rates. Homeownership Rates are also reported based on the age of the householder and also by family status.

The release dates for each quarterly report are already posted on its official website. It is typically released around 25-28th of the reporting month for the previous quarter at about 10:00 AM. Graphical statistics for the same are also available on its official website as illustrated below:

Sources of Home Ownership Rate

We can find the latest Home Ownership Rate report from the United States Census Bureau here – Home Ownership Rate – Census Bureau. The annual statistics for the same can be found here – Census Bureau – Quarterly and Annual. The same data is also available with comprehensive plotting tools on the St. Louis FRED website. Below is the reference for the same – Home Ownership Rate – FREDHousing, and Homeownership Rate. The Home Ownership Rate for various countries is available here for further analysis – Home Ownership Rate – Trading Economics.

Impact of the ‘Home Ownership Rate’ news release on the price charts

In the previous section of the article, we learned about the ‘House Ownership Rate’ fundamental indicator, which is nothing but the percentage of homes that are occupied by owners in a country. The Census Bureau releases this data, which includes info about the state of ownership overall, after the end of every year. Home Ownership is considered an important part of contributing to a productive society. The government promotes Home Ownership by offering tax deals and cheap loans as it creates an asset for people to invest and accumulate their wealth. It indirectly encourages the growth of a country, socially and financially.

The below image shows the graphical representation of the House Ownership Rate of Switzerland in 2017 and 2018. As we can, the rate increased to 42.5% percent in 2018 from 41.3% in 2017. A higher than expected data is considered to be positive for the currency while a lower than expected reading is taken as negative. Let us analyze the reaction of the market to this data and view the change in volatility due to the announcement.

GBP/CHF | Before the announcement:

We shall start with the GBP/CHF currency pair, where the above chart represents the ‘daily’ time frame chart of the pair. We see that the price is in a downtrend and is presently at its lowest point. Technical analysis suggests that until we have a price retracement, we cannot trade in the direction of the trend. Depending on the impact of the news announcement, we will be able to a suitable position in the market.

GBP/CHF | After the announcement:

After the news announcement, we see that market falls lower, and volatility increases to the downside. The market reaction can be explained by the fact that the House Ownership Rate came out to be positive for the economy, which made traders sell the currency pair and go ‘long’ in Swiss Franc. As the impact of this news event is less, we cannot expect the market to go lower and make ‘lower lows.’ Thus, one needs to cautious before taking a sell trade.

AUD/CHF | Before the announcement:

AUD/CHF | After the announcement:

The above images represent the AUD/CHF currency pair, where we see that before the news announcement, the market was in a strong downtrend indicating a great amount of strength in Swiss Franc. Currently, the price is at a place where the market had rallied earlier, also known as the ‘demand’ area. Thus, we can expect buyers to come back into the market at any moment. Aggressive traders at this stage can go buy the currency with a strict stop loss.

After the news announcement, the price initially goes lower but gets immediately bought, and the ‘news candle’ leaves a wick on the bottom. Volatility is witnessed on both sides of the market, and the price closes near its opening price. The news release did not have an adverse impact on the pair and cause any major change in the price chart. Once the price moves higher and gives an indication, traders can go ‘long’ in the currency pair with a stop loss below the ‘news candle.’

NZD/CHF | Before the announcement:

NZD/CHF | After the announcement:

The above images are that of the NZD/CHF currency pair where the overall trend appears to be up, and recently the price has retraced to a key technical level. Here, the Swiss Franc does not appear to very strong, and the New Zealand dollar is showing signs of strength. If the news release does not influence the currency pair strongly, this could be an ideal setup for going ‘long’ in the market.

After the news announcement, the market’s reaction to the news data was minimal, and we hardly see a change in volatility. An increase in volatility to the upside is a confirmation sign that the market will continue its uptrend, and a further move to the upside can be expected.

That’s about ‘House Ownership Rate’ and its impact on the Forex market after its news release. If you have any questions, please let us know in the comments below. Good luck!

Categories
Forex Assets

AUD/RON – What Should You Know Before Trading This Exotic Pair?

Introduction

The abbreviation of AUD/RON is Australian Dollar paired with Romanian Leu. Here AUD is the official currency of Australia and is also to be the fifth most traded currency in the Forex market. While RON stands for The Romanian leu, and it is the currency of Romania.

Understanding AUD/RON

In AUD/RON currency pairs, the first currency (AUD) is the base currency, and the second currency (RON) is the quote currency. In the Foreign Exchange market, we always buy the base currency and simultaneously sell the quote currency and vice versa. Here, the market value of AUD/RON helps us to understand the strength of RON against the AUD. So if the exchange rate of the pair AUD/RON is 2.9141, it means to buy1 AUD we need 2.9141 RON.

Spread

Forex brokers charge some commission on the trade we open, and that depends on the ask and the bid price by the broker. Spread is the difference between this Ask and Bid price. Every broker has different ask and bid prices. Below is the spread charges for ECN and STP brokers for AUD/RON pair.

ECN: 33 pips | STP: 35 pips

Fees

A Fee is the charges that we traders pay to the broker for opening a trade. This fee depends on the type of broker we use (STP/ECN).

Slippage

When we want to execute a trade at a particular market rate, but instead, the trade gets executed at a different rate. This is because of slippage. Slippage can take place at any time, but mostly we can counter a volatile market, and when we execute a large order at the same time.

Trading Range in AUD/RON

As a trader, our main motive should be to know the market volatility and avoid losses. The trading range here will determine the amount of money we will win or lose in a given amount of time. ATR is a technical indicator that indicates the price movement in a currency pair. In the below table, we have the representation of the minimum, average, and maximum pip movement in a currency pair. We will evaluate it merely by using the ATR indicator combined with 200-period SMA.

Procedure to assess Pip Ranges

  1. Add the ATR indicator to your chart
  2. Set the period to 1
  3. Add a 200-period SMA to this indicator
  4. Shrink the chart so you can determine a significant period
  5. Select your desired timeframe
  6. Measure the floor level and set this value as the min
  7. Measure the level of the 200-period SMA and set this as the average
  8. Measure the peak levels and set this as Max.

AUD/RON Cost as a Percent of the Trading Range

The cost of trade depends on the broker type and varies based on the volatility of the market. The overall cost of trade includes spread, fees, and sometimes slippage if the volatility is more. To decrease the cost of the trade, we can use limit orders instead of market execution.

ECN Model Account

Spread = 33 | Slippage = 3 |Trading fee = 5

Total cost = Slippage + Spread + Trading Fee = 3 + 33 + 5 = 41

STP Model Account

Spread = 35| Slippage = 3 | Trading fee = 0

Total cost = Slippage + Spread + Trading Fee = 3 + 35 + 0 = 38

Trading the AUD/RON

AUD/RON is an exotic currency pair. As we can see, the average pip movement in 1hr is 127, which shows the volatility is very high. Note, the higher the volatility, the higher is the risk and lower is the cost of the trade and vice versa.

Taking an example, we can see from the trading range that when the pip movement is lower, the charge is high, and when the pip movement is high, the charge is low. AUD/RON must be traded with proper risk management because of its volatile nature. If we have our strategy with adequate risk management, we can trade in a volatile market too.

Categories
Forex Assets

Trading The AUD/DKK Forex Pair & Analyzing The Trading Costs Involved

Introduction

The abbreviation of AUD/DKK is the Australian Dollar paired with the Danish Krone. Here, AUD is the official currency of Australia and many others like Christmas Island and Norfolk Island. AUD is also to be the fifth most traded currency in the Forex market. In contrast, DKK stands for the Danish Krone, and it is the currency of Denmark, Greenland, and the Faroe Islands.

Understanding AUD/DKK

In AUD/DKK currency pairs, the first currency(AUD) is the base currency, and the second currency(DKK) is the quote currency. In the foreign exchange market, when we sell a currency pair, we always sell the base currency and simultaneously buy the quote currency and vice versa. Here, the market value of AUD/DKK helps us to understand the strength of DKK against the AUD. So if the exchange rate for the pair AUD/DKK is 4.4625, it means we need 4.4625 DKK to buy 1 AUD.

Spread

Forex brokers have two prices for currency pairs: the bid and ask price. The bid price is the price in which we sell an asset, and ask is the price at which we buy it. The difference between the ask and the bid price is called the spread. Below are the spread values for the AUD/DKK Forex pair.

ECN: 20 pips | STP: 23 pips

Fees

A Fee is the charges that we traders pay to the broker for opening a trade. This fee depends on the type of broker (STP/ECN) we use.

Slippage

When we want to execute a trade at a particular price, but instead, if the trade gets executed at a different price, we call that difference as Slippage. The Slippage can take place at any time, but mostly we can counter a volatile market.

Trading Range in AUD/DKK

As a trader, our main motive should be to avoid losses and risks. The trading range here will determine the amount of money we will win or lose in a given amount of time. ATR is a technical indicator that indicates the price movement in a currency pair. In the below table, we have the representation of the minimum, average, and maximum pip movement in a currency pair. We will evaluate it merely by using the ATR indicator combined with 200-period SMA.

Procedure to assess Pip Ranges

  1. Add the ATR indicator to your chart
  2. Set the period to 1
  3. Add a 200-period SMA to this indicator
  4. Shrink the chart so you can assess a significant period
  5. Select your desired timeframe
  6. Measure the floor level and set this value as the min
  7. Measure the level of the 200-period SMA and set this as the average
  8. Measure the peak levels and set this as Max.

AUD/DKK Cost as a Percent of the Trading Range

The cost of trade depends on the broker type and varies based on the volatility of the market. The total cost of trade involves spread, fees, and sometimes Slippage if the volatility is more.

ECN Model Account

Spread = 20 | Slippage = 3 |Trading fee = 5

Total cost = Slippage + Spread + Trading Fee = 3 + 20 + 5 = 28 

STP Model Account

Spread = 23| Slippage = 3 | Trading fee = 0

Total cost = Spread + Slippage + Trading Fee = 23 + 3 + 0 = 26

Trading the AUD/DKK

AUD/DKK is an exotic currency pair that less traded in the forex exchange market. The average pip movement in 1hr is 183, which shows the volatility is very high.

Note, The higher the volatility, the higher is the risk and lower is the cost of the trade and vice versa. Taking an example, we can see from the trading range when the pip movement is more, the cost is low, and when the pip movement is low, the cost is high.

Trading using LIMIT ORDERS

To reduce our costs of trade, we can place the trades using limit orders instead of market orders. In doing so, we can eliminate the Slippage that will help reduce the overall cost of the trade. An example of a Limit order is given below.

Spread = 20 | Slippage = 0 |Trading fee = 5

Total cost = Slippage + Spread + Trading Fee = 0 + 20 + 5 = 25

Categories
Forex Course

120. Introduction To Harmonic Patterns

Introduction

In the previous course articles, we have been discussing a lot of concepts related to Technical Analysis. In that journey, we have learned the trading of some of the most significant chart patterns like Head & Shoulders, Triangle, Wedge, etc. The extension to the learning of these concepts is to know the process of identifying and trading of Harmonic Patterns. We want to mention that learning this part is a bit tricky as the concepts are advanced and require a lot of practice to master them. Let’s get into details.

Brief History

The discovery of these Harmonic patterns dates back to the 1930s. H.M.Gartley, an American author and technical analyst, mentioned the trading of these unique patterns in his book ‘Profits In The Stock Market.’ Later these patterns were highly improvised by ‘Larry Pesavento’ by adding Fib ratios to identify and confirm these patterns. Finally, ‘Scott Carney’ discovered more Harmonic patterns and published them in his most famous book ‘Harmonic Trading.’

What Are Harmonic Patterns?

Harmonic Chart Patterns are nothing but the same kind of Forex chart patterns that we have learned in our previous lessons. But the shapes of these patterns look similar to the real-life birds and animals. For instance, one of the very well known harmonic chart patterns is the Butterfly pattern. That is, when this pattern is complete, we will be able to see a butterfly-like structure on the price charts formed by the price action.

All the Harmonic patterns are both bullish and bearish in nature. That is, these patterns can be identified and traded in both up trending & down trending markets. Also, some of the Harmonic patterns indicate that the current market trend is going to continue, and some of them indicate a market reversal. Hence we can consider Harmonics as both trend continuation and reversal patterns.

Why is it important to know them?

The harmonic patterns levels-up the pattern-based trading as it involves an additional technical tool to confirm and trade them. And that tool is none other than the well known Fibonacci levels. The harmonic patterns can only be confirmed by analyzing at what levels the price action turning its directions. Only if these levels are in line with the predefined Fibonacci levels, we can confirm and trade these patterns. The harmonic trading enables traders in predicting the future price movements of an asset more accurately than any other form of trading.

How many Harmonic Patterns are there?

In total, there are nine Harmonic patterns out of which six are used frequently by the traders to trade the Forex market. The ideology behind trading any of these patterns is the same; we must wait for a particular Harmonic pattern to form completely on the price chart and then take long or short positions accordingly. In the upcoming course lessons, we will be discussing the six Harmonic patterns that we have mentioned below.

The other three less used Harmonic patterns are Shark Pattern, Cypher Pattern, and the ABC Pattern. Stay tuned to learn the trading of these patterns in the easiest way possible. Cheers!

Categories
Crypto Guides

Formal Verification – A Method That Makes Smart Contracts Extra Secure!

Introduction

The smart contracts are now used extensively in the crypto and blockchain space for various use cases, especially for transactions involving a very high volume of money. Hence, it has been more critical than ever to check out smart contracts for any vulnerabilities. These vulnerabilities are the reasons for hacking some of the cryptocurrency platforms, even though the blockchain network is very secure. Hence the timely audits and formal verifications are must both concerning hardware and software to ensure optimal security.

What is Formal Verification?

Formal verification is a method used to check whether the software of hardware systems matches the intended requirement. A particular type of mathematical technique is used to know the intended requirement matches or not. Using these mathematical techniques to check the level of the algorithm of correctness as per the requirement is known as formal verification.

Testing hardware or software with formal verification can be broken down into 2 phases, validation, and verification. Validation determines whether the product meets the user’s needs while verification is testing whether the product works as per the specifications provided.

While formal verification used to be done mostly for the hardware components, it is increasing the testing in software components as well. As there is no third-party involvement in vast transfers of the money, these are autonomous transfers. Hence, smart contracts should be robust enough without any faults.

Why is Formal Verification used for Smart Contracts?

Ethereum is a Turing complete machine, started utilizing the concept of smart contracts. Hence an analysis has been done on around one million smart contracts of Ethereum to check their robustness. It has been found that nearly around 32,000 contracts are faulty. The contracts are seen to be flawed because they were found to either lock the funds indefinitely or release the funds to arbitrary users, and anyone could kill the contract.

Given the nature of the immutability of smart contracts, if these problems aren’t detected before the deployment of the agreement, it will create serious issues once the code is deployed.

Platforms using formal verification

Many platforms that are using smart contracts robustly are trying to integrate formal verification into their platforms. Let us see some of them below:

Cardano

Cardano’s smart contract language is Plutus, which is based on Haskell. Cardano is basically written in Haskell. Cardano is designed with the Cardano computational layer, which by default consists of two layers while one allows formally specified languages used for checking the code of the smart contract, and the other is a defined officially virtual machine and language framework. The default layers’ goal is to check the smart contracts to avoid severe vulnerabilities in smart contracts without any additional requirements.

Ethereum

Ethereum has been trying to incorporate formal verification for a long time now since it has many smart contracts functioning on the platforms. They have even come up with a publication called “making smart contracts smarter.” This publication focuses on smart contracts bugs and mainly focuses on ways to mitigate them. This includes the change in operational semantics of Ethereum to inbuilt formal verification.

There are certain challenges in implementing formal verification in the Ethereum platform. One is gas limits, and the other one is its solidity programming language. To understand solidity, it should be compiled into bytecode. The compiler changes rapidly, so the verification tools should be in tandem with the speed of the compiler.

Conclusion

Measuring the positive impact of formal verification in the smart contracts will take some time since the adoption is slow. Many are realizing just yet the vulnerabilities of smart contracts, and given its substantial financial transactions, the weaknesses should be captured effectively and curtailed at the very beginning to restrict the losses.

Categories
Crypto Guides

What are Sidechains & What is their Purpose?

Introduction

Sidechains are mechanisms that enable the transfer of existing tokens or digital assets from a blockchain platform to another blockchain platform. The tokens or digital assets can be transferred back to the original blockchain if required. The primary platform from which we transfer the assets is called the parent chain or main chain, while the other platform is called sidechain. Ardor blockchain calls the sidechain as childchain.

Sidechains have enormous potential to transform the existing issues of scalability in the blockchain platforms. The transfer need not be only digital assets or tokens, but we may transfer computing or for speeding purposes as well, depending on the processing requirements. We can have many sidechains for a single parent chain.

How do they work?

Sidechain is indeed a separate blockchain platform connected with the leading blockchain platform using a two-way peg. The two-way peg is a method to convert one digital token to another type of token like BTC to ETH. The two-way peg facilitates the transfer of digital assets at a predetermined rate. A user on the parent chain first sends coins to an output address so that they can be blocked.

To ensure that these coins aren’t spent elsewhere, a protocol is followed. Once the transaction is complete, the information is sent to all the chains. Some extra period is used to wait as well to increase security. Once this is done, the same number of coins are released in the sidechain for user access and spending. The same process can be repeated when the tokens are to be sent from sidechain to the main chain. Some other entities come into the picture to run the sidechains seamlessly. They are as below.

Federations

A federation can be called as a group or server which acts between the main chain and a side chain. The sidechain creators can decide federation members. They decide on when to lock the coins and release the coins for spending and vice versa.

Security

The core reason for anyone to move to the blockchain platform is security. So, one may question what about the security aspects in the sidechains. Even though they are connected, they are on their own in terms of security. Both platforms are individual blockchain platforms and are very secure individually.

Further, if there is any disturbance in one platform, the disturbance will not be carried out to the other. The sidechains use separate miners from the main chain. They are incentivized using merged mining. Merged mining refers to the mechanism of mining two or more cryptocurrencies at the same time based on the same algorithm.

Platforms using Sidechains 

Rootstock or RSK

RSK has two-way peg connectivity with the Bitcoin platform. RSK’s vision is to enable smart contracts functionality for bitcoin blockchain, increase scalability, thus faster transactions. Miners are rewarded through merged mining. As of now, the platform supports 100 TPS.

Liquid

Liquid sidechain proposes instant movement of funds between exchanges without waiting for the delay in confirmation from the bitcoin blockchain. This is the first commercial sidechain developed by Blockstream.

Advantages of Sidechains

  • Enhances the scalability of the mainchain, thus increasing the number of transactions per second.
  • Need not create a sidechain again and again; once created, they can be used for any purpose.
  • They enable the communication between two different coins, which helps in the testing of beta coins in the sidechain before the official launch.

Conclusion

The scalability issues of blockchain technology are addressed in different ways, but sidechains are very promising. The communication between two different cryptocurrencies paves ways to multiple features. Transactions costs and time will be reduced as the burden is less for the mainchain. The concept is going to create a massive change in the blockchain technology in the upcoming future.

Categories
Crypto Guides

Can Blockchain Be A Potential Solution For Personal Data Leaks?

Introduction

Personal identity has been a matter of concern in this digital world. Wherever you go, you have to prove that you are indeed the person whom you claim you are if it is a physical world with some government-issued ids. Mostly all the banks in the world have to have the customary Know Your Customer (KYC)/Anti Money Laundering (AML) laws if you have to open a bank account. The government mandates this.

This process is very costly and time consuming for the banks but is of no personal benefit for the organization. If we have to log in to a website, we input our details or login using Google or Facebook account, given all our personal information to these websites. By this, we are entering our details into a server that we don’t have any control over. Which means they can do anything with our data.

All this process creates a lot of siloes of data, with different government or private organizations around the world. Most importantly, we never have control over what they can or cannot do with the data they collect.

Can Blockchain be a solution for our data?

Instead of giving access to our data to anyone and everyone as the government or organization demands to use their services, what if we create a central repository of data in a blockchain platform. Can this be a solution to secure our data? We can say it’s a yes.

Let us examine how using a Hyperledger Indy project which is a platform being developed for identity management.

Hyperledger Indy

Hyperledger Indy is a decentralized ledger platform for Identity Management. Works on the plenum platform, which is similar to smart contracts but tuned for verifying digital identity. Uses Redundant Byzantine Fault Tolerance as a consensus algorithm. Trust anchors play the role of miners and verify transactions in the platform.

Let us understand Hyperledger Indy using an example.

Let’s say Bob is required to apply for a job, and he needs an academic transcript for the same. Bob gets in touch with his university by creating a unique DID, Distributed Identifier using her public key. This DID verifiable by the trust anchors ascertaining that the request is indeed coming from Bob. If the trust anchors accept the transaction, then only a unique pairwise relationship is formed between Bob and the university. Hence Bob gets the academic transcript using this unique pairwise relationship using DID.

Bob applies for the job by creating a new DID with the company and produce his academic transcript. Again, a unique pairwise relationship is formed in this case because Bob doesn’t want his academic transcript to be leaked. Here the employer can verify the academic transcript with the university with Bob’s consent. But the information cannot be leaked with the same DID to some other employer or some other institution because the DID is already used, and Bob didn’t give his consent to share the information with anyone else. Trust anchors reject the transaction.

This is how unique pairwise relationships can be formed using DID’s and personal data can be protected without leaking the data with the owner’s consent.

Self-Sovereign Identity

A self-sovereign identity, i.e., a user should have complete control over his or her identity. If the user has self-control, then how to prove that the identity being shared is indeed true or not without any third-party intervention? Blockchain is the solution. A platform that is publicly available but individually confidential can be created with issuing authorities given permission to authenticate the identity.

Blockchain stores only cryptographic hash functions, and the concerned authorities can verify even without knowing that it is you who they are validating, they have to cross-check if they indeed issue the proof. If we have to submit an age proof, only age can be authenticated without giving away any other details. A project called Sovrin is already working on this type of identity management.

Blockchain is going to be the future for Identity Management. It has already been proven with the platforms described above.

Categories
Crypto Guides

Applications of Blockchain In The Publication industry

Introduction

The publication industry is again an age-old industry that is struggling to find its place in the digital world. Like many industries, the industry has turned towards blockchain to figure out a solution for their woes. Many people are switching to digital for their reading purposes, say it books, newspapers, journals, or anything of that kind.

Hence the publishing industry’s revenue model, traditional distribution, is just not working anymore. Thus, many content creators are turning to digital, but with a lot of piracy and free content available digitally, it has proved robust to generate money. Using smart contracts to publish and make money using blockchain is one viable option.

Problems grappling the publication industry

When we say publishing, for a lot of people, only newspapers and books may come into mind. But publishing is not just tagged to these two, any content like software, videogames, apps, songs that can be created and shared for consumption can be said as publishing.

⚫ Intellectual Property & Copyright Management

This is the first and foremost problem the publication industry is currently facing. No one wants to publish anything without involving money. Once the content is out, anyone can make copies of it and distribute stuff for a lesser price than the original content. Blockchain can quickly solve this issue if the material is published in blockchain. If this technology can do one thing for sure, that is, its capability to store who owns the data.

⚫ Production

Once the work is completed, many people will be involved in publishing the work, like Publication company, editors, design, marketing, management, etc. These days anyone can print a book on their own if required, but high-quality books aimed at right people with proper marketing still need big publication houses. Instead of following the centralized way, if the content is published and shared using blockchains before making it to the market, many freelancers can gain if different works like design, editing, and stuff can be shared through the platform.

⚫ Revenue Generation

Digital copies will generate money based on the traffic to a particular blog or website. Ads will increase if the traffic is more. The content creators will be paid accordingly. But, in reality, we are relying on and trusting the third-party channel on the payments. This is not working out for most of the content creators. Blockchain solves this issue by generating views using transactions. Every view can make a transaction costing the consumer for the view. Even the consumers will be happy to pay the actual content creators instead of duplicate providers.

⚫ There’s More

Apart from general problems, let’s talk about education journals. Many academic researchers, Ph.D. students, professors of the best universities have to contribute their work on their field of study in the form of some papers. Only then, they can climb the ladder and earn some fame for their work. These papers are published in very high-priced journals, which in turn don’t pay anything for the job, but the authors agree to give away their work for absolutely nothing because that’s the only way to get published.

Blockchain can create a platform for these academicians and help them get paid. Orvium is such a platform founded by former CERN and NASA employees. Reviewers of the work may charge for their services using the platform, as peer review is a must for academic publications. In turn, academicians can charge for their work to be viewed by the general public or can choose to make it completely free.

There are many startups in the publishing industry on the blockchain. Publica is for book ICO’s. Many publishers depend on the publication houses for advances when they have to start a book, but this platform allows the users to pay in advance in the form of some tokens where they will get their copies once the work is completed.

Blockchain can be used in the publishing industry in different ways as per the above for much-needed respite for the industry.

Categories
Crypto Guides

How Do ‘Ring Signatures’ Increase The Privacy Of A Crypto Network

Introduction

Cryptocurrencies are the primary application of blockchain. Transparency and Privacy are two terms that go side by side concerning cryptocurrencies. Users of cryptocurrencies are looking for more and more Privacy with more adaptability of cryptocurrencies. Anyone can open the bitcoin ledger and check the ongoing transactions and find out the users who are transacting and the amounts of the transactions as well. Hence to increase the Privacy of the cryptocurrency network, Ring Signatures have been introduced to cryptocurrencies.

What are Ring Signatures?

Ring signatures are nothing but digital signatures performed by anyone from a group of members but not possible to know who has done the signature. We can add any group of members without any additional setup. The concept was initially developed to leak the information, especially from high ranking individuals. This way, we will not know who leaked the news, but one can ascertain the information is authentic. The concept is developed by Ron Rivest, Adi Shamir, and Yael Tauman and announced at Asiacrypt in 2001.

Since then, there have been certain developments made in the ring signatures called traceable ring signatures to overcome vulnerabilities raised due to malicious or irresponsible people. The modification or further development of this is what is used in crypto note coins developed to overcome the weaknesses of bitcoin. By this development, the ring signatures were effective enough to obscure the sender’s information in the peer to peer transactions.

Now the concept is further developed called Ringed Confidential Transactions (Ring CT’s), which obscures the transaction amount as well instead of obscuring only the sender’s information. Monero Labs formally announced this in 2015. We all know that Privacy is strictly entitled when it comes to the transactions in the Monero platform, and now we know why, i.e., because of the concept of ring signatures.

How Do They Work?

Cryptocurrencies work on the principle of digital signatures. Ring signatures are digital signatures, which are group signatures. Ring signatures require multiple partial digital signatures of different users who may be part of the network already to form a single digital signature, which is used to sign the transaction. Thus, to validate the signature, multiple private keys are required, which wouldn’t be possible to obtain. The name ring came up because of the use of various users’ output to generate a single digital signature.

Let us see an example of a transaction in Monero blockchain and see how the concept of ring signature works.

⭕ A intends to send 50 coins to B in the Monero network basically to B’s Monero crypto wallet and initiates a transaction.

⭕ In general, this transaction would be signed using A’s private/public key combination, but in this case, a unique one time spend key is generated that starts with the output from the sender’s wallet.

⭕ The other signatures are picked up randomly from the users in the ring from the past outputs in the network to create a unique digital signature, which wouldn’t be possible to determine the original signer.

⭕ Even though the public key of the original sender is used, since the signature is created using different users’ previous outputs, it is not possible to determine the sender’s identity.

Ring signatures have started to become vital, especially where Privacy is a matter of concern in cryptocurrency networks. CryptoNote coins are the most well-known coins for Privacy. Monero and Bytecoins are excellent examples which use ring signatures and Ring CT’s.

Categories
Crypto Guides

Can we Improve Our Forecasting With The Help of Blockchain?

Introduction

Blockchain forecasting is something that is picking up momentum these days. We can use Blockchain for both demand forecasting as well as general views of the public, where polling used to be the case for decades now. One of the critical factors of cryptocurrencies is its unpredictability. It’s the reason for its popularity among the retail investors, but at the same institutional investors stay away due to the very reason. Hence using Blockchain for forecasting is a bit of irony, but it has started proving its mettle in the prediction as well.

Demand Forecasting

Creating a demand forecasting is being proved to be a really tough deal because of the quality of the data. At the enterprise level, demand forecasting is done mostly based on the old data. For example, due to the COVID19 situation worldwide, demand has been slumped to almost zero other than essential goods.

If we consider this data for next year’s forecast, we will be doomed with the figures that come as a result. Hence, we need quality data when it comes to demand forecasting. Many enterprises have different sets of data internally and externally as per their requirement for forecasting. Enterprises using ERP and CRM systems have the code inbuilt, and it would be very tough to change the logic as per the recent evolutions in the market.

When we take FMCG companies, each company have their own set of data, but they won’t share the data with other FMCG companies due to various constraints. If they come together on a blockchain platform and share only essential data leaving inventory, pricing, and other confidential details, it would be beneficial for the whole industry. The data should be immutable, permissioned so that only people with access can view it.

If we combine the blockchain technology with Artificial Intelligence and Machine Learning, we can extract more value from the data set. Using AI, we can know why the demand was deficient this time when we check the forecasting for next year. Alternately based on geographical conditions, weather, any external factors like elections period, if we input these fields demand that particular, region, or for a store can be easily predicted with these combined new technologies.

Predictive Data

Often during election times or with some programs as well, people or audiences of the program are asked questions to know the opinion of the people. Usually, a huge amount of data is received, which is a strength in numbers. One’s opinion on a given topic depends on the personal experience, prejudice, bias with the information available to them, which may be correct or wrong.

But what if the individuals have more data? With better quality and quantity of data, people might come up with more accurate predictions. Blockchains are, of course, made for collecting a large amount of data on a decentralized platform. Hence a blockchain prediction project can take multiple data points and come up with an accurate forecast on the input generally like prices would go up or down, consumption is likely to increase or decrease. Usually, precise predictions on what is going to happen next can be known.

Hence Blockchain is foraying into forecasting and gives more reliable forecasted figures when combined with AI/ML than any other forecasting model we have today.

Categories
Crypto Guides

Importance of ‘Interoperability’ In The Blockchain Technology

What Is Interoperability?

Interoperability is the ability of software systems or two different systems to connect and exchange information. In this connected world, there are always different systems that would connect so that the required data is provided as needed. The best example of interoperability can be termed as a web page working on a web browser if they are of the same standard.

Why do we need interoperability in blockchain?

In today’s world, we use different software, which essentially integrates to provide the resultant output. In the case of varying blockchain platforms are being developed for various purposes. Often in the same industrial space, different platforms are built, and these platforms do not know another platform.

For example, the bitcoin blockchain has no information about Ethereum blockchain. This creates a lot of siloes in the industry. Often new platforms come into picture claiming there more secure, scalable, immutable competing with the rivals. This creates a wastage in terms of resources, money, and energy of different teams.

Why is it crucial for blockchain?

To make mass adoption possible for blockchain technology. Every other platform is competing with each other to increase the scalability of blockchain. The original bitcoin blockchain was capable of sending only seven transactions per second. Later new projects came up and eventually achieved around 40,000 TPS. While Visa, Mastercard achieve approximately 24,000 TPS, but in reality, they need only 1700 TPS as per the real-world stats to be viable even with the ever-present demand.

Hence 40,000 TPS is not essential at all. Instead of concentrating on scalability, it would be better to consider improving the technology as such. Even if scalability is achieved as required in case of no interoperability, one cannot use the blockchain tech wherever needed as we use a MasterCard/visa as they can be used anywhere across the world. Hence interoperability is essential for blockchain for mass adoption.

Let us see some of the examples of platforms which allows the blockchain interoperability below:

Polkadot

Polkadot was developed by Gavin Wood, a co-founder of Ethereum. Polkadot is essentially a multichain or cross-chain technology that allows different blockchain platforms to be plugged into a more extensive system. Technically, Polkadot accomplishes parachains i.e., it will enable the processing of transactions parallelly between different blockchains and relays to the main blockchain through bridges. Polkadot not only transmits transactions between blockchains but also data is transferred. Information is transferred in the form of smart contracts and the abilities that come up with them.

Cosmos

Cosmos is just like Polkadot; it also follows a cross-chain principle. The essential difference between cosmos and Polkadot is that it only concentrates on facilitating transactions between blockchains but not data across them. Cosmos doesn’t require the blockchains to forfeit their consensus algorithm when plugged into the network. It establishes inter blockchain communication (IBC) to establish blockchain interoperability. The IBC serves as a TCP/IP like messaging protocol for blockchains.

Though these startups are at a very early stage of development in their roadmap, we have to wait and watch how it plays out. Blockchain is a niche technology, but many big players are coming into the picture to incorporate blockchain to achieve more success, and the interoperability of blockchain will make that. For any technology to gain momentum, adaptability is essential where interoperability is one thing to be achieved for the mass adaptability.

Categories
Crypto Guides

Understanding Merkle Tree & Its Importance In Blockchain

Introduction

Merkle tree is the essential component of a blockchain. Data entered into the blockchain is immutable, and this is a critical future of blockchain. Even though there are many futures, many deploy blockchain for this one significant future. This future is primarily achieved using the concept of a Merkle tree. Before dwelling into further about the idea, it is essential to understand cryptographic hash functions.

What are cryptographic hash functions?

Cryptographic hash functions are another integral part of blockchain technology. Cryptography is often used for military purposes. In war zones, the data is shared between two parties of a country at different places using cryptography.

Cryptographic hash functions are algorithms that transform any input given to the algorithm in the output of fixed length. The outputs change drastically, even if a single letter of the input is changed. At the same time, the same input gives the same output all the time. It is highly unlikely to determine the output based on the input unless one has a set of public/private keys. Any length of the input gives a fixed-length output; this feature is handy when a large amount of data sets is used. To check any set of data is modified or not, we can check the fixed-length hash.

Let us see the usage of cryptographic hash functions in the bitcoin blockchain network. Blockchain is essentially a series of blocks of transactions joined together using cryptographic hash functions. Each block has header data and transactions associated with it. Header data contains the previous hash, nonce, Merkle root, block hash.

Data of the complete block, including the header data, is hashed, and this hash is stored in the present block and also in the next block as the previous block hash. This previous block hash represents the entire state of the blockchain at any given point of time. Hence if we make any changes to the transactions in the last block, the hash of all the blocks up to the present block will be disturbed, which is why it is highly impossible to change the transactions and hence the concept of immutability.

Now how do we verify the hashes to check the data integrity? It is highly inefficient and time consuming to check the hash of every block. Hence the concept of Merkle tree is used as it is efficient to check the data integrity.

What is a Merkle tree, and how is it used?

Merkle tree developed by Ralph Merkle is also called a Binary hash tree. It is a data structure used to store hashes of individual data in an extensive data set in a way to make the verification of the date set efficient.

An example of the Merkle tree is as below.

It would be easy to understand the Merkle tree with the example above. It is essentially a tree of hashes with branches of individual hashes. These hashes come from the transactions of the blockchain platform when it comes to a cryptocurrency platform.

In the above figure, we have transactions from TA  represents a transaction, while HA represents a hash of that transaction. All the transactions are hashed to produce a hash value of its own transaction. Then adjacent transactions are hashed together to form a hash of both transactions. Like HAB is the hash of transactions A and B. If there are an odd number of transactions, then the transaction is combined by its own, and a hash value is created. The same process is repeated until the last hash value is generated, which is called the Merkle root. In this case, HABCDEFGH is the Merkle root of transactions from TA to TH. This is how a Merkle tree is formed.

Hence because of the tree, it would easy to find if any transactions are tampered with, uses very few resources to check any fraudulent behavior, and easy to add new transactions to the block.

This allows for simple payment verification, and the new nodes need not download the entire blockchain but only the block headers of the longest chain. Thus Merkle trees help to maintain the immutability and integrity of the blockchain.

Categories
Crypto Guides

How Blockchain Can Significantly Contribute To The Agriculture Industry

Introduction

Agriculture is the backbone of many countries. Often many countries export and import agricultural products based on their requirement. But when it comes to trade concerning agriculture till day age-old methods are used. It is often said that billions of dollars’ worth of food are wasted not because there are not people who want food but because food doesn’t reach their plates at the right time.

Why do we need Blockchain in Agriculture?

📌 Provenance Tracking

Big giants like Amazon, Walmart used to struggle to pick up any product from their shelves and know the provenance of the product. It might even take days to understand sometimes. Walmart had to recall an entire batch of pork in China as it was not able to find the whereabouts of the product, and the product was not in a condition to consume. This resulted in millions of dollars of loss.

📌 Supply Chain

Given COVID 19 situation worldwide, many industries are hit very severely. Out of all the industries hit, Restaurants/Dining out would be the worst hit since even after the lockdown is lifted, people wouldn’t be willing to dine out. To gain the trust of the customers that food is treated with utmost hygiene, one would like to know the whereabouts the food served. Hence supply chain plays a crucial role in the same. Accordingly, if the information of the product is stored in blockchain right from its origin, the trust could be gained quickly.

📌 Organic/Inorganic

It is easy to pass in organic food as organic these days. Blockchain helps to trace the origin of food.

How can we leverage Blockchain technology in Agriculture?

Farmers for either organic or inorganic food can deal with big players directly without the involvement of mediators. With the help of smart contracts and IoT sensors, right from the very initial stage of sowing the seeds to harvesting to sending the crops to the warehouses of the vendors, everything can be achieved using blockchain.

This way, the vendors will have a clear picture of where their goods are coming from, payments are made on time with no loss to the farmers. With the help of IoT sensors, the adequate temperature can be maintained for the goods which will be tracked through blockchain, ensuring the crops are not spoiled during transportation.

Companies leveraging this technology

🏭 Walmart, in partnership with IBM, developed Food Trust blockchain for tracking the provenance of food from different vendors. Walmart has asked all its vendors to get into their blockchain platform to do business with them to ensure the success of the Food Trust blockchain.

🏭 Coco-Cola built a blockchain platform to ensure ethical sugar production.

🏭 Tony’s Chocolonely – The chocolate industry is labor-intensive, and a lot of child labor is employed for the same. Cocoa farmers are impoverished as the cocoa beans supply chain is extremely complicated, and hence, they cannot decide the price for their beans. Thus, Tony’s Chocolonely has agreements directly with farmers and even pay 40% more since they know the provenance of their seeds.

🏭 Unilever (HUL) is working to check the provenance of tea in Malawi.

🏭 Dreyfus used blockchain to close a deal of Soya beans with a Chinese Supplier. The deal was finalized smoothly, cutting transaction time drastically.

Implementing blockchain in the agriculture domain is not easy. The technology should be combined with IoT for precise tracking along the supply chain. Big players though actively trying to engage the technology it takes time for the farmer to be benefitted from the same. Many platforms are being built from different players, and interoperability remains a concern. Thus it takes time to evolve to the requisite level to reap maximum benefits, but it is inevitable to use the tech in agriculture widely.

Categories
Crypto Guides

What’s Stopping Blockchain’s Mass Adoption?

Introduction

Blockchain technology came into the picture with the advent of cryptocurrencies. Since the value of cryptocurrencies is increasing exponentially day by day, people have started exploring its base technology, which is Blockchain. Blockchain has a lot of use cases in various industries say Supply chain, healthcare, agriculture, energy, data storage. In spite of all the use cases and numerous numbers of projects, consortiums in action today still the technology is considered to be nascent. Any technology takes time to reach masses, but Blockchain has certain hindrances that are stopping it from mass adoption. Let’s see some of them below.

No Universal Use Case

People often compare Blockchain as a new age internet. Just as the Internet changed the world forever, Blockchain is considered to do the same in the digital world. The Internet was created to provide information worldwide with the worldwide web. It created an industry for itself and reigned it. When it comes to Blockchain, it doesn’t have an industry of its own. It surely promises enough to revolutionize most of the existing sectors, but if there were one industry of its own, then the adoption and results would have been very promising. The combination of next-generation technologies, Artificial intelligence, machine learning, Blockchain, and the Internet of things may create an industry of its own that could be revolutionary.

Complicated Usage

The technology is quite complicated to use provided its secure nature. To perform a transaction in the bitcoin network, there should be an address with a string of numbers, wallets, transaction time, transaction fees, and a lot of stuff. All this terminology is pretty new to a novice user and finds it pretty challenging to use. Mass adoption will be possible only if we educate people enough. Most of the people know about Blockchain only through cryptocurrencies, and that notion should change. People should understand that Blockchain is much more than just cryptocurrencies.

Scalability

One of the significant issues with mass adoption is scalability, i.e., the number of transactions per second (TPS). When we take cryptocurrencies, the original bitcoin blockchain processed only 7 TPS. As the adoption of cryptocurrencies increased, processing time and transaction fees increased drastically, which will discourage people from using cryptocurrencies. Visa/Mastercard supports 24000 TPS, which is used worldwide and is very reliable. Even though some platforms are claiming 40000 TPS, we should check whether they are safe enough or not.

Standardization of Smart Contracts

Smart contracts have received popularity, and many enterprises have started using the same for their business needs. But there is no standardization, and there are a lot of vulnerabilities when it comes to smart contracts. The code is not standard. There is a scope for a lot of vulnerabilities. Hence if certain standards are established like formal verification of contracts to check vulnerabilities, the security of the system increases more.

Energy Consumption Issues

It is a well-known fact that proof of work, which is mainly used in bitcoin blockchain as of today, consumes a lot of energy. Environmentalists throughout the world are entirely against it. Hence the usage of energy friendly consensus algorithms like proof of stake should be used if mass adoption is to be made. Recently Ethereum has shifted to proof of stake from proof of work, which is a welcome move.

Regulation by Governments

Finally, governments should agree or accept the trade, registrations, or any legal matter of the sort to be done in blockchain platforms. As per the government rules, if certain transactions should be done only on paper, then it is not possible to use Blockchain. Governments across the world are at least trying to regularize cryptocurrency, considering the widespread usage. Hence, technology use in other aspects should also be considered.

These are some of the reasons that are holding back the mass adoption of this amazing technology. It is important to note that there is a lot of research and development being done in this space to overcome the above-mentioned hurdles.

Categories
Forex Basic Strategies

Best Way To Trade The ‘Pin Bar’ Forex Chart Pattern – The Pin Bar Reversal Strategy!

Introduction

Price action or Candlestick analysis combined with some of the factors and confirmations is more reliable as they work out even without using too many indicators on the price chart. Using many indicators on the charts makes it difficult for traders to see the bigger picture (opportunities) in the market. We have numerous candlestick patterns in trading, but there are few on which many traders have their eyes on. One of those is the Pin bar candlestick pattern.

The pin bar candle is mostly used as a reversal pattern. A pin bar typically consists of a price bar with a long wick or shadow. The region between the open and close of the pin bar is called its real body, and a long tail is known as the wick. Pin bars generally have small real bodies in comparison to their long wick. The body of the pin bar is one-third of the total size of the candle. The long wicks of the candle show the area of the price that was rejected and signifies that the price will now move in the opposite direction of the wick.

The psychology behind trading a pin bar candle is that when a price is moving in one direction and reaches significant support or resistance level, it gets rejections. Rejection in a downtrend signifies that the seller pressure (supply) in the market is decreasing, and the buyer pressure (demand) has started increasing and vice versa. The pin bar, either bullish or bearish, signifies that the price does not want to go more down or up and want to reverse from that strong support or resistance level.

Understanding The Bullish & Bearish Pin Bars

Every time a pin bar candle occurring at a strong level does not always mean that the market is going to reverse from that level. To make this valuable, we must see that the overall picture and not just a single candle. In this trading strategy, we will see how we can analyze the overall market near that confluence level. Before that, let’s understand the two types of pin bar candlestick patterns.

Bullish Pin Bar Reversal Pattern

The bullish pin bar candle occurs when the price comes near a strong support level; this leads to the formation of a long wick of the pin bar and shows rejection from that level. This candle usually forms at the end of a downtrend and signifies that there can be either a short-term uptrend or a full reversal forming a strong uptrend.

Bearish Pin Bar Reversal Pattern

The bearish pin bar candle occurs when the price comes near a strong resistance level; this leads to the formation of a long wick of the pin bar and shows rejection from that level. This candle usually forms at the end of an uptrend and signifies that there can be either a short-term downtrend or a full reversal forming a strong downtrend.

Trading Strategies

Pairing The Pin Bar candles With Support & Resistance Levels

As already mentioned, just finding a pin bar candle at the support and resistance level is just not sufficient to trade. We have to figure out what the market is exactly trying to show us. When we see the candles approaching a strong support or resistance level, we have to analyze all the previous candles carefully. If the candles are very big and the momentum is very high, it is less likely to bounce back from that particular level. So, what we have to do is carefully track the candles with wicks. Candles with wicks show that the particular trend momentum is getting weak, and the pressure is reducing as the level is approaching.

After we see candles with wicks and some weaker candles, we will wait for our pin bar candle. As soon as we see the pin bar candle, we have to wait for the next candle to close above the pin bar’s high. We can then buy or sell in the market and place our stop loss 2-3 pips below the pin bar’s low.

In the below USDCAD 1Hr chart, we can see that the market touches the support level 3 times, the first time the candle was a long and strong bearish candle, and so we must take trades as the picture is still not clear. The second time when the market reaches the support, we see the candles have small bodies and more wicks. This tells us that the seller pressure is decreasing. Finally, for the third time, the market started getting rejections even before touching the support level, and we can also see so many long wicks in the candles. Finally, we see a pin bar candle touching the support level and getting the rejection, and then we see so good bullish momentum.

Below is the chart of USDCAD 1hr, market getting a rejection from the resistance level.

Pin Bar Pattern + Bollinger Bands

We are already familiar with one of the famous indicator called the Bollinger band that is used to measure the volatility of the market. We will now use a pin bar with the Bollinger band and understand how we can find some good trades opportunities.

The below chart is USDCAD 1Hr time frame over here. We can see that the market has not pierced the lower band since a long time as mostly the price is between the upper and the lower band. Moving forward, when the candles come close to the lower band, we see a pin bar occurring after the market gets rejection. After the formation of a pin bar candle, we can see the market getting the buying momentum, and it becomes bullish.

Trading With The Confluence Level

As from the above strategies, we are clear how the market behaves when a pin bar occurs at strong support and resistance level and the extreme level of Bollinger band. Now we will see what happens when a pin bar occurs at confluence level. A confluence level is an area that is on the radar of many traders, and many technical indicators generate the same signal. This trading concept is used by price action traders to filter their entry points and spot high probability signals in the market.

The below example is the pin bar forming at the extreme lower band and a strong support level. We can see that as the market reaches the support level, the bodies of the candles get weaker and smaller, forming longer wicks. Also, the pin bar pierces the lower band near that support level giving us a better signal for a buy.

Talking about the entry and exit points, our entry will be the point when the next candle crosses the high of the pin bar candle. As we see, it is a bullish pin bar; we can be sure that our entry is good if it crosses the high with good momentum. Our exit here will be the next strong resistance level. If you use a trailing stop loss, then we can move the stop loss to breakeven and be in the trade as long as you see the higher high higher low as, after a trend reversal, the candles move very fast and gives more profit and risk to reward ratio.

Conclusion

Trading with a pin bar candle has been proven to be one of the most effective trading strategies. As we saw, we must have a watch on all the candles when it approaches a confluence level because a single candlestick will not give us much information about what market is going to do next. The reliability of these candles is more with the higher time frame as it omits the noises on the chart, and we can have a clear picture. If you are a day trader, then you can 30min or 1hr time frame for executing the trade. Cheers!

Categories
Forex Basic Strategies

Profiting From The Rounding Top & Rounding Bottom Forex Pattern.

Introduction

The Rounding Top and Rounding Bottom are two of the most famous trend reversal patterns in the Forex trading industry. These patterns are mostly used to catch the end of a trend in both bullish and bearish markets. These patterns are extremely reliable as they are back-tested rigorously by a number of professional technical traders. Learning the trading of these patterns introduces us to a lot of trading opportunities while riding a brand new trend. Always remember that the Rounding top pattern appears at the top of an uptrend, and the Rounding Bottom pattern appears at the bottom of a downtrend.

Rounding Top

The Rounding Top pattern appears to be in the form of an inverted ‘U’ shape. Hence it is also referred to as an ‘Inverse Saucer.’ This pattern resembles the Double Top chart pattern but a bit more complex than that. Most of the time, the Rounding Top appears at the major resistance level on a price chart. This pattern has three major components – A rounding shape where the price action fails to print a higher high, a taper off, and the beginning of the lower trend.

Rounding Bottom 

The Rounding Bottom is a bearish reversal chart pattern, and it appears at the end of a downtrend, indicating a long term reversal in the price action. This pattern resembles the Cup and Handle pattern, but it doesn’t go through the temporary downward trend of the handle portion. This pattern can be found at the major support area in any trading timeframe. Just like the Rounding Top, this pattern also has three major components –  The Rounding Shape, where the price action fails to print a brand new lower low, taper off, and the beginning of an uptrend.

Trading The Rounding Top Pattern

The below CAD/CHF charts represents the formation of a Rounding Top pattern in this Forex pair.

We had decided to go short as soon as the pattern is confirmed when the price reached the neckline. The bear candles on the price chart were stronger than the bull candles indicating the gaining strength of sellers in the market. The sell trade is activated when the price goes below the neckline. Stop-loss is placed just above the region where the pattern is formed.

After activating the trade, price action didn’t blast to the south immediately. Instead, it pulled back to buy-side, before eventually going down. In this kind of situation, most of the traders doubt their strategy and exit their positions because of fear. But since our analysis is strong enough, it is a good idea to hold our positions and wait for the price to move in our direction.

Trading The Rounding Bottom Pattern

The below EUR/USD, 240 Minutes chart, represents the formation of the Rounding Bottom pattern on the price chart. We can see the market being in a downtrend when the Rounding Bottom pattern is formed. This is a clear indication for us to understand that the bears are losing momentum, and bulls are about to take over the market. We took a buy-entry when the price went above the neckline. The take-profit was placed at the higher timeframe’s significant resistance area.

Rounding Top Pattern + RSI Indicator

In this strategy, we have paired the Rounding Top pattern with the RSI indicator to identify accurate trading signals. As we all know, the RSI is a momentum indicator that measures the magnitude of the price change. RSI stands for Relative Strength Index, and it is developed, J. Welles Welder.

This indicator oscillates between the 0 and 100 levels. When RSI reaches the 70 level, it indicates overbought market conditions, and we must expect a downside reversal. Likewise, when it reaches the 30 level, it indicates the oversold conditions, and we must expect a buy-side reversal.

The strategy is simple –  Identify the Rounding Top pattern and see if the price action is going below the neckline. If yes, check where the RSI indicator is. If it is in the overbought area, it is a clear indication for us to go short.

The below price chart represents the formation of the Rounding Top pattern on the EUR/CHF Forex pair.

In the below chart, we can see the price going below the neckline. At the same time, RSI gave a reversal at the overbought area, indicating us to go short in this pair. We have activated the trade at the neckline, and the stop-loss placement was above the most recent higher low. We had closed our positions when the price action started to struggle at the Bottom.

Rounding Bottom Pattern + RSI Indicator

The below chart represents the formation of the Rounding Bottom pattern on the NZD/CAD Forex pair.

We had gone long when the price broke the neckline, and the RSI gave a reversal at the oversold area. As you can see in the chart below, right after our buy activation, the price smoothly blasted to the north. We booked our whole profits when the price reached a significant resistance area. Stop-loss was just below our entry as the neckline acts as a strong support to the price action.

Conclusion

The Rounding Top and Bottom are bullish and bearish reversal patterns that are used to identify the end of an ongoing trend. You need to know that you must wait for the breakout of the neckline to take long or short positions according to the pattern formed. The stop-loss can be placed above the neckline when trading the Rounding Top and below the neckline when trading the Rounding Bottom pattern.

The take-profit must be equal to the size of the pattern formed, and if the trend is strong enough, consider going for deeper targets. Overall, these patterns are quite popular and easy to spot on the price chart. Practice trading these patterns using a trading simulator or a demo account before applying these strategies on live accounts.

We hope you find these strategies informative. If you have any questions, make sure to let us know in the comments below. Cheers.

Categories
Forex Course

117. How to Trade the ‘Head and Shoulders’ Forex Chart Pattern?

Introduction

The Head and Shoulders formation is a popular Forex chart pattern, which is pretty easy to recognize on the price charts. There are both bullish and bearish Head and Shoulders patterns, and both indicate potential market reversals. This pattern consists of three peaks, which is developed after a strong bullish trend. The first and third peaks are of the same height, and they are classified as shoulders. The second peak of the pattern is the highest and hence classified as the head.

There are both bullish and bearish Head and Shoulder patterns. The appearance of bullish Head and Shoulder pattern on the price chart indicates that the momentum is transferring from the sellers to buyers. Likewise, the appearance of the Bearish Head and Shoulder pattern indicates the momentum is transferring from the buyers to sellers. While trading the Bearish Head and Shoulders pattern, it is advisable to go short when the price breaks below the neckline. Contrarily, go long when the price goes above the neckline while trading the Bullish pattern.

How To Trade The Head And Shoulders Pattern?

It is advisable not to wait for the perfect pattern instead look for the good entry/exits when you spot the pattern on the price chart. Sometimes the left shoulder will be bigger than the right shoulder and vice-versa. Please do not focus on minute details. Instead, our focus must be on deciding if the pattern looks reliable enough to trade or not. If the answer is yes, only then take entries.

Trading The Bearish Head And Shoulders Pattern

The below chart represents the formation of the Head and Shoulder pattern on the NZD/JPY forex pair.

As you can see, in the below NZD/JPY chart, the formation of the pattern doesn’t look perfect, but the overall pattern looks reliable to trade. We went short as soon as the price action broke below the neckline. The stop-loss order was placed above the second shoulder. For TP, we went double the size of the pattern. We had exited the market when the price got consolidated, as it implies the opposite party is gaining strength.

Trading The Bullish Head And Shoulders Pattern

In the below chart, we have identified the Bullish Head and Shoulder pattern in the EUR/CHF Forex pair.

In a choppy downtrend, a bullish Head and Shoulder pattern is formed. When the price goes above the neckline, it is an indication for us to go long. The take-profit is again placed two times the size of the pattern, and the stop-loss is just below the second shoulder.

In the above chart, we can clearly see that the Bullish Head and Shoulder pattern is not perfect, like the ones we see in textbooks. But still, our trade worked beautifully. So it is crucial to bends our rules here and there; we will hardly find such kind of perfect patterns. If we just wait for them, we will hardly get to trade. Also, once you gain some experience in trading this pattern, you will automatically be able to decide which pattern works and which will not. Mastering any pattern requires tons of practice and patience.

That’s about identifying and trading the Head and Shoulders pattern. Advanced strategies related to this pattern can be found in our trading strategies section. Please feel free to explore. Cheers!

[wp_quiz id=”73064″]
Categories
Forex Assets

Costs Involved While Trading The ‘AUD/PLN’ Exotic Pair

Introduction

The expansion of AUD/PLN is the Australian Dollar and Polish Zloty. Here, AUD is the official currency of Australia, and it is the fifth most traded currency in the Forex market. Hence, it is considered as a major currency. In contrast, the PLN (Polish złoty) is thinly traded, and it is the official currency of Poland.

Understanding AUD/PLN

In AUD/PLN currency pairs, the first currency (AUD) is considered the base currency, and the second (PLN) is considered the quote currency. In the foreign exchange market, we always buy the base currency and simultaneously sell the quote currency and vice versa. The market value of AUD/PLN helps us to understand the strength of PLN against the AUD. If the exchange rate of AUD/PLN is 2.7427, it means that we need 2.7427 PLN to buy 1 AUD.

Spread

In Forex, spreads are inevitable, and it is mainly controlled by the broker. Forex brokers have two prices for currency pairs: the bid and ask price. The bid is the price at which we sell an asset, and ask is the price at which we buy it. The difference between the ask price and the bid price is called the spread. Below are the ECN & STP spread values for AUD/PLN Forex pair.

ECN: 17 pips | STP: 20 pips

Fees & Slippage

A fee in Forex is the charges we pay to the broker for opening a trade. Mostly, these fees depend on the type of broker (STP/ECN) we use.

There are times when we want to execute a trade at a particular price, but instead, we end up executing it at a different price. This happens because of slippage. Slippage can take place at any time, but mostly it occurs, we can counter a volatile market.

Trading Range in AUD/PLN

As a trader, we must be aware of the risks involved before entering any trade. The trading range here will guide us about the amount of money we will win or lose in a given amount of time. In the below table, we have the representation of the minimum, average, and maximum pip movement in a currency pair. We will evaluate it by using the ATR indicator combined with 200-period SMA.

Procedure to assess Pip Ranges

  1. Add the ATR indicator to your chart
  2. Set the period to 1
  3. Add a 200-period SMA to this indicator
  4. Shrink the chart so you can assess a significant period
  5. Select your desired timeframe
  6. Measure the floor level and set this value as the min
  7. Measure the level of the 200-period SMA and set this as the average
  8. Measure the peak levels and set this as Max.

AUD/PLN Cost as a Percent of the Trading Range

The cost of trade depends on the broker type and varies based on the volatility of the market. The total cost of trade involves spread, fees, and sometimes slippage if the volatility is more.

ECN Model Account

Spread = 17 | Slippage = 3 |Trading fee = 5

Total cost = Slippage + Spread + Trading Fee = 3 + 17 + 5 = 25

STP Model Account

Spread = 20| Slippage = 3 | Trading fee = 0

Total cost = Slippage + Spread + Trading Fee = 3 + 20 + 0 = 23

Trading the AUD/PLN

AUD/PLN is an exotic currency pair that is rarely traded in the Forex exchange market. The average pip movement in 1hr is 63 pips, and that shows the volatility is at medium range.

Note – The higher the volatility, the higher is the risk, and the lower is the cost of the trade and vice versa. Taking an example, we can see from the trading range when the pip movement is more, the cost is low, and when the pip movement is low, the cost is high.

To reduce our trading costs, we may place trades using limit orders instead of market orders. In doing so, the slippage will not be included in the calculation of the total costs. This greatly helps us in reducing the overall cost of the trade. An example of the same is given below. In the below table, we can see how the trading costs have reduced comparatively.

ECN Model Account (But by using Limit Orders)

Spread = 17 | Slippage = 0 |Trading fee = 5

Total cost = Slippage + Spread + Trading Fee = 0 + 17 + 5 = 22

Categories
Forex Course

119. Learning To Trade The Wedge Chart Pattern

Introduction

The Wedge is a technical chart pattern that is commonly used by the traders, market technicians and chartists to find the upcoming market trend. This pattern is always formed at the bottom/top of the trend, indicating a potential change in the market’s direction. In short, the Wedge is a trend reversal pattern. One key benefit of the Wedge pattern is they it is comparatively easy to identify on the price charts. This pattern is traded by most of the technical traders as it provides precise entries and exits.

There are two types of Wedge patterns – The Rising Wedge & the Falling Wedge.

The Rising Wedge

The Rising Wedge is a bearish reversal pattern, and it appears in an uptrend. This pattern seems to look wide at the bottom and contracts as the price move higher. To form a Rising Wedge pattern, two higher highs must touch the upper line; likewise, two reaction lows to the lower line. The point at which the upper and lower lines merge indicates the completion of the pattern.

The Falling Wedge

This pattern is just opposite to the Rising Wedge pattern. It appears in an ongoing downtrend, and it is a bullish reversal pattern. The appearance of these patterns is an indication for us to go long. This pattern begins wide at the top and contracts as the price moves lower. To form this pattern, the two lower lows must react with the support line, and the two higher lows must react with the resistance line. When both the lines converge, we can say that the pattern is complete.

Trading The Wedge Chart Pattern

The Rising Wedge 

The below chart represents the formation of a Rising Wedge chart pattern on the GBP/CAD Forex pair.

There are two ways to trade the Rising Wedge pattern. We can go short when the price hits the upper resistance line, and if the price breaks the below line, holding our positions for longer targets is a wise thing to do. The second and the conventional way is to wait for the price action to break below the support line and take the sell position only after the confirmation.

In the example below, we took sell entry when the price action broke the support line. Place the stop-loss just above the recent high and ride the markets for deeper targets. We had booked our profits when the price action started to struggle as it is an indication of a market reversal soon.

The Falling Wedge Pattern

The image chart represents the formation of the Falling Wedge pattern in the GBP/NZD Forex pair. We can see that both the parties were fighting in a downtrend and when the market prints a Falling Wedge pattern, it is an indication for us to go long.

At the beginning of March, the price broke above the Falling Wedge pattern, and we end up entering for a buy. The stop-loss was placed just below the support line, and the take profit was at the major resistance area.

That’s about Raising & Falling Wedge pattern and how to trade them. If you have any questions, please let us know in the comments below. Also, to learn advanced trading strategies related to this pattern, you can follow this link. Cheers.

[wp_quiz id=”74092″]
Categories
Forex Course

118. Using Rectangle Chart Patterns to Trade Breakouts

Introduction

The Rectangle is a technical chart pattern that is described by two horizontal lines acting like potential support and resistance levels on the price chart. Trading this pattern is similar to buying at the support and selling at the resistance level. Conventional traders can trade this pattern only after the appearance of the breakout.

The Rectangle represents a trading range, which indicates the fight between the two parties – buyers & sellers. As the price reaches the support level, buyers step in and push the price higher. And when the price reaches the resistance level, bears take over and force the price lower.

In this fight, one party will eventually get exhausted, and the winner will emerge when the price breaks out in any direction. So we can say that the Rectangle is a neutral pattern as either trend continuation or reversals may happen after the formation of this pattern.

Rectangle Chart Pattern – Trading Strategies

Buy Example

The below chart represents the formation of a Rectangle pattern in the GBP/CAD pair.

As we can see in the below chart, the market just started its uptrend, and during the pullback, it turned into the consolidation phase forming a range. This consolidation phase eventually forms the Rectangle pattern.

This pattern is very easy to spot and trade. We can wait for the pattern to break the range to enter the market. If you are an active trader, you can even take a couple of buy/sell trades in a lower timeframe. In the example shown below, we have decided to go long as soon as the price action broke the pattern from the upside. The stop-loss order is placed just below the Rectangle, and the take-profit is at the recent high.

Sell Example

The image below represents the formation of a Rectangle pattern in a downtrend.

The below chart represents the entry, exit, and the placement of stop-loss & take-profit orders in the GBP/NZD Forex pair. In an ongoing downtrend, when the prices reached the significant support zone, it started to hold. The sideways movement of the price shows that both the parties are super strong, and the breakout to any side will be a good trade.

After the battle, prices broke towards the downside, which is a clear indication for us to go short. The stop-loss order is placed just above the pattern. Because, in a downtrend, if the price breaks the Rectangle pattern’s resistance, it must be considered invalid. Hence there is no need to go for deeper stop-loss. We would always recommend placing the stops just above or at least at the same height as the pattern.

For booking profits, we didn’t choose any specific location. Instead, we were watching the price action keenly and chose to close our full positions when the sellers started to die. We can close our positions in different ways, depending on the market situation. For instance, we can exit the trade when prices approach the significant support area. We can even take the help of technical indicators to close our positions. Technical traders are also using price action techniques these days to exit their running positions.

That’s about the Rectangle chart pattern and how to trade it. If you have any queries, let us know in the comments below. Cheers.

[wp_quiz id=”73928″]
Categories
Forex Course

116. Trading The Ascending & Descending Triangle Chart Patterns

Introduction

The Triangle Chart pattern is one of the most frequently found Forex patterns on the price charts. Technical traders prefer trading this pattern as it provides greater insight into the future price movement and the upcoming resumption of the current trend. This is a consolidation pattern that occurs in the midway of the trend, and it signals the continuation of the existing trend.

The Triangle pattern is formed between the two converging trend lines as the price temporarily moves into a small range. We must wait for the breakout to happen in an existing trend to take a trade. There are three types of Triangle chart patterns, and they are the Ascending Triangle, Descending Triangle, and The Symmetrical Triangle.

Ascending Triangle

It typically appears in a bullish trend. When the price action breaks the upper horizontal trend line with increased volume, it indicates a buy signal.

Descending Triangle

It is a bearish continuation pattern, and it appears in a downtrend. When the price action breaks the lower horizontal trend line with increased volume, it implies that the original sellers are back in the show, and it is an indication for us to go short.

Symmetrical Triangle

It is composed of diagonally falling upper trend line and diagonally rising lower trend line. When the price action reaches the apex, the price can break out from any side. We must be taking our positions depending on the price momentum and strength.

How To Trade The Triangle Chart Pattern?

Trading The Bullish or Ascending Triangle Pattern

The below chart represents the formation of an Ascending Triangle chart pattern in the AUD/NZD forex pair.

In the below Ascending Triangle pattern, we can see that both buyers and sellers are super strong. When the buyers break above the resistance line, it indicates that the game is finally in the hand of buyers. Hence, this is the perfect time to go long. The stop-loss was placed just below the pattern, and we book the profit when price action reached the previous significant high.

Trading The Bearish or Descending Triangle Pattern

The below chart represents the formation of a Descending Triangle chart pattern in the GBP/NZD Forex pair.

As we can see in the below chart, the pair was in an overall downtrend. When the price action reached a significant support area, the market started to move in a range. This range eventually has turned into a Descending Triangle chart pattern. As discussed, this pattern indicates that buyers and sellers are aggressive in taking the lead.

But the breakdown towards the sell side shows that the sellers have finally won the battle. We have placed the sell order right after the breakout, and stop-loss was placed just above the recent higher low. You can observe from the below chart that after going short, the price action started to move smoothly in our direction. We have closed our entire position when the price is started to struggle going down.

That’s about Ascending and Descending Triangle chart patterns. There are many strategies we can use to maximize profits while trading this pattern, and they can be found in the Basic Strategies section. All the best.

[wp_quiz id=”72812″]
Categories
Crypto Guides

Exploring The New Suite Features Of ‘CryptoNote’ Technology

Introduction

CryptoNote is an open-source protocol that essentially serves as an underlying technology for some cryptocurrency. Just like Blockchain technology, CryptoNote is also technology that is a backend for cryptocurrencies.

CryptoNote technology was primarily developed to provide extremely private features using advanced cryptography. What makes it unique is the egalitarian approach for making the network decentralized and censorship-resistance.

Origin of CryptoNote

The CryptoNote has had a history similar to that of Bitcoin, in terms of being mysterious. It emerged in 2012 and was published on Tor, and the author of the original whitepaper Nicolas Van Saberhagen is a pseudonym, which means that the identity of the author is still unknown. In fact, the identity of the author of the second edition of the whitepaper is also under the same pseudonym.

The original whitepaper discussed the privacy and flexibility that is deficient in Bitcoin. It also sheds light on the traceability and linking ability of transactions in Bitcoin’s “one-CPU-one-vote,” as explained by the creator of Bitcoin Satoshi Nakamoto. On the whitepaper, they claim to present more advanced features for decentralized cryptocurrency networks that are based on complicated mathematical analysis.

Entering the CryptoNote Technology

The CryptNote technology is similar to the blockchain technology, with few key differences. This technology is built under consideration of two features that make the payment network through this system fully anonymous. They are,

                        Untraceability & Unlinkability

Untraceability – For all the incoming transactions from the network, every sender is equally probable at the origin.

Unlinkability – A property where it is not possible to verify that two outgoing transactions are sent to one particular person.

When the proposal to launch the technology was made, there were many optimizations and improvements made to keep their technology stand apart from the crowd and hold its original principles along the way. The standard features that should be embedded in such technology are implemented as well. The following are the primary features CryptoNote has to offer.

  • Untraceability of payments
  • Unlinkability of Transactions
  • No Double-Spending
  • Blockchain Analysis Resistance
  • Egalitarian PoW

Cryptocurrencies backed by CryptoNote

There are several coins that are implemented using CryptoNote technology. All of the coins have this technology in them in some or the other way. In fact, there are even optimizations made to the current features that are then added to the cryptocurrency.

Bytecoin

Bytecoin is the first cryptocurrency that was created using CryptoNote technology in 2012. Being the first one, it was quite popular back then. This coin includes the exclusive CryptoNight mining algorithm along with the typical features of CryptoNote. Bytecoin was mainly developed to facilitate instant transactions with no fee for businesses, merchants, and customers in the inclusion of security, anonymity, and fast international payments.

Monero

Monero has been one of the most popular cryptocurrency when it comes to privacy. This open-source protocol and decentralized network community are highly dedicated to making Monero a powerful anonymous payment method. And not to mention, this coin is created under the assistance of CryptoNote.

Conclusion

Over the years, people are not completely satisfied with the features provided by the blockchain. Their focus has been on finding inefficiencies in this technology and coming up with other technologies satisfying those inefficiencies. And CryptoNote is one such technology that emphasizes on anonymity in cryptocurrency networks. This is a very broad property and will remain in development for long.

Categories
Crypto Guides

Understanding Market Speculations In The Cryptocurrency Market

Introduction

Market speculation is a term that can put you in a bad light if discussed with a casual investor. People often relate speculation to the irresponsible behavior of the banks and financial institutions. To a layman, this term is nothing but a synonym for gambling. The only difference being, in gambling, personal money is used, not investor money.

The concept of speculation is misunderstood by many. Agreed that investing is all about balancing the risk to reward ratio, but speculation is no different. It is an anticipation that the risk on the investment is going to be well worth the risk. In this article, we shall be clearly understanding the concept of market speculation and determine if it is evil to the cryptocurrency market.

What is Speculation?

Trading and investing involve the managing of risk and return. Speculation is that space that fits in the area opposite of guaranteed investors, like bonds and other safe havens. Be it any type of investment; there involves risk. The risk cannot be completely eliminated but surely be reduced. Typically, an investment with low-risk yields low returns. Similarly, investments with relatively high risk, the payout is equally high. And speculation work with the latter principle.

Myth – Speculation is Gambling

There are still a lot with the conception that speculation is no different from gambling. Gambling could involve some skill elements but certainly cannot cut off the risk on it. It is basically like a game of dice. Considering the die to be unbiased, the probability of a predicted number coming up always remains 1/6. Speculation, on the other hand, involves high research in the background, where the speculator studies and analyses all the risks involved in it, and then take actions accordingly. Also, when they bet on something involving high risk, they try making sure that the odds are in their favor.

Cryptocurrency Speculation

Cryptocurrency speculation is mostly inclined towards Bitcoin as it was the first cryptocurrency in the market. Back then, only a handful of people predicted the exponential rise of Bitcoin from a few cents to thousands of dollars. However, there was a good number of investors who made a fortune off this move. In the ocean of investors, there are the ones who anticipate a high return from a small investment, in short, the speculators.

Cryptocurrencies are those that seem like they are specifically made for speculative purposes. And these cryptocurrencies are unlike the tulip bulbs of old that would turn out to be a scam. Bitcoin, for example, is a cryptocurrency known for its security and trust as it backed up blockchain technology. Since the cryptocurrency market is fresh and new relative to others, speculators can consider it a great opportunity to bet on their chosen coins.

Conclusion

Market speculators from the very beginning have earned a bad name. This misconception is still in the air. As a trader/investor, you have to be conservative, but it does not mean you cannot be a risk-taker. Taking risks during the right times and on the right securities can turn out to be a moneymaker. And this is what successful are onto.

Categories
Crypto Guides

Cryptocurrency Inheritance – What Happens To Your Cryptos When You Die?

Introduction

Ever imagined what would happen to your cryptocurrency when you die? In the case of land or property, it typically goes to the person’s children or to the ones mentioned by them. And all this happens legally with proper documentation. But it does not work the same way with a person’s cryptocurrency.

In cryptocurrencies, inheritance does exist but is pretty different from the regulated ones. Now, let’s understand the inheritance in cryptos keeping in the sense of the decentralization and anonymous nature of cryptocurrencies.

Though cryptocurrencies are not regulated officially, it does not mean you can let go off the unused coins. They do have value in themselves, and also if converted to fiat currencies. According to estimates, Bitcoins worth $20 billion is already lost and not in use. This could be due to negligence or the death of the owner without anyone’s knowledge that the person had coins in their portfolio.

Furthermore, a Reddit user created a spreadsheet accounting the wallet addresses, which were inactive since the time each Bitcoin was worth below $10. And in 2015, there were more than 3 million Bitcoins that were left untouched.

Ways to Not Let Cryptocurrency Unused

Dead Man’s Switch

In the case of cryptos, there exists a computer program that emails you at specific intervals and waits for your reply. If the program does not receive any reply from the sent email, it then automatically checks for death certificates of the account holder. If it finds such a record and does not receive any email, the program will transfer the coins in the wallet to the specified wallet mentioned by the account holder during the time of set up.

However, there is a downside to it. Even though it is helpful in cryptocurrency inheritance, there can be a scenario when an alive user does not reply to an email, and the computer protocol transfers away from the cryptocurrency to the specified address.

Doing the Traditional Way

This is a technique that does not require any kind of computer technology. This is the simplest inheritance issue where the user writes down all the wallet credentials and hands it over to their beneficiary. The credentials may contain the private key, exchange login detail, and the fiat currency accounts associated with it.

However, storing all the information in one place may not be the ideal option. It could turn out to be a very high price paid just for the convenience. Finally, it all drops down to trust. There must be trust between the account holder and the beneficiary. This is because the beneficiary could tamper with the credentials even before the death of the user. Hence, users must be choosy before handing over the details.

Conclusion

There are several ways to ensure that your coins are not buried with you and are handed over to your loved ones. But, with all of them, there exists a downside to it, which makes you think again on handing away the coins to someone. This has made cryptocurrency inheritance still tricky to deal with.

Categories
Crypto Guides

Usage Of Cryptocurrency In The Gig Economy

Introduction

The global workspace has considerably been changing and evolving. For example, the replacement of automated machines has helped corporations reduce costs on jobs. Back then, people had the idea of staying and working in a single workplace. But, in the younger generation, the idea of moving from one job to another is normal.

Then comes the gig economy that is growing at a great pace. In fact, it has even become the main source of income for many people across the world. And all of this has been made possible by the internet’s feature to connect remote workers with their employers.

In 2018, over one-third of the Europeans and Americans are involved in the gig economy. Presently, the numbers have almost risen to 50%, which has led to pressure in the existing economy to keep up with this rise.

Payment System in Gig Economy

In freelancing, the payment services are quite different from the traditional system. Most freelancers get paid through online digital payment services like PayPal. Before this, people relied on paychecks. But the launch of PayPal has made a great impact on the payment system, especially in the freelancing space.

However, there is a downside to it. For making payments via PayPal, the fee is around 4%, which certainly unreliable for continual large-scale use. Many digital payment providers like PayPal are available, but their charges are still not reasonable for freelancers.

But well, it doesn’t end there. This is when blockchain and cryptocurrencies make their way into the gig economy. Let’s find out how.

Cryptocurrency in Gig Economy

Cryptocurrencies can significantly affect the transaction system in the freelancing field. There are two features cryptocurrencies have to offer that could help ease the payments.

They are - Extremely less transaction fee & Rapid transaction confirmation

These two features, happening to be the most important factors in a transaction, is unavailable in services in PayPal. Also, there has been a rise in blockchain-based platforms for searching and positing freelancing jobs, which has caused a challenge for the existing farm websites.

Also, the growth of the gig economy across the world in recent years has led to Upwork stop accepting registrations for freelancer writers.

How is the world developing?

The development of the gig economy has been slow, yet steady in the Western countries. But it has become a regular job in other emerging countries around the globe. For instance, in 2015, Africans created over 3.1 million new jobs. And in the same year, 12 million youngsters entered the workspace. Hence, these numbers evidently explain the growing gig economy embedded with crypto services in Africa.

In some countries, cryptocurrencies have seen to be more stable than the standard fiat currencies. Though they have regular volatility of 10-15%, it is still a better option than unstable fiat currency as they are prone to hyperinflation.

Conclusion

Many thought the gig economy is something that could take a while to enter, but it is here before than expected. With its steady rise, blockchain and cryptocurrency have increased its rate of rising. Also, this could also lead to norms like PayPal and Upwork to adapt and reduce their existing cost on transactions.

Categories
Crypto Guides

Use Cases Of Cryptocurrencies In The Cannabis Industry

Introduction

Since the development of cryptocurrencies, the legal cannabis industry and the cryptos have seen to be building a relationship. And that’s because they share quite a lot of stuff in common. For instance, both operate in legal terms, at least in the United States. They have bound to the same challenges in the regulatory, financial, and political domains. In fact, most people involved in the cannabis industry also overlap with the cryptocurrency industry.

Keeping in mind the analogous nature between the two industries, let’s see how they would work if we were to blend them together.

Cryptocurrency and its Difficulties

Since the launch of cryptocurrencies, there have been several issues in adopting it. Though it has numerous benefits when compared to the traditional currencies, the government and the mainstream public are still timid in using it like any other fiat currency.

Having said that, there are a few government regulatory bodies that efficiently approach the cryptocurrencies. There are even some ventures that trust them and find them safe to be stored. The reason for it could be accounted for its current volatility. However, it ends up being in a vicious cycle. The acceptance of cryptocurrency by the merchants is the most challenging part because they are aware of the number of users who are handling them, which is why cryptos have still not practically come into the real business.

The Challenges in the Cannabis Industry

The pot industry, just like the crypto industry, is in the same boat. Both are not illegal but are still problems to become completely legal. Now, for instance, let’s consider only those areas where the cannabis is completely legal for business. That is those states where marijuana is legal and recognized by the US government.

But, with all the support and permission from the government, but it still faces significant challenges. There are only a few banks that offer credits and loans to marijuana manufacturers due to the legality issues it faces and the newness of the market. Now that we know both the industries lie in the same plane, let’s combine them and see its effects.

Cryptos Collaborating with the Cannabis

In consideration of the exclusive features offered by cryptocurrencies, there is great potential for crypto to collaborate with the marijuana industry. With the blockchain technology, the industry is offered with payment method who find the traditional system unsecured as mentioned by Satoshi Nakamoto on the whitepaper that cryptocurrencies backed with blockchain clear out all third-party intermediaries and provide a one-to-one secure transaction between the sender and the receiver.

The association between the two might look like a bizarre match, but in reality, they go hand in hand. Cannabis can use the blockchain technology as a store of value and also as a main source for medium for transactions. As it eliminates the intermediaries, the handling of cash becomes much easier and efficient.

Real World Use Cases

There are several projects that are being laid based on the idea of utilizing blockchain in the Marijuana industry. The growth of these coins happened in 2014. The most reliable and popular ones include:

PotCoinCannabisCoinDopeCoinHempCoinCannaCoin

Having said that, none of them have achieved widespread adoption yet. The basic use case of all the coins is the same – enabling marijuana distributors, and related industries with a common medium of exchange. Both cannabis and cryptos are not entirely legal in almost every part of the world. However, the blend between the two has definitely made things better, at least in terms of security in payment.

Categories
Crypto Guides

A Quick Introduction to Decentralized Autonomous Organization (DAO)

Introduction

The blockchain technology has been in the industry for quite a while. Cryptocurrencies were the first ones to experience the taste of blockchain technology. As years passed, many technologies were being prototyped using blockchain. Then came Decentralized Autonomous Organizations. Many blockchain geeks would already be aware of it, while the rest are still clueless about this concept though they’ve heard it. So, if you are still one of those who doesn’t understand DAO, then this article might help.

What is DAO?

The meaning of DAO lies in its name. DAO is an organization that is both decentralized and autonomous. Back then, it was only an idea but became practical with the assistance of blockchain.

As mentioned, DAOs are organizations that run in a decentralized and autonomous fashion. In other words, they operate without a centralized party that makes decisions. In fact, all the growth and profit are managed without any central authority. When it implemented via blockchain technology, they are bound to follow programmatic rules that are granted through consensus.

DAOs can, in fact, be related to mainstream companies, as both have predefined goals. However, the goals of mainstream companies can be altered and may not be enforced. But in the case of DAOs, the goals are digitally enforced, and hence no alteration is possible.

Let’s consider an example illustrated by Mike Hearn to visualize the concept of DAO. He objectified DAO to a driverless car that acts like a taxi. It charges the passengers as a rental. After the journey, the profits are used to fuel the car at the gas station. In the whole process, the car does not require any human effort to figure out what to do, as everything is programmed initially.

Key Features of DAO

The first feature is obviously the autonomous nature of DAO. This means that any outside forces cannot corrupt a deployed function. In addition, their open-source nature makes it transparent. This eliminates the doubt for a trusted third party. There are tokens of all transactions, which are used for rewarding. With the non-hierarchical structure of DAO, all the funding takes place only during development and is distributed equally.

The Reason of Existence

Apart from a predefined goal, DAOs contrast with other organizations. In the present world, every organization out there is centralized. So, the only reason for the existence of DAOs is to take advantage of a highly efficient, autonomous, and decentralized system of governance. If organizations work like the DAOs, then there would be no time wastage and effort from an intermediary to control the organization. Instead, all the work would be done by itself.

The Advantage Over Traditional Governance

Governance simply refers to the interaction between various entities based on specific rules and norms and on how they are regulated and structured. Every governance in a company follows a top-down approach. In such an approach, there arises issues and dilemmas. For example, an agent can make a decision with their own choice as a result would not affect them.

If the decision turns out to be risky for business and expensive, the one to suffer would be the principal (a higher position), not the agent from a lower position. But, with DAOs, the costs, as well as the principal-agent dilemma, would be reduced because DAOs utilize smart contracts and blockchain technology in its working.

Categories
Crypto Guides

Four Best Use Cases Of Blockchain For Governments

Introduction

Blockchain platforms have proven themselves to be not only a platform to create and exchange cryptocurrencies but much more than that. Further, these platforms are not limited to only financial workspaces, but much more can be achieved. In this article, let us see the applications of blockchain in government institutions.

Budgetary Use Cases

I am starting the article with budgetary use case as this is very close to my heart to achieve a corruption-free world. Every government around the world has its budgetary sessions for every financial year. As per the allocations, the amount is released to each department as required. Based on the amount announced for the department, they have to design a blueprint on how the funds will be utilized for the year and all the minor details like contractors, vendors; payments should be finalized to incorporate the same in a smart contract.

Once all the details are completed, the smart contract can be launched. Everyone will be paid accordingly when predefined conditions are met. Thus, achieving a corruption field. Once a smart contract is deployed, it would be difficult to change any conditions. Hence this is a bit complex to implement, but the stakes are quite high since we envision a corruption-free world.

Digitizing The Documents

Every government has many departments often divided between state and central. Most of the governments are digitizing the records as of now. It will be an excellent use case of blockchain if the digitized materials are stored in the blockchain. Often the documents should be shared amongst immigration authorities, defense, homeland security, many more departments. A lot of paperwork and permissions should be sorted out to get adequate information, which is very time-consuming.

If all these documents are stored in the blockchain, it would be effortless to transfer the materials. The document should be shared using the only blockchain. Every view of the document from other departments can be stored as transactions; transaction approvals can be saved as different transactions. Thus, everything will be recorded. This is very useful to avoid any loss or tampering of the documents.

Voting

Voting is crucial for any democratic country to run smoothly at predefined intervals of time. There are huge limitations when it comes to conducting voting securely without any fraud. If blockchain is implemented for voting, that can be changed. Each vote can be converted into a smart contract and display the transactions publicly for everyone to view. Moscow has its voting platform on Ethereum.

They have implemented blockchain voting for urban and landscape design. Half a million people have voted their ideas for public transport, plantations, and materials to be used. Though the platform isn’t used for political polls, the success is a considerable achievement to develop blockchain for voting a full-fledged manner.

Identity

Almost all the governments around the globe have some unique identification numbers for their citizens. Social security numbers for Americans and Aadhar numbers for Indians are some examples. These identification numbers contain the most sensitive information of the citizens of a country like tax returns, income details, retina scans, fingerprints, and so much more.

If these details are hacked somehow, it would be a massive setback for the governments as it is a concern of people’s security. Hence, it is essential to safeguard such information in blockchain so that every view by different authorities can be permissioned and stored using transactions.

These are some of the use cases in government institutions where blockchain will be beneficial to enhance the efficiency and working of the government.

Categories
Forex Fundamental Analysis

Bank Lending Rate – How Important Is It To Know This Fundamental Driver?

Introduction

Bank Lending Rate serves as a useful metric to assess the liquidity of the banking sector and the overall economy. Bank Lending Rate helps us to understand the ‘cost of money’ or how expensive the money is in the economy.

The Lending environment within the economy determines whether the consumer and business sentiment is bearish (save more spend less) or bullish (spend more save less), which will have a multitude of impacts in various sectors. Investors, Traders, Economists use these rates to assess the current ease of flow of money within the economy and its corresponding consequences.

What is Bank Lending Rate?

Bank Lending Rate, also called the Prime Rate, is the interest rate at which the commercial banks are willing to lend money to their most creditworthy customers. The most creditworthy customers would usually be the corporate companies that have an outstanding past credit record.

At the top of the lending, chain sits the Central Bank, which determines the rate at which banks lend each other money in the interbank market. In the United States, the Central Bank is the Federal Reserve, and it influences the interbank rate, also called the Fed Funds Rate, by purchasing or selling government securities.

When the Federal Reserve purchases bonds, it results in the injection of money into the system, thereby increasing the liquidity of the bank market, and correspondingly the overall economy. When the Banks have more money to lend, the banks will lend this newly injected money at a lower rate, as a result of competition, and excess reserves.

On the other hand, when the Federal Reserve sells the bonds, it takes money out of the system, where banks become less liquid and thereby increasing their interest rates to get the best price for their remaining funds.

Hence, the Fed Funds rate serves as the base for the Prime Rate or Bank Lending Rate. This Prime Rate serves as the basis for all other subsequent forms of loans like a personal, business, student, or even Mortgage loans. The below diagram is illustrative of the above points.

The below diagram summarizes the hierarchy of the rates. The lower cell type of interest rate derives its value from its upper cell interest rate.

How can the Bank Lending Rate numbers be used for analysis?

The Prime Rates change based on the Fed Funds Rate, which is decided by the Central Bank based on economic factors.

The remaining forms of loans are derived from the Prime Rate and a percentage spread that is charged by banks for lending the money. The spread (or profit) varies from bank to bank and also on the customer’s credit score. Hence, there is no single Prime Rate as the best customers of the banks vary, and hence, usually, the quoted Prime Rate is the rate published daily in the Wall Stree Journal.

The Prime Rate is seen as a benchmark for commercial loans. In most cases, that would be the lowest rate available to the general public and business corporations, and it is not a mandatory minimum. In the end, banks can tweak their rules in their favor. A decrease in Fed Funds rate does not necessarily guarantee that a subsequent drop in the Prime Rates, but due to competition amongst banks, the general trend is that the Prime Rate follows the Fed Funds Rate.

We must understand that a Bank’s primary motive is to make money out of money. They make their profit on the difference between the Lending Rate and the Deposit Rate, also called the Net Interest Margin. A variety of factors come into play before a loan is sanctioned. The risk associated with the borrower (credit score, income source, assets, and existing liabilities), fluctuating market and economy, general consumer and business sentiment, etc. all add to the decision-making process of setting the Prime Rate, or other loan forms derived from it.

The ease at which loans are available to the public determines the type of monetary policy. In a loose lending environment, the Bank Lending Rates are typically low, which encourages consumers to borrow more and spend more into the economy. On the contrary, when the Rates are high, it discourages consumers from borrowing and encourages saving more.

The Central Bank regulates money flow through its interbank operations to manage inflation and deflation. In developed economies, a loose lending environment promotes growth & avoids possible deflationary threats. The tight lending environment is a strategy to slow down or cool down an overinflating economy.

The affordability of loans determines how much money is in people’s hands to spend. Low Prime Rates ensure high spending environments that are good for businesses and promote growth and higher GDP prints and vice-versa.

The effectiveness of the Prime Rate changes is not immediate, as the changes in the Fed Funds Rates, Prime Rates take time to come into effect. There is generally a 4-12 months time lag before the intended changes start to play out, and yet there is no guarantee that these levers will work.

Impact on Currency

Higher Bank Lending Rates is deflationary for the economy, and currency appreciates. On the other hand, Low Bank Lending Rates are inflationary for the economy, and the currency depreciates in the short-run.

Although, the low rates are typically set to boost the economy, which will cancel out the depreciation effect on a longer time frame, the immediate effect is as stated above.

Economic Reports

For the United States, the Federal Reserve publishes daily Selected Interest Rates, which includes the Prime Rate figures also. Weekly average and monthly Prime Rate figures are also available. In general, weekly and monthly data are monitored by the market.

The data is posted from Monday to Friday at 4:15 PM every day for the Daily Selected Interest Rates.

Sources of Bank Lending Rate

Selected Interest Rates – Daily – Federal Reserve

Selected Interest Rates – Weekly Monthly – Federal Reserve

The St. Louis FRED also keeps track of Prime Rates, and it is available here

Bank Lending Rates for various countries are summarized together and available here

Impact of the ‘Bank Lending Rate’ news release on the price charts 

In the previous section of the article, we learned about the ‘Banks Lending Rate’ fundamental indicator, which talks about the change in the total value of outstanding bank loans issued to customers and businesses. A country that lends more to people and companies is said to encourage economic growth by giving more money in the hands of people. This directly stimulates consumer spending and promotes the overall development of the country. This is one of the key parameters, if not very important, which investors look at before taking a position in the currency.

In the following section of the article, we shall look at the impact of the Bank Lending Rate announcement on various currency pairs and examine the change in volatility due to the announcement. The below image shows the previous and latest data of Japan, where the rate was reduced from the previous month. Let us analyze the impact of the same on some major Japanese Yen pairs.

EUR/JPY | Before The Announcement

We shall start with the EUR/JPY currency pair for discovering the impact of the Bank Lending Rate on the currency. The above image shows the characteristics of the chart before the announcement was made, and we see that after a high volatile move, the price has developed a small ‘range.’ Currently, the price is at the ‘support’ where we can expect to pop up any time. Thus, the bias is on the ‘long’ side.

EUR/JPY | After The Announcement

After the news announcement, the price suddenly goes higher and closes as a bullish candle. The spike in volatility to the upside was a result of the negative Bank Lending Rate, which was slightly reduced as compared to the previous month. As the rate was not increased, traders bought the currency and sold the Japanese Yen. But since the data was largely poor, the ‘news candle’ was immediately retraced fully, and volatility increased on the downside. Thus, we need to wait for the volatility to subside in order to make a trade.

AUD/JPY | Before The Announcement


AUD/JPY | After The Announcement

The above images are that of the AUD/JPY currency pair, where we see that before the news announcement, the pair in a strong uptrend with nearly no retracement of any sort. This means the Japnese Yen is extremely weak, and irrespective of the news data, a ‘short’ trade is not recommended whatsoever.

After the news announcement, the price initially moves higher, but later volatility increases to the downside and goes below the moving average. This shows that the Bank Lending Rate news was not bad for the Japanese Yen, which is why traders bought the currency later on. We need to be careful by not taking a ‘short’ trade as the overall trend is up and that the impact is not long-lasting.

CHF/JPY | Before The Announcement

CHF/JPY | After The Announcement

The above images represent the CHF/JPY currency pair, where we see in the first image that the market is clearly ‘range’ bound and is not trending in any direction. Just before the announcement, the price is near the top of ‘range,’ which means we can expect sellers to get active any moment from now. We shall wait and see what the news release does to the currency pair and then take a suitable position in the market based on the data.

After the news announcement, the price moves higher, similarly as in the above currency pairs, but gets instantly retraced. The currency pair forms a ‘Rail-Road Track’ candlestick pattern, which indicates that the pair is going to continue its downward move. Hence traders can take ‘short’ after noticing such a pattern after a news announcement. Technically also the place is supportive of a ‘sell.’

That’s about ‘Bank Lending Rate’ and its impact on the Forex market after its news release. If you have any questions, please let us know in the comments below. Good luck!

Categories
Forex Fundamental Analysis

The Impact Of ‘Capacity Utilization’ On The Forex Price Charts

Introduction

Capacity Utilization is a straightforward and crude way of finding out whether a business or an economy is operating at its peak potential. Investors would always prefer to direct their capital, where their returns are maximized to the optimal levels. In this sense, Capacity Utilization can tell us which sectors, or companies, or even economies would attract capital, which would further fuel growth and prosperity. Hence, understanding Capacity Utilization figures will prove advantageous for our fundamental analysis.

What is Capacity Utilization?

Capacity Utilization refers to the proportion of the real potential economic output that is realized at a given point in time. It tells us at what level of maximum capacity is an industry operating at. It is expressed in percentage and is given by the below equation:

For example, a firm that can produce 10,000 phones a day, if it is producing 6,000 phones only, then the company is said to have a Capacity Utilization of 60%.

In the simplest sense, Capacity Utilization is like a report card of an industry or an economy. It tells the current score (or marks) out of the maximum possible marks.

How can the Capacity Utilization numbers be used for analysis?

Capacity Utilization Rate is an essential operational parameter for businesses, especially those manufacturing physical goods, as it is easier to quantify the output.

A company operating at less than 100% implies that the firm can increase its production, and consequently, its profit margin without incurring additional costs of installing new equipment to increase production. Likewise, economies with scores of less than 100% can afford to increase production capacity when demanded.

For the companies, it serves as a metric for determining operating efficiency. Capacity Utilization is susceptible to the following factors:

  • Business Cycles: Businesses are often seasonal, seeing an increase in business during specific periods of the years, although some companies may have consistent business activity throughout the year. It depends on the nature of business and the products being manufactured.
  • Management: Lack of proper management can also lead to wastage of resources; therefore, undermining the efficiency of the company itself. It is not often the common cause but is also one factor that investors must look into to make sure proper management is there to handle the business to utilize the available resources in terms of workforce and equipment to optimize revenue for the firm.
  • Economy’s Health: Economic conditions drive consumer sentiment and affect the spending patterns of people. During fluctuating inflation rates and unstable market economic conditions, people tend to save more and spend less, which can effectively reduce the demand for goods and services. In this case, the company may need to adjust their production to demand.
  • Competition: In an open market environment, competition always takes away a portion of our business, as companies battle for a bigger portion of the market, the best companies with excellent quality goods, and reputation tend to take a higher proportion of market revenue. At the same time, the laggards end up with lower demands for their product.

In general, competition and management factors are a minor component that applies to novice companies that are in the early stages of development. In most cases, the industries are well established in their field and have consistent performance and are indeed susceptible to Economic health and business cycles.

Low Capacity Utilization figures are not desirable. Fiscal and Monetary Policymakers ( Government and Central Banks) monitor the Capacity Utilization figures and intervene using fiscal or monetary levers to stimulate business and economy. Governments can decrease the tax burden on specific sectors to encourage them to invest capital in their growth. At the same time, Central Banks can reduce interest rates to encourage business owners to borrow money and increase business activity through expansion or investment opportunities.

 High Capacity Utilization figures are always preferable, as it indicates that the companies are running at their maximum capacity, and earning maximum achievable profit through their current business setup. When Capacity Utilization is close to 100%, the economy is performing at its peak, and it is ideal an ideal environment for investors to invest in industries. It implies that economic health is stable and growing.

Sector-wise Capacity Utilization rates difference can tell us what amount of slacks each industry is carrying and can direct investment capital into the growing industries than the slowing sectors. By comparing historical highs and lows, we can get a reference, on an industry’s current performance with regards to its peak high and low performances, to understand how it is faring right now.

Impact on Currency

Capacity Utilization is a coincident indicator that is reflective of the market environment and the corresponding policy levers executed to counter the market conditions by the Fiscal and Monetary policymakers. Hence, it gives us a current economic picture as it is a function of the market environment and policy levers.

It is a proportional indicator, where high Capacity Utilization Rates indicate healthy revenue-generating activity, which is suitable for the economy, higher GDP prints, and currency appreciates accordingly. On the other hand, decreasing Capacity Utilization Rates indicate a stagnating or deteriorating business activity, which poses a deflationary threat to the economy, or extreme cases recession, which is depreciating for the currency.

It is a low impact indicator, as the corresponding impacts would have been already priced into the market. We are saying this because policy maker’s decisions come out in the form of interest rates, tax exemptions or reductions, and through survey indicators like business and consumer surveys.

Economic Reports

The “Industrial Production and Capacity Utilization – G17” reports are published every month by the Federal Reserve in the United States on its official website. The reports are published in the formats of estimates and revised estimates.

The first estimate is released around the 15th of every month at 9:15 A.M. for the previous month. It factors in about 75% of the data. The second estimate accounts for 85%, the third estimate 94%, the fourth estimate 95%, and 96% in the fifth and sixth estimates as more of the source data becomes available after each passing month.

Sources of Capacity Utilization

The monthly Capacity Utilization statistics are available on the official website of the Federal Reserve for the United States. The St. Louis FRED website provides a comprehensive list of Industry Production, and Capacity Utilization reports on its website with multiple graphical plots. We can also find global Manufacturing Production figures for various countries in statistical formats here.

Impact of the ‘Capacity Utilization’ news release on the price charts

In the previous section of the article, we understood the meaning and significance of Capacity Utilization, which essentially talks about the manufacturing and production capabilities that are being utilized by a nation at any given point of time. If demand increases, Capacity Utilization increases, but if demand decreases, the rate will fall. Policymakers use this data for fixing interest rates and while calculating inflation in the economy. Thus, investors give a reasonable amount of importance to the data and take a stance in the currency based on the Capacity Utilization rate.

The below image shows the latest and previous Capacity Utilization rate of Japan. We see there was a decrease in Capacity Utilization in March, which means the country underutilized its resources. A higher than expected number should be taken as positive for the Japanese Yen, while a lower than expected number as negative. Let us discover the impact of the data on different currency pairs.

USD/JPY | Before the announcement:

We shall begin with the USD/JPY currency pair to analyze the change in volatility before and after the news announcement. The above image shows the state of the currency pair before the news announcement, where the price moving within a range broadly and currently is in the middle of the range. As there is no clarity with respect to the direction of the market, we shall be trading based on the outcome of the news.

USD/JPY | After the announcement:

After the news announcement, the price falls below the moving average, and volatility increases to the downside. Even though the Capacity Utilization data was not very good for the economy, traders considered the data to be mildly positive for the economy in this case and bought the Japanese Yen. After the market has shown signs of weakness, we are now certain that the volatility will expand on the downside, and thus, we can take a ‘short’ position with a stop loss above the ‘resistance’ of the range.

GBP/JPY | Before the announcement:

GBP/JPY | After the announcement:

The above images represent the GBP/JPY currency pair, where we see that before the announcement, the price has started to move in a ‘range’ after a large move on the upside. This also a place from where the market had reversed earlier, thus we need to trade with caution, as we are not sure where the market will head now.

After the news announcement, the price crashes and sharply moves lower. The Capacity Utilization data proved to be positive for the Japanese Yen, and traders went ‘short’ in the currency pair, thereby strengthening the currency furthermore. This is our final confirmation for taking a ‘short’ trade and taking entry as the volatility increases to the downside.

AUD/JPY | Before the announcement:

AUD/JPY | After the announcement:

The above images are that of the AUD/JPY currency pair, where in the first image, we see that the market is in a strong uptrend indicating a great amount of weakness in the Japanese Yen. Technically, we should be looking for buying the currency pair after a suitable price retracement to the ‘support’ area, but a news release can change the entire plan. Thus, we need to wait and see what the news outcome does to the currency pair.

After the news announcement, volatility slightly increases to the downside, and the ‘news candle’ barely closes in red. This means the impact of Capacity Utilization was least on this currency pair that did not result in huge volatility in the pair. As the overall trend is up, a ‘short’ trade can be very risky as the risk to reward ratio is not in our favor.

That’s about ‘Capacity Utilization’ and its impact on the Forex market after its news release. If you have any questions, please let us know in the comments below. Good luck!

Categories
Forex Fundamental Analysis

Do You Know That The ‘Car Production’ Data’s News Release Impacts The Forex Price Charts?

Introduction

Car Production figures are used by economists and investors as a measure of wealth per capita. Among all the Industrial Production figures, which covers different sectors, Automotive industry production figures’ implications are different from industries producing essential goods like (Food, daily needs goods). An increase in vehicle production is indicative of an increase in per capita income, and other economic conditions. Hence, individual analysis of Car Production figures can help investors, and economists to analyze economic health, and standard of living in the country.

What is Car Production?

Car Production is the total Auto output of Automative Industries in a given economic region for a specific period. The number of motor vehicles manufactured is assessed and categorized based on the type of vehicle. A typical automotive industry would generally have multiple classes of vehicle manufacturing ranging from 2-wheeler bikes to 18-wheeler trucks. Car Production statistic is the production of Cars (called Auto in the statistics) and excludes Trucks and two-wheeler bikes.

In this statistic, Car Production has a separate and special significance. Consumers make up 66% of the private sector, and businesses make up 34% in the United States. Owning a car is more important to people than owning a house. In today’s mobile world, with different modes of transportation available, the car is still an essential expense for the average public. 85% of the Americans own a car, which indicates its significance in day-to-day life. We cannot deny the importance of having a car for commuting as per our convenience.

How can the Car Production numbers be used for analysis?

In the developing economies like India, the number of households that own a car is just 11% as per a survey in 2016, which is a 200% increase from its previous survey in 2011, where it was only about 5%.

Hence, Car Production can be used to draw multiple conclusions, which are as follows:

Standard of living: As the standard of living increases, more and more people can afford luxury goods. While owning a car might not seem like a luxury, but for the developing economies, it does. Also, the range of cars today that are available for purchase, it mirrors the wealthiness of the economy.

Dependent Industries: A car production typically involves several parts that are obtained from other industries, like the car body requires steel, tires require rubber, etc. Hence, Steel Production figures are influenced by the demand from Car Production figures. One-fifth of American Steel Production and three-fifths of rubber manufactured goes to the Automotive Industry. Machine tools, petroleum refining technology industries, paint, plate-glass industries are all stimulated through the Automotive industry.

Indirect Dependent Industries: Increased Car Production signals more cars or vehicles are going to be on the road, or need to be delivered, which brings business for freight operators, and road construction firms. As traffic increases, Fiscal policymakers intervene and fund road projects to build a better network of highways to solve this issue.

Investors can look at Car Production figures and analyze the stimulus it brings on industries dependent directly or indirectly. For example, a general trend in the local production of Cars increase can signal that a construction company like L &T could obtain a contract for road betterment, or a tire company like MRF could see a spike in their business due to increased demand. The cause-effect analysis can help investors make the right stock decisions.

Car is a convenience and not essential like Food. But it has gained the status of an essential item in developed economies. While the developing economies are also getting there, economists can see the changes in Car Production figures. By doing this, they can understand the change in spending patterns of consumers from saving to purchasing Cars. If these numbers increase, it is an indication of an increase in consumer sentiment, business sentiment, employment, wage growth, an increase in disposable income, or improvement in the standard of living.

In the United States, the Car Production figures are part of the Industrial Production reports. The Industrial Production figures tell the overall macroeconomic picture, about how business production and capacity utilization is increasing but does not tell us what sectors growth are increasing or decreasing and its corresponding implications. Car Production figures, in this sense, paints a better picture.

For example, an increase in Coal production could only imply an increase in exports, which is good for the economy, but an increase in Car Production figures indicate more and more people are coming into the middle-class from lower sections and can afford cars. It implies that the overall standard-of-living is increasing.

Also, the automotive industry is a vital element in many industrialized economies like the United Kingdom, France, Germany, Japan, etc. where healthy amounts of Car Production is essential to maintain International Trade balances.

With more and more emerging economies like China, India, Japan, etc. improving their economic conditions aggressively through export-led growth in the international markets, the overall number of people above the poverty rate is increasing, which would ultimately translate into increasing Car Production and Steel Production figures in the upcoming times. The below plot justifies our conclusions above.

Impact on Currency

Car Production statistic is a proportional indicator; meaning increase or decrease in the statistic is followed by currency appreciation or depreciation, respectively. Although, it is essential to note that Car Production is a lagging indicator as the corresponding increase would have already been implicated through leading and coincident indicators like Consumer, business surveys, or improvement in the Disposable Income figures.

Hence, it is a low impact indicator. It is more useful in the long-term understanding of trends and can help investors with stock-portfolio decisions in the stock market having their stake in the dependent industries, which could be affected by the Car Production figures. It can overall act as a double-check for our fundamental analysis but not as a metric to predict future economic growth.

Economic Reports

The “Industrial Production and Capacity Utilization – G17” reports are published at 9:15 AM every around the middle of the month by the Federal Reserve in the United States on its official website. The reports are in the formats of estimates and revised estimates. Under this section, the report titled “Table 3 Motor Vehicle Assemblies” contains the Autos figures, which we are interested in our analysis.

The International Organization for Motor Vehicle Manufacturers also provides an aggregate summary of vehicles produced on its website.

Sources of Car Production

The monthly Car Production statistics are available on the official website of the Federal Reserve for the United States. The St. Louis FRED website provides a comprehensive list of Industry Production, and Capacity Utilization reports on its website with multiple graphical plots, which are available here. We can also find global Car Production figures for various countries in statistical formats here and here.

Impact of the ‘Car Production’ news release on the price charts

In the previous section of the article, we understood the Car Production economic indicator and saw how investors use it for analyzing the economic state of a country. Car Production numbers are a critical component of industrial growth, which highlights the state of the automation sector of the country. The auto industry contributes 3-3.5% to the overall Gross Domestic Product (GDP) and employs a large number of people across different divisions in the industry. Cars manufacturing is a major contributor to this sector, and thus investors give a reasonable amount of importance to this data.

In today’s example, we will be analyzing the impact of Car Production on British Pound, and the below image shows the percentage fall in total production as compared to the previous year. We see that Car Production dropped by 0.8%, which was slightly better than the previous reading. This may be mainly due to slower demand in the local and foreign markets. Let us look at the market’s reaction to this data.

GBP/USD | Before the announcement:

We will begin our evaluation by analyzing the GBP/INR currency pair. The above image shows the behavior of the pair before the announcement is made. We see that the market is resiliently going up with minimum retracement. This means the British Pound is very strong, or the U.S. dollar is really weak. At this point, we cannot take any position in the market as technically; this would mean chasing the market.

GBP/USD | After the announcement:

After the news announcement, the price rallies further, and volatility expands on the upside. The Car Production data was taken well by the market players who took the price higher and closed the ‘news candle’ with a decent amount of bullishness. As a result, the uptrend gets extended further due to the positive news data. In order to trade the pair, one needs to wait for the price to retrace to the nearest’ support’ and then analyze accordingly.

GBP/NZD | Before the announcement:

GBP/NZD | After the announcement:

The above images are that of GBP/NZD currency pair, where in the first image, we see that the market is in an uptrend, and recently the price has retraced to a ‘support’ area. Technically, this is an ideal place for going ‘long’ in the market with a small stop-loss loss. The volatility, before the announcement, appears to be on the higher side, so conservative traders need to be cautious while trading the currency pair.

After the news announcement, volatility surges, and the price significantly moves higher within no time. This reflects the positiveness in the Car Production data, which was better than last time. After this sharp reversal, traders can take ‘long’ positions with a stop loss below the ‘news candle.’

EUR/GBP | Before the announcement:

EUR/GBP | After the announcement:

Lastly, we shall analyze the impact on the EUR/GBP currency pair and see the change in volatility. Here, before the news announcement, the market is in a strong downtrend with almost no ‘pullback,’ indicating a remarkable amount of strength in the British Pound. Since we only see nothing but red candles, selling at any point would mean chasing the market. From a risk aversion perspective, we should always trade the retracement of a trend and not when the trend itself.

After the news announcement, the market falls further and reacts similarly to the above currency pairs. The positive Car Production data increased the volatility to the downside by further strengthening the British Pound. We will be able to take a sell trade only after the price retraces to the nearest’ resistance’ or ‘supply’ area.

That’s about ‘Car Production’ and its impact on the Forex market after its news release. If you have any questions, please let us know in the comments below. Good luck!

Categories
Forex Fundamental Analysis

Everything About ‘Cement Production’ & Its Importance as an Economic Indicator

Introduction

Cement is a commodity that is likely to never run out of demand any time soon. As buildings get kept on renovated in the developed economies, and significant infrastructures like apartments, independent single-family houses, and corporate company buildings continue to be constructed in the developing economies, Cement is required. Increasing Cement Production figures are suitable for the economy, and if the increase is due to international demand, then it is good for the global economy.

Few commodities like Crude Oil, Iron, Steel, and Cement are very required in the modern economy, and countries that are ahead in the production of these goods have experienced substantial growth. Concrete stands behind water in second place as the most widely consumed resource on the planet. Hence, understanding of Cement Production and its impact on economies can help us understand the macroeconomic picture for better fundamental analysis.

What is Cement Production?

The Cement that we generally refer to is the Portland Cement. Cement is the primary ingredient of concrete used in construction. Cement combines with water, sand, and rock to harden to form a concrete structure that has high strength and durability.

Cement is manufactured through a tightly regulated chemical combination of Calcium, Aluminum, Silicon, Iron, and other ingredients. Cement is made using limestone, shells, and chalk or marl combined with shale, clay, slate, blast furnace slag, silica sand, and iron ore. These together, when heated at high temperatures, form a rock-like substance that is ground into the fine powder that we generally refer to as Cement.

How can the Cement Production numbers be used for analysis?

Cement is an essential ingredient in today’s urban infrastructure. It is used in the construction of homes, buildings, apartments, etc. Hence, every physical structure that we can set our eyes on around us is probably made out of Cement. It is for this very reason Cement stands second after water as the planet’s most consumed resource.

Hence, the demand is virtually inexhaustible, not for the near future, at least. As the emerging economies continue to develop at a pace higher than that of the mature economies, there will be a large section of the global population coming into the middle-class, where invariably demand for housing, expansion of businesses are set to increase.

In the world of Cement Production,  China is miles ahead of any other country, exporting 2,500 million metric tons of Cement in 2014. China has the largest cement industry. China uses this Cement for its construction as well as exporting to other countries. Cheaply available Cement has mostly helped China in its infrastructure improvement.

In the second place, far lies India with about 280 million metric tons output in 2014. Even further lies the United States, with about only 83 million metric tons in 2014.

(Source)

(Source)

Although the United States remains the largest economy in the world, that is going to change, as China and India continue to grow at a pace higher than the USA. The growth rate of India is the highest, while China is close to the United States in GDP terms.

As of 2019, the USA GDP is 21.5 trillion dollars, while China stands second with 14.2 trillion dollars. But it is important to note that China’s growth rate is higher than that of the USA, and if this continues, China will beat the United States. Most emerging economies are achieving their economic growth through exports, and dominating such essential commodities, like Cement, gives the economy an upper hand.

The availability of Cement at low prices helps the erection of commercial infrastructure easy that promotes the ease-of-doing-business factor in the country. As many companies like Apple develop their products in the United States but manufacture them in China, this promotes growth. The availability of infrastructure helps boost the economy to a great extent.

An increase in Cement Production helps developing economies to tap into the global market demand to compete against China for a more significant portion of the world market. For example, Indonesia is improving its share in the global market by providing Cement for as low as just 20 dollars compared to the 34 dollars price tag of China.

Hence, developing economies that can produce Cement commercially can boost their economy through international trade exports. Once a system is established that is efficient, upscaling it to unprecedented levels can boost the economy significantly.

(Source)

Note: Cement Production, although important, comes at the cost of air pollution. Cement Industry is one of the primary sources of Carbon Dioxide (Greenhouse gas) in the atmosphere, which is responsible for global warming. It is also responsible for soil erosion that destroys the top layer of land, which is necessary for agriculture.

An alternative called Green Cement is to replace Cement. It has better functionality, uses fewer resources, and is less damaging for the environment. With environmental issues being a significant concern, a potential shift may occur in the market towards green Cement as the go-to product for construction. Countries that will come up with an efficient way of mass-producing this green Cement at affordable prices can beat the current Cement industries. The only challenges are pricing and lack of availability in large quantities.

Impact on Currency

Cement Production is an economic indicator in our analysis solely based on its importance and demand. It is a proportional indicator, meaning an increase or decrease in its numbers can grow or contract the economy, thereby appreciating or depreciating domestic currency, respectively.

It is a micro-economic indicator, as it does not cover the entire economy’s production and can be closely monitored for countries whose dependency on Cement Production is high, which is more useful for regional level assessment.

In the currency markets, Cement Production values are not macroeconomic indicators and are only useful in microeconomic analysis within the country to predict construction-related growth, as an increase in labor force employment, wage growth, which are generally seasonal.

Economic Reports

The National Bureau of Statistical of China publishes monthly data of its Cement Production on its official website.

We can find global Cement Production data on globalcement.com given in the sources.

Sources of Cement Production

Cement Production – National Bureau of Statistical of China

Global Cement Production – globalcement.com

Cement Production statistics for various countries can be found here

Updates on Cement Industry, in general, can be obtained here

Impact of the ‘Cement Production’ news release on the price charts 

In the previous section of the article, we understood the Cement Production fundamental indicator and saw how it could be used for analyzing a currency. We shall extend this part of the discussion and see the impact it makes on a currency pair when the data is released. We would like to mention that Cement Production is not an important economic indicator when it comes to the fundamental analysis of a currency. Investors don’t consider it to a significant driver of the currency, but it surely impacts the construction segment, as building construction is largely dependent on Cement production and supply. This, in turn, affects the economy.

In today’s example, we will examine the impact of Cement Production on the Indian Rupee and look at the change in volatility to the news release. A higher production rate than before is considered to be positive for the currency, while a lower than the previous production is considered to be negative. The below image shows the graphical representation of Cement Production in India for the last two months. We see that there has been a reduction in total production for the month of February. Let us find out the market reaction.

USD/INR | Before the announcement:

We will first analyze the impact on the USD/INR currency pair. The above image shows the state of the chart before the news announcement, where we see that the overall trend is up, and recently there has been a price retracement to a ‘demand’ area. The buyers have already reacted from the demand area, and the price is on the verge of continuing the uptrend. Since the Cement Production indicator does not a major impact on the currency, traders can take ‘long’ positions and trade with the trend.

USD/INR | After the announcement:

After the news announcement, the price falls and goes below the moving average line. The ‘news candle’ closes with bearishness, indicating the Cement Production data was not lower by a large margin for that month as compared to the previous month. There is little change in volatility due to the news release, which explains the importance of the indicator among traders. Thus, traders should analyze the chart technically and trade based on that.

GBP/INR | Before the announcement:

GBP/INR | After the announcement:

The above images represent the GBP/INR currency pair, where, in the first image, we see that the market is moving within a range and currently is near the top of the range. At this point, one can expect sellers to activate and sell the currency. Since the ‘news announcement’ is a less impactful event, traders can take a ‘short’ position with a stop-loss above ‘resistance.’

After the news announcement, the market reacts positively to the data, and traders take the price lower. The impact of Cement Production was similar to the above pair as we see that traders bought Indian Rupee and strengthened the currency. Thus, it is clear that the market reacted technically (price fall from ‘resistance’) and not much to the news data.

EUR/INR | Before the announcement:

EUR/INR | Before the announcement:

The above images are that of EUR/INR currency pair where we see that before the news announcement, the market is in a strong uptrend, and recently the price has retraced to a ‘support’ area. This is a desirable market condition for going ‘long’ in the market after price action confirmation from the market. As the news data does not have a major impact on the currency, traders should not be worried about high volatility, which is typically observed after news announcements.

After the news announcement, the market moves lower by the bare minimum, and there is hardly any volatility witnessed. The Cement Production data did not create any major impact on the currency pair, where the market remains around the same price even after the news release. Once the market continues to move higher, one can join the trend by taking a ‘buy’ position.

That’s about ‘Cement Production’ and its impact on the Forex market after its news release. If you have any questions, please let us know in the comments below. Good luck!

Categories
Forex Fundamental Analysis

‘Disposable Personal Income’ – Understanding The Macro Economic Indicator

Introduction

Disposable Personal Income, also called DPI, is an economic indicator that can help investors understand the spending and saving patterns of the general population. It is from this data other forms of expenditures and savings are derived. Hence, understanding the changes in the relative disposable income numbers from time to time can help us understand the economic conditions better as part of our fundamental analysis.

What is Disposable Personal Income?

Disposable Personal Income, also called After-Tax Income, is what’s left of an individual’s income after all federal tax write-offs. Consequently, It is the amount people can spend, save, or invest. For example, An employee making 100,000 dollars a year, paying 25% of his income as tax would have to pay 25,000 dollars as tax payment, which leaves him with 75,000 dollars for that year. This 75,000 dollars would be his DPI, or more aptly the After-Tax Income.

Hence, the calculation of DPI is simple; it is just the difference between personal income and income taxes.

Note: The federal government may use the disposable income for further mandatory deductions like defaulted student loans, delinquent child support, or payment of back taxes. Hence, in the broader sense, the DPI would be the amount that is left after tax and other mandatory payments.

DPI is often confused with Discretionary Income, which is the amount that is left when the living expenses are deducted from the DPI. Living expenses are all the necessary expenditures incurred to conduct one’s lifestyle and would typically include rent, water bill, electricity bill, transportation costs, and groceries, etc.

For Example, A video gamer’s discretionary income would go to typically spending on purchasing new games, whereas a music-loving person would spend his discretionary income attending concerts perhaps. During times of recession or high deflationary conditions, the discretionary income takes the hit as it is miscellaneous spending and does not precede importance over taxes and necessary expenditures. Businesses that sell discretionary goods and services take the worst hit and hence are closely watched by investors for signs of recession and recovery.

Economic Reports

The U.S. Department of Commerce: Bureau of Economic Analysis (BEA) releases the DPI numbers every month in the last week for the previous month titled “Personal Income and Outlays” release. The month-on-month numbers are expressed in percentage changes with respect to last month’s figures.

The BEA also releases the other derived metrics from the DPI, like the REAL DPI, which takes inflation into account, and hence it is the inflation-adjusted version of DPI, PCE (Personal Consumption  Expenditure) and REAL PCE reports.

How can the Disposable Personal Income numbers be used for analysis?

The DPI data set goes back to as far as 1929. With such a long-range, the confidence in the numbers is high amongst economists with regards to its reliability. When compared against GDP growth, there is a good correlation between both.

As we can see below, the graphs have a similar trend, the first one is the Real GDP, and the second graph corresponds to the DPI, which are taken from the St. Louis FRED website for reference and illustration here. The shaded region indicates periods of recessions.

We can also see that during recessions, the GDP and DPI flat out from their usual trend and trend sideways or downwards (during more extended recessionary periods).

As DPI shows what the amount left with the individual after deductions are, the numbers can be used to derive other metrics. Economic indicators like Discretionary income, savings rates, Marginal Propensity to Consume (MPC), and Marginal Propensity to Save (MPS).

All these indicators are useful in speculating the direction of money flow, whether it ends up in banks in the form of savings or other people’s hands as part of the expenditure.

A healthy and growing economy would be reflected in the DPI numbers as the people make up the economy. It is important to remember that DPI is a reflection of the present financial situations of employees and hence only shows what the current economic status of the nation is. It is a coincident indicator in this sense and is dependent on macroeconomic factors like the government’s policies, Quantitative Easing, inflation, etc. which direct the money flow. Hence, it is the effect in the cause-and-effect equation. It reflects the results of an action rather than the act itself.

Impact on Currency

A steady increase in the DPI is always good for the economy and, therefore, the currency.  It is a proportional indicator. Low numbers are depreciating, and high numbers are appreciating for the currency.

A strong economy or most developed nation’s populations are expected to have higher DPI numbers relative to other economies, thereby enjoying a higher standard of living as they can spend on goods and services, beyond meeting their necessities.

An oncoming recessionary period would result in stagnant or dip in DPI numbers as people tend to save more when they are uncertain of their financial future.

Sources of Disposable Personal Income Reports

The monthly DPI numbers releases can be found on the official website of the Bureau of Economic Analysis as given below for reference:

Personal Income and Outlays

We can find historical and graphical analysis of the same numbers in the St. Louis FRED website as given below for reference:

Disposable Personal Income – Seasonally Adjusted Quarterly

For a more detailed analysis of the same, you can browse through the below relevant categories:

Personal Income – FRED

You can also find out the pure DPI numbers (not percentages) of other countries here:

DPI Trading Economics

Impact of the ‘Disposable Personal Income’ news release on the price charts

By now, we have understood the definition and significance of the Disposable Personal Income economic indicator. In this section, let’s analyze the impact of this economic indicator on currency and observe the change in volatility.

Personal Income, Disposable Personal Income, and Personal Consumption are announced together, and data of each of them is released along with the Personal Income. This is why we have collected the date and time of the announcement of Personal Income. As we can see below (yellow mark), traders do not give a lot of importance to the Personal Income data, and therefore one should expect moderate to less volatility during the announcement.

For illustrating the impact, we have used the latest Disposable Personal Income data of the United States. It is published by the Bureau of Economic Analysis of the U.S. The release said that Personal Income was increased by $106.8 billion in February, and the Disposable Personal Income (DPI) was increased by $88.7 billion which was 0.5% higher from the previous month. Let us look at the impact of this data on currency pairs.

EUR/USD | Before the announcement:

The above image shows the state of the chart before the DPI data is announced, and we can see that the market is in a downtrend, and recently it has given a retracement. Technically, this is the ideal condition for going ‘short’ in the market, but as the volatility is high, it is better to wait for the actual data rather than trading based on the market expectations. Taking a ‘buy’ in this pair can be risky even if the DPI data is positive for the U.S. economy as the down move is quite strong, and the reversal will not last (DPI is not a high impact event).

EUR/USD | After the announcement:

The DPI announcement induced a fair amount of volatility in the pair, and the ‘news candle’ leaves a long wick on the top indicating high selling pressure. From the reaction, we can conclude that the DPI for the month of February was very positive for the U.S. economy, which made traders buy more U.S. dollars. This sudden increase in volatility to the downside is a confirmation sign that the market will go much lower. Thus, as the price goes below the 20-period moving average, one can take a ‘short’ trade with a stop-loss just above the news candle.

USD/JPY | Before the announcement:

USD/JPY | After the announcement:

Next, we discuss the USD/JPY currency pair, where the behavior of the chart is different from the EUR/USD pair. Even though the chart is in a downtrend, the U.S. dollar is on the left-hand side. Hence, a downtrend indicates weakness in the currency. Just before the announcement, price is at the lowest point from where the market had retraced earlier. This means, irrespective of the news announcement, we can expect some buying strength from here. We cannot position ourselves on any side of the market at this point as technically, there is no supporting reason.

After the DPI data is announced, the market moves higher as a result of good DPI numbers, and the price makes a ‘bullish hammer’ candlestick pattern. But the data was not very upbeat to increase the volatility too much on the upside. As the market does not give clear signs of reversal, we cannot go ‘long’ in the market based on the data.

USD/HKD | Before the announcement:

USD/HKD | After the announcement:

The above images represent the USD/HKD currency pair where the price appears to be moving in a range, and predominantly the trend is down. Just before the announcement, the price is in the middle of the range, and we cannot predict at this point as to where the price will go. We need to wait to see the shift in volatility due to the news release and then have a view on the market.

After the DPI numbers are out, price falls to the bottom of the range, and we see a strong bearish candle. The DPI data proved to be positive for the currency in the above two pairs, but here the market reacted negatively. This could be due to the strength in the Hong Kong dollar or extreme weakness in the U.S. dollar. As the impact of DPI on currency is less, one can ‘buy’ USD/HKD near the ‘support’ with a target near to the ‘resistance.’

That’s about ‘Disposable Personal Income’ and its impact on the Forex market after its news release. If you have any queries, let us know in the comments below. Cheers!

Categories
Forex Fundamental Analysis

What Is ‘Government Budget’ & How It Helps In Determining A Nation’s Economy?

Introduction

Government Budget is one of the annual reports that moves the market volatility significantly. The Government of a country or a state is responsible for managing the economic activity of that region. Hence the Budget will primarily determine the pace of economic activity for that fiscal year. Government Budget figures are incredibly crucial for traders and investors as it can impact everything from taxes to Sovereign risks.

What is Government Budget?

Government Budget is a detailed annual plan for public spending by the Government. The Budget, in general, applies to individuals, corporations, and Governments. An individual planning his finances for the year determining what portion of his monthly/annual income he is going to allocate for his expenses would be his Budget. For corporations, annual budgets would detail what amount of revenue would be spent on different departments like R&D, marketing, infrastructure, etc.

The Government Budget is the same as the above, but the list of expenses is related to public welfare. The Government is responsible for a multitude of operations like salary payments to Government employees, financing agricultural subsidies, providing financial support to specific industries. It may also include paying for military equipment, payout pension funds to the applicable people, and other Government running operations expenses, etc.

The Government Budget is calculated on an annual basis, and for the United States, this fiscal year begins on the 1st of October to the next year’s 30th of September.

What a Government earns through taxes is called revenue, and what it spends on is categorized under Government Spending. When the spending exceeds its revenue, then we call it as a Budget Deficit or Fiscal Deficit. On the other hand, when the revenue exceeds spending, we have what is called a Budget Surplus or Fiscal Surplus. The United States has been running a budget deficit most of the time throughout history, as shown below:

Budget money spent is usually categorized into two categories:

  • Mandatory Spending: These are the spending that the Government has no choice to cut back on as these are stipulated by law, which the Government cannot fault on. For the United States, Social Security is one such program that was brought into the United States law by President Roosevelt in 1935, under the Social Security Act. Medicare and Medicaid are also typical examples of Mandatory Spending, which are fixed and must be paid out by the Government.
  • Discretionary Spending: This part can make or break an economy. It is the part of Budget that the Government decides to spend on other programs that are not mandatory but essential for growth. There is certain flexibility on how much can be spent on which part of the economy.

How can the Government Budget numbers be used for analysis?

The Government’s Fiscal Deficit is financed through borrowing money from investors in the form of bonds for which the Government promises to pay interest. Deficit each year adds to the debt. The United States and many other developed economies have spent most of their time maintaining a Budget Deficit as the spending has been failing to stimulate the economy year after year.

If the Government decides to cut back on spending to service debt and interest payments, then the economy may slow down due to a lack of funding stimulus. On the other hand, if the Government continues to spend beyond its revenues to stimulate the economy, then it will keep piling up the previous debts.

The Budget has both short-term and long-term impacts on the economy. Based on which sectors the Government has chosen to allocate its spending, investors and traders can predict economic growth and slowdowns in different sectors.

The Budget’s portion that is being spent on servicing debt and interest payments also decides whether the country is in danger of Sovereign Credit Risk. The credit rating agencies like Standard & Poor’s, Fitch Group, and Moody’s, etc. credit rate the Government. If the credit rating falls, then investors quickly lose confidence in the Government’s ability to pay back.

Hence, investors demand higher interests for the risk associated and which further cuts a bigger pie out of the Budget, leaving less room for spending. The vicious cycle of debt is tough to get out of for the Government and hence, Budget figures and strategic allocation of funds is crucial.

Impact on Currency

Currency markets quickly lose faith in the Government that is unable to resolve National Debt and large Budget Deficits, and currency immediately depreciates. Increased confidence in the Government can appreciate the currency value.

Budget strategy tells the market the Government’s ability to maintain its debt and simultaneously invest its Spending on Growth. Only servicing debt slows the economy, and only spending on Growth piles up debt, which eats up tax revenue. Both are dangerous for the Government and the economy.

Hence, the Government Budget is a significant leading economic indicator for traders and investors alike. 

Economic Reports

The Budget reports of all countries are available on their respective Federal Government’s website. On an international scale, the World Bank and International Monetary Fund maintain the budget data for most countries. For the United States, the Budget reports are available on the Treasury Department’s official website and Office of Management and Budget’s website.

Sources of Government Budget

A comprehensive summary of all Budget related statistics are available on the St. Louis FRED and some other credible websites that are given below:

Impact of the ‘Government Budget’ news release on the price charts

Till now, we have understood the importance of Government Budget in an economy and how it can be used for fundamental analysis of a currency. The Budget impacts the economy, interest rate, and stock markets. How the finance ministry spends and invests money affects the economy. The extent of the deficit influence the money supply and the interest rate in the economy. High-interest rates mean higher cost of capital for the industry, lower profits, and lower currency prices.

In this example, let’s analyze the impact of Government Budget on various currency pairs and examine the change in volatility due to the announcement of the same. For that, we have collected the data of Canada, where the below image shows the latest Budget that was fixed by the Canadian Government during the reference month. Let us find out the reaction of the market to this data.

USD/CAD | Before the announcement:

The first currency pair which we will be discussing is USD/CAD. The above image shows the exact position of the currency before the news announcement. We see that the market is in a downtrend, and recently the price has pulled back to a ‘supply’ area, and some initial reactions (red candle) can also be seen. Since the impact of the news outcome is less, aggressive traders can take a ‘short’ position with a stop loss above the ‘supply’ area.

USD/CAD | After the announcement:

After the news announcement, we see that the market moves higher, and there is a sharp surge in the price. The volatility increases to the upside the price closes as a bullish ‘news candle.’ Even though the Government Budget was higher than before, it narrowed to 3.58 billion in February from 4.31 billion in the corresponding month of the previous year. This is negative for the economy when analyzing from a yearly perspective. Thus, traders went ‘long’ in the currency and weakened the Canadian dollar.

CAD/JPY | Before the announcement:

CAD/JPY | After the announcement:

The above images represent the CAD/JPY currency pair, where we see that in the first image, the market is in moving within a ‘range,’ and currently, the price seems to have broken below the ‘support,’ showing an increase in the selling pressure. Since the Canadian dollar is on the left hand of the pair, a strong down move indicates a weakening of the currency. Since the price has broken below, we will be looking to sell the currency pair after some consolidation in the market.

After the news announcement, the price crashes below, and volatility extends on the downside. The bearishness in the price is a consequence of the weak Government Budget data that saw a decrease in the value compared to the previous year. Therefore, traders went ‘short’ in the currency pair by selling Canadian dollars. One needs to be cautious before taking a ‘short’ trade as the price is approaching a ‘demand’ area, and buyers can pop up at any moment.

GBP/CAD | Before the announcement:

GBP/CAD | After the announcement:

The above images are that of GBP/CAD currency pair, where we see that the market is in a strong downtrend before the news announcement, signifying strength in the Canadian dollar. We also observe that the price has recently bounced back from its’ lows’ and has crossed the moving average. This could be a sign of trend reversal, which we shall validate based on the outcome of the news.

After the news announcement, the price initially moves higher, but later selling pressure is seen, and the candle closes in the red. Here the volatility is witnessed on both sides of the market, and the price manages to close above the moving average line. The market appears to be volatile even after the news announcement, and we do get a sense of the direction of the market. However, aggressive can go ‘long’ in the market on the basis that the price continues to remain above the moving average, after the news release.

That’s about ‘Government Budget’ and its impact on the Forex market after its news release. If you have any questions, please let us know in the comments below. Good luck!

Categories
Forex Fundamental Analysis

‘Housing Starts’ – The Significant Of This Fundamental Indicator!

Introduction

‘Housing Starts’ Report is a widely used economic indicator by investors and traders to gauge the economic activity of a country. Construction of Houses affects many other dependent sectors like employment, raw material supplies, etc. Hence, we need to understand Housing Starts as part of our overall fundamental analysis.

What are Housing Starts?

Housing Starts refers to those properties whose housing construction activity has started on the foundations. It means only those are counted for which the building activity has crossed beyond the beginning foundation or footing laying stage. Houses for which only pillars and foundations are laid and stopped are not counted in.

This report follows the Building Permits reports, and after this stage, we have a Housing Completion report. Here each of the survey reports signifies different stages of the housing construction activity.

An increase is first observed in Building Permits, which then translates to an increase in Housing Starts and later translates to Housing Completion reports accordingly as the construction activity goes from start to completion. In this regard, understanding which report follows which one and what they mean from an economic viewpoint is crucial, as we will see later in the analysis section.

Housing Starts Report data is divided into the following three main categories:

Single-family homes: A single independent house constructed by a single-family is regarded as Single-family homes. This is the go-to type of home that people go for when they are financially secure and well off.

Townhomes and Condominiums (Condos): These are typically multi-storied or have multiple homes within a single structure that are independently owned. They differ from Apartments mainly in terms of ownership. Different owners own each independent unit.

Multi-family Structures: These would typically include Apartments or large townships which are owned by a single organization and made available on lease.

Economic Reports

The United States Census Bureau releases the Housing Starts reports under “New Residential Construction Survey Report” at 8:30 AM on the 12th working day of every month, which usually falls on 17-18 of every month, on their official website.

The survey is partially funded by The Department of Housing and Urban Development. The data is collected by Census field representatives using interviewing software through laptop computers.

In February, the annual estimates of New Residential Construction are finalized and released for the previous year. Initial estimates of single-family homes sold and for sale are also available every month in the New Residential Sales (NRS) press release as per the NRS Release Schedule. The housing numbers are seasonally adjusted to accommodate the weather dependency on the nature of the housing work to give more statistical accuracy.

How can the Housing Starts numbers be used for analysis?

The Housing Starts number is confused and misinterpreted with its sibling reports, i.e., Building Permits and Housing Completion reports, all signify different stages of economic activity effects. In that sense, Housing Starts numbers are current economic indicators, which means it tells what is going on in the economy right now. Building permits then in relativity is a leading or advanced indicator, and housing completion would be a lagging indicator.

When the government injects money into the economy, loans are available easily, and businesses are stimulated. There would be an increase in employment, which would have resulted in better wages for many. Such an activity would have prompted a rise in building permits, and when the money does reach people, housing starts numbers would see an increase. In this sense, an increase in housing starts tells investors that the economy is moving in a positive direction.

The type of Houses that have seen increase can also tell us the sentiment of people towards the financial future of the economy. An increase in single-family homes would suggest that more people are wealthy enough to afford one and are confident towards mortgage repayment. This also indicates that banks are also giving higher loans to more people, and the economy has more liquid money injected into the system.

An increase in condos or multi-family structures with respect to single-family homes would suggest that people are not comfortable enough to go for expensive homes and would rather save and settle into cheaper alternatives. This is usually prevalent during weaker economic periods, and a significant difference in the numbers can indicate an oncoming recessionary period.

Impact on Currency

An increase in the Housing Starts is reflective of the present current economic conditions. A strong economy would have higher numbers in the housing reports relative to a weaker economy where people would shy away from purchasing single-family homes.

An increase in housing starts reports also implies that demand for construction materials, hiring of labor forces, loans, and other construction-related activities has risen, and the economy is actively generating revenue than before, which is good for the nation and its currency.

Below is a snapshot of the Housing Starts historical report taken from the FRED official website, which shows the economic indicator’s correlation with the national economy’s growth. During times of recession (shaded bars in the background), there have been significant plunges in the numbers and vice versa. The below graph proves the importance of Housing numbers as an indicator of the economy’s performance in our fundamental analysis.

Sources of Housing Starts Index

Given below is the latest Housing Starts report taken from the official website of the Census Bureau. Follow this link for reference. Here, you can find the data related to New Residential Constructions. The St. Louis FRED website has comprehensive data in graphical forms, which will be easier for our analysis. The Census Bureau also explores other related economic indicators related to Housing Activity within the United States.

Impact of the ‘Housing Starts’ news release on the price charts

Housing Starts is one of the leading economic indicators which measures the strength of the housing sector. It shows the change in the number of new residential buildings that began construction during the reported month. The indicator, however, is not said to cause a major impact on the currency, and the volatility during news release will be ‘low.’ So, traders around the world do not pay much attention to this data. However, they do keep a watch on the trend to gauge the economy’s strength in the longer-term. Hence, based on the current data, they make some changes to their current position in the currency.
Many of the countries release the housing starts data on a Monthly and Yearly basis, where today we will be analyzing the month-on-month numbers of Canada. The below image shows previous, forecasted, and actual Housing starts data of Canada, where we see an increase in the number of constructions in the month of February. The Canadian Mortgage and Housing Corporation release the housing starts data of Canada. A higher than forecasted reading is considered positive for the currency, while a lower than expected data is taken to be negative.

CAD/JPY | Before the announcement:

We start our analysis with CAD/JPY currency pair, and the above image shows the state of the pair before the news announcement. We see that the Canadian dollar is in a strong downtrend, and recently it has formed a range that has created areas of ‘support’ and ‘resistance.’ There is of pessimism in the market as the economists and institutional investors are expecting a lower ‘housing starts’ data than before, which is one of the reasons behind the price going lower. Since the market is at the ‘support’ area, it is risky to go ‘short’ in this pair, and thus we need some clarity of the ‘housing starts’ data before entering the market.

CAD/JPY | After the announcement:

After the ‘housing starts’ numbers are out, there is very little change in volatility, which was expected as it is not a highly impactful event. The price initially goes up, which is a result of better than forecasted ‘housing starts’ data, but it gets immediately sold, and the candle closes at the opening price. The selling pressure is seen because even though the data was better than expected, it was still lesser than previous data, and this is negative for the currency. As the volatility is less and the price is at the ‘support’ area, we do not recommend a ‘short’ trade as the risk-to-reward ratio is unhealthy.

EUR/CAD | Before the announcement:

CAD/JPY | After the announcement:

The above images represent the EUR/CAD currency pair, and since the Canadian dollar is on the right-hand side, weakness in the Canadian dollar should take the currency higher, which is why the market is going up in the above pair. The ‘range’ before the news announcement seems to be much more established and clearer than in the previously discussed pair. Since price is close to the ‘resistance’ point, a positive ‘housing starts’ data can be an opportunity to go ‘short’ in the currency pair.

After the news release, we see that the candle closes with a wick on the top indicating strength in the Canadian dollar. Since the data was positive for the economy, one can take a ‘short’ trade expecting the volatility to expand on the downside. We should not forget that since the data does not have much impact, our ‘take-profit‘ for the trade should be the recent ‘support’ area.

NZD/CAD | Before the announcement:

NZD/CAD | After the announcement:

The next currency pair which we will be discussing is NZD/CAD, and in the first image, we see that the market is in an uptrend trying to make a new ‘higher high.’ This shows the amount of weakness in the Canadian dollar and the strength of the New Zealand dollar. As we have explained that the event does not cause much volatility in the pair, taking any position against the trend would be very risky.

After the news announcement, the Canadian dollar shows some strength owing to positive ‘housing starts’ data but not enough to take the price lower. This minimum volatility is a sign that once cannot go ‘short’ in the pair and instead look to join the trend.

That’s about ‘Housing Starts’ and its impact on the Forex market after its news release. If you have any questions, please let us know in the comments below. Good luck!

Categories
Forex Fundamental Analysis

Importance Of ‘Housing Index’ In Gauging The Strength Of An Economy

Introduction

Housing Index is a broad and long term metric for investors and traders to judge the Housing Market in a country or specific region. There is a good correlation between the Housing Market, Stock Market, and economic growth. Housing Markets generally reflect the health and strength of the economy. Hence, the Housing Index serves as a pulse check or double-check for traders to affirm their economic assessments.

What is the Housing Index?

It is a measure of changes in the price movement of single-family houses. It generally measures the changes in residential housing prices as a percentage change from an index period (base period). The Housing Price Index for the base period is 100, and subsequent reports measure the change relative to this period.

For example, an HPI of 110 indicates a 10% appreciation in the single-family housing prices in a region. Hence, it is a direct measuring tool for housing price trends and serves as an indirect measurement tool for housing affordability, mortgage default rates, and prepayments, etc.  It is often expressed as change with regards to the previous month in percentage also.

Although different agencies are measuring the Housing trends, the most prevalent is the Housing Price Index by the Federal Housing Finance Agency in the United States. The FHFA HPI is a weighted, repeat sales index. It means it takes Houses that have also been refinanced into account. This data is obtained from reviewing the repeat mortgage transactions on single-family properties that have been securitized by Fannie Mae or Freddie Mac.

The HPI covers the entire 50 states, and also publishes for the nine Census Bureau Divisions, for Metropolitan Statistical Areas (MSA) and Divisions for more specific and detailed analysis.

How can the Housing Index numbers be used for analysis?

Housing Index is a widely used economic indicator by traders and investors. It gives a head check to the economic health of a country or region.

Generally, people buy houses through mortgages. When the Housing Price rises, it indicates that the market or citizens can pay for much higher rates. It indicates that the liquidity of the economy is good.

Secondly, people buy homes using mortgages most of the time, and it indicates the ease of obtaining a loan from banks at cheaper interest rates. It indicates that the bank has enough reserves to dish out mortgage loans at such low rates. It ultimately means the economy has an actively circulating wealth in the system.

Rising Housing Prices are accompanied by wage growth, employment in the construction industry, especially. It also stimulates confidence for the owners of Houses to know that they have a high-value asset with them that generally translates to increased consumer spending. Overall the total demand increases, boosting the economy and resulting in a higher GDP print.

When the Housing Prices fall, it indicates that consumers are less willing to purchase Houses as they are less confident about their future financial security. It can also indicate that banks are also lending at higher interest rates that are not affordable by middle and lower-middle-class families. The Housing Sector slowing down is a reflection of the economy in this sense. Slowdown accompanied by Mortgage defaults can be warning signs for investors, and traders about an oncoming slowdown or recession.

The below graph confirms our analysis as the housing prices fall during recession periods. As it can be seen that the Housing Index is not market sensitive and does not fluctuate to temporary shocks and instead, it has a trend that builds up over a time frame of certain months or years. Hence, it is a better tool for long term trends than a short-term trend.

Impact on Currency

The Housing Price Index is a coincident and lagging indicator in the short run, as it is a consequence of what has already happened in the economy. When the citizens feel confident about their financial security sufficiently, then only would they take a step to purchase a house. Hence, the Housing Price Index is a confirmation of a trend that would have been predicted by the leading economic indicators.

But for investors and traders who are looking for long term trends, the Housing Price Index acts as an efficient tool to assess current market prices and use it to predict the trend.

Potential shifts in the Housing Price Index can move the stock markets. The currency market movement depends on the strength of the economy.

When compared with indicators like Building Permits and Housing Starts, it relates to as a coincident indicator. In the long run, it can be used as a leading indicator to spot the trend that has already begun.

It is a proportional indicator, meaning when the Housing Price Index rises, it has a ripple effect through jobs, wages, and other industries related, and hence increased economic activity translates to higher GDP prints and appreciating currency.

Economic Reports

The Housing Price Index (HPI) is released by the Federal Housing Finance Agency (FHFA). It gets data from Fannie Mae and Freddie Mac, which are Government Sponsored Enterprises (GSE).

It releases monthly and quarterly reports for HPI on its official website. The dates for the subsequent year are already announced and are typically released at 9:00 AM on the specified date.

Many other agencies provide Housing Indices, one such popular one is the S&P’s Case-Shiller Index, which uses a slightly different approach in measuring the Housing Prices.

Sources of Housing Index

The Housing Price Index from FHFA is available here

All the current and previous reports are available here

We can find the different Housing Indices on the St. Louis FRED website here

We can find Housing statistics for various countries in the statistical form here

Impact of the ‘Housing Index’ news release on the Forex Market 

In the previous section, we discussed the House Price Index (HPI) economic indicator, which essentially is a measure of the single-family house prices movement, with mortgages backed by government-sponsored enterprises. This report helps to analyze the strength of the country’s housing market and the economy as a whole. The house price index contributes only a small portion of the GDP of the country. Thus investors do not give much importance to the news release.

In today’s example, we will be exploring the impact of the announcement of the U.S. House Price Index on different currency pairs and witness the change in volatility. A higher than expected number is considered to be positive for the currency, while a lower than expected reading is taken negatively. This report is published by the Federal Housing Finance Agency. The above image shows an increase in the value of the House Price Index from the previous month, which should be positive for the currency. Let us see how the market reacts to this data.

USD/JPY | Before the announcement:

Let’s begin with the USD/JPY currency pair and try to analyze the impact on the pair. As we can see in the above chart, the price is an overall uptrend and recently has retraced to a ‘demand’ area. Looking at the price, we can say that the price might move higher and continue the uptrend, but we need to wait and see if the news announcement causes major changes to the dynamics of the chart.

USD/JPY | After the announcement:

After the news announcement, the price sharply moves higher, and we see a bullish ‘news candle,’ indicating that the House Price Index data was positive for the economy. The volatility, which was quite less before the news release, suddenly increases to the upside after the release. This was a result of the increase in the House Price Index by 0.2% for the current month, which made traders go ‘long’ in the U.S. dollar. This is a confirmation sign that the market will further move up.

USD/CHF | Before the announcement:

USD/CHF | After the announcement:

The above images represent the USD/CHF currency pair where we that before the news announcement, the market is in a downtrend, and currently the price is at the lowest point. This means the U.S. dollar is showing weakness in this pair, or Swiss Franc is strong. When the price is strongly moving lower, it is not recommended to have any ‘buy’ positions as it could be very risky. Thus, it is better to wait for the news release and gain some clarity about the data. Based on the data, we can take a position in the market. After the news announcement, there is a sharp rise in the price and a spike in volatility to the upside. This again came from the fact that the House Price Index news data was better than last time, which brought cheer in the market and made investors buy more U.S. dollars. The bullish ‘news candle’ is a sign of trend reversal that could be extended further.

GBP/USD | Before the announcement:

GBP/USD | After the announcement:

The above images are that of the GBP/USD currency pair, where we see that the overall trend of the market is down, and recently the price has pulled back from its ‘lows.’ Here, since the U.S. dollar is on the right-hand side of the pair, a down-trending implies strength in the U.S. dollar. We will be looking to trade this pair after we see some trend continuation patterns in the market, indicating that the downtrend will continue. After the news announcement, the price falls by a good amount, and the volatility increases to the downside. The bearish ‘news candle’ signifies that the House Price Index news was positive for the economy that took the price lower and increased the selling pressure.

That’s about the ‘Housing Index’ and its impact on the Forex market after its news release. If you have any questions, please let us know in the comments below. Good luck!

Categories
Forex Fundamental Analysis

The Significance of ‘Imports’ Data In Determining A Nation’s Economy

Introduction

Imports are one of the components of International Trade. The Import and Export figures determine whether a country is running a Trade Surplus or Deficit. What and how much a country is importing in contrast to its exports mainly drives economic growth. It is crucial to understand Import’s role in a country’s International Trade Balance and Balance of Payments and its pros and cons.

What is Imports?

The foreign goods and services sold to domestic consumers are called Imports. Goods and Services manufactured in a foreign country consumed by the domestic population all come under Imports. When a country is importing more compared to its exports, it is said to have a trade deficit. A trade deficit is generally bad for the economy as it means it is consuming more than it is earning.

An import is noted as a debit in the Balance of Payments in the Current Account Balance Reports. When a country imports money flows out of the country. An export brings money into the economy. Hence, Import is analogous to an individual’s monthly expenses, and exports are analogous to his income. It is not ideal for us to spend more than we earn for long periods as it could pile up a massive debt from which we may not be able to recover. A country running a trade deficit is no different.

A country needs to borrow capital to finance its excess import or net import (imports minus exports). It is always preferable for mature economies to be a net exporter than a net importer.

A trade deficit is not a bad thing always as countries might be importing raw materials for future projects and constructions whose output is not yet recorded. The United States has continued to be a net importer and has been running a trade deficit since 1975. Hence, what a country is importing and for what purposes is vital to understand its implications on the economy.

How can the Imports numbers be used for analysis?

A country imports generally the goods that they either cannot produce domestically or as cheap as other countries. Countries that naturally do not have the natural resources may import their raw materials from nations that are abundant in it. For example, China imports Iron Ore, which Australia exports for its manufacturing industries.

Countries may also import goods for which labor cost is expensive in the home country compared to other countries. For example, NAFTA agreement shifted Car and Automotive parts manufacturing to Mexico from the United States and Canada due to cheap labor availability.

Countries also often import goods and services in which they do not have a competitive edge in the global market. For example, even though Apple is an American Company, its production of phones is done in China as the production cost is low due to well-established infrastructure for electronic and chip manufacturing industries.

Imports are to be offset by corresponding levels of exports ideally, otherwise end up having a trade deficit which can be harmful in the long run. As the country keeps borrowing, the piling debt slowly starts crippling the economy as much of the revenue goes into servicing interest payments and debt repayments in the long run.

The heavy dependence of an economy on imports from a particular foreign nation or small group of nations can be dangerous as the economy’s function becomes dependent on the trades. It would be more crippling if the Imports are necessities like food or energy. For example, the USA faced an oil shortage and went into recession when OPEC cut its oil supply to the USA.

Imports are subject to trade tariffs and trade agreements. Imported goods and services compete with local produce, and the selling price of the corresponding goods differs based on the import tariffs implemented by the Government.

On the one hand, importing goods at a lower price rather than producing domestically at a higher price seems reasonable to some as it gives consumers goods and services at a lower rate avoiding inflation effects. On the other hand, imports affect the local manufacturing sectors in the same category. Foreign Competition can wipe out local businesses, which can, in turn, slow down the economy.

In the long run, exports stimulate growth while imports impede growth. Hence, Import is a double-edged sword that needs to be handled carefully in conjunction with exports to strike a correct-balance in the Balance of Trade.

Impact on Currency

When a country imports the country pays for it, and hence currency flows out of the country. When a country’s imports outweigh its exports (net importer), the domestic currency is in oversupply in the global market, and hence currency value depreciates.

A sudden surge in imports over exports is followed by currency depreciation and vice-versa. The global FOREX market is self-regulating and adjusts to such shocks, and the Government can intervene to peg their currency higher to reduce the cost of imports. Japan and China are good at winning this type of Currency War games in the global markets where they peg their currency high during imports and low during exports to maximize benefits in their favor.

Economic Reports

Imports form part of a country’s Balance of Trade, which is reported under the Current Account Balance part of the International Balance of Payments Report of the country. The Balance of Payments report is released quarterly and annually for most countries. The Balance of Trade reports are published every month, which consists of Exports and Imports figures.

For the United States, the Bureau of Economic Analysis publishes the monthly Balance of Trade reports on their official website in the first week of every month for the previous month.

Sources of Import Reports

Data related to U.S. Imports can be found here. The World Bank also publishes the World Trade reports of many countries categorized by different sectors in their World Integrated Trade Solution’s official website. We can also get the statistical data of Imports and Exports of various countries from the International Monetary Fund’s official website.

Visual representation of a country’s imports can be accessed here. Below is the illustration of the same. 

Impact of the ‘Imports’ news release on the price charts 

Until now, we have learned all about imports and the different ways it can affect the economy and the currency. Imports offer many benefits to the consumer of the importing nation, such as greater choices, a wide range of quality, and access to lower-cost goods and services. Imports create healthy competition in the domestic market, forcing local producers to improve their quality or by reducing costs. Therefore, if imports are kept at a reasonable level, they can be beneficial to companies, consumers, and the economy. We need to change the method in which the value o trade is measured.

In today’s illustration, we will be analyzing the impact of Imports on different currency pairs and see the change in volatility before and after the news announcement. The below image shows the latest Imports data of the United States, where it says that there has been a reduction in the net Imports from the previous month. Let us find out how the market reacts to this data.

USD/JPY | Before the announcement:

The first pair we will be discussing is the USD/JPY currency pair and where the above image shows the state of the chart before the announcement. We see that the market does not appear to be moving in any single direction, which means there is volatility on both sides, and there is confusion prevailing in the market. Traders need to watch the impact of the news announcement and then take a suitable position.

USD/JPY | After the announcement:

After the news announcement, the price sharply falls lower, and volatility expands on the downside. As there was a reduction in the value of Imports, the market reacted negatively to this data by causing weakness in the U.S. dollar. The long bearish ‘news candle’ is an indication of the continuation of the downward move, and so, one can take a ‘short’ position in the currency after the news release with a stop loss above the recent ‘high.’

GBP/USD | Before the announcement:

GBP/USD | After the announcement:

The above images represent the GBP/USD currency pair, where we see that, in the first image, the market again is not trending in any direction, and currently the price is at the ‘supply’ area. Therefore, we can expect sellers to come back into the market and stimulate selling pressure. Since the impact of Imports data is moderate to high, it is advised to wait for the news release to see what changes it will cause in the price. After the news announcement, there is a sudden surge in the price where the ‘news candle’ closes with a fair amount of bullishness. Since the U.S. dollar is on the right hand of the pair, a rise in the price indicates weakness in the currency. As the Imports were lower, traders increased the volatility to the upside by selling a lot of U.S. dollars. From a ‘trade’ point of view, we will go ‘long’ in the market only after the price breaks the ‘supply’ area and moves higher.

AUD/USD | Before the announcement:

AUD/USD | After the announcement:

The above images are that of the AUD/USD currency pair, where we see that the market is in an uptrend, and at present, it looks like the price on the verge of continuing the trend after a price retracement. The price is currently at the previous ‘high,’ so we can sellers become active at this point. Thus, we should not take any position before the news release. After the news announcement, the price goes higher and closes as a bullish candle. As the Imports are relatively weak, traders sold U.S. dollars and increased the volatility to the upside. This could be a confirmation sign of the continuation of the trend. Aggressive traders can take ‘long’ positions with a stop loss below the recent ‘low.’

That’s about ‘Imports’ and its impact on the Forex market after its news release. If you have any questions, please let us know in the comments below. Good luck!

Categories
Forex Fundamental Analysis

‘Households Debt to GDP’ – What Should You Know About This Economic Indicator?

Introduction

Households Debt to GDP is an indicator of ascertaining the financial soundness of the economy. There is a certain amount of healthy correlation between the Households Debt and GDP, and by understanding this ratio correctly, we can predict major economic events with reasonable confidence. This metric has gained more attention around the time of the global financial crisis of 2008. Hence, understanding this metric is important in understanding long-term macroeconomic trends.

What is Households Debt to GDP?

Household Debt

It refers to the total debt incurred by households only. All the monthly debt payments people owning a home are taken into consideration. The debt can be of any type like mortgage loan, student loan, auto loan, personal loans, credit cards. Any form of credit for which you are paying back from your income is a debt in this context.

But, merely measuring household debt without any relative quantity to ascertain the burden of debt to an individual is not useful. For example, a country earning 100 billion dollars in a year having a debt of 70 billion dollars can be burdensome. While a nation making 200 billion dollars would be comfortable paying off this debt and still afford to invest in public spending and other activities. It is this relative context that appropriately paints the macroeconomic picture of a nation in front of us.

On the Macroeconomic level, GDP is equivalent to the income of the nation, and the portion of that income that goes into servicing debt payments determines what is left for other activities. The debt burden can also be measured in different forms, like by taking the ratio of the debt to disposable income or pre-tax income (gross income).

How can the Households Debt to GDP numbers be used for analysis?

The household debt impacts the Personal Spending (which is the amount left after deducting necessary expenditures from the Disposable Personal Income, DPI). High debt results in lower spending, which promotes saving and discourages spending. When spending is reduced, the demand falls in the market, and businesses enter a slowdown.   Expansionary plans are rolled back, and employees are laid off, resulting in deflationary conditions overall.

The financial crisis of 2008 – From 1980 to 2007, the increase in debts due to the low-interest rate environments stimulated the economy beyond its sustainable levels, which resulted in extended spending by individuals buying houses all over the United States.

Once the individuals bought their homes, till then, the market and economy were seeing a boom, but soon reality hit when people started repaying the debt, which reduced the overall spending that resulted in a slowdown of the overall economy. What happened here is, the government tried to give an artificial boost to the economy, which although sped up the economy for some time, it later dragged the economy back to the extent that even today, the economy’s growth rate is lower than it should be.

The debt burden led to a global financial crisis in many countries where loan defaults were becoming increasingly common. Many people just abandoned their house and debt, due to which the real estate market fell, the investors lost money, the stock market crashed. All this resulted in an economic collapse in the United States. Similar patterns followed throughout the world in many countries.

Historically, when the Households Debt reached 100% of GDP, the economy took a severe downturn and went into recession. The years leading up to the financial crunch, i.e., 2007, many industrialized countries experienced a major spike in Households Debt. Countries that experienced 100 and above percentage figures in the Households Debt to GDP ratio experienced the Credit Crunch and entered a prolonged slowdown period. In the below plot, we can see during the recession (shaded region), the Households Debt to GDP reached around a hundred percentage.

Impact on Currency

The Households Debt to GDP percentage figure is an inverse indicator. The higher numbers are bad for the economy and the currency. Lower values mean that either the debt has reduced, or the GDP has increased, or both. It is suitable for the economy, and the currency appreciates.

Since GDP is a quarterly figure, and hence the ratio numbers are also released quarterly. Also, the Households Debt to GDP is a long-term number, in the sense that the numbers will not rise or fall overnight. It may take years to build-up or go down. Hence it is a low-impact indicator as it is indicative of the long term trend and does not reflect the current short term trends in the economy.

But, Households Debt to GDP can be used to analyze severe economic downturns like that of 2008’s financial crisis. In this sense, investors, economists can use this statistic to predict any shocks that may occur in the future.

Economic Reports

The International Monetary Fund ( IMF) releases the Financial Soundness Indicators (FSI) for many economies based on the data they receive from the individual countries. There are no fixed release dates of the report’s release, as they compile and publish once they receive information from the source countries. The FSI data goes back to 2008 for many countries, but for some, it goes back to 2005.

The IMF FSI reports contain different types of loans and their ratios to GDP and other metrics that are available on their official website.

For the United States, the Board of Governors of the Federal Reserve System releases the report titled “Financial Accounts of the United States – Z.1”, also called Z1 reports, quarterly on their official website. This report gives the Households Assets and Liabilities and Net Worth, the charts show the balance sheet of households and non-profit organizations to DPI.

Sources of Households Debt to GDP

  • IMF FSI reports are available here.
  • United States Assets and Liabilities report can be found here.
  • The above-mentioned figures are available in the St. Louis FRED website.
  • Compilation of the Households Debt to GDP for all major economies is available here.

Impact of the ‘Households Debt to GDP’ news release on the price charts

After understanding the Household Debts to GDP economic indicator, we will now proceed and analyze the impact of the same on the country’s currency. The Household Debt to GDP is a metric that measures the country’s public debt to its Gross Domestic Product (GDP). From the definition, it is clear there exists an inverse correlation between the indicator and value of the currency. When there is an increase in the value of the indicator, it means people’s debts are increasing, and consumer spending is reducing. This negatively impacts the economy and, thus, the currency, whereas a decrease in Household Debts is positive for the currency.

In today’s example, let’s analyze the Household Debts to GDP data of India and find out the impact of the same on Indian Rupee. As we can see, India’s Household Debt accounted for 11.3% of the country’s Nominal GDP in March 2019, compared to the ratio of 10.9%  in the previous year. The year-on-year data is said to have a long term effect on the currency, and hence we are observing the impact on the ‘daily’ time frame chart.

EUR/INR | Before the announcement:

We first look at the EUR/INR currency pair, where we see that the price is in a major downtrend and has been moving in a range from the past two months. Just a few days before the news announcement, the market has retraced the downtrend partially and is on the verge of continuation of the trend. Technically, it is judicious to go ‘short’ in this pair as it is the best way to trade the trend. Now we only need confirmation from the market in terms of the market going below the moving average after the news release.

 EUR/INR | After the announcement:

After the news outcome, the market moves a little higher owing to weak Housing Debt to GDP data, and traders around the world sell Indian Rupee. There is an increase in volatility to the upside, but on the immediate next day, the market gets sold into. This means that even though the data was unhealthy for the Indian economy, it wasn’t as bad to take the price much higher and result in a reversal of the trend. Therefore, we enter the market for a ‘short’ trade only after the price slips below the moving average, and volatility increases on the downside.

GBP/INR | Before the announcement:

GBP/INR | After the announcement:

The above images represent the GBP/INR currency pair, and as we can see, the market has reversed the downtrend of 2018 and is currently in an uptrend. This up move started at the beginning of the year and has been new ‘highs. Before the announcement, the price seems to have made a top and might be going down to the ‘support’ area to resume the up move. Since we do not have the forecasted data of the indicator, we cannot take any position in the market. After the news announcement, the market does not fall much, nor does it go higher. This means the HOUSING DEBT TO GDP data was neutral for the economy and thus for the currency. As the change in HOUSING DEBT TO GDP was not drastic, we do not witness substantial volatility during the announcement. The ‘trade’ idea for this pair is similar to the above-discussed pair, where we go ‘short’ in the pair once the price goes below the moving average.

CAD/INR | Before the announcement:

CAD/INR | After the announcement:

In the CAD/INR currency pair, we see a retracement of the big downtrend of 2018 in the form of an uptrend, similar to the GBP/INR pair. One major difference is that the uptrend in this case not very strong and is unable to make new ‘highs. This means the down move is having more influence on the pair and that the up move might get sold into anytime. If the Housing Debt to GDP data were to be positive or neutral for the Indian economy, we could join the downtrend after suitable confirmation from the market. After the Housing Debt to GDP data is released, the price suddenly falls below the moving average, and volatility increases on the downside. A bearish ‘news candle’ shows the impact of the news on this pair, and we can conclude that Housing Debt to GDP data did not prove to be negative for this pair.

That’s about ‘Household Debts to GDP’ and how this economic indicator impacts the Forex market. For any queries, let us know in the comments below. Good luck!

Categories
Forex Fundamental Analysis

‘Leading Economic Index’ – Understanding This Forex Fundamental Driver

Introduction

Business people, Investors, and Politicians are often more interested in where the economy is heading than where it has been in the past or where it is right now. In this regard, the Leading Economic Index receives more attention than Coincident Index indicators or any individual economic indicators.

Leading Economic Index gives a more accurate snapshot of the future economic trend than any individual leading or coincident indicator. In this sense, the Leading Economic Index is essential to observe the economy’s ‘big picture’ better.

What is the Leading Economic Index?

Leading Economic Index is an amalgamation of multiple leading economic indicators that give us a better snapshot of the economic prospects of the country.

Economic Activity Index: The Economic Activity Index for the states presently includes five indicators, namely: non-farm employment, unemployment rate, average hours worked in manufacturing, industrial electricity sales, and real personal income minus transfer payments. It is a Coincident Economic Index that tells us the current economic situation in the broader sense. The below table summarizes the composition of the Economic Activity Index.

The Leading Economic Index uses the Economic Activity Index for each state as well as various state, regional, and national variables to predict the nine-month-ahead change in the state’s economic activity index. This estimate of the nine-month percentage change in the state’s current Economic Activity Index is the state’s Leading Index.

Hence, by using a mix of coincident indicators, leading indicators, and other variables, the Leading Economic Index is constructed. The below table summarizes the composition of the Leading Economic Index.

The Leading Economic Index has the base period 1992, i.e., the Leading Economic Index score for the year 1992 is 100. Based on this period, all subsequent index periods are scored.

A score below 100 is observed as contractionary. A score above 100 is seen as expansionary for the economy. The Leading Economic Index uses a time-series model (vector autoregression). The current and prior values of the forecast are combined to determine the future values of the index.

Below is a snapshot of the Leading Economic Index of the three districts and the USA:

(Source – Philadelphia Fed)

How can the Leading Economic Index numbers be used for analysis?

Individual economic indicators like Initial Unemployment Claims, Purchasing Manager’s Index from the Institute of Supply Management, Employment rate can often give conflicting signals.

No one indicator can give us the broader economic outlook that we are seeking to have. It is often preferred to have an idea on different sectors (private, public, or manufacturing, services, or business, consumer) and different economic indicators to obtain a complete macroeconomic picture.

An economy consists of many moving parts, imports, exports, jobs, businesses, banks, money supply, etc. all these economic levers push or pull the economy. With so many levers in place, it is indeed difficult for the common man to know for sure the overall economic condition. The geography also plays a part, a slow down in one state does not necessarily translate to the overall economic slowdown, it might even be the case ten other states have improved above average.

In this regard, the Leading Economic Index is useful to get the big picture more accurately. As shown in the below plot, for Pennsylvania, four recessions since 1970 have been preceded by a minimum of three negative readings. The Leading Economic Index is generally measured as a change in percentage concerning the previous month score.

(Source – ST Louis Fed)


Impact on Currency

Improvement in the Leading Economic Index figures signals an expansionary growth in the economy ahead, which is appreciating for the currency and vice-versa.

In this sense, the Leading Economic Index is a leading and proportional economic indicator, i.e., it forecasts growth and the increase or decrease in figures generally translate into improvement or deterioration of the economic growth.

The Leading Economic Index is a low impact indicator as the data from the individual indicators that make up the Leading Economic Index would have already been released a week before, and the corresponding market short-term moves would have already taken place. Although, the long-term trends and forecasting power of the Leading Economic Index makes it a suitable tool for investors and long-term traders to assess economic direction over a time horizon of 3-6 months better.

Economic Reports

The Federal Reserve Bank of Philadelphia releases the Leading Economic Index for all of the 50 states. The Indexes are released every month generally a week after the release of the composing coincident indicators. The release dates for the upcoming year’s Leading Economic Index reports are already posted on its website.

Sources of the Leading Economic Index

The State’s Leading Economic Index is available on the official website of the Federal Reserve Bank of Philadelphia:

Leading Economic Index – FRB -P

Release Schedule – Leading Economic Indexes

The Leading Economic Index and the Coincident Economic Activity Index are also available on the St. Louis FRED website:

Leading Economic Index – FRED

Coincident Economic Activity – FRED

The Leading Economic Index for various countries are available here in statistical and list form:

Impact of the ‘Leading Economic Index’ news release on the price charts

In the previous section, we described the Leading Economic Index fundamental indicator, where we said that it is a composite index that is based on nine economic indicators and is used to predict the direction of the economy. The data is gathered from economic indicators related to consumer confidence, housing, money supply, stock market prices, and interest rate spreads. The report tends to have a relatively muted impact on currency pairs because most of the indicators that are used in the calculation are released previously.

The below image shows the previous and latest data of Leading Economic Index indicator, where we see a decrease in 0.4% compared to the previous month. A higher than expected data should be taken to be positive for the currency and vice-versa. Let us observe the change in volatility due to the news release.

AUD/USD | Before the announcement:

The above image shows the chart of the AUD/USD currency pair before the news announcement. We see that the price is in a downtrend, and recently it has formed a ‘range.’ This looks like a retracement where the price may continue its downtrend after touching a key technical level. Depending on the news data, we shall take an appropriate position in the market.

AUD/USD | After the announcement:

After the news announcement, the price falls and goes below the moving average, indicating that the Leading Economic Index data was negative for the economy. As there was a decrease in the value, traders went ‘short’ in the currency pair and increased the volatility to the downside. This was accompanied by another news event that was positive for the Australian dollar, and hence we see the sharp rise in price. Nonetheless, the Leading Economic Index was bad for the economy due to which the currency weakened initially.

AUD/CHF | Before the announcement: 

AUD/CHF | After the announcement:

The above images represent the AUD/CHF currency pair, where we see that the characteristics of the chart are similar to the above-discussed pair before the news announcement. Here too, the market is in a downtrend signifying weakness in the Australian dollar, and the price has pulled back from its ‘lows’ recently. There is a possibility that the downtrend might continue depending on the outcome of the news. After the news announcement, the market moves lower, and the price closes as a bearish ‘news candle.’ Since this announcement followed another news release, one needs to be cautious before taking any position in the market. If we are to analyze this data alone, we can expect an increase in volatility to the downside, leading to further weakening of the currency.

EUR/AUD | Before the announcement: 

EUR/AUD | After the announcement:

The above images are that of the EUR/AUD currency pair, and here, the market is an uptrend before the news announcement. Since the Australian dollar is on the right- hand side of the pair, an up-trending market indicates weakness in the currency. The price is currently moving in a ‘range,’ and just before the news release, it is at the bottom of the range. Ideally, this is the ideal place for going ‘long’ in the market. Aggressive traders can take a ‘long’ position with a stop loss below the support. After the news announcement, we see that the market moves higher, and the bullish ‘news candle’ indicates weak ‘Leading Economic Index’ data where there was a reduction in the value for the current month. Compared to the other fundamental drivers, the Leading Economic Indices news release would have taken the currency higher, and high volatility would be witnessed on the upside. Therefore, we need to keep a watch on the economic calendar to be aware of all the news announcements.

That’s about the ‘Leading Economic Index’ and its impact on the Forex market after its news release. If you have any questions, please let us know in the comments below. Good luck!

Categories
Forex Fundamental Analysis

Understanding ‘Manufacturing PMI’ & Its Impact On The Forex Market

Introduction

The Manufacturing Purchasing Manager’s Index is an excellent leading or advanced macroeconomic indicator, which is used widely to predict economic expansion or contractions. It has a variety of applications for investors, economists, traders alike. It is a significant indicator to predict GDP, employment, and inflation in the upcoming periods. Hence, understanding of Manufacturing PMI can be hugely beneficial for a trader’s fundamental analysis.

What is Manufacturing PMI?

The Manufacturing Purchasing Manager’s Index is a survey of about 400 largest manufacturers in the United States of America. The word Manufacturing here implies that the study is associated with the industries that produce physical goods. Non-physical goods come into the category of Services Purchasing Manager’s Index, which is different.

Purchasing Managers in a company are the employees associated with procuring the raw materials, goods, and services that are required for running the company. For example, A car manufacturing company’s Purchasing Manager would typically be in charge of procuring nuts and bolts at the lowest or best prices from the market. The Purchasing Manager’s in this sense have a good idea of what the company requires and during what periods these requirements are set to increase or decrease.

How is the Manufacturing PMI calculated?

The Manufacturing PMI hence is a compilation of the survey answers given by the Purchasing Managers of the largest 300 manufacturing giants in the USA. The questions typically involve asked in the survey are related to month-over-month changes in the New orders, Production, Employment, Deliveries, and Inventories with equal weightage, as shown in the table below:

All the five categories, as seen when putting together, form the PMI. These five components are enough to ascertain a growth or contraction in the business activity of that company.

The Manufacturing PMI rating lies within the range of 0-100, where a score of above 50 indicates an expansion in the economic activity in the manufacturing sector, below 50 indicates contraction and 50 indicates no change in comparison to the previous month.

Economic Reports

In the United States, the Institute for Supply Management widely known in short as ISM releases the Manufacturing Purchasing Manager’s Index every month.

The ISM, established in 1915, is a large non-profit organization in its field. The members of the ISM Business Survey Committee (BSC) receive the questionnaire each month, asking them to identify the monthly changes for each index.

The ISM releases its Manufacturing PMI on the first business day of every month. The data for the Manufacturing sector goes back to 1947.

There are other companies that also publish PMI numbers, and IHS Markit Group is one such company that puts out numbers for the companies outside of the United States. Still, within the United States, the Insitute for Supply Management’s PMI is the most popular.

How can the Manufacturing PMI be Used for Analysis?

The data of ISM Manufacturing Reports on Business or the PMI goes back to 1947 due to which the data is robust and has high levels of confidence in ascertaining economic figures like GDP, inflation and employment, etc.

The Manufacturing sector of the United States makes up 20% of the total GDP, and hence the Manufacturing PMI is a significant economic indicator in that regard. The Manufacturing sector primarily drives the economic activities within the nation as it involves physical goods; hence it affects other dependent industries like transportation, labor force, etc.

The historical correlation between the real GDP and the ISM Manufacturing Data is about 85%, which is pretty good. The main advantage of studying Manufacturing PMI is that it is a leading or advanced economic indicator. It predicts the real GDP with a 12-month time lag, meaning it predicts a year ahead of time the real GDP due to which this index is widely sought after by investors.

A score of 80 and above has been correlated with a 3% average real GDP growth historically. A score of 70-80 correlates with 0-2% GDP growth rate and 55-70 correlates with -3% to 0% real GDP rate. Hence, above 50 indicates the overall economy is growing, and below 50 indicates contraction and possible recession.

Based on the Manufacturing PMI of different sectors, Suppliers can adjust their prices with the market. For example, if a cereal producing company’s Manufacturing PMI indicates expansion, then the crop suppliers can change their prices to a higher level to match the increase in demand and vice versa.

Below is a snapshot of Manufacturing PMI plotted against the real GDP growth rate historically, and we can clearly see the healthy correlation that exists between both. This shows the importance of this leading indicator’s importance in fundamental analysis of traders.

Impact on Currency

Since the United States is the largest economy, the US GDP drives the global GDP. In this sense, monitoring Manufacturing PMI gives us a good clue of the direction of the US economy and the relative direction of other economies. From this perspective, we can ascertain the currency direction also.

The further the score is away from 50 and closer towards 100, the better it is for the economy and resultantly for the currency. Higher scores translate to oncoming currency appreciation periods, while low scores would signal an oncoming recession and currency depreciation period.

A score of 85 and above is a strong signal for improving economic conditions and inflation in the economy.

Sources of Manufacturing PMI Reports

We can monitor the reports on the official website of the ISM. We can also go through the PMI of other countries from the IHS Markit official website.

Impact of the ‘Manufacturing PMI’ news release on the price charts

The Manufacturing Purchasing Manager’s Index (PMI) measures the activity of the purchasing managers in the manufacturing sector. The indicator is particularly important for the manufacturing industry, which measures the growth of that sector; this eventually contributes to the growth of the economy. Therefore, the index has a direct and indirect effect on the economy. When speaking about the impact on the currency, the indicator does not cause a drastic change in volatility, but we do witness some positions being build up in the currency during the announcement.

In this section, we will be analyzing the latest Japanese Manufacturing PMI which was released in the month of March. The below image shows the previous and actual PMI data, where we see an increase in PMI from before. A higher than before PMI reading is considered to be bullish for the currency, while a lower PMI than before is taken to be negative. Let us view the reaction of the market in this case.

AUD/JPY | Before the announcement:

We start our analysis with the AUD/JPY currency pair, and as we can see in the above chart, the market is in an uptrend pointing towards weakness in the Japanese Yen. One of the reasons is that the market is expecting a subdued PMI data this time which is making the pair go higher. The only way to trade this pair is if the PMI data of Japan comes out to be very positive, which could result in a reversal and strength in the Japanese Yen. However, if the data proves to be negative, we cannot join the trend until we get a retracement.

AUD/JPY | After the announcement:

After the PMI numbers are announced, we see a sudden surge in volatility on the upside as the data was negative for the Japanese economy. As the numbers were disappointing, traders sold the Japanese Yen and took the price higher. A strong bullish candle shows the impact of PMI data on the currency pair. From a trading point of view, one cannot enter the market for a ‘buy’ soon after the news release. By doing this, he would be chasing the market, which is against the principles of risk management.

NZD/JPY | Before the announcement:

NZD/JPY | After the announcement:

The above images represent the NZD/JPY currency pair, which again is in a strong uptrend, but the up move is not as aggressive as in the case of the AUD/JPY currency pair. Just before the news announcement, the price appears to be at the ‘resistance’ area, which means if the PMI data comes out to be negative for the economy, we can see a breakout on the upside or if the data is positive, it could result in a short-term reversal.

After the PMI data is released, volatility expands on the higher side, and later the candle closes with a wick. This wick is a result of selling witnessed at ‘resistance.’ Therefore, the Manufacturing PMI data has a similar effect on the currency pair. We can trade the above pair after the price retraces to the resistance turned support area and then going ‘long’ with a strict stop loss.

USD/JPY | Before the announcement:

USD/JPY | After the announcement:

In the USD/JPY currency pair, the characteristics of the chart seem to be different from the above-discussed pairs. Here, the Japanese Yen is showing signs of strength before the news announcement. Thus, a positive PMI data should take the currency lower while negative data might result in an up move. The volatility is seen on both sides of the market. Thus, it is advised to wait for the actual data before taking any action. It is also not advisable to trade in the ‘options’ segment as it is a less impactful event and volatility after the announcement will be ‘low.’

After the announcement is made, the market goes up just by a little, signifying the least amount of volatility. The Manufacturing PMI, even though it was negative for the Japanese economy, it failed to take the price higher as in other pairs, as the impact of it very less. Thus, the small rise in price could be used as an opportunity to join the downtrend.

That’s about ‘Manufacturing PMI’ and its impact on the Forex market after its news release. If you have any questions, please let us know in the comments below. Good luck!

Categories
Forex Fundamental Analysis

What Should You Know About The ‘Manufacturing Production’ Of A Country?

Introduction

Manufacturing Production statistics are a direct measure of current economic activity. It is instrumental for investors to get a correct estimate of current industrial activity. The Manufacturing Production Index also provides the capacity at which the industries are operating at which is useful for Government officials and business owners for planning and optimizing the performance of these industries. For economists, it helps to cut through media propaganda easily as the numbers reveal the real present situations of these industries and help analyze economic performance better.

What is Manufacturing Production?

Manufacturing Production, also called Industrial Production (IP) Index, measures the real or genuine output of the mining, manufacturing, and electric and gas utility industries. Hence, it covers some of the most important industrial sectors that play a significant role in economic growth and society’s sustenance.

Manufacturing Production Index is a measure of current industrial output. The Index’s reference period is 2012, which means that for the year 2012, the IP Index score is 100. All the scores that are published thereafter are in reference to this period. Hence, it is in a way it is a report card for the industrial sector’s final production output. The report also includes capacity utilization statistics that tell us at what percent of maximum capacity are different industrial sectors are operating at.

In the United States, the Manufacturing Production figures are taken from production data of all industries included in the North American Industry Classification System (NAICS) and industries like logging, newspaper, periodical, book, and directory publishing that have been traditionally considered to be Manufacturing.

The individual indices of Industrial Production (IP) are constructed through two sources:

  • Output measured in physical units.
  • The output is inferred from the data on inputs to the production process.

The IP index measures the output of individual industries taking their weightage derived from the proportional contribution of that industry to the combined output of all industries.

How can the Manufacturing Production numbers be used for analysis? 

If we are to be very strict with our analysis, then Manufacturing Production figures are coincident or current indicators when compared against New Orders Figures of the Institute of Supply Management’s Purchasing Manager’s Index.  It is more indicative of the current trend rather than a future trend. A decrease in New Orders is more indicative of future Production while Industrial Production (IP) Index is more current.

Although, since it is a monthly report, some use it as a leading indicator to oncoming economic turns as generally, these indices are indicative of ripple effects through employment, wages, and business activity.

Hence, it is more appropriate to take IP numbers as current economic indicators and use it to verify the fundamental trends that have been predicted by other leading indicators. We can use IP figures to identify whether our predicted trends have started to play out or not.

The data set for the IP index goes back to 1920, and hence it is a very reliable measure of economic activity, as shown above.

Below is the zoomed-in period of IP index, where we can see during the recession the IP index accurately depicts the economic conditions for that period. Through this, we can understand that the IP index is a double check for us to understand the current economic situation correctly. It is a one-for-one measure of economic activity.

Impact on Currency 

The Manufacturing Production Index has a mild impact on the currency market as the ongoing trend in the economy would have been already depicted by other macroeconomic leading indicators.

On the other hand, it does influence investor’s confidence in the different manufacturing sectors that can affect the stock market and correspondingly, resulting in a mild impact on the currency too.

It is essential to keep in mind that the mild impact is because the United States is a mature and developed economy and has a diverse portfolio of exports and imports. It may not be the same case for all countries where individual developing or commodity-dependent economies may heavily depend on the performance of their manufacturing sector. It all comes down to what percentage of GDP does the Industrial Production Index industries make up. The higher the percentage, the higher the impact.

For the United States, the Manufacturing Sector makes up 20% of GDP while the Services Sector drives 80%. The Manufacturing Production Index is a proportional and coincident indicator. Higher production figures lead to increased economic activity and lead to currency appreciation and vice-versa.

Sources of Manufacturing Production

The monthly Manufacturing Production statistics are available on the Federal Reserve’s official website here. The St. Louis website offers a comprehensive list of Manufacturing Production reports, and they can be found here. We can also find global Manufacturing Production figures for various countries in statistical formats here.

Impact of the ‘Manufacturing Production’ news release on the price charts

After getting an understanding of the Industrial Production economic indicator, we will now find out the impact of the news announcement on different pairs and witness the change in volatility due to the release. The development of Industrial Production and machinery output are the main drivers of economic growth.

Economists believe that country’s development and enhanced standards of living are positively correlated with the nation’s industrial activity. The GDP is directly proportional to growth in the economy’s manufacturing sector. Although it is an important determinant of the economy, when it comes to the movement of the currency, traders do not make drastic changes to their positions in the currency based on the data.

The below image shows the latest Industrial Production data of the U.S., where we see that there has been a decrease in production by a whopping 6.2% as compared to the previous month. A higher than expected value is considered as positive for the currency, while a lower than expected is considered negative. Let us look at the reaction of the market to this data.

USD/JPY | Before the announcement:

We will first look at the USD/JPY currency pair and analyze the impact of the Industrial Production data on this pair. In the above image, we see that the market was in a downtrend, and very recently, the price has shown a sign of reversal to the upside. The price action suggests that the market might move higher from here before going down. Since the economists have predicted a lower Industrial Production data, it is advised not to take any ‘short’ positions.

USD/JPY | After the announcement:

After the news announcement, the price initially moves higher due to increased volatility but later loses all the gains and closes in the red. Even though the Industrial Production data was very bad for the economy, the price did not react that bad as expected. We see a neutral response from the market where the ‘news candle’ closes near its opening price. Therefore, we can say that the impact of the news outcome was not great on the currency pair, and the volatility was average.

GBP/USD | Before the announcement: 

GBP/USD | After the announcement:

The above images represent the GBP/USD currency pair, where we see that the market is violently going down before the news announcement. Currently, the price is its lowest point, and there has been no price retracement of any kind. As per the technical analysis, we cannot take any position at this moment, as this would mean chasing the market and, this carries a huge risk.

After the news announcement, we see that that the price goes lower in the beginning, but later buying pressure takes the price higher, and the candle closes with a wick on the bottom. Overall, the volatility increases to the downside after the news release but does not sustain for long. The price continues to move higher one candle after the ‘news candle,’ which implies that Industrial Production does not have a long-lasting effect on the currency.

USD/CAD | Before the announcement:

USD/CAD | After the announcement:

The above images are that of the USD/CAD currency pair where we see that before the news announcement, the market is in a strong uptrend, and here too, there is no price retracement of any sort. This shows that the U.S. dollar is extremely strong. At this point, we cannot take any position in the market as this is against the rules of risk management.

After the news announcement, volatility increases to the upside resulting in further strengthening of the U.S dollar. Despite the fact that the Industrial Production data was really weak, the market does not react negatively to the news data, but rather we see an increase in the price. This might be due to the fact that the news data is of least importance to traders.

That’s about ‘Manufacturing Production’ and its impact on the Forex market after its news release. If you have any questions, please let us know in the comments below. Good luck

Categories
Forex Fundamental Analysis

The Importance of the ‘Car Registrations’ Data While Gauging The Economy’s Health

Introduction

Since the advent of mass production of Cars, by Henry Ford in 1913, the automobile industry has been booming. The consequent effects on the dependent industries are as significant as the study of Automobile Industries itself. Car Registration statistics are useful for policymakers, and many dependent industries of automobiles.

What is Car Registrations?

Vehicle Registration is the process of registering a newly purchased or resold vehicle with a government authority. The primary purpose is to link every car with a corresponding owner. It helps in identifying owners of lost vehicles and reckless driving caught on traffic cameras, etc.

How can the Car Registration numbers be used for analysis?

Car Registrations in our analysis is useful to the following sectors of people:

Policy Makers – Car Registration statistics are useful for policymakers to predict traffic volume, forecasting congestions in narrow road areas, and planning new highway construction projects to facilitate smoother transportation.

Oil Vendors – It is useful for the Oil vendors, who can use this data to forecast an increase or decrease in fuel demand and adjust their inventory or stock in advance to meet the demand.

Road Construction companies – Companies can track regional increases in car sales and identify traffic patterns, to put forward a proposal for road construction to government officials to get a construction contract.

Modification Jobs – Many companies in the modern world offer customization options. By monitoring what type of cars are more frequent and in which locations, can help such small scale businesses to set up their business, and offer suitable services.

Sales analysis by Car Manufacturers and Investors – Car Registration figures are the number of cars purchased by customers and are on-road as we speak. The Car Production figures show the picture from the manufacturer’s perspective, while Car Registrations show the actual demand from the customer’s viewpoint. It is the actual sale that counts, and Car manufacturing companies can analyze what type of cars are trending the market right now, which can help them build similar models of cars. Investors can analyze this data to know which company sales are growing in which sector, and where potential growth lies in different regions.

Environmental Analysts: Cars are one of the primary sources of Air pollution, by analyzing the trend in Car Registrations, environmental analysts can assess whether people are shifting to more eco-friendly options like electric cars. Thereby research the implications for submission of their reports on environmental impacts.

Of these factors, road construction, sales analysis is essential, and that is what most of the time data is mainly used for.

In the aspect of economic growth, Car Production and Car Registration statistics point in the same direction, where  Car Registration is more accurate, as production does not equal equivalent purchase.

As more Cars are registered, it indicates more consumers can afford it. It indicates consumers have enough disposable income and are financially stable enough to either procure a loan or direct purchase. It also indicates, banks also have enough liquidity to disburse loans for such purposes.

Historically, during times of recession, there is a corresponding decrease of Car Registrations, as evident from the above graph, as Consumer Sentiment is low, and prefer to save more than spend to save for a future rainy day. Overall, Car is not a cheap commodity, and an increase in its registration indicates, increased Consumer Confidence, and tells us the economy is stable and faring well.

With more emerging economies like India, Japan, etc. improving their economic conditions by export-led growth in the global markets, the total number of people who are above the poverty level is increasing. This would ultimately translate into increasing Car Registration figures in the upcoming times. The below plot justifies this:

As the standard of living improves in the emerging economies, we are bound to see an increase in demand for automotive, in those countries. As people become wealthier and have extra income after accounting for the daily needs, people open up to the more non-essential or luxury goods, and first in that list comes a car and a home in most developing economies. Hence, increased car registration figures are a sign of an increase in the standard of living of that economy.

Impact on Currency

Car Registrations are a lagging indicator of economic health, as purchase happens only when the economic conditions have improved significantly and have continued to stay good for a while. In this sense, it is a lagging indicator, compared to other leading and coincident indicators like Disposable Income, Interest Rates, Personal Consumption Expenditure, etc. for traders.

Hence, it is a low impact indicator, as the change in numbers is backward-looking and not forward-looking. It is more useful for policymakers and investors interested in Automotive industries looking for investment ideas and opportunities.

It is a proportional indicator, and a decrease in registrations of new vehicles is just signaling weakening economy and corresponding currency devaluation, which has already been confirmed by other indicators. It will be just confirming our predictions from leading indicators.

Economic Reports

The Federal Highway Administration keeps track of the total vehicle registrations by type and builds on its official website.

The Organization for Economic Co-operation and Development maintains the data for all its member countries, which is available on the St. Louis Fred website that is easier to access.

Sources of Car Registrations

Federal Highway Administration State Vehicle Registrations – 2018

Annual Motor Vehicle Registration – Total – CEIC Data

The St. Louis FRED data also maintains data extracted from the OECD database about the vehicle registrations here and here. We can find the monthly data for the Car Registrations data in the statistical form here and here.

Impact of the ‘Car Registrations’ news release on the price charts

After getting a clear understanding of the Car Registration fundamental indicator, we will now try to comprehend the impact of the indicator on different currency pairs and observe the change in volatility due to the news announcement. The Car Registrations figure gives an estimate of the total number of purchased Cars and which is billed to the customer during that month. The indicator helps us to understand the growth in the purchasing power of people in a country. Even though the purchasing power is measured by many other parameters, Car Registration is one of the major factors. Thus, traders do not give much importance to this data while analyzing a currency.

In the following section of the article, we will analyze the impact of the Car Registration economic indicator on various currency pairs and try to interpret the data. The below image shows the Car Registrations data of Canada, where the data says there were 113K registrations in January. There is a decrease in the number of registrations as compared to the previous month. Let us find out the reaction of the market.

USD/CAD | Before the announcement:

We shall begin with the USD/CAD currency pair for analyzing the impact. The above image shows the position of the chart before the news announcement. We see that the currency pair is an uptrend making higher highs and higher lows and apparently has broken out above the ‘supply’ area. This means the uptrend is getting stronger, and the news will determine if it will continue further or not.

USD/CAD | After the announcement:

After the news announcement, the price moves in both directions but very little. The currency pair exhibits the least amount of volatility due to the news release, and the candle closes, forming a ‘Doji’ candlestick pattern. The lukewarm reaction of the market indicates that the data was not very disappointing, and thus traders do not make changes to their positions in the currency pair.

CAD/JPY | Before the announcement:

CAD/JPY | After the announcement:

The above images represent the CAD/JPY currency pair where before the announcement, we see that the pair is in a strong downtrend, and as the Canadian dollar is on the left-hand side, it shows extreme weakness in the base currency. Recently, the price seems to be moving in a range, and just before the news release, the price was at the bottom of the range. Thus, buying force can be seen at any time in the market from this point.

After the news announcement, the market falls slightly but gets immediately bought back. Due to a lower Car Registrations, market players initially sold the currency but later took the price higher as the data was not very bad. Technically, this is a ‘support’ area, and thus traders went ‘long’ in the market, which resulted in the price rally. Therefore, the impact due to the news announcement was least in the currency pair.

AUD/CAD | Before the announcement: 


AUD/CAD | After the announcement:

Lastly, we discuss the AUD/CAD currency pair where, before the announcement, the market is range-bound, and there isn’t any clear direction of the price. The currency pair is seen to exhibit minimum volatility before the news release. It is necessary to have market activity in order to analyze a currency pair rightly. Trading in such currency pairs attract extra slippage and spread.

Therefore, it is advised not to trade in pairs where the volatility is less. After the news announcement, the price moves higher, and ‘news candle’ closes with a slight amount of bullishness owing to poor Car Registration data. But since the news data is not very important to traders, we cannot expect the market to start trending after the news release also. We need to wait until the volatility increases, to take a trade.

That’s about ‘Car Registration’ and its impact on the Forex market after its news release. If you have any questions, please let us know in the comments below. Good luck!

Categories
Forex Fundamental Analysis

How Important Is ‘Mining Production’ For a Nation’s Economy?

Introduction

Mining Production is a key economic indicator as the final output of Mining Production is the primary input for many industries. Therefore, it is the core part of many industries’ business activity.

Fluctuations in the Mining Production figures are bound to translate to all the dependent industries that use the Mined resources as input in their production process. The knock-on effect can be many-fold, and hence it is a vital economic indicator for investors, economists, and government authorities.

What is Mining Production?

Mining Production refers to the entire process of searching for, extraction, beneficiation (purification), and processing of naturally occurring minerals from the Earth. Mining is the process of extracting useful minerals by excavating into the Earth as these minerals cannot be produced on the surface. Minerals are essential for running society to a large extent.

Minerals typically drilled can be Coal, metals like Copper, Iron, Zinc, or industrial minerals like limestone, potash, and other crushed rocks. Coal remains one of the most significant sources of energy throughout the world. Metals like Iron, Copper have a wide range of usage in industries, from small chips in computers to construction of giant buildings. Limestone, Sand, and other rocks have used in cement industries, which all contribute to the construction and housing industries.

In the United States, the Mining Production figures are released as part of the “Industrial Production and Capacity Utilization – G. 17” report by the Federal Reserve. This report is also called the Industrial Production Index (IP Index) or Factory Output.

The Mining Production numbers are expressed in index and percentage change formats. The base year for the reference index period is 2012, for which the score is 100. Every month the Mining Production numbers are published according to this index. For example, an index figure of 130 indicates that Mining Production has increased in contrast to 2012 statistics. The percentage change compares the figures to the previous month. It is a seasonally adjusted statistic. The figure below illustrates the Mining figures dating back to 1920.

How can the Mining Production numbers be used for analysis?

Hence, it is apparent that Mining lies at the heart of all industrial activities. A decrease in Mining production can adversely affect all the dependent industries, and correspondingly the effects will pass onto unemployment, layoffs, wages, economic slowdown, etc.

Since the end products of the Mining Industry act as the starting input for many industries, it serves as a leading indicator for the economy. It lies at the very start of the economic activity chain, and the ripple effect through fluctuations in Mining Production figures will effect dependent industries with 1-6 months’ time lag depending upon the nature of dependent business.

Investors, government authorities, and economists extensively use the IP Index report for their purposes. Mining is the extraction of minerals that are essential for the economy; the government monitors and provides the necessary support to improve Mining Production. In 2006, the mining industry alone produced shipments worth 78.65 billion dollars, and that is excluding oil and gas. Coal accounts for 50% of electric power generated in the United States.

Mining Production is susceptible to some of the following:

Resource Availability – Since minerals are non-renewable resources, which means they are exhaustible. Once a region is depleted of the particular resource, search for new mining areas, relocation, and Mining again is expensive to process.

Weather – Bad weather conditions can interrupt Mining Production as it typically involves explosions and heavy drilling equipment. Heavy rains can close down mines and access roads. Lightning can put the massive equipment operations, explosion handling personnel at risk. Strong winds disrupt blasting. High temperatures can affect Mining workers.

Technology – The amount of latest and advanced mining technologies that are available at the disposal of the country determines the Mining Production cost and total output.

Terrain – The type of terrain that needs to be mined can also affect Mining costs and Production levels. Mining Industries are the leading employers at the place of their operation. Mining supports more than 500,000 jobs directly and an additional 1.8 million jobs indirectly through its dependent industries. Hence, wages, employment, economic activity, revenue generation, exports, energy consumption are all affected by Mining Production.

Impact on Currency 

The Mining Production figure is a proportional and leading economic indicator. An increase in Mining production figures translates to stimulated business activity in the dependent industries, higher employment, wages, and improvement in economic activity. It will also generate higher revenue for the nation through exports of Mining Produced goods like Coal, Iron, etc. All this has a positive effect on the currency, and the currency appreciates. The reverse also holds.

Economic Reports 

The Mining Production report is a part of the IP report that is published by the Fed every month. This report is published in the form of estimates with subsequently revised estimates. The first version/estimate is released on the 15th day of every month, and this shows the Mining data of the previous month. This is the major report as it factors in about 75% of the data. The next four estimates account for 85%, 94%, 95% & 96% respectively as the source data becomes available after each passing month.

Sources of Mining Production 

The monthly Mining Production statistics are available on the official website of the Federal Reserve for the United States. The St. Louis FRED provides a comprehensive list of Industry Production, and Capacity Utilization reports on its website with multiple graphical plots. You can find this information here and here. We can also find global Manufacturing Production figures for various countries in statistical formats here.

Impact of the ‘Mining Production’ news release on the price charts

In the previous section of the article, we learned the Mining Production economic indicator and understood it’s significance in an economy. The mining industry is critical to a nation’s economic well-being. It influences the country on a regional and individual level, with significant dependence on the resources under development as well as government policies. The mining industry is today is opening up new opportunities for foreign investments and technical assistance. Mining also impacts employment opportunities and income generation.  Governments and mining companies are working together to achieve these goals.

In today’s example, we will analyze the impact of Mining Production South African Rand and witness the change in volatility because of the news announcement. The below image shows that the Mining Production in South Africa increased 7.5% year-on-year in January 2020, following a 0.1% gain in the previous month and beating market expectations by a huge percentage. Let us see find out how the market reacts to this data after the news release.

USD/ZAR | Before the announcement:

The first pair that will be discussed is the USD/ZAR currency pair. Here, we see that the market is in a strong uptrend before the news announcement, as shown in the above image. As the impact of Mining production is less on the value of a currency, we will wait for the price to retrace near a ‘support’ area and then take a ‘buy’ trade. Until then, we have to watch if the price crashes below or shows signs of reversal.

USD/ZAR | After the announcement:

After the news announcement, the market hardly reacts to the Mining Production data keeping the volatility at the bare minimum. Later we see that volatility increases to the downside, which causes the strengthening of South African Rand. The market shows positively to the news release after the close of the ‘news candle.’ As the Mining Production data was bullish, traders are seen going ‘short’ in the currency pair and strengthening the South African Rand, immediately after the ‘news candle.

ZAR/JPY | Before the announcement:

ZAR/JPY | After the announcement:

The above images represent the ZAR/JPY currency pair, where the first image shows the characteristics of the chart before the news announcement. We see that the market is a strong downtrend, and since the South African Rand is on the left-hand side of the pair, it signifies extreme weakness in the currency. Presently, the price seems to have formed a ‘range,’ and right now is at the bottom of the ‘range.’

Thus, we can expect buyers to get active at any moment. We cannot take any position in the market at this moment. After the news announcement, volatility remains at the same level as before, and the price does not respond to the news data as expected. The ‘news candle’ forms a ‘Doji’ candlestick pattern where the price closes almost at the opening price. Since the Mining Production data does not have a major impact on the currency, traders should analyze the currency pair from a technical perspective and take suitable positions.

EUR/ZAR | Before the announcement:

EUR/ZAR | After the announcement:

The above images are that of EUR/ZAR currency pair, where we see that the market is in an uptrend, and recently the price is within a ‘range.’ Here as well, the South African Rand is showing weakness with no signs of strength at all. Technically, we will be looking to buy the currency pair once the price ‘pullbacks’ to a key ‘support’ or ‘demand’ area.

After the news announcement, the price stays at the same level as before and closes, forming a ‘Doji’ pattern. A bullish reaction to the Mining Production data can be witnessed after the close of the ‘news candle,’ which showed an increase in volatility to the downside and thereby strengthening of the South African Rand.

That’s about ‘Mining Production’ and its impact on the Forex market after its news release. If you have any questions, please let us know in the comments below. Good luck!

Categories
Forex Fundamental Analysis

‘New Orders’ – Everything About This Economic Indicator & Its Impact

Introduction

New Orders are essential for economists, government officials, and investors alike. It is a direct indication of oncoming expansion or contraction in the economy. For investors, decisions regarding investment in different sectors are critical, and New Orders figures are perfect tools to gauge an increase or decrease in economic activities. Hence, understanding this economic indicator can help us predict economic prospects better in our Fundamental Analysis.

What is the “New Orders” number?

The New Orders is not in itself a separate report. Still, it is published as part of an overall report that details the performance of Manufacturing Industries in terms of the previous month’s and current business activity and prospective plans.

The New Orders form the part of the report titled: “Manufacturer’s Shipments, Inventories, and Orders,” which is generally referred to as Factory Orders, published by the United States Census Bureau. It is also called the M3 Survey, which constitutes the New Orders Report that we are interested in. The overall report measures the performance of the industrial sectors by factoring in the total Shipments, New Orders, Order Backlogs, Total Inventory, etc. Hence, M3 Survey is a broad measure of economic conditions in the domestic manufacturing sector.

New Orders are reported in the dollar value of goods and services that have been ordered in advance. In the manufacturing sector, generally, orders are made months ahead of supply so that production can be planned and delivered accordingly. Hence, a New Order is conveying an objective to buy for immediate or future delivery from clients. New Orders report of M3 Survey includes all the manufacturing companies in the United States with more than 500 million dollars of annual shipments and specific selected smaller firms overall.

Also, Orders data for industries that have almost immediate deliveries are not recorded. Only the Orders which are supported by legal binding documents like a letter of intent, or signed contracts detailing booking of orders are included. The New Orders report all the New Orders received, excluding the canceled Orders for the previous month.

Special Consideration:

The word “New Orders” is also a component of the Performance of Manufacturing Index (PMI) and Performance of Services Index (PSI), which are also used to gauge business activity through similar survey-based index development. The New Orders in these statistics are also similar to the one we are discussing in this section and differ slightly in methodology, participants of surveys, surveyors, seasonal adjustments, and specific calculations that are different for Service Industries. These New Orders are different from the ones reported by the Census Bureau. Hence, care must be taken not to confuse with similar terminologies in both surveys.

How can the New Orders numbers be used for analysis? 

In the life cycle of production and consumption of goods and services, New Order is the earliest indicator in the manufacturing sector. In this sense, it is an advanced or leading indicator of an increase in economic activity.

The M3 survey is extensively used by government officials to develop economic, fiscal, and monetary policies. The New Orders serve as a warning sign for the officials to support the manufacturing sector as any significant downturns can lead to economic contractions and even employee layoffs. Politicians are motivated to keep employment rates high to ensure their chances of winning during elections.

As illustrated in the plot of the New Orders graph, the shaded areas indicate a recession period where we can observe a significant decline in the New Orders figures well before the actual recession, which confirms the importance of this economic indicator. It is also important to note that the year to year fluctuations are due to seasonally unadjusted figures.

Impact on Currency

Since New Orders are leading indicators of economic growth, the corresponding impact on the currency may be visible only after a certain period, which can vary from 1 month to 6 months. It is also important to note that the percentage change in New Orders from the previous month is not amplified by inflation and is only due to an increase in New Orders.

It is also essential to understand that the New Orders are seasonal for many industries, and it is vital to take the Seasonally Adjusted figures for a more accurate indication of economic growth.

An increase in New Orders indicates an increase in economic activity, which is good for the country and correspondingly to its currency. Hence, the New Orders figure is a proportional indicator, and a decrease in New Orders for previous months indicates a slowdown or contraction of economic activity.

The influence of investment markets on the economy is significant, and hence investors closely monitor for economic signals through New Orders. A positive change in New Orders translates to a positive change in equity markets too.

Economic Reports

The United States Census Bureau publishes the monthly M3 Survey reports on its official website. The Bureau releases two press releases every month.

The first one is “Advance Report on Durable Goods Manufacturers’ Shipments, Inventories, and Orders,” which is available about 18 working days after every month.

The second one is “Manufacturers’ Shipments, Inventories, and Orders,” which includes durable and non-durable manufacturing and is available about 23 working days after every month.

Sources of New Orders Reports

Census Bureau’s Factory Orders report is available here. For reference, you can find the latest advance report of the Census Bureau here. We can find the New Orders for different economies with statistical representation here. The graphical plot of New Orders is available on the St. Louis FRED official website.

Impact of the ‘New Orders’ news announcement on Forex

Till now, we have discussed the New Orders fundamental indicator and understood it’s significance in an economy. New Orders measures the value of orders received in a given period of time. They are legally binding contracts between a consumer and a producer for delivering goods and services. New Orders help in predicting future industrial output and production requirements. Investors feel that the data does not necessarily gauge the growth in the manufacturing and so they do not give a lot of importance to the data during the fundamental analysis of a currency.

Today, let’s analyze the impact of New Orders on different currency pairs and observe the change in volatility due to the news announcement. The below image shows the New Orders data of Sweden, where we see there has been a huge reduction in the percentage of New Orders compared to the previous month. A higher than expected reading is considered as bullish for the currency while a lower than expected reading is considered as negative. Let us see how the market reacts to this data.

USD/SEK | Before the announcement:

The first pair we will be discussing is the USD/SEK currency pair, where the above image shows the position of the price before the news announcement. It is clear from the chart that the market is in a strong downtrend, and the price is presently at its lowest point. Technically, we will be looking for a price retracement to a ‘resistance’ or ‘supply’ area so we can join the trend. At this moment, we cannot take any position.

USD/SEK | After the announcement:

After the news announcement, the market moves higher initially, but due to the selling pressure from the top, the candle closes almost near its opening price. As the New Orders data was extremely weak for the economy, traders go ‘long’ in the currency and sell Swedish Krona in the beginning. But since the trend is down, sellers push the price lower, and the ‘news candle’ leaves a wick on the top. We still cannot take any position after the news release.

EUR/SEK | Before the announcement:

EUR/SEK | After the announcement:

The above images represent the EUR/SEK currency pair, where the characteristics of the chart are similar to that of the above-discussed pair. The market here too is in a strong downtrend signifying the great amount of strength in the Swedish Krona, as the currency is on the right-hand side of the pair. We can see in the first image that the currency pair is not very volatile, which means there will be additional costs (Spreads & Slippage) when trading this currency pair.

Hence, we should trade this pair if the news announcement ignites volatility in the market. After the news announcement, the price hardly reacts to the news data where it stays at the same point as it was just one candle before. Therefore, the news release does not have any impact on this currency pair, and there is no alteration to the volatility.

SEK/JPY | Before the announcement:

SEK/JPY | After the announcement:

Lastly, we will look at SEK/JPY currency pair and see if there is any change in volatility due to the news announcement in this pair. Before the news announcement, the market is in a strong uptrend indicating strength in the Swedish Krona. In order to join the uptrend, we should wait for the price to pull back at a’ support’ area, as the price is at the highest point, and then take position accordingly.

After the news announcement, the price initially falls lower owing to poor New Orders data, but it bounces exactly from the moving average and closes with a wick on the bottom. Hence, we can say that the news release has some impact on this pair, causing a fair amount of volatility after the announcement.

That’s about ‘New Orders’ and its impact on the Forex market after its news release. If you have any questions, please let us know in the comments below. Good luck!

Categories
Forex Fundamental Analysis

Why ‘Core Consumer Price’ Is Considered A Crucial Macro Economic Indicator?

Introduction

The Core Consumer Prices are a sub-segment of the Consumer Prices, which is used by professionals and economists to get a more accurate picture of the inflation within the country. Understanding of Consumer Price movements can help traders predict inflation rates, industrial trends, identify demand, and supply gaps to invest in a particular section of goods and services. It is a widely used statistic and is one of the critical components in assessing economic expansion or contraction, thereby.

What is Core Consumer Price?

The ”Core “ Consumer Price is the generally called name for the “Consumer Price for All Urban Consumers: All Items Less Food and Energy.” This term comes up in the Consumer Price Index monthly published Reports where this is another variant of the CPI-U and is widely known as the “Core” CPI where CPI stands for Consumer Price Index.

What is the Consumer Price Index?

Consumer Price Index is a survey report which determines the average price of some of the most commonly purchased goods. These goods include toothpaste, grocery, fuel, etc. Instead of using a simple average, each good is assigned a specific weight based on the degree of their importance amongst the people. For instance, milk will have a higher weightage in the mean price calculation compared to the furniture.

Core Consumer Price Index is the same Consumer Price Index for all the commonly consumed goods and services except food and energy items. This distinction has arisen due to the highly volatile nature of food and energy prices.

Why are the food & energy prices volatile in the first place?

Let us talk about food first. In the short run, the supply of food cannot immediately accommodate the increase in demand for food. To meet the increased demand,  it has to result in the planting of more seeds and growing, which take somewhere about a few months to at least a year.

Due to this situation, we say the supply is inelastic to the demand, meaning it cannot stretch immediately to meet the demand. Hence, the demand-supply gap causes price volatility. For example, in India itself last year, the price of onions went up to 150 rupees per kg from its usual 30 rupees per kg. This volatility can also occur due to crop loss at the time of adverse weather conditions or due to some other issues like forest fires etc.

The same goes for energy items like crude oil. Industries or Countries that are heavily dependent on these sources have little choice but to pay higher prices when there is a shortage of supply. Switching from one source of energy to another or alternate forms of power is not a small task, nor is it a viable solution. The primary energy source areas have been historically subjected to political tensions, which have led to significant shocks in oil prices worldwide. Factors like weather conditions also hinder oil production, or unexpected incidents can lead to significant dips in the energy supply levels in the global market.

Below is a historical 70-year plot of Crude oil prices where shaded regions indicate periods of recession.

(Source: MACROTRENDS)

With such a massive rise and drops in prices, it is very easy to overlook the actual inflation or deflation within the economy. As the CPI takes into account the food and energy prices, there can be situations where the food and energy prices skyrocket while other items have observed deflationary trends in their prices to a scale that the volatility masks the deflationary trend or vice versa is also true.

To avoid this inaccuracy in CPI, the Core CPI comes into the picture, which is a more accurate inflationary measure than the CPI-U.

Economic Reports

The Bureau of Labor Statistics generally conducts a survey of 80,000 consumer item prices to create the Index and publishes it monthly.

BLS data collectors visit in person, or virtually through the internet, or call thousands of retail stores, service establishments, rental units, and doctors all over the United States. They do this to generate info on the prices of items and then measure price changes in the CPI.

How can the Core Consumer Prices be Used for Analysis?

The index data set goes as way back; for example, Core CPI goes as far back as 1957. With such a large data set, the reliability of the data set is high, and it usually depicts the macroeconomic picture of a country with reasonable confidence.

CPI changes are useful to ascertain the retail-price modifications associated with the Cost of Living. Hence it is widely used to determine inflation in the United States.

Many payment agreements are directly tied to CPI; it can affect the incomes of 80 million people. Social Security benefits, various pension payments are all indexed by CPI. Hence, CORE CPI is essential to understand current monetary conditions and can also be used to assess how the governments and policymakers will act to these changes.

Impact on Currency

In general, CPI is associated as a proportional indicator meaning higher CPI signals currency appreciation for traders and vice versa.

Below is a snapshot of CORE CPI plotted against GDP for the last 15 years, and we see this macroeconomic indicator’s importance in fundamental analysis:

Sources of Consumer Price Index

The U.S. Bureau of Labor Statistics releases all the indexes as mentioned here –

Consumer Price Index and Core CPI

CPIAUCSL: CPI for Urban Consumers: All Items in U.S. City Average: Broadly uses the statistic for a measure of overall inflation in prices. It includes Food and Energy prices, unlike CPIFESL. This info can be found here.

CPIFESL: Consumer Price Index for All Urban Consumers: All Items Less Food and Energy in U.S. City Average: It excludes volatile components like Food and Energy (Oil Prices) and gives more of a Core CPI change within the United States. This info can be found here & here.

Impact of the ‘Core Consumer Prices’ news release on the price charts

The Core CPI is not only an important indicator of inflation but that of the overall economy, thus it is sure to impact the value of the currency. In this section of the article, we will be discussing that impact and look to trade the news announcement. As we can see in the below image, core CPI is said to highly impact the currency when the numbers are being announced. The data released on a monthly and yearly basis, but today we will be analyzing the month-on-month core CPI data of the United States.

The below image shows the latest Core CPI data for the month of February, along with the forecasted and previous numbers. A higher than expected reading is considered to be bullish for the currency while a lower than expected reading is believed to be bearish. The latest figures show that the Core CPI numbers were unchanged from before, which was exactly predicted by economists. The CPI numbers are published by the U.S. Bureau of Labor Statistics, the official agency that carries out surveys and collections. Now let us analyze the impact it created on the U.S. dollar.

EUR/USD | Before The Announcement

We start with the most liquid forex pair in the world, which is the EUR/USD pair. Looking at the from a technical perspective, before the news announcement, we see a market reversal retracement on the downside with a retracement to the nearest ‘higher high’. One can assume that the market has factored in the Core CPI data as it is expected to remain the same as before. Hence, one should not expect a great amount of volatility during the announcement. Technically, we can take a ‘short’ trade in the above pair, but without having a lot of assumptions, it is advised to keep a wide stop loss to protect ourselves from spikes.

EUR/USD | After The Announcement

The Core CPI numbers are announced, and since it was on expected lines, the price falls a little, showing some bullishness for the U.S. dollar. As there was minimal volatility, we can confidently take a ‘short’ trade with a stop loss above the recent ‘higher high.’ The ‘take profit’ for this trade should be near the recent ‘low’ or ‘support’ area. We shouldn’t forget that earlier, it was said that it is a high impactful event, but due to subdued expectations, it did not induce high volatility.

USD/CAD | Before The Announcement

USD/CAD | After The Announcement

The above images represent the USD/CAD currency pair where it looks like, before the news announcement, the market is in a pullback mode, and this is the perfect scenario for going ‘long’ in the market. As the impact of Core CPI is high, it could turn the market either way; hence it is safer to wait for the news release and then a suitable position in the market.

After the news announcement is made, we see that the volatility expands on the upside, which takes the currency higher. This could essentially be the confirmation sign for trend continuation, and we can now enter for a ‘buy’ with a stop loss below the recent ‘low.’ Since there was no reduction in Core CPI numbers, it resulted in being positive for the U.S. dollar, and thus we see a bullish candle after the news release.

NZD/USD | Before The Announcement


NZD/USD | After The Announcement

Here, in NZD/USD currency pair, before the news announcement, we see an uptrend, and since the U.S. dollar is on the right-hand side, it shows the excessive weakness of the same. The behavior of this chart is different from that of the above-discussed pairs due to the strength in the New Zealand dollar.

Therefore, only a significant increase in the Core CPI can result in a reversal of the trend else we can witness volatility on both sides. Since the news announcement was mildly positive for the U.S. economy, the price drops but not enough. Hence, we can conclude that the news release did not cause much volatility in the pair, and the current trend is still intact.

That’s about ‘Core Consumer Prices’ and its impact on the Forex price charts after its news release. If you have any questions, please let us know in the comments below. Good luck!

Categories
Forex Course

114. How To Trade Bearish & Bullish Pennant Patterns

Introduction

The Pennant is both a bullish and bearish continuation pattern that is used by technical analysts across the globe. This pattern can easily be identified on the price chart and is typically used for trading the upcoming price movements. In an ongoing trend, when the instrument experiences a significant upward or downward movement, followed by a brief consolidation, the Pennant pattern is formed.

Pennant Pattern’s Key Characteristics

A Flagpole The Pennant pattern always begins with a flagpole, and that is the initial strong move.

Breakout Level – Two breakouts should occur in this pattern. The first one will be at the end of the flagpole, and the second one should be after the consolidation period.

The Pennant Itself A triangular pattern is formed when the market consolidates between the flagpole and the breakout, and we call that a Pennant.

How To Trade The Pennant Pattern?

The Pennant is a relatively simple and easy-to-spot pattern on the price charts. We will find this pattern on all the timeframes, and the strategies that we are going to discuss will work on any timeframe you trade. In the below examples, we have used 15 minutes, Daily, and Weekly charts to prove the same. All you need to do is to train your eyes well to spot the pattern. Once we master this pattern, we can easily increase the probability of our winning trades.

Trading The Bullish Pennant Pattern

Example 1

In the below EUR/GBP chart, we have identified the formation of a Bullish Pennant Pattern.

We must always look to take long or short positions depending on the breakout in the Pennant chart pattern. If we find a bullish Pennant pattern, we must wait for the price action to break out in the north direction to take a buy trade.

In the below chart, you can see that when have placed a buy order after the price action broke the Pennant’s upper trend line. The take-profit should be placed at the higher timeframe’s resistance area, whereas the stop-loss order should be below the lower trend line. The best part about trading this pattern is that it offers a good risk to reward ratio, and most of the trades hit the targets within a few hours.

Example 2

In the below AUD/NZD chart, we have found another Bullish Pennant pattern.

Here, we can see the market has started a new downtrend, and we have placed a buy order right after the price broke the upper trend line. We can see our trade hitting the TP within a few hours. If we find this pattern in active trading hours, or when any trading session is about to begin, it is advisable to take bigger trades because opening trading hour breakouts have higher chances of succeeding.

Trading The Bearish Pennant Pattern

In the image below, you can see that we have identified a Bearish Pennant pattern on the GBP/NZD pair.

In the below chart, we can see that a brand new downtrend has just begun. The first leg of the pattern (flagpole) was quite strong. When the price action broke below the lower trend line, it is an indication for us to go short in this pair. The take-profit is as placed as same as the size of the flagpole, and stop-loss was just above the pattern formation.

That’s about Bullish and Bearish Pennant pattern and how to trade them along with appropriate risk management. Following money management principles is as crucial as entering the market at the right time. If you have any questions, let us know in the comments below. Cheers!

[wp_quiz id=”72786″]
Categories
Forex Course

115. Trading The Double Tops and Double Bottom Chart Patterns

Introduction

We will be discussing many Forex chart patterns in the upcoming course lessons that are widely used by traders around the world. But none of those patterns can beat the popularity of Double Bottom and Double Top chart patterns. This pattern can be seen frequently in not just the Forex market but all types of markets.

This pattern is independent of timeframes, i.e., it appears on all the time frames and the strategies that we are going to discuss work on all the trading timeframes too. Fundamentally, the Double Top and Double Bottom are reversal patterns, and they consist of two price swings approximately the same size on the same price level.

Double Top Chart Pattern

The Double Top chart pattern typically appears in an uptrend. It is formed when a bullish trend is interrupted at some point, and as a result, the price action tends to range. If that range consists of two swing tops, we can consider that as the formation of a Double Top chart pattern. After the second top, the price action drops and starts a new bearish trend.

Double Bottom Chart Pattern

The Double Bottom chart pattern typically appears in a downtrend. It is formed when the downtrend is interrupted at some point, which results in the price action to form a range. In the consolidation phase, if the range consists of two swing lows, and if the second low is struggling to reach the BottomBottom of the range, we can confirm the formation of the Double Bottom chart pattern. When the second Bottom is printed, we can expect the price to print a brand new higher high.

Neckline

The Double Top and Double Bottom patterns consist of a neckline. The Neckline is often used to confirm the pattern. The Neckline in a Double Top pattern is the horizontal level at Bottom where the two tops converge. Likewise, Neckline in a Double Bottom pattern is the horizontal level at the top where the two bottoms converge.

How To Trade The Double Top & Double Bottom Patterns? 

Double Top Pattern

The below charts represents the formation of a Double Top pattern on the AUD/JPY daily Forex chart.

In the below chart, we had activated a sell trade when the price action broke below the Neckline. The stop-loss is placed just above the Double Top pattern. It is advisable to set the take-profit order two times below the size of the pattern. Activating our trades at the Neckline is the safest and most professional way of trading this pattern; because it shows that the last buyers are out of the league, and going short positions from here is a good idea.

Double Bottom Pattern

The chart below represents the formation of a Double Bottom chart pattern on the GBP/AUD Forex pair.

As we can clearly see below, when the price action is closed above the Neckline, it indicates a buy signal.  We can see the most recent leg of the buyers being very strong, which indicates the buyers’ strength. Hence, in this case, we have decided to place the stop-loss just below our entry. For placing TP, we chose the previous recent high, and we can see how perfectly the price respected our placement.

This ends our discussion on Double Top & Double Bottom Forex chart patterns. We, at Forex Academy, have provided a lot of strategies to trade this pattern in the Basic Strategies section. You can check them out to get a deeper insight into these patterns. Cheers!

[wp_quiz id=”72810″]
Categories
Forex Fundamental Analysis

Comprehending ‘Credit Rating’ & Its Importance as a Macro Economic Indicator

Introduction

The credit rating of an institution, organization, the government is like a pseudo report card of its ability to pay back its debt. The credit rating process is thorough and detailed. The credit rating of a country or a government, in that case, can significantly impact the inflow of domestic and foreign Investments. It is one of the major indicators around which a lot of volatility occurs in the financial markets; therefore, understanding the credit rating system is important.

What is Credit Rating?

Credit Scoring

Among the general population, people who have a job are usually aware of a credit score that is attributed to them buy one or more agencies within that country. For example, in India, CIBIL, which stands for Credit Information Bureau (India) Limited, is the primary agency that assigns credit rating to individuals.

The credit rating of an individual largely determines the eligibility to apply for a loan from any financial institution. A high score would indicate that the individual is capable of repaying on time, and conversely, a low score would mean that there is a high risk of defaulting on repayment by the individual. The credit score of an individual takes into account the history of loans, repayment records and past defaulting records, and his current net income. Based on all these factors, the calculated score then tells their worthiness of credit.

For example, a CIBIL score greater than 750 in India is usually seen as a minimum requirement to be eligible for a loan by most banks. The individual usually seek out to maintain a high CIBIL score to be eligible to borrow a higher amount of loan and lower interest rates as a lower score would greatly diminish their loan eligibility, and even if they do get a loan, they will have to pay higher interest rate than people with a good CIBIL score.

Credit Rating 

Credit scoring applies to individuals within a country, whereas credit rating applies to institutions, organizations, and governments. Similar to credit scoring credit rating tells whether that organization is credit working or not.

Credit rating becomes important as here the borrowers are big institutions, government, large financial organizations, and the lenders are also big investors or foreign bodies. The loan amount is high, often ranging in millions and billions, and the duration of the loan is also long. Hence, investors actively seek credit ratings before deciding to purchase a particular Bond and lending their money.

How are the Credit Ratings calculated?

There are many globally popular credit rating agencies. In the United States, three companies, namely, Fitch Ratings, Standard and Poor’s Global (S&P Global), and Moody’s Corporation, are the most famous and sought after agencies.

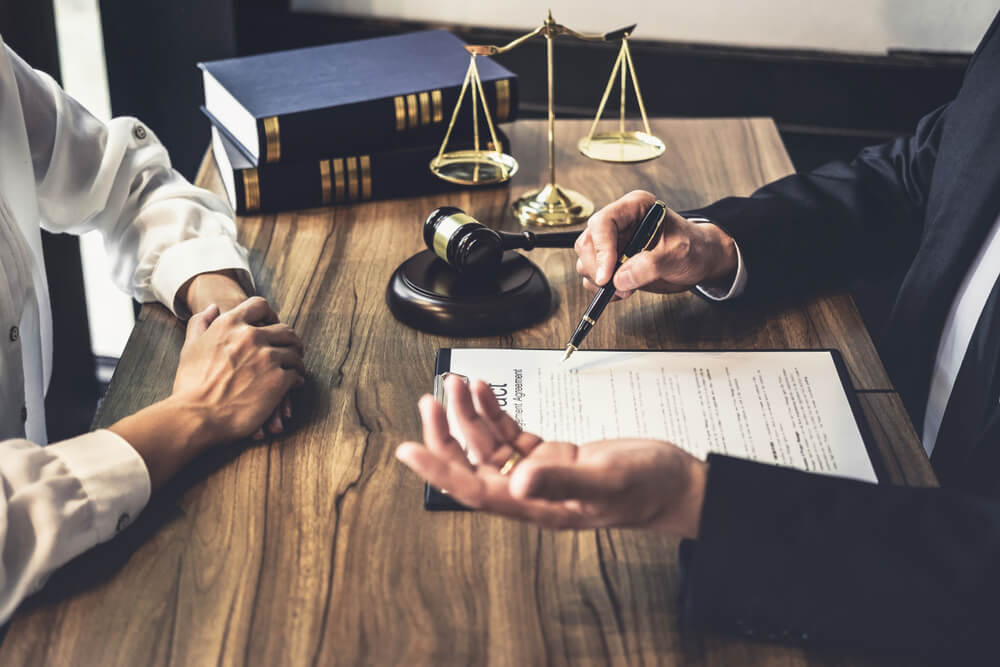
The credit rating process is very thorough and accounts for the entity’s entire debt and its repayment history. The process requires credit rating from the agency to meet with the organization and going over their financial records to assess their current financial status and assess their eligibility. They also take into account that past loan repayments and spending patterns, their current financial assets, and future economic prospects.

After this, a group of credit raters will work out the credit rating for that organization. The process may take up to 4 weeks in general. When the credit rating is ready, it is given out to the company and for a press release. The credit rating agencies usually follow an alphabet combination rating system.

For example, according to Standard and Poor’s Ratings, an organization having AAA rating is said to be outstanding, which is the highest rating possible. Next below is AA+, which means excellent this goes down a rating of D, which is the lowest score. The formats of writing may vary slightly from company to company, but in general, they have an understandable notation of alphabet combinations.

Are Credit Ratings important?

The credit ratings became particularly important after the 1936 rule, which restricted Financial Institutions to lend money to speculative bonds, i.e., having low credit ratings in other words.

Many companies now actively seek to get their credit rating assessed to gain the confidence of investors. The financial markets also have seen enough market crashes, the system collapses, and payment defaults even by the most reputed organizations and nations also. The European debt crisis and the Greece default one of the most popular instances wherein national level collapse of financial institutions and debt default occurred in the recent times of 2010-2011.

In one sense, there is a link between capital inflow and credit rating, hence government and financial corporations, when requiring money, the credit rating becomes a significant number.

The credit rating is not a performance report for a particular set year; instead, it is a continuously updated statistic that tells the credibility of the entity at the current time. For example, a country with the best credit rating last year may not have the same rating this year. The credit rating cuts through all the false alarms and directly gauges the financial numbers, which always tell the truth.

Hence, once the agencies publish credit ratings for a particular sovereign body, there tends to be a lot of volatility as investors either become gain or lose confidence in that body. Conversely, a decreased credit rating than the previous number, also stirs down the market in a negative direction.

Credit ratings, particularly sovereign credit ratings, are major indicators for investors, and hence the government bodies take utmost attention to loan repayment to avoid defaulting and thereby spoiling their credit rating, which will cost them future monetary indentures. Government bodies are aware that decreased credit rating will result in foreign investors stepping back, and consequently, losing their funding, which can, in extreme cases, lead to a total collapse of the institution or an economy at a large scale.

How can the Credit Ratings be Used for Analysis?

An institution with a low credit rating is considered a high-risk investment as the prospects of that company being able to repay is low.

A decrease in the sovereign credit rating signals an economic slowdown from which the country may take a significant time to recover. Conversely, a high credit rating for sovereign bodies and conglomerates indicates that the economy is stable and growing, and there are ample financial resources to pay back the debt on time.

Credit ratings are released quarterly, usually, after the financial numbers of the organization are released. They can be used as current macroeconomic indicators and also be used to predict future expansion plans of the borrowing party, as an institution borrows money to expand or invest in its growth.

Sources of Credit Rating Reports

For reference, Fitch credit ratings are published frequently on their official website.

Since Credit Rating is a major indicator, media coverage is huge and is easily available across the internet. For reference, this is a rating table given in Wikipedia.

Impact of the ‘Credit Rating’ news release on the price charts 

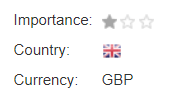
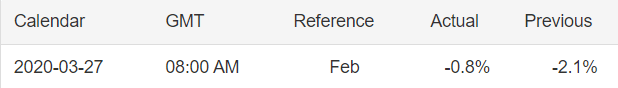
After understanding the meaning and significance of Credit Rating in a country, we shall now see the impact it makes on the currency after the Ratings are declared. There are many agencies that give Ratings to different countries, but the two most reliable and followed are the Ratings given Fitch and Standard and Poor’s (S&P). In today’s article, we will be analyzing the Credit Rating of the United Kingdom announced in the month of December. Credit Rating is said to be a major event in both the forex and stock market, which has a long-lasting effect on the value of a currency. Therefore, the rating could largely determine the degree of volatility in the currency pair.

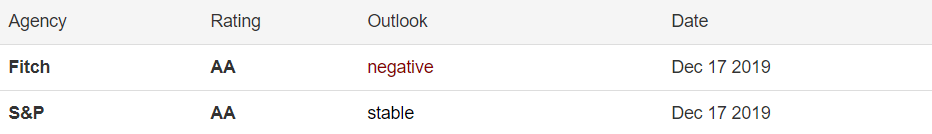
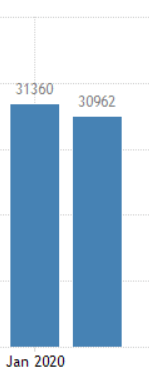
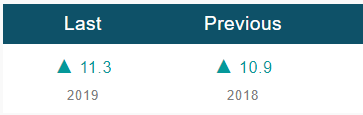
In forex trading, Credit Rating is used by sovereign wealth funds, pension funds, and other investors to gauge the creditworthiness of a county, thus having a big impact on the country’s borrowing costs. As we can see in the above image that Fitch’s Credit Rating for the United Kingdom was last reported at AA with a negative outlook. Since the rating was unhealthy for the economy, let us see how the market reacted to this.

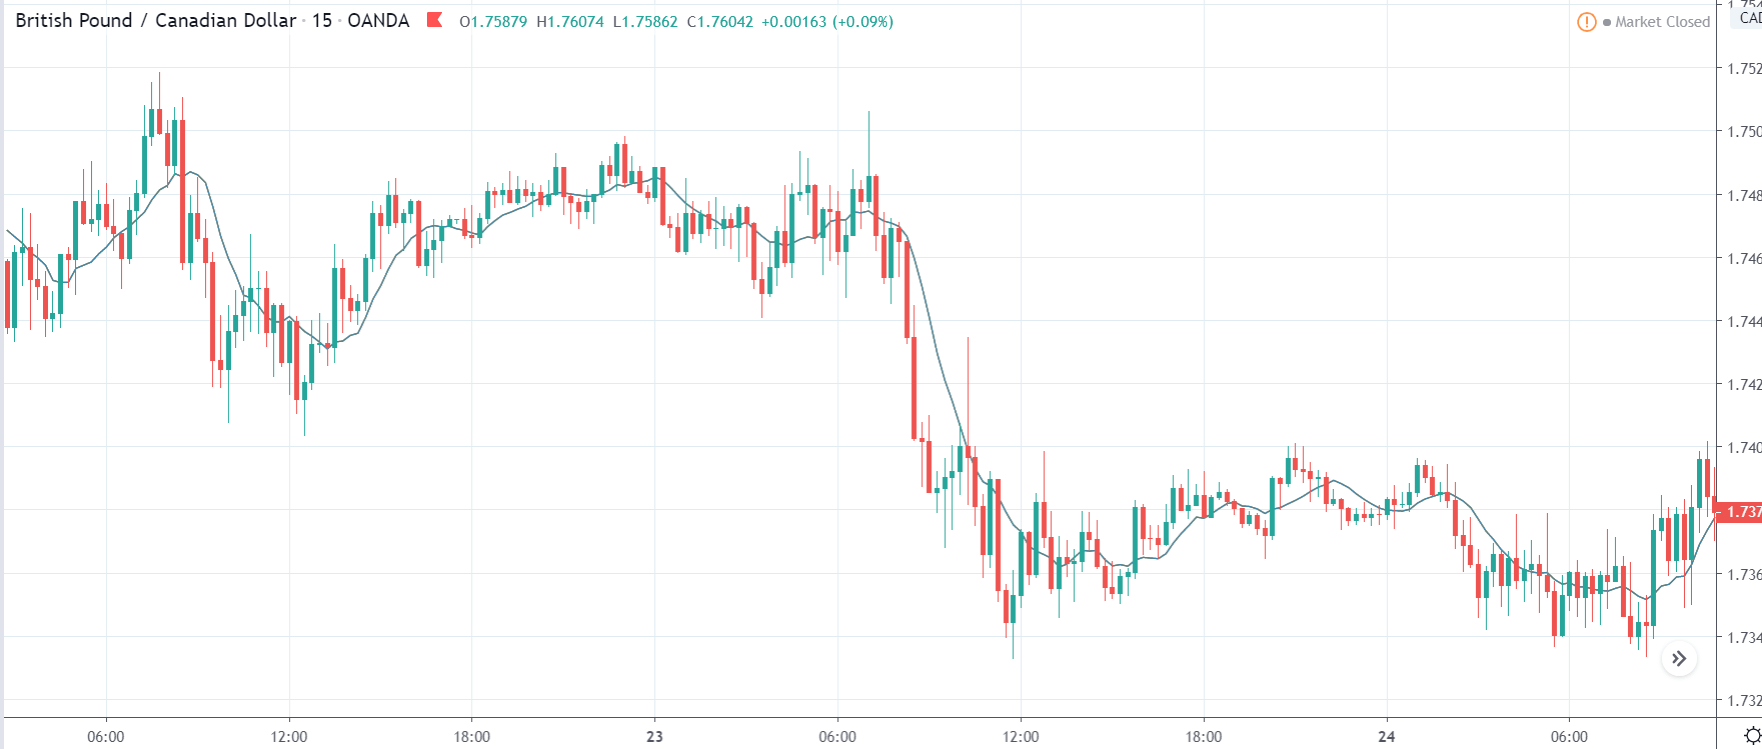
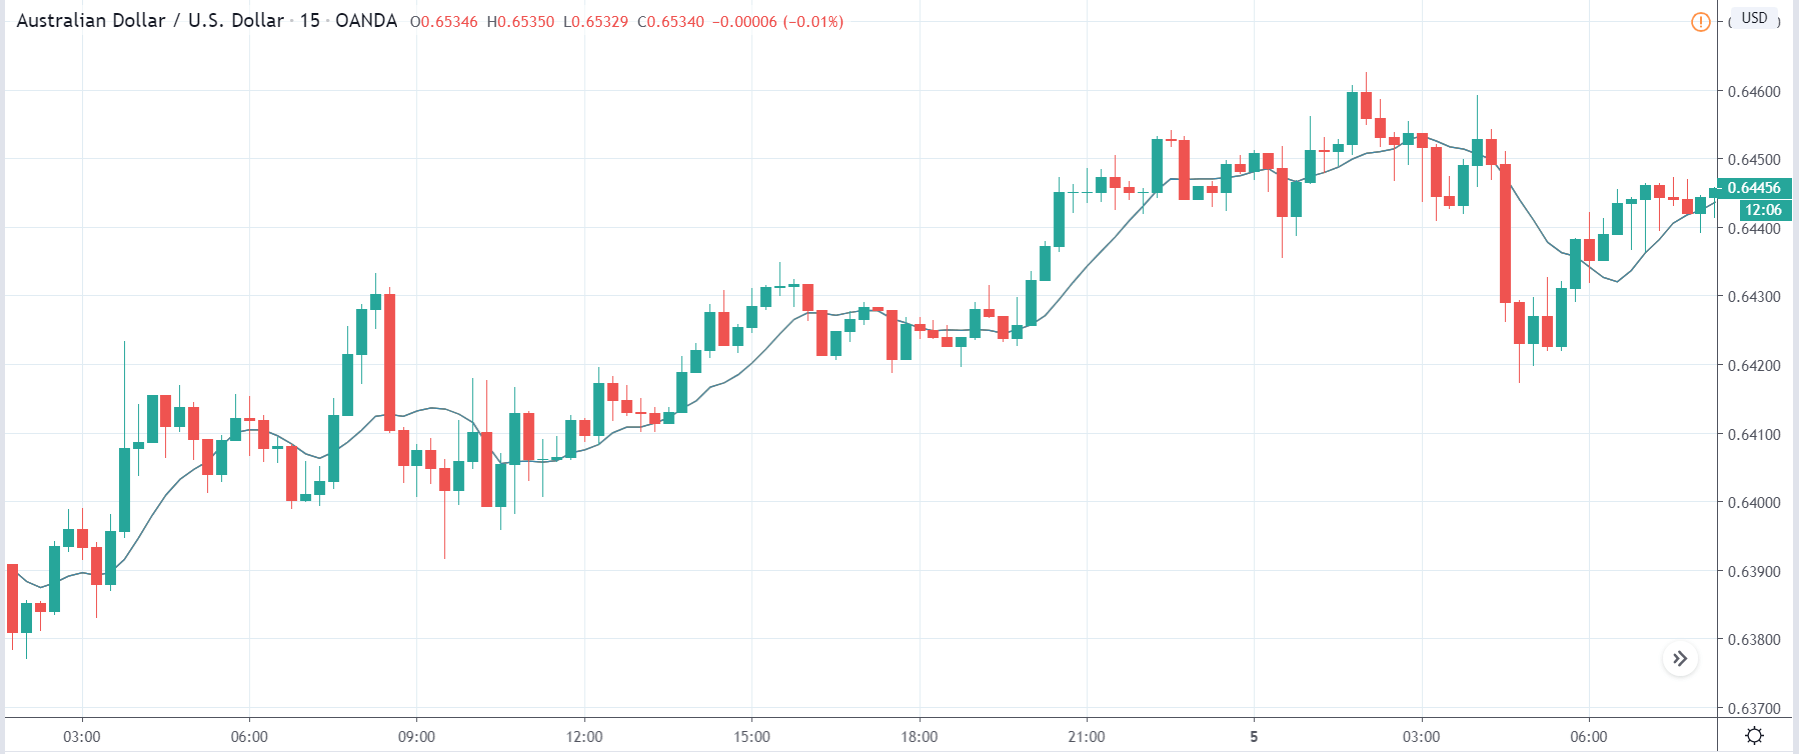
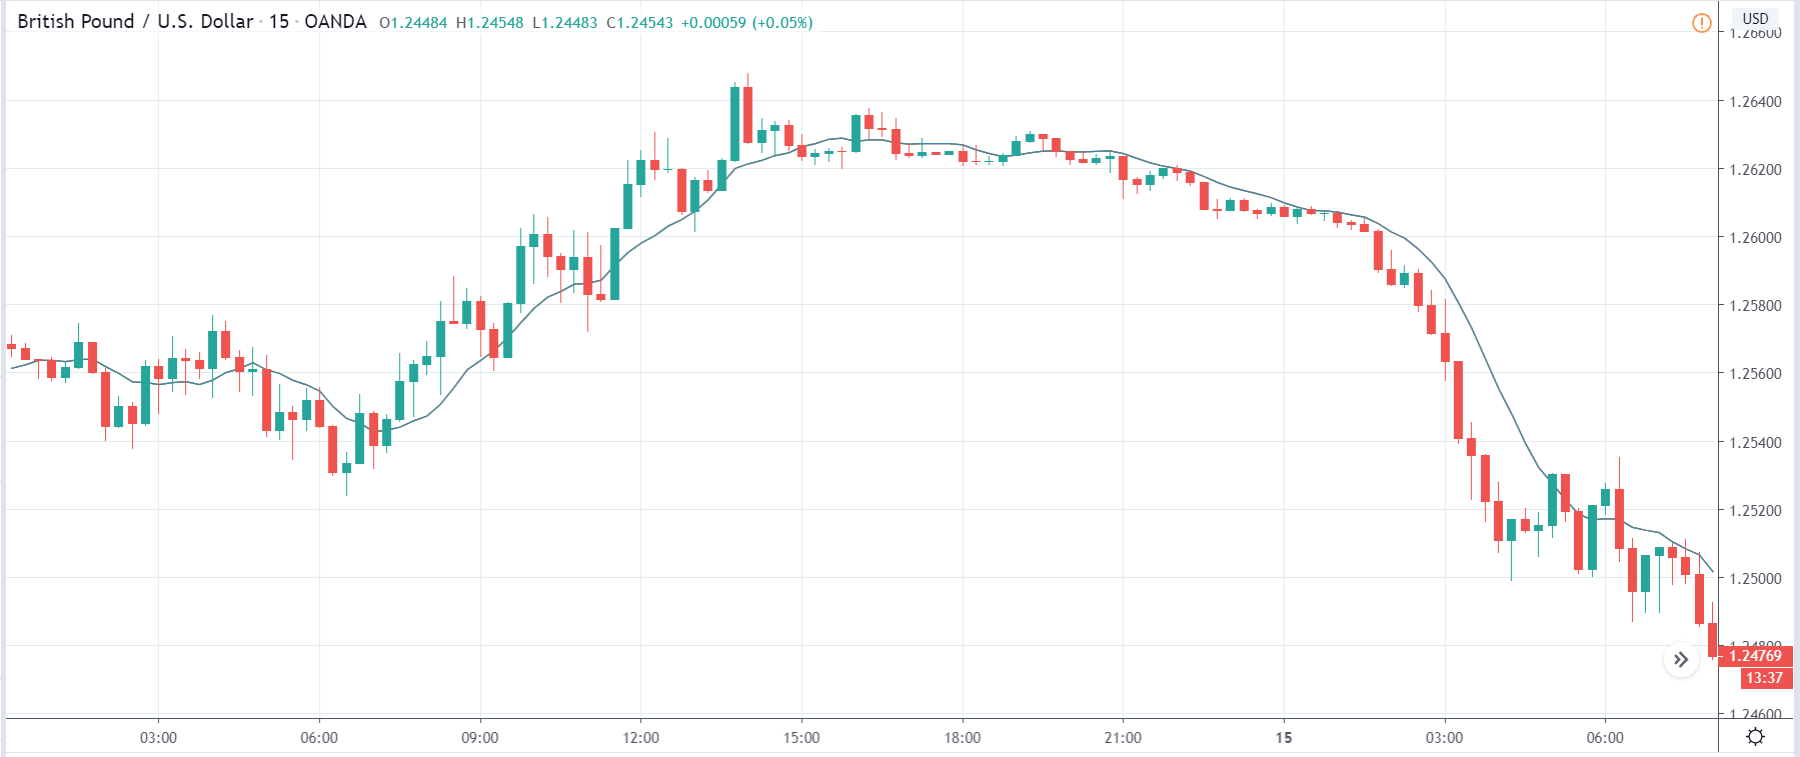
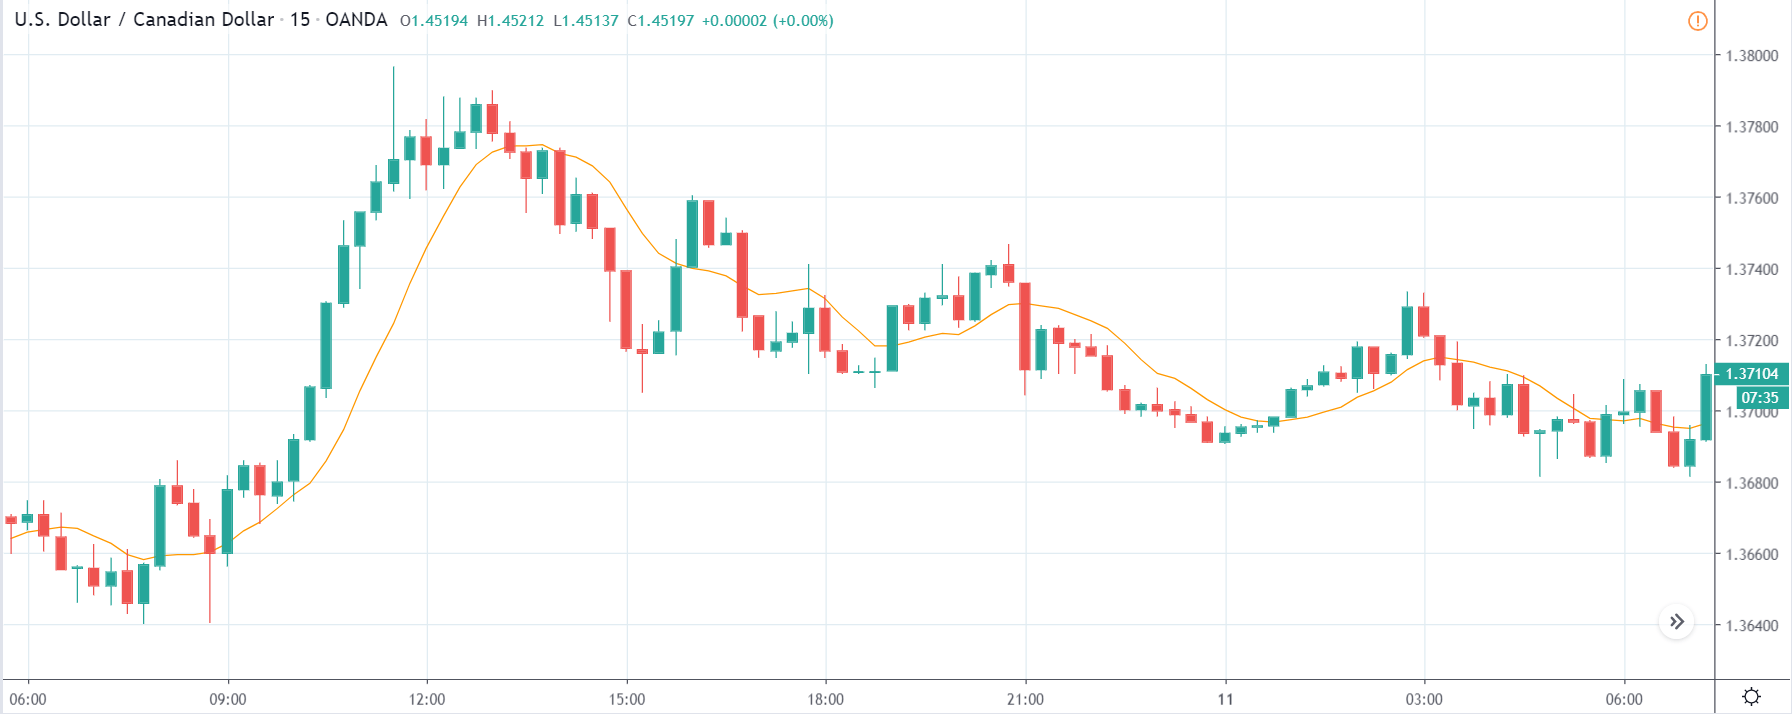
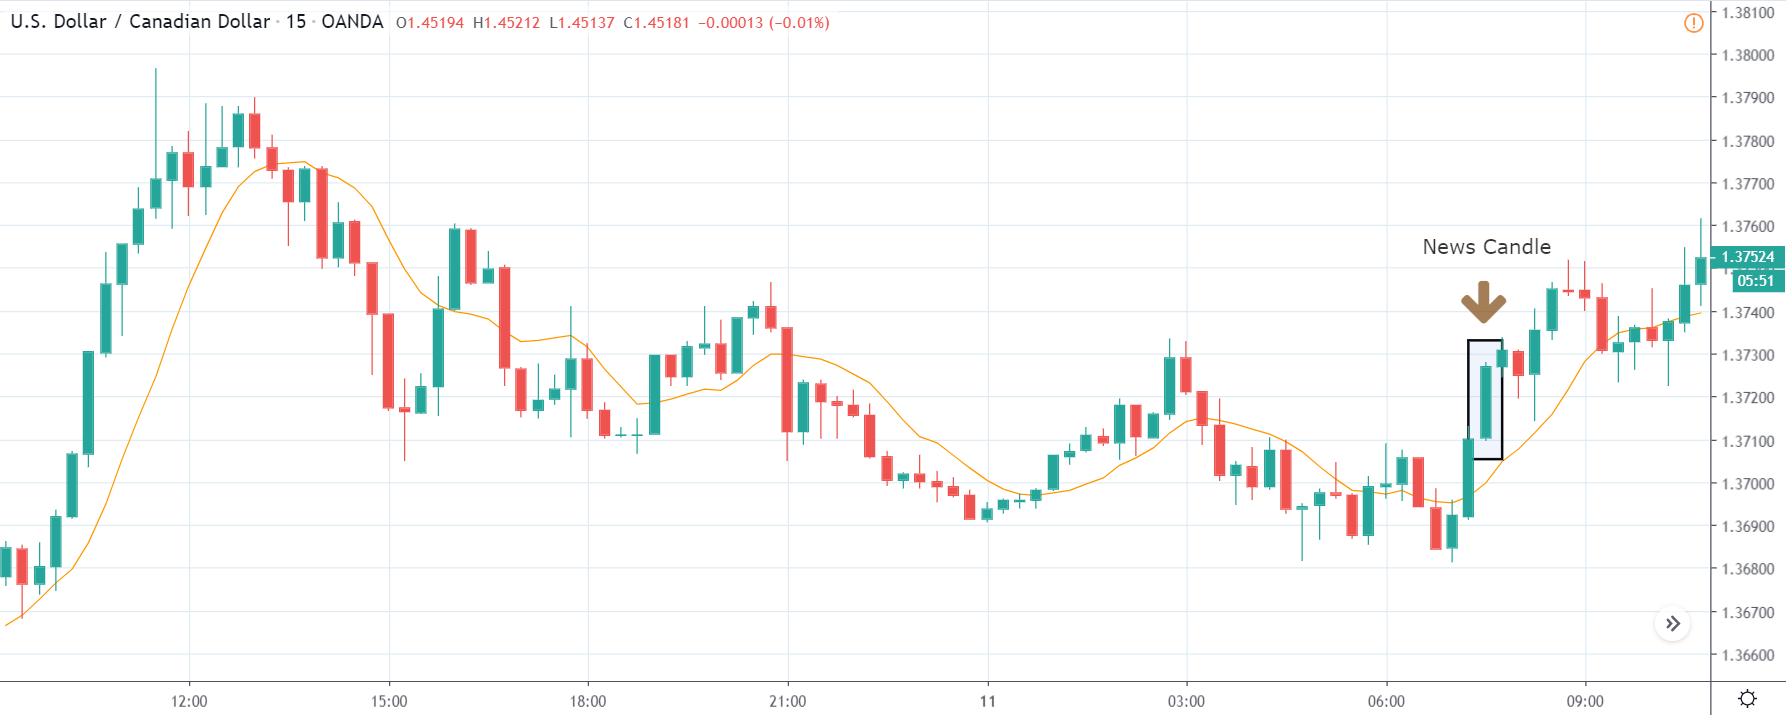
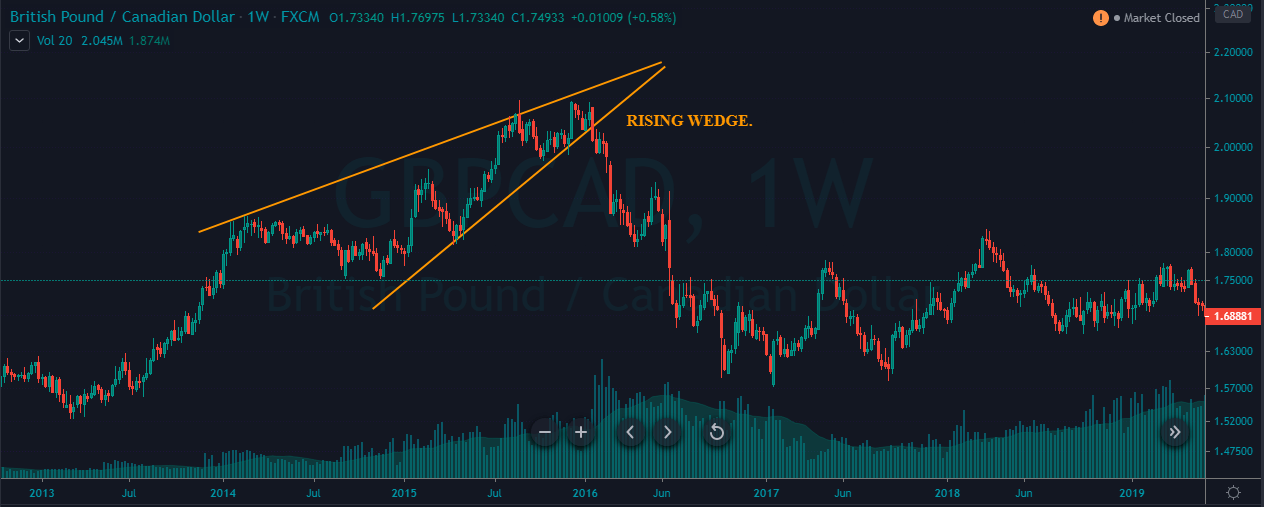
GBP/CAD | Before The Announcement

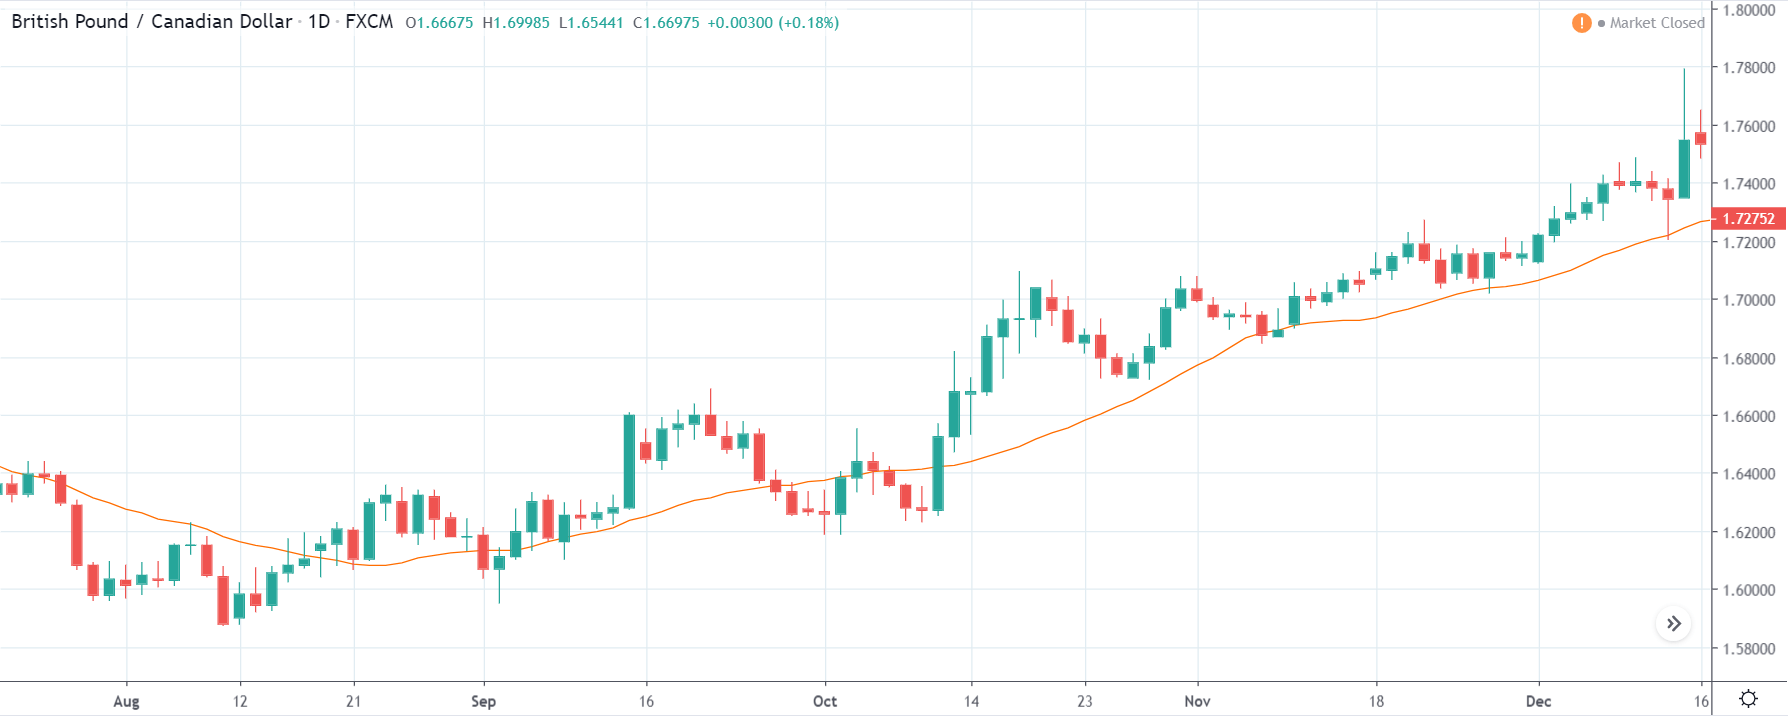
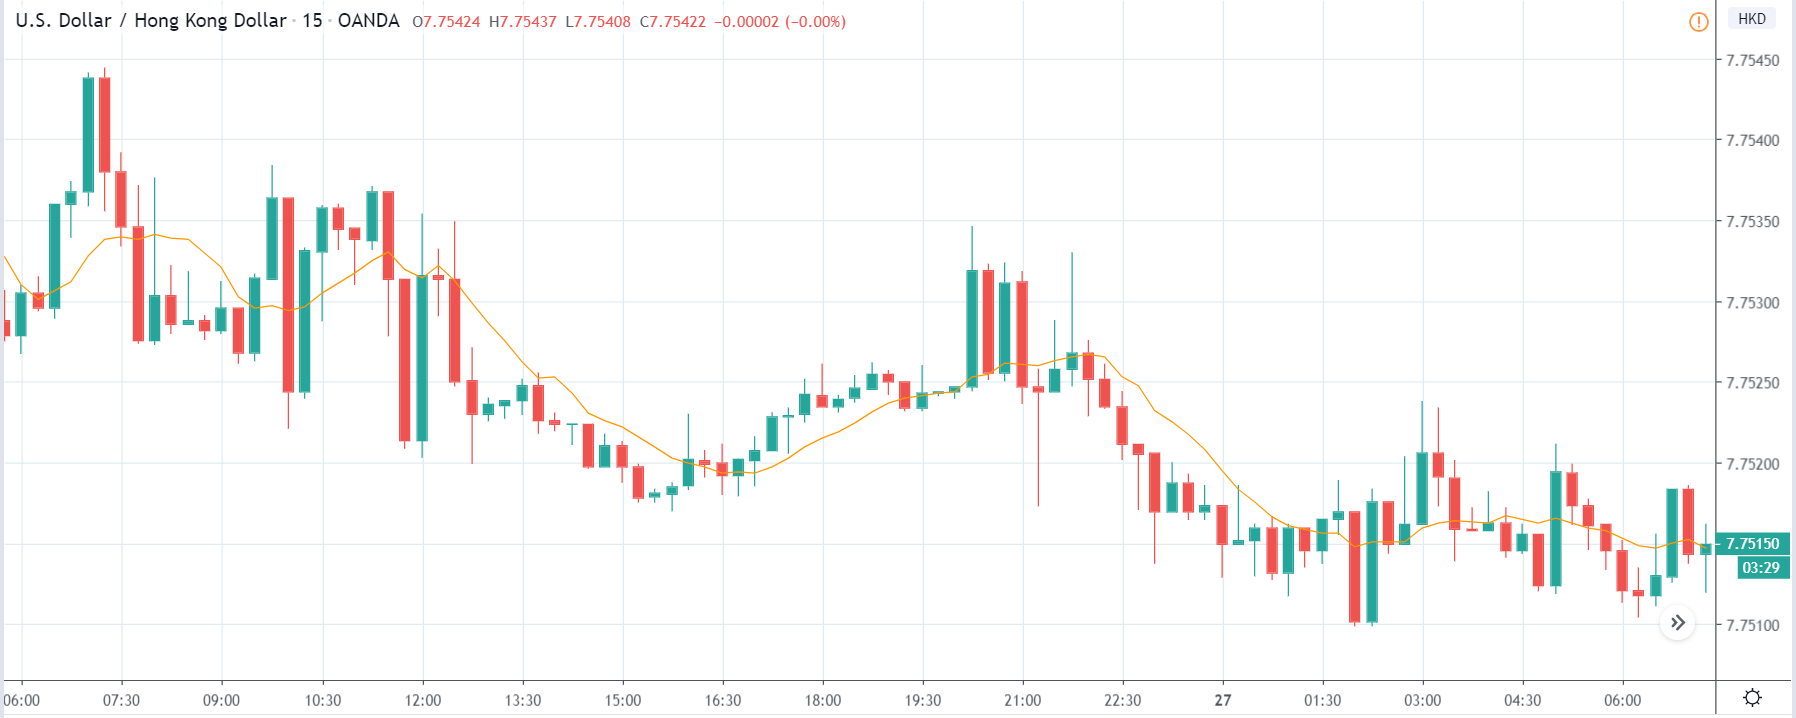
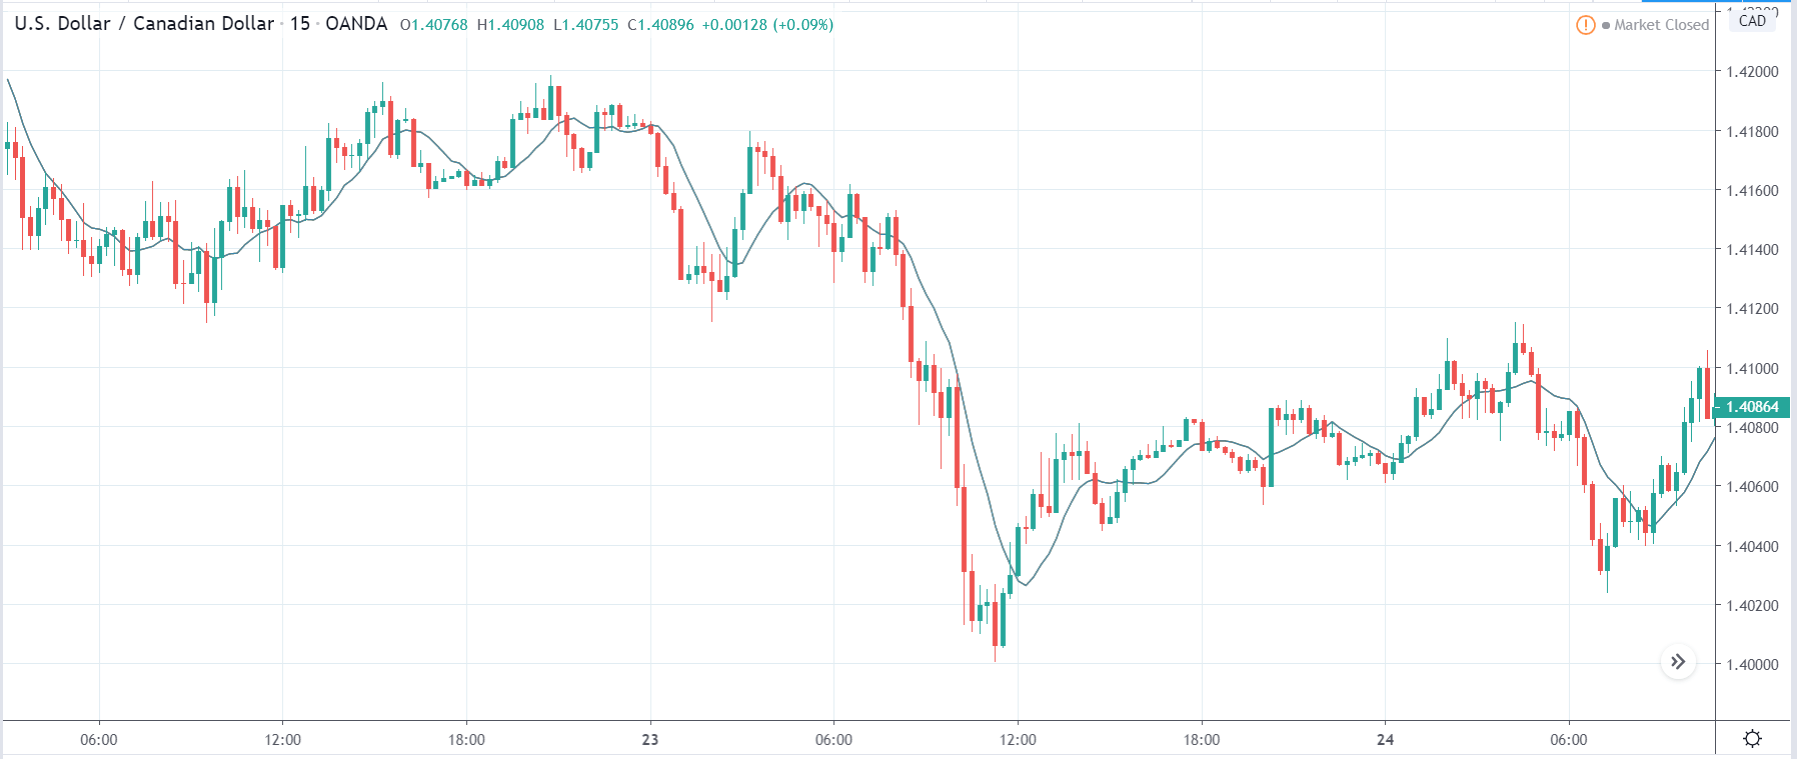
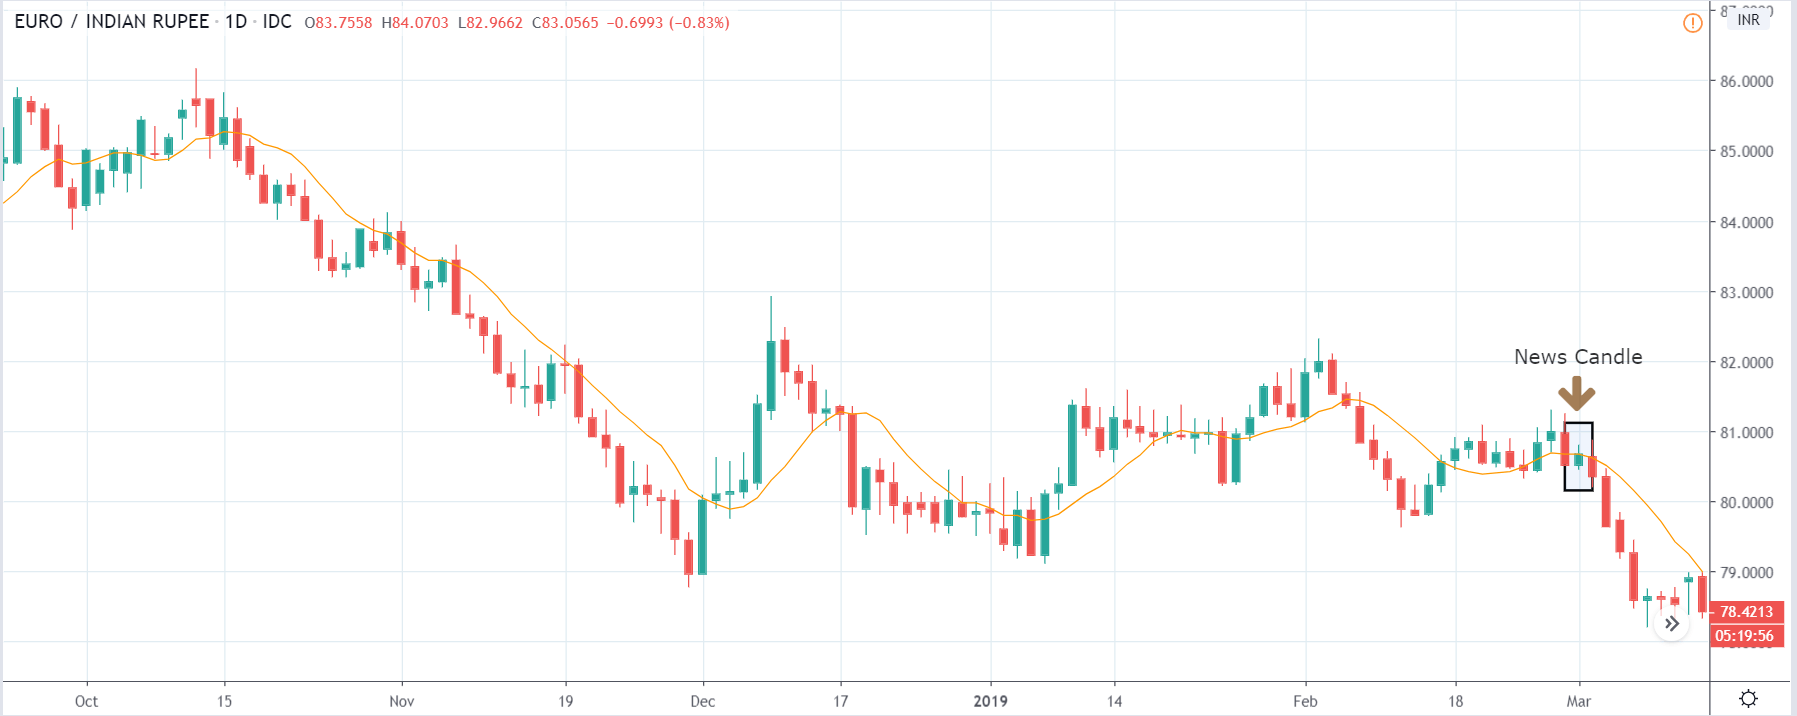
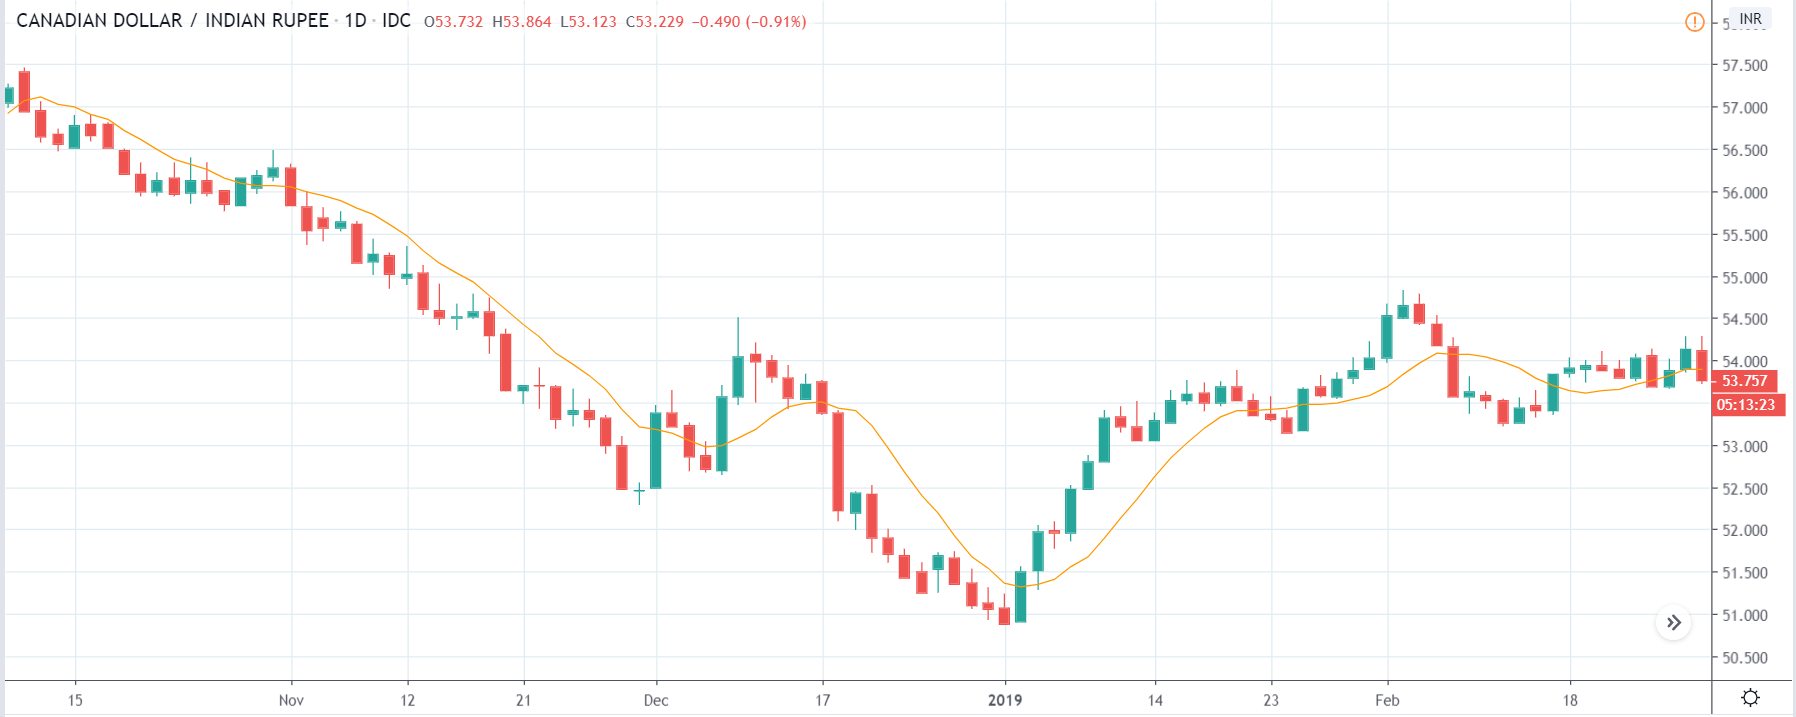
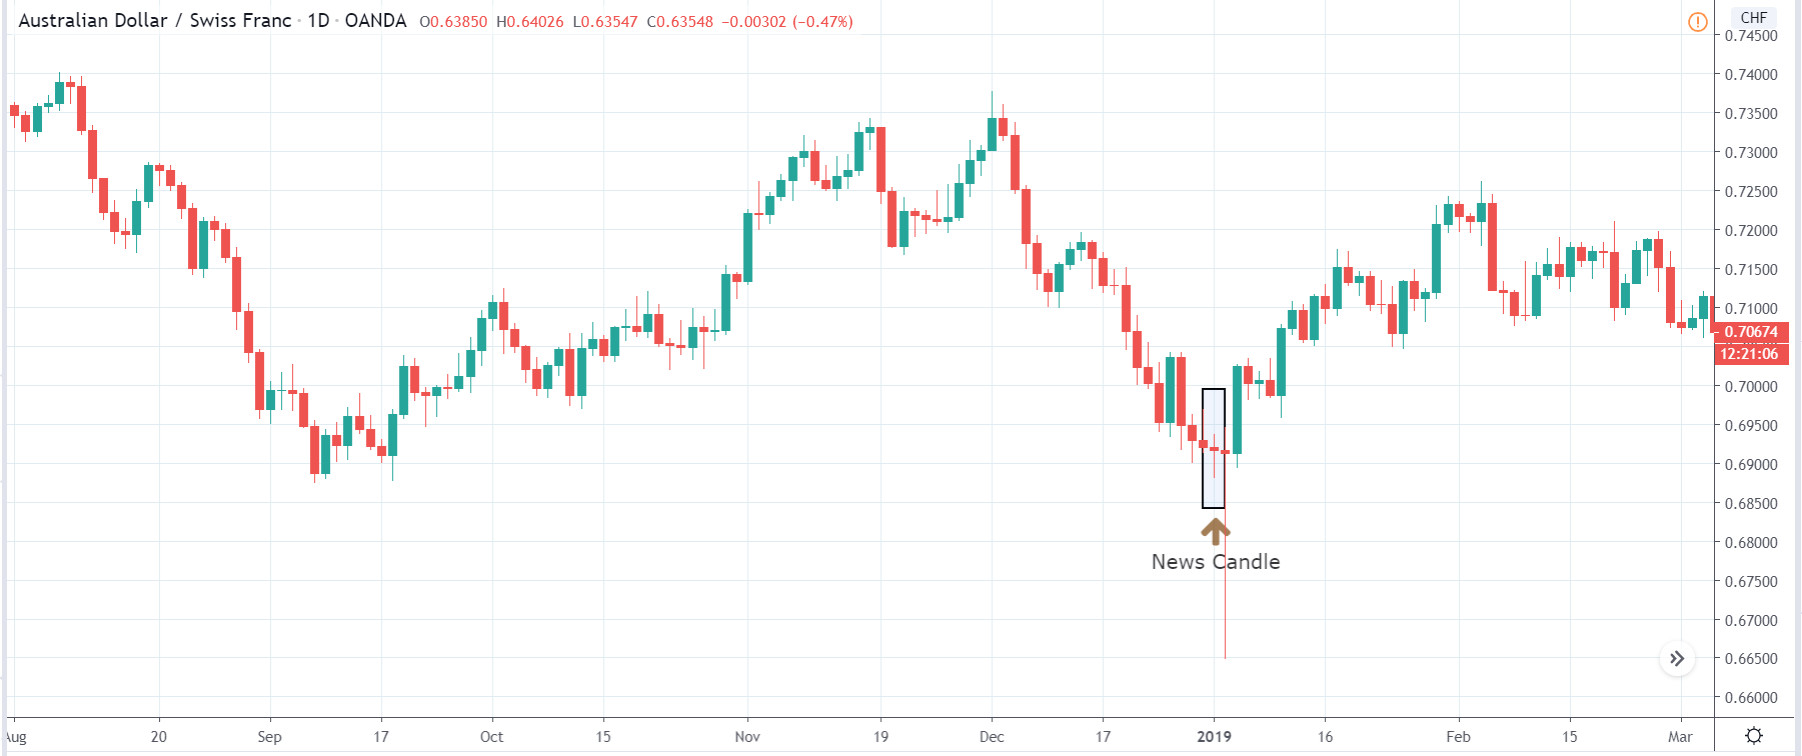
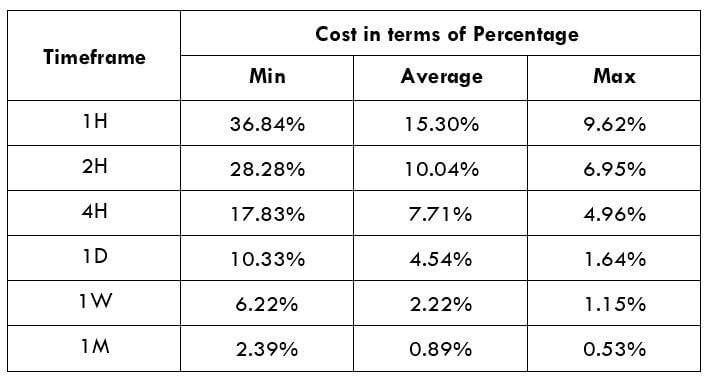
As the Credit Rating announcement is one of the biggest data releases of a country, volatility caused by the news release can be witnessed more clearly on a daily time-frame chart. Likewise, we have considered the ‘daily’ chart of GBP/CAD that shows an uptrend market. As we do not have any forecasted data available for the same, we cannot take any position in the market based on predicted ratings. The only way we position ourselves in the market before the news announcement is through the ‘options’ segment, where we can essentially take advantage of the increase in volatility on either side.

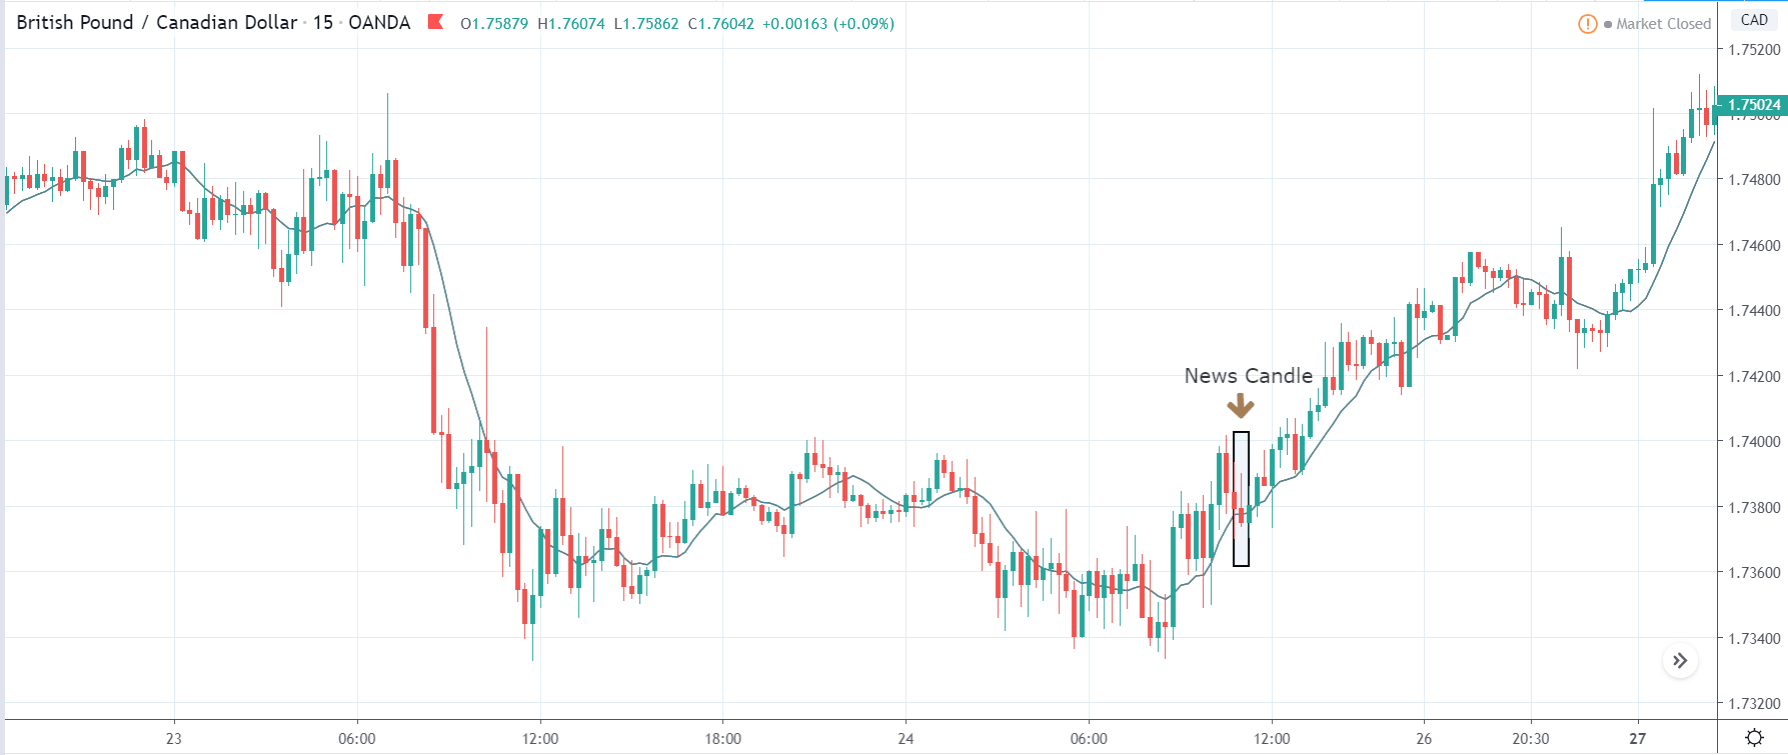
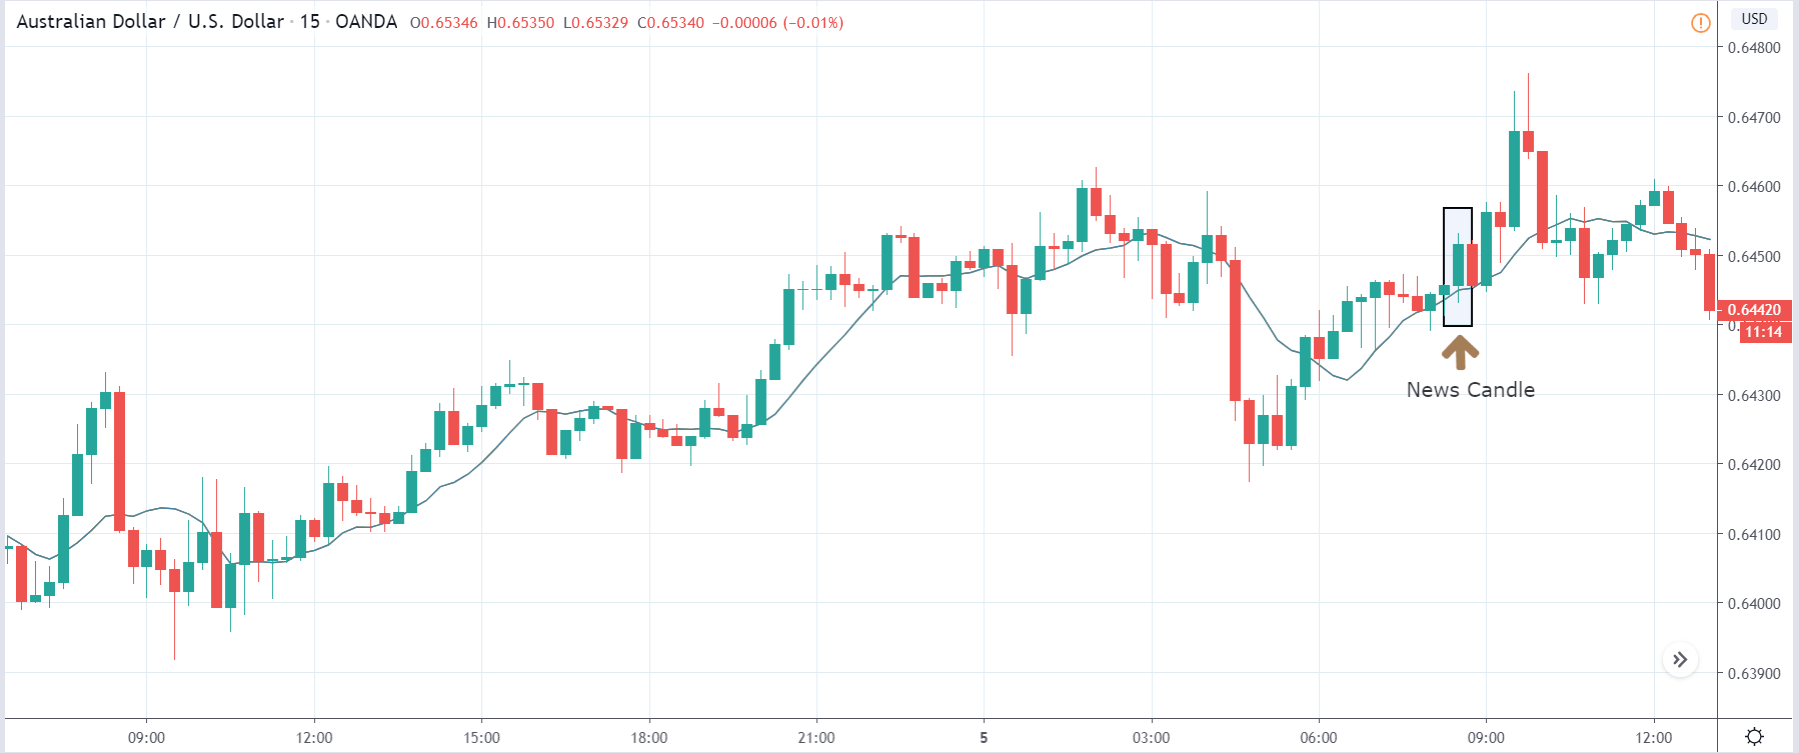
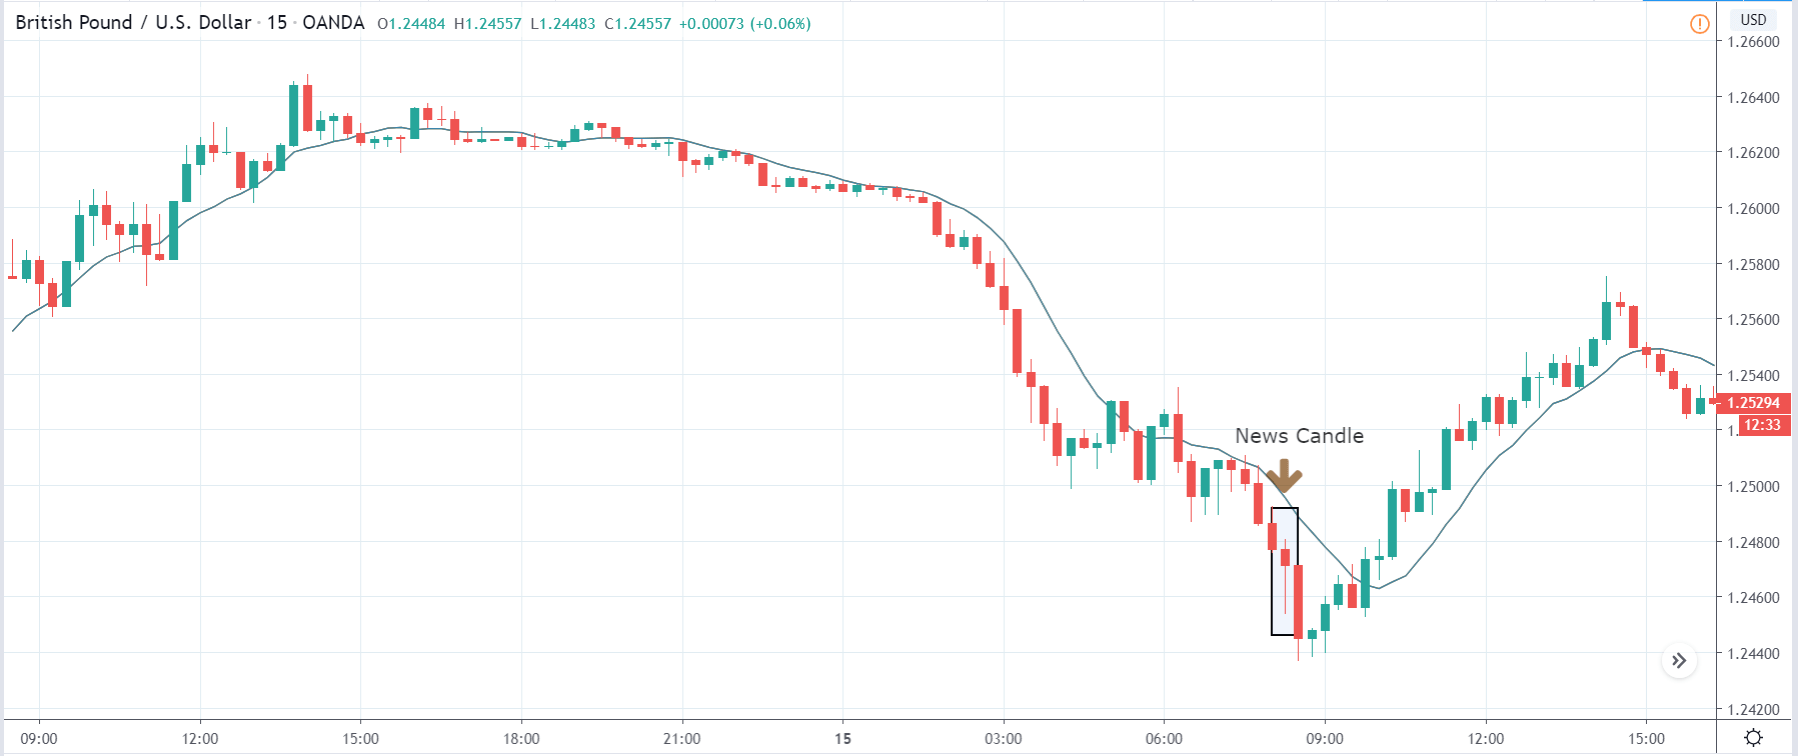
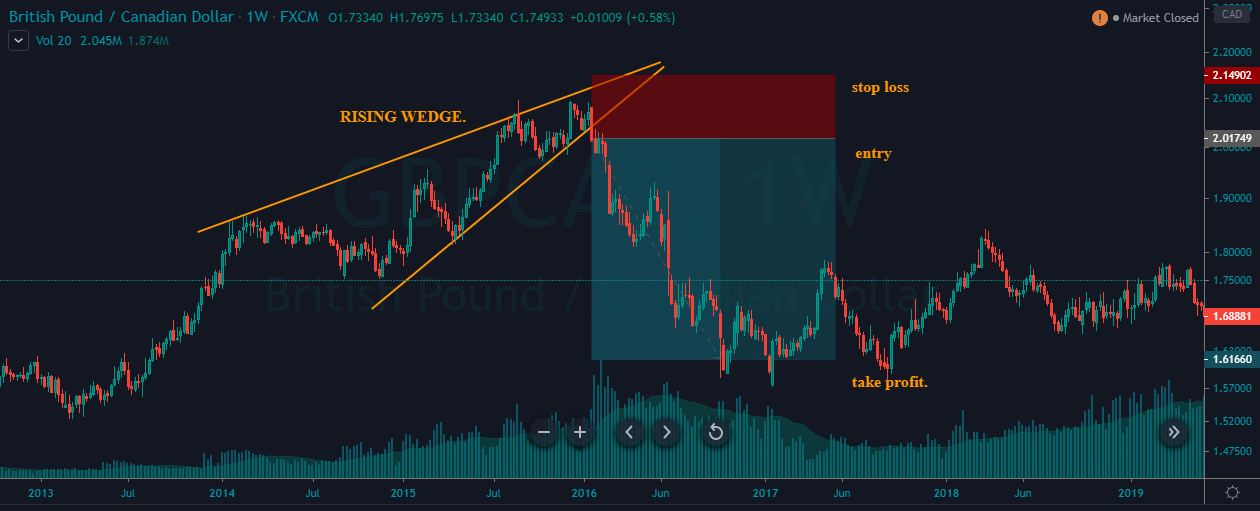
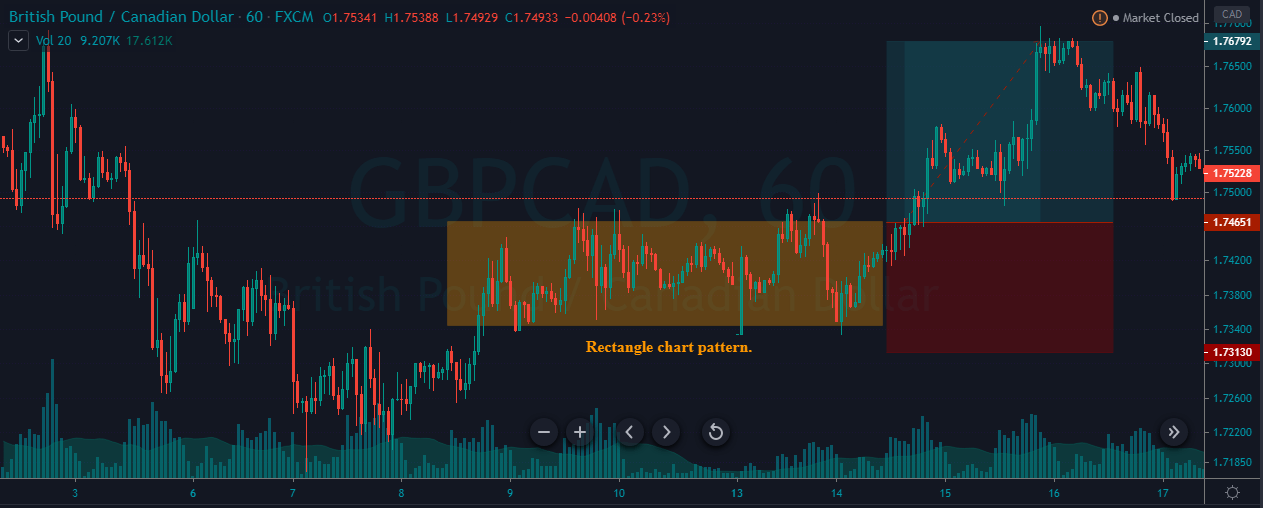
GBP/CAD | After The Announcement

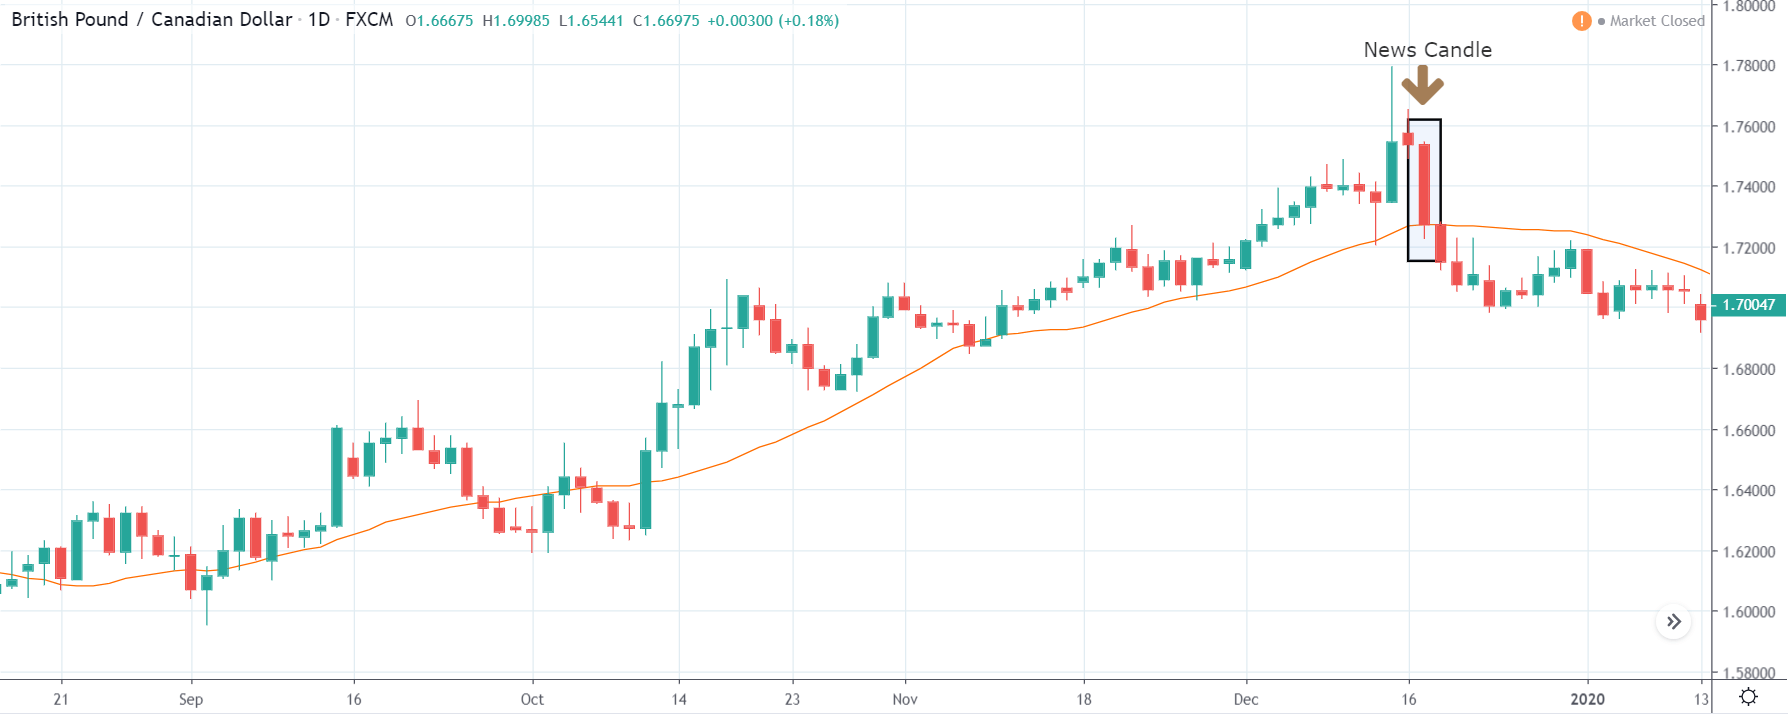
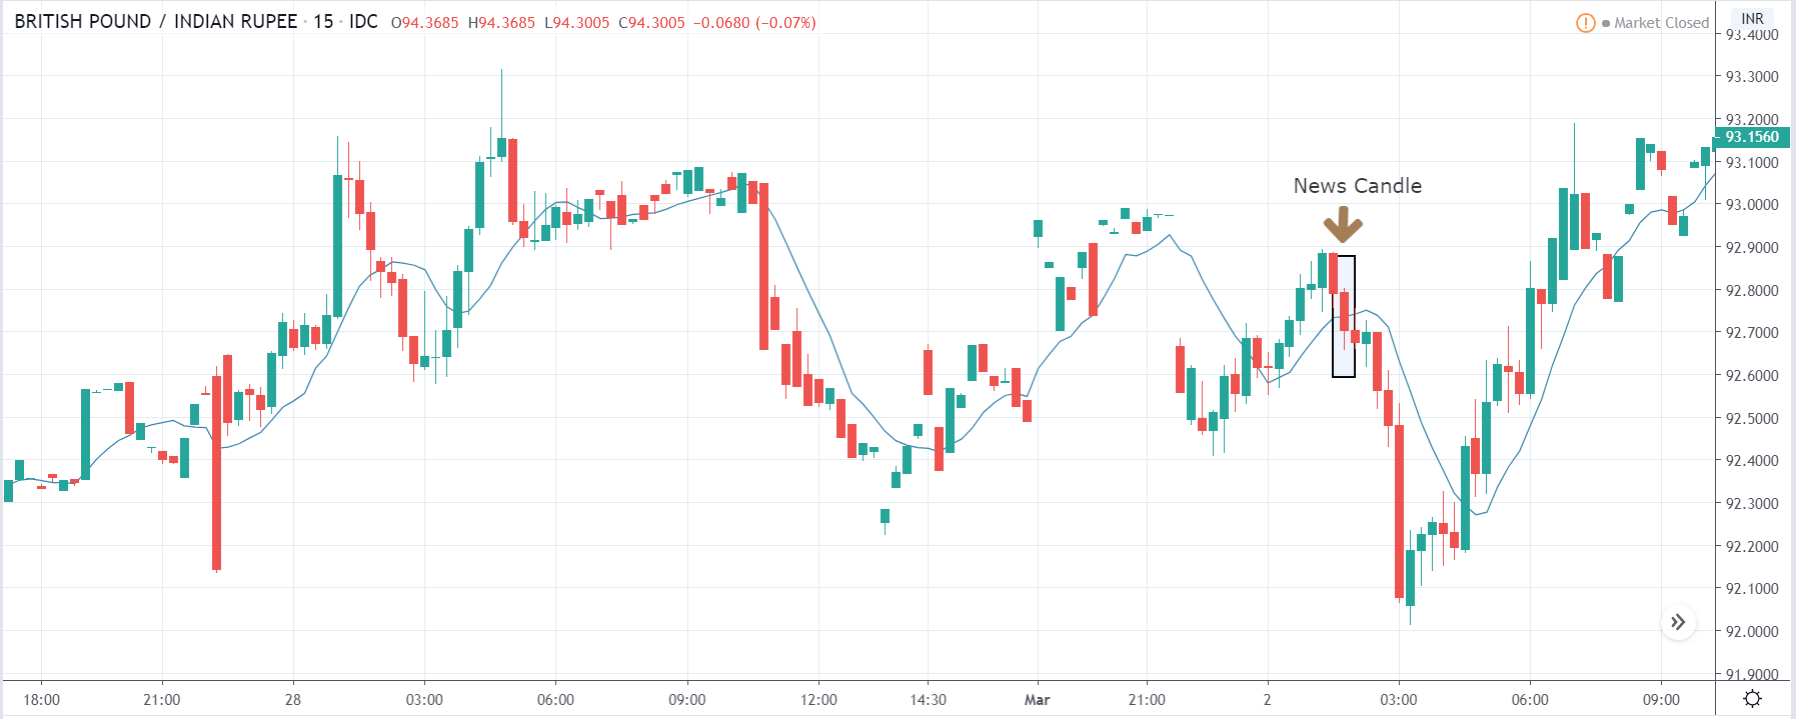
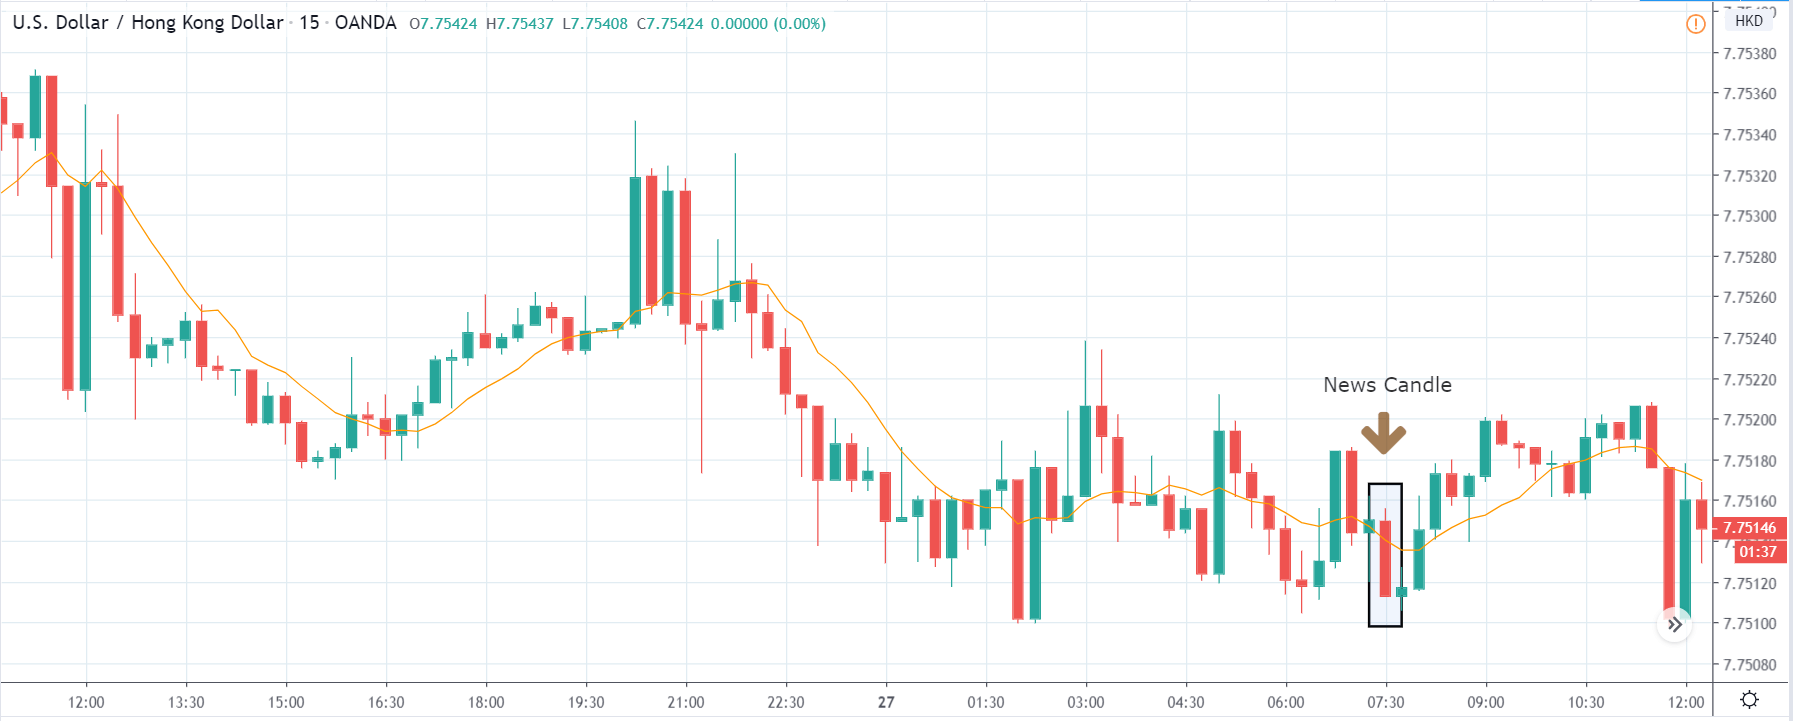
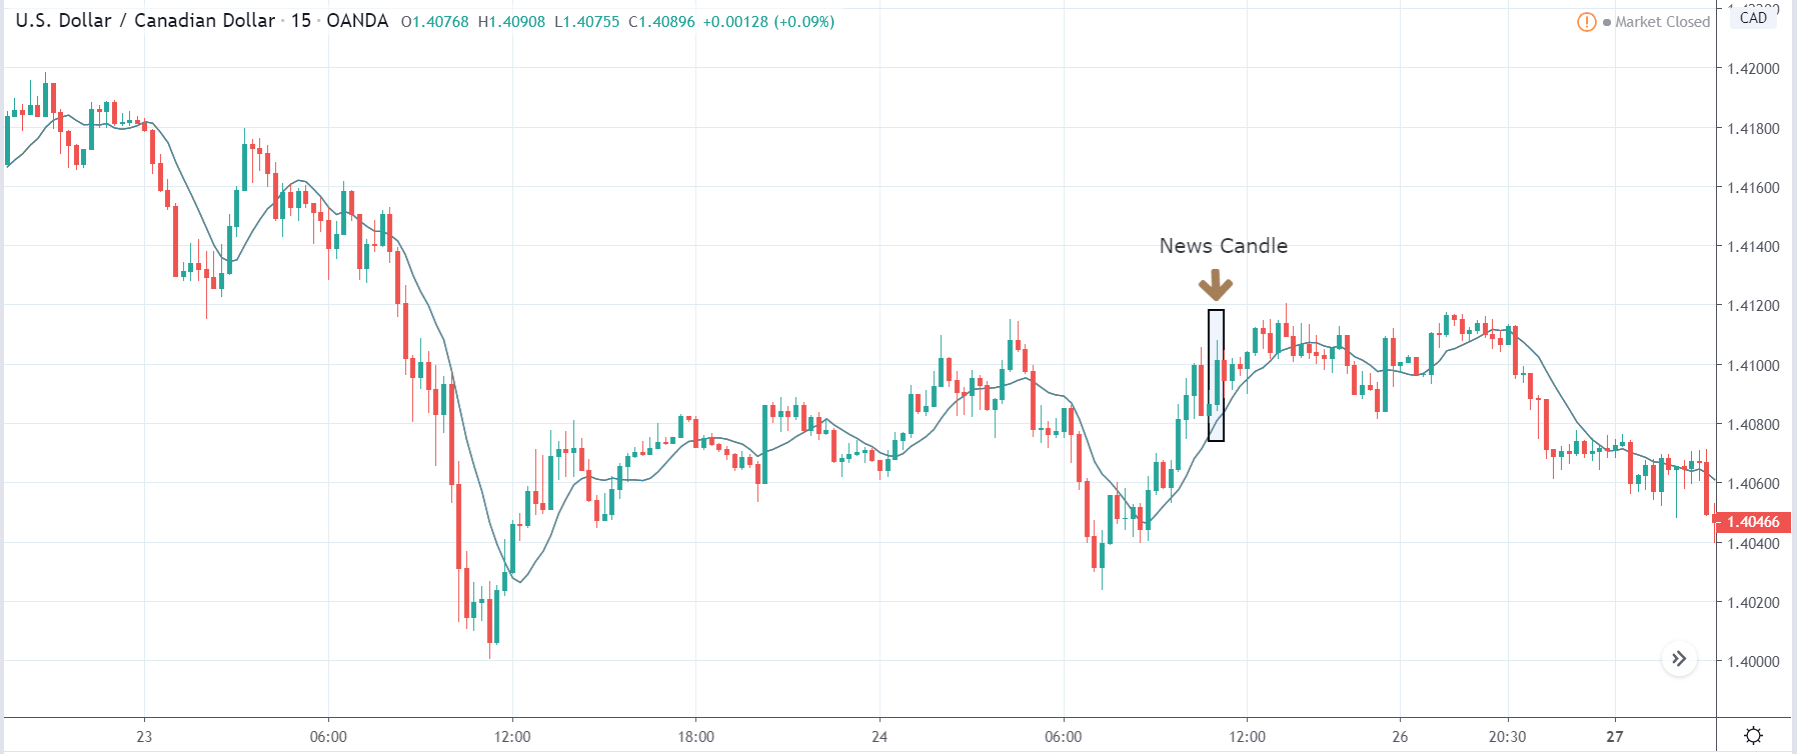
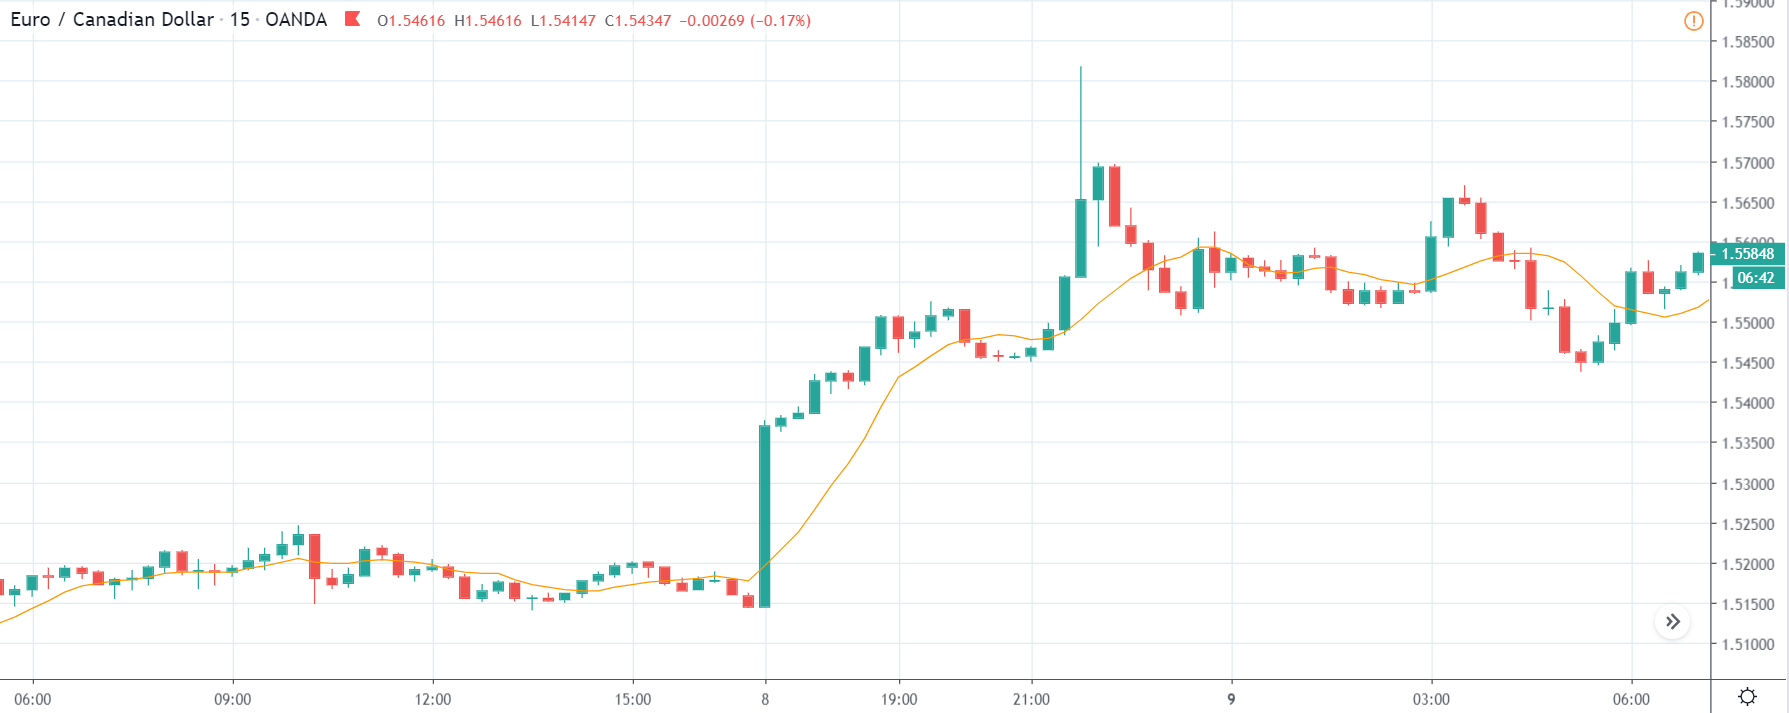
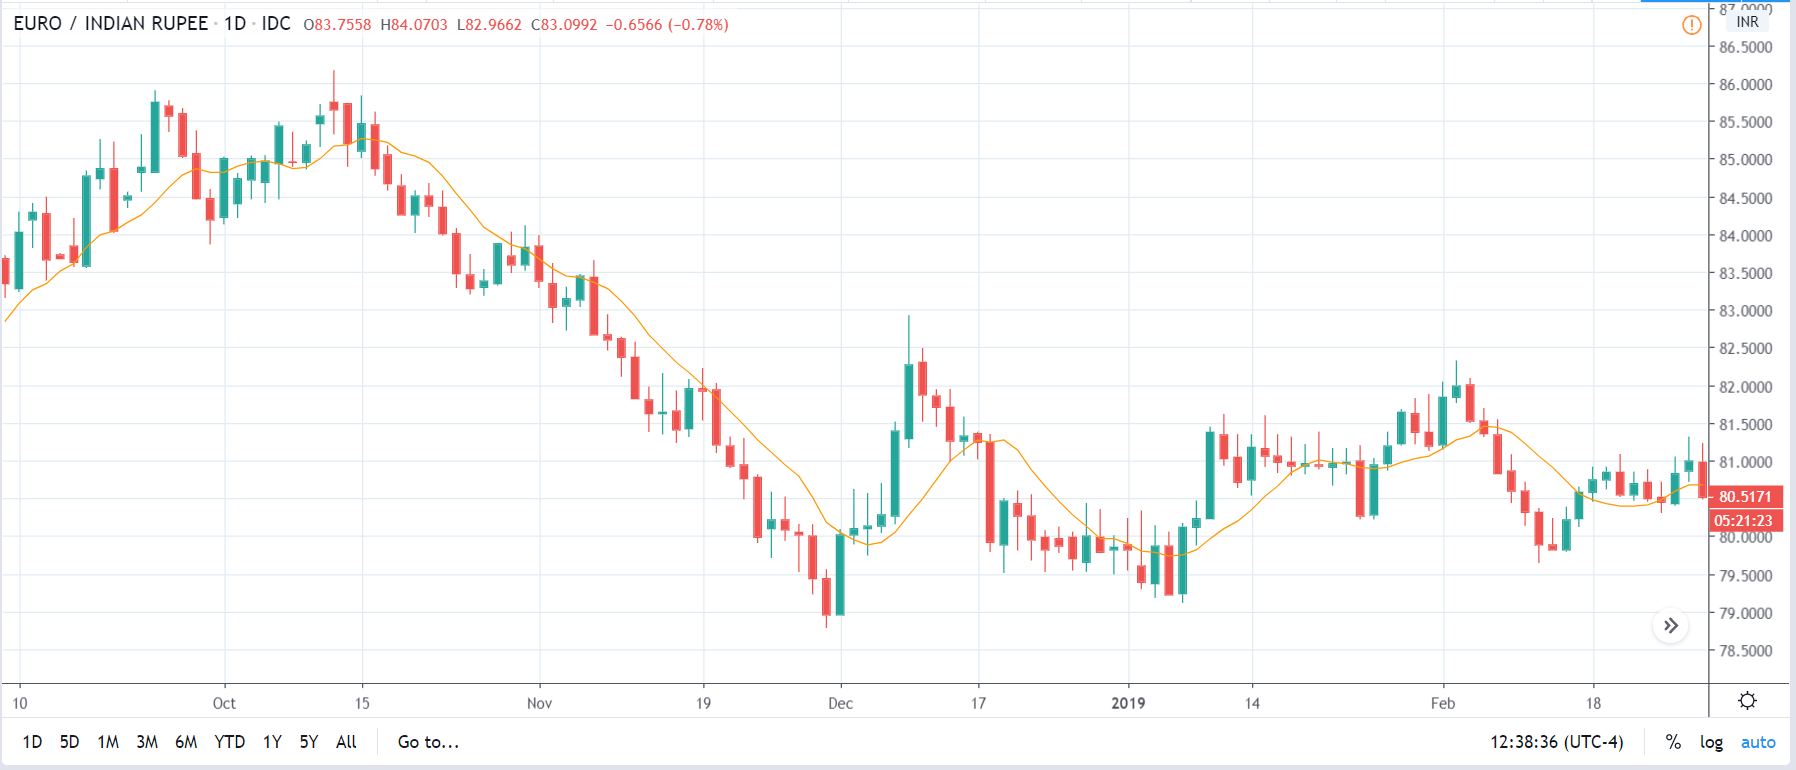
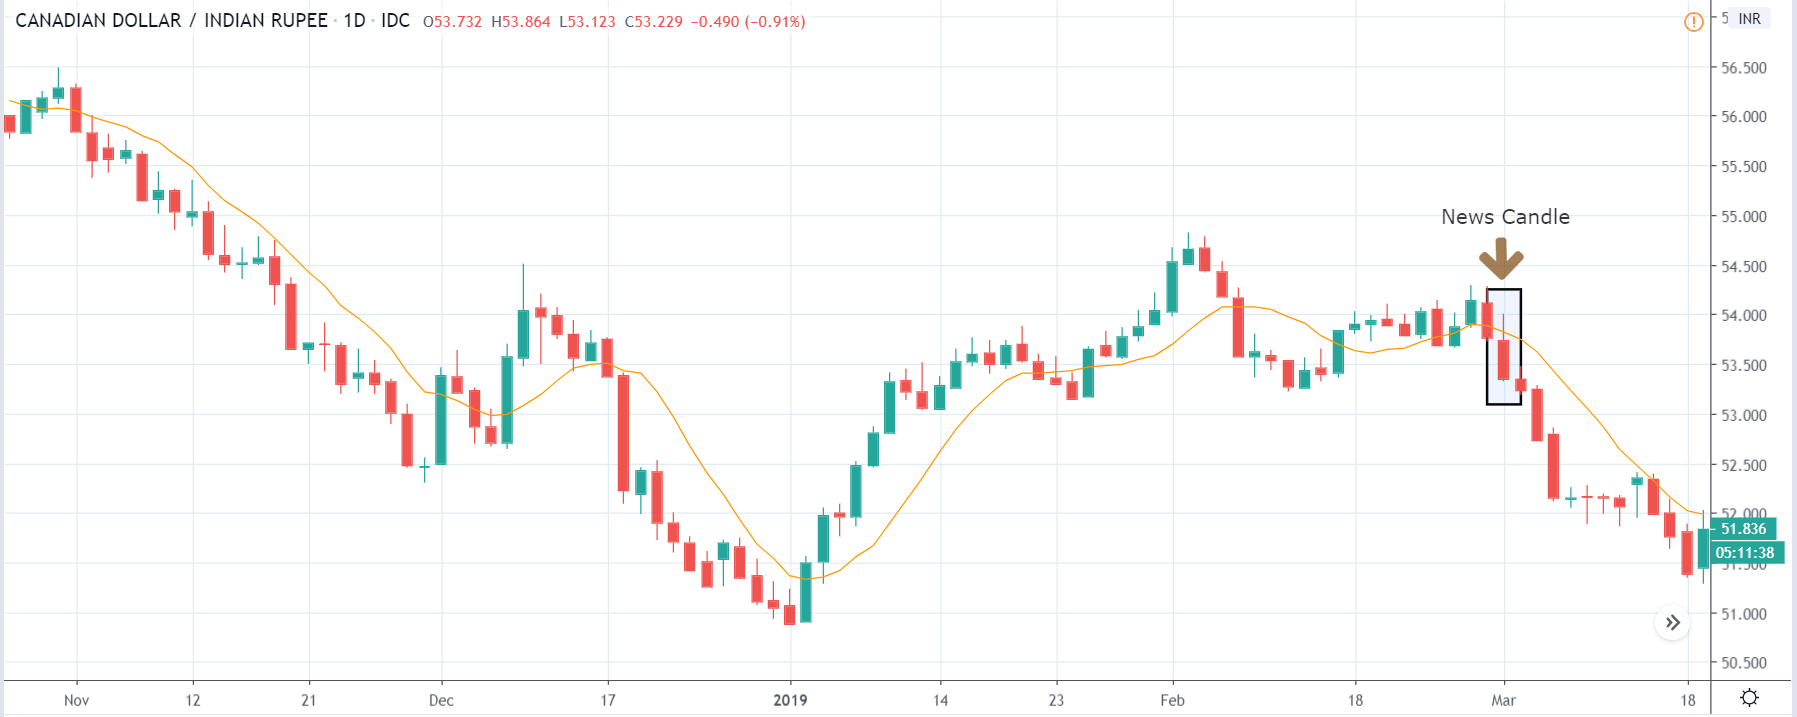
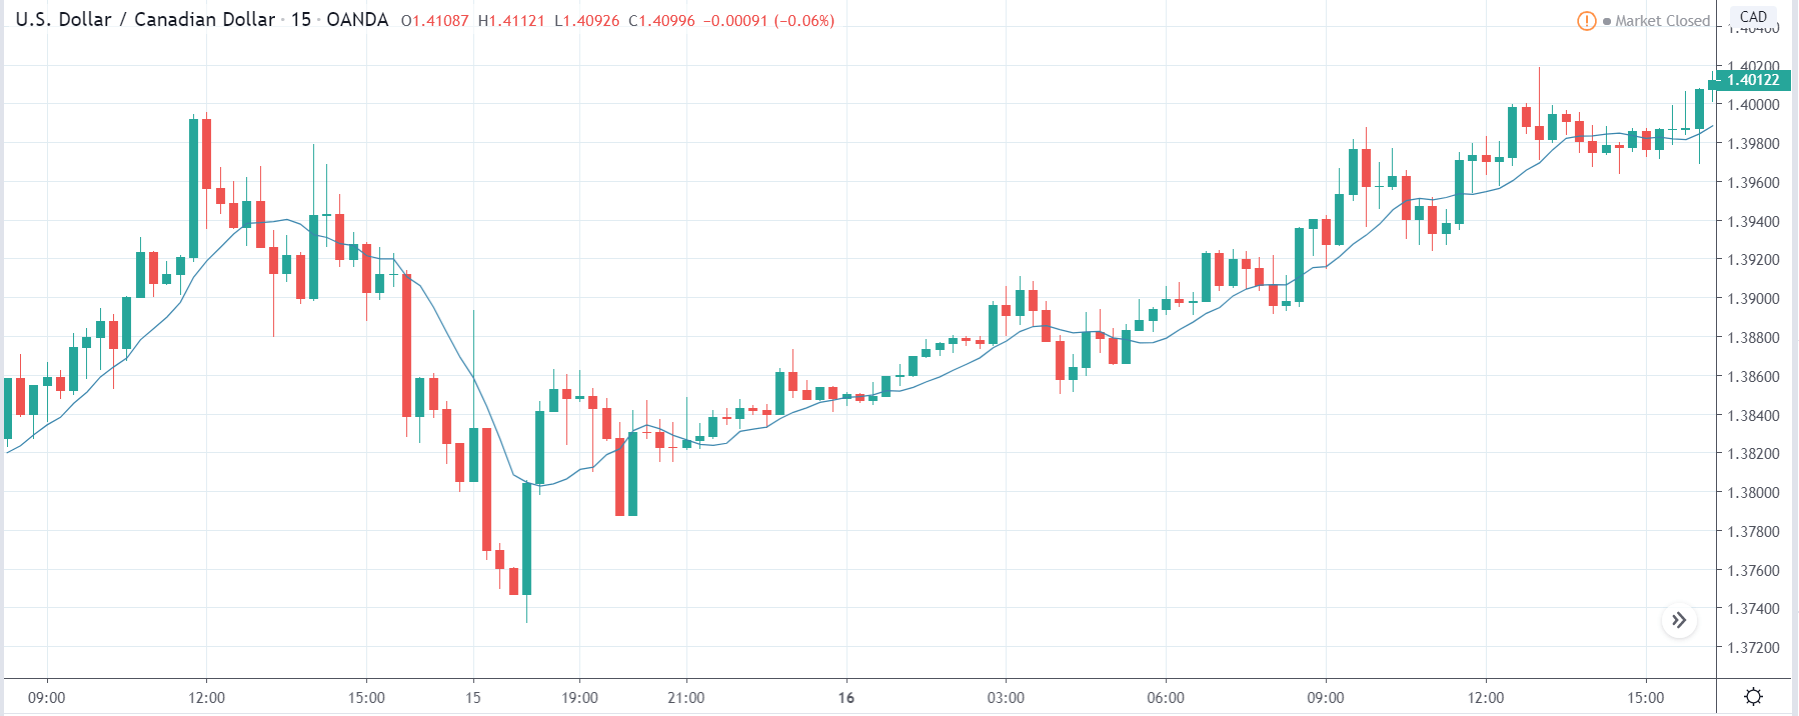
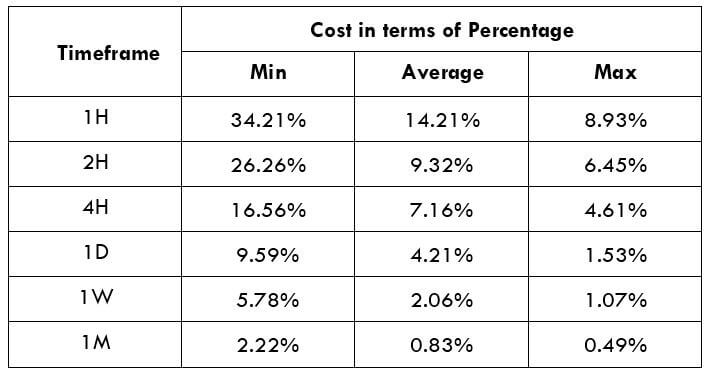
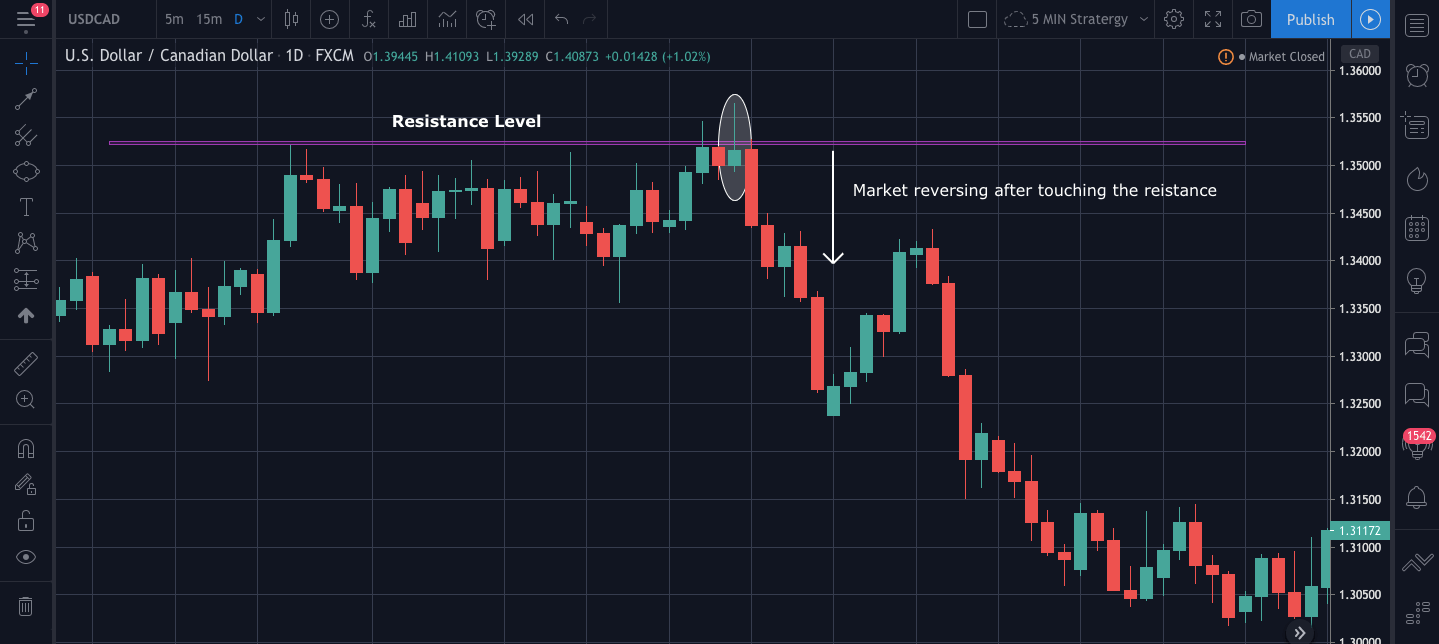
On the day of the Credit Rating announcement, we see that the market falls by more than 500 pips resulting in a complete reversal of the trend. This shows the extent of the impact of Credit Rating on a currency pair. The reason behind the collapse of the British Pound is negative Credit Rating given by the two most renowned agencies.

This rating is used by institutional investors and fund managers to decide if they want to park their cash in the economy. Therefore, when the rating is downgraded, investors withdraw their money from the market and sell British Pound. From a trading point of view, one can take a ‘short’ position in the market with a high much higher ‘take profit’ since the market has the potential to go much lower.

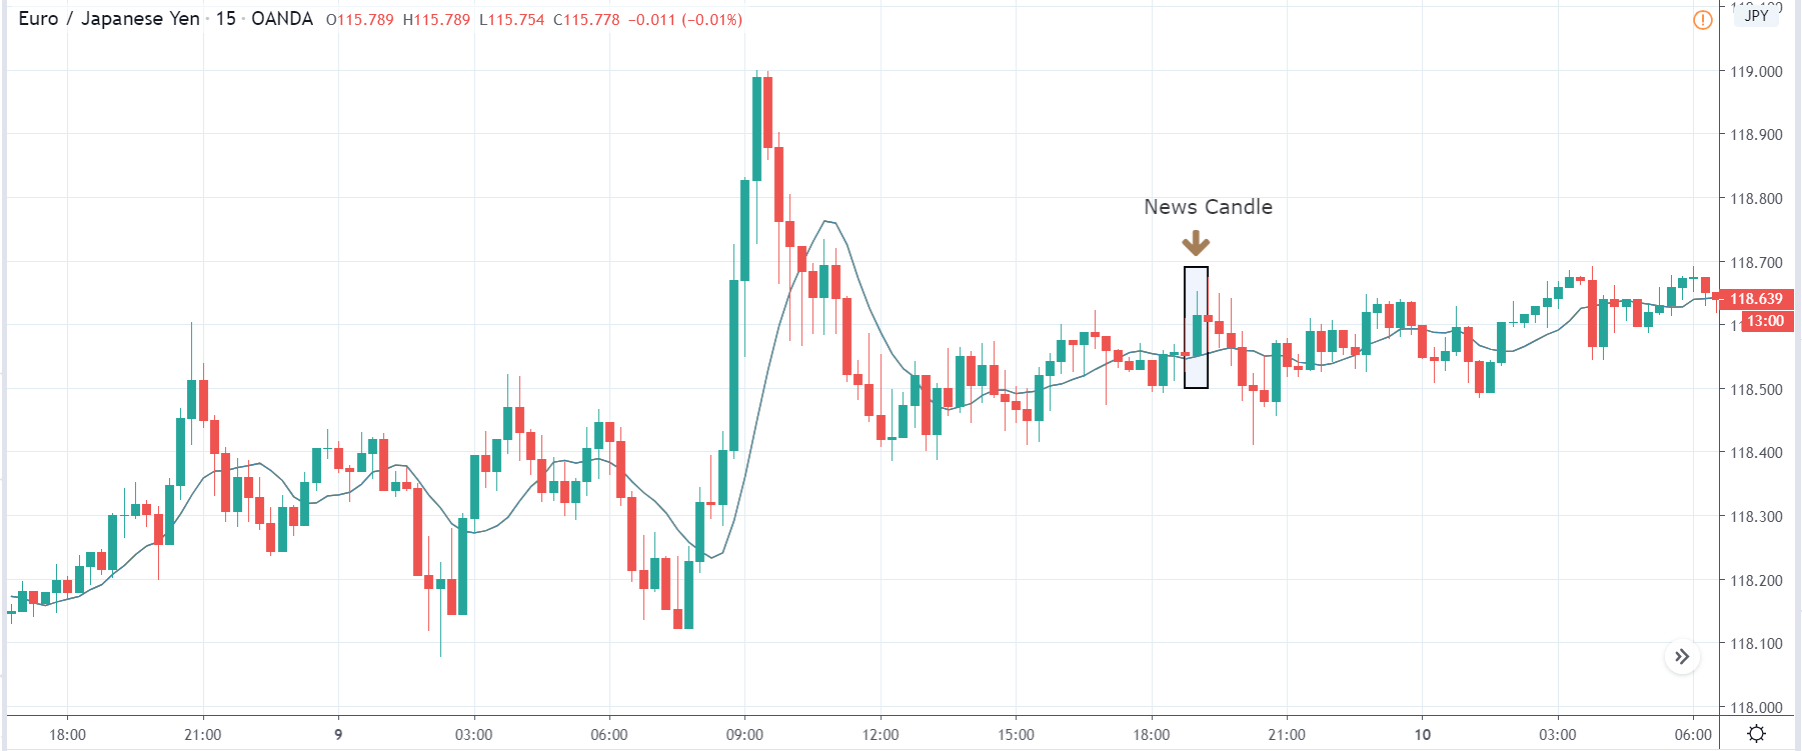
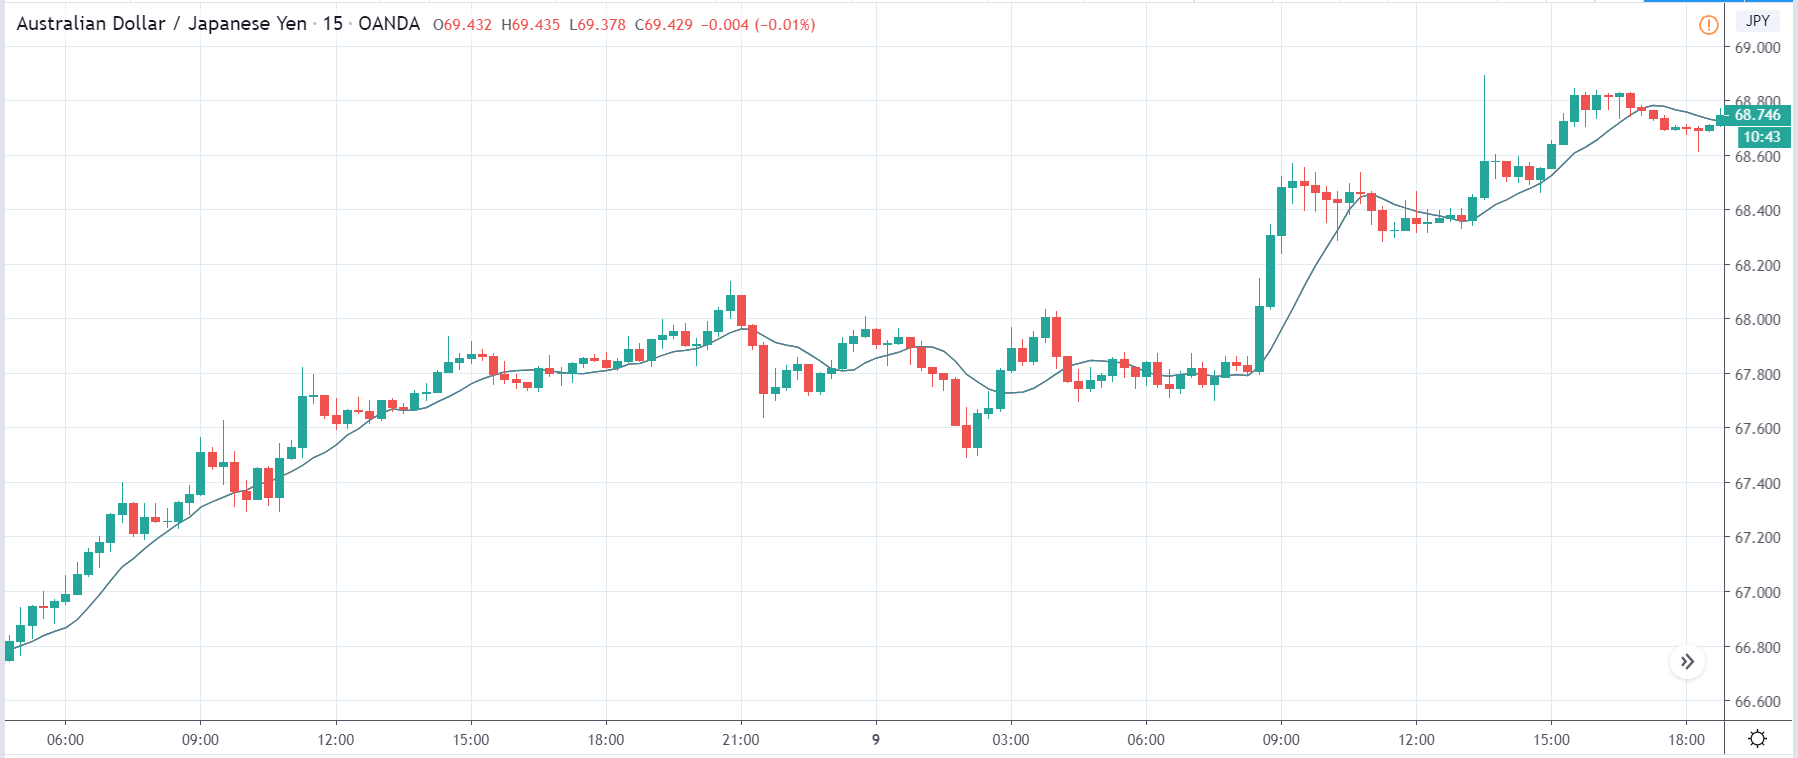
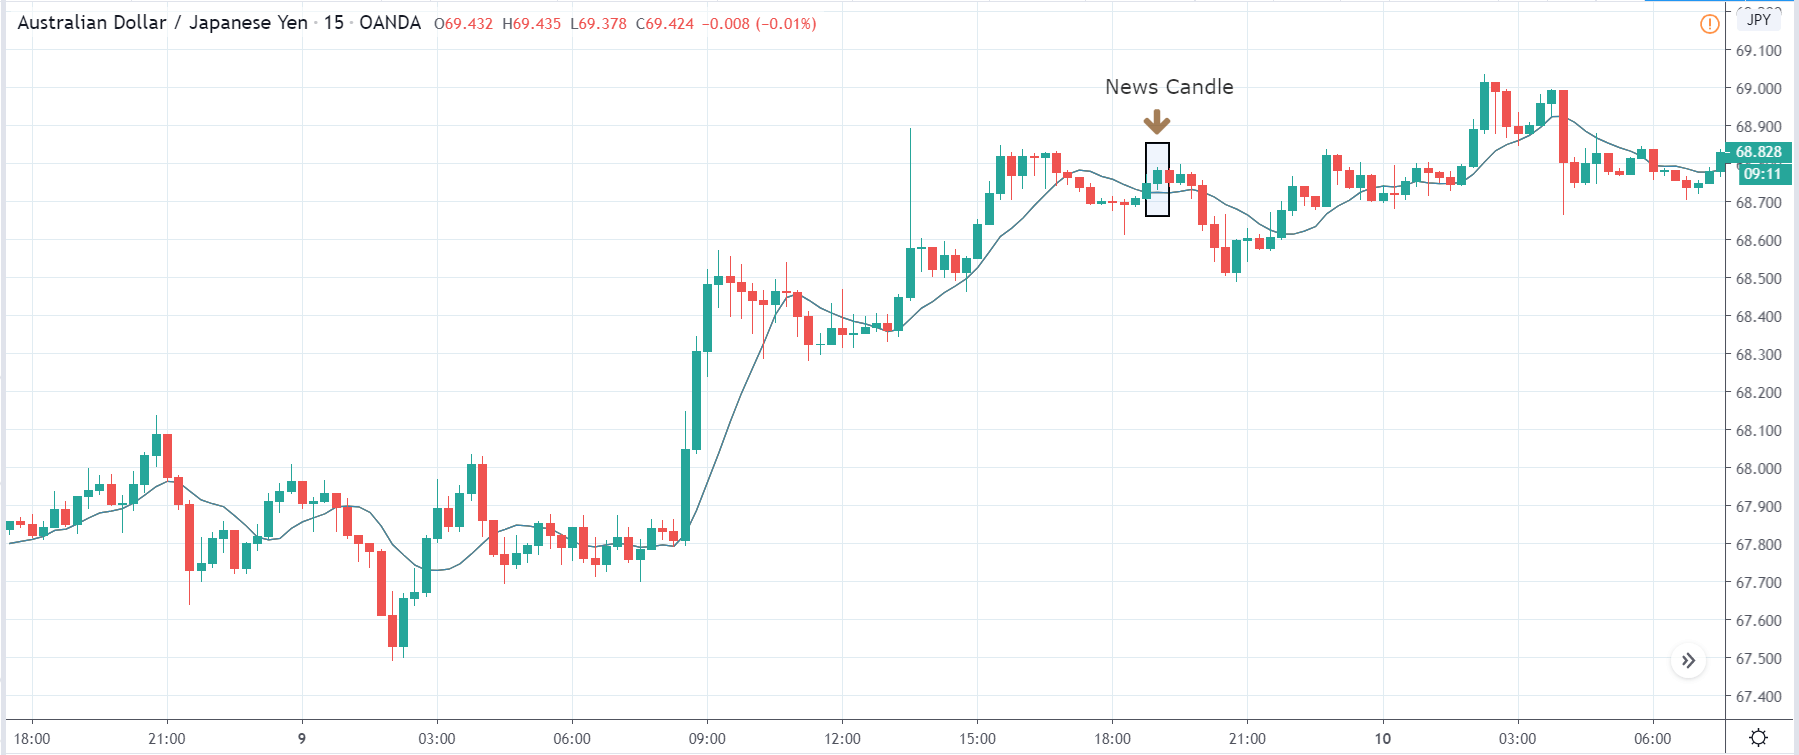
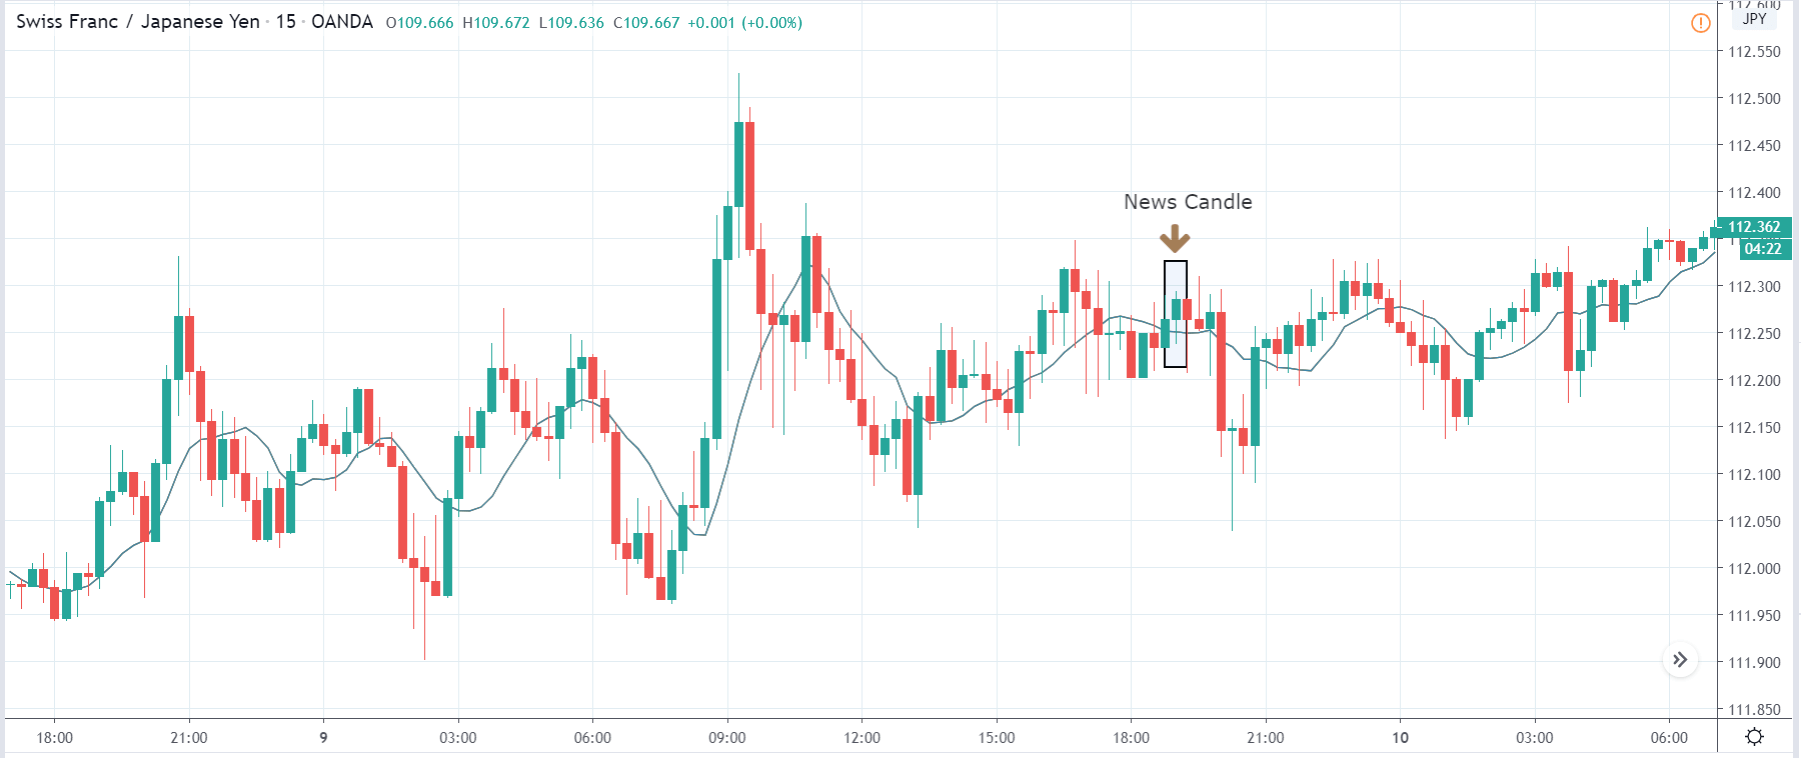
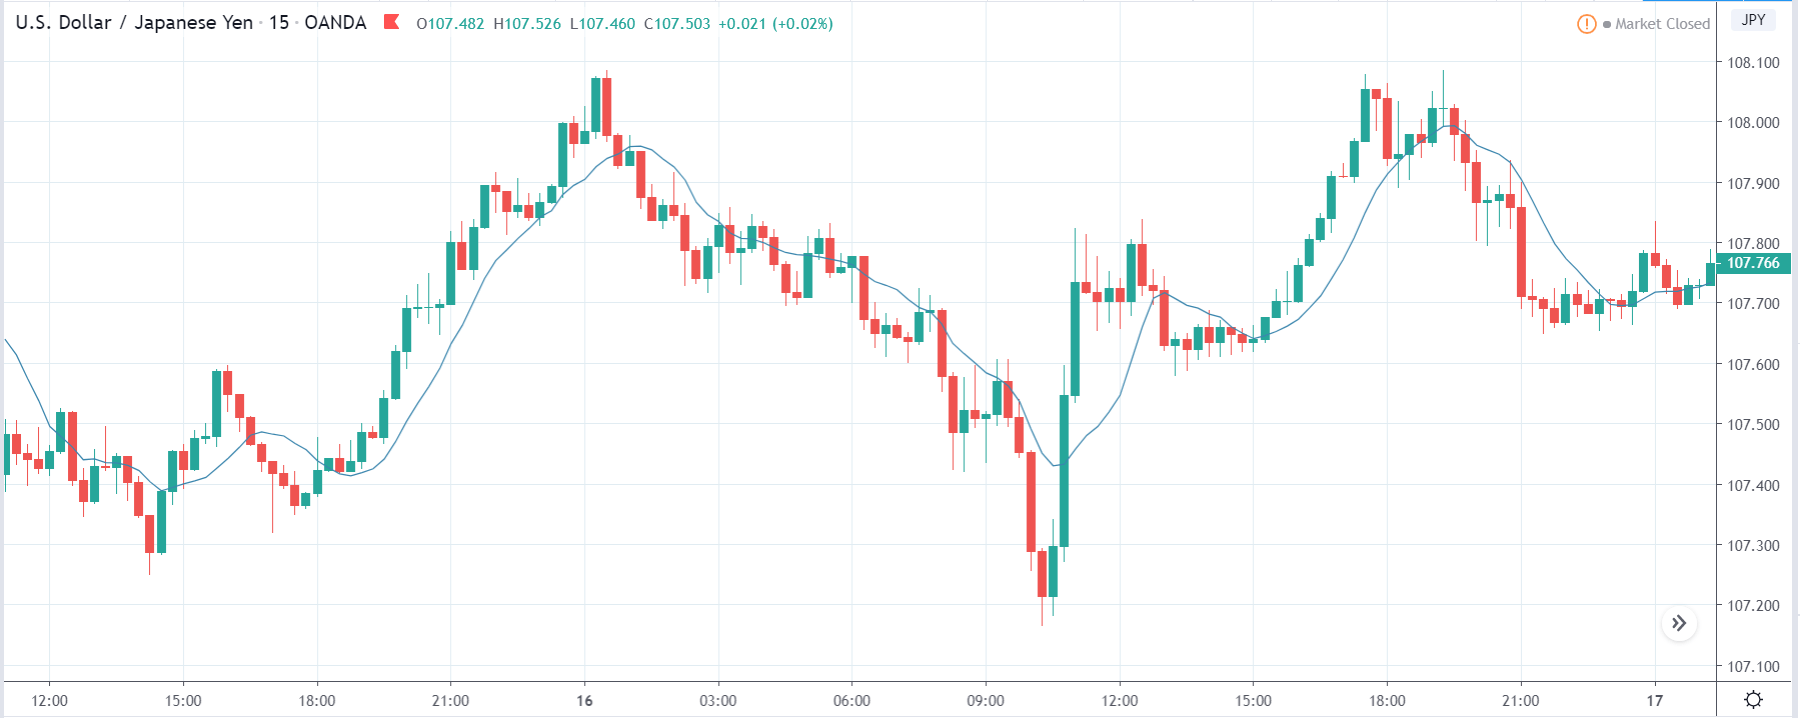
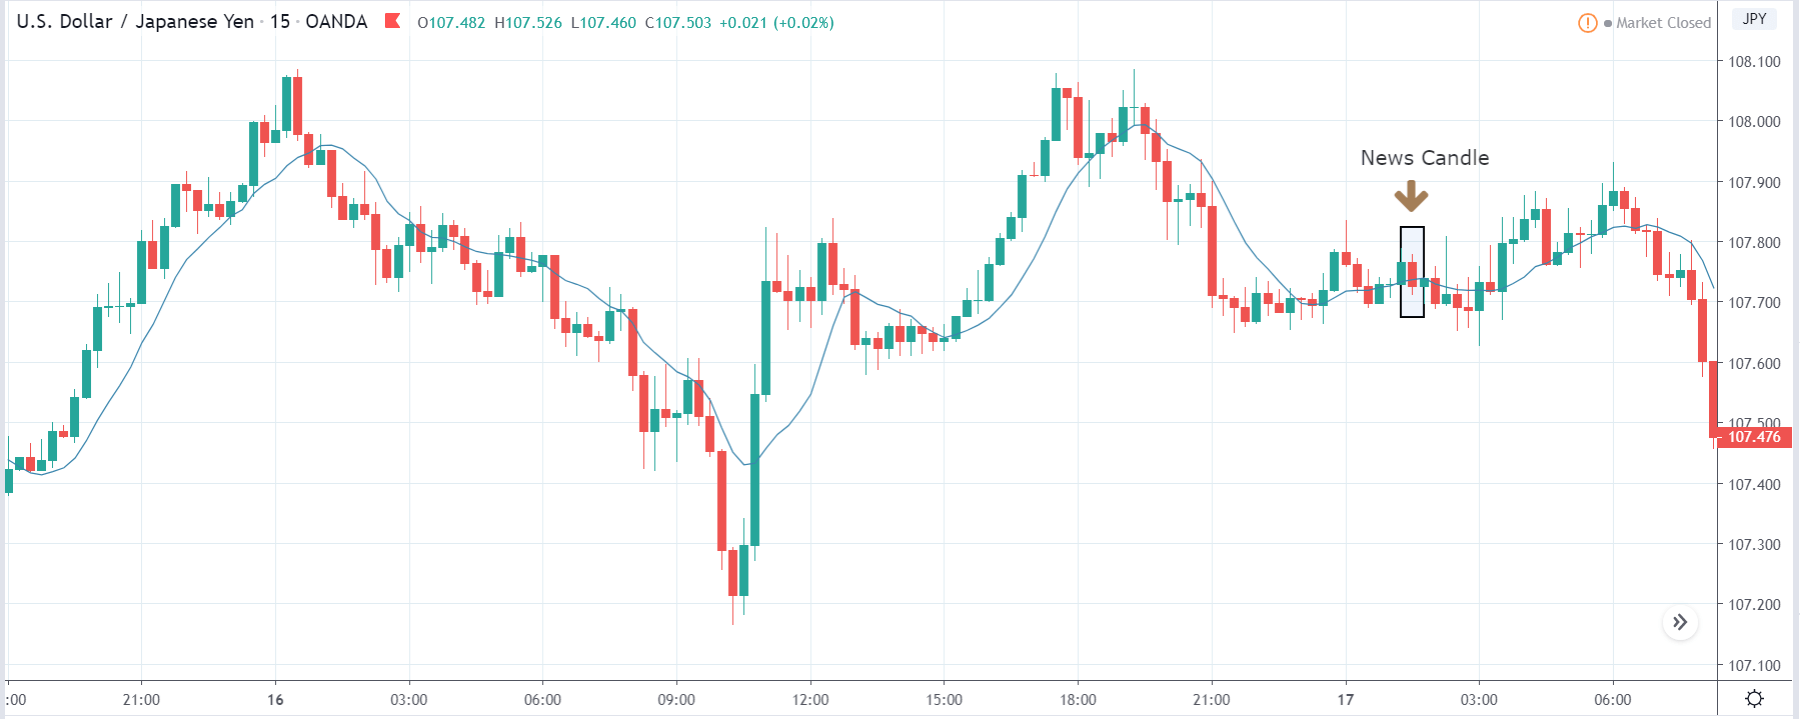
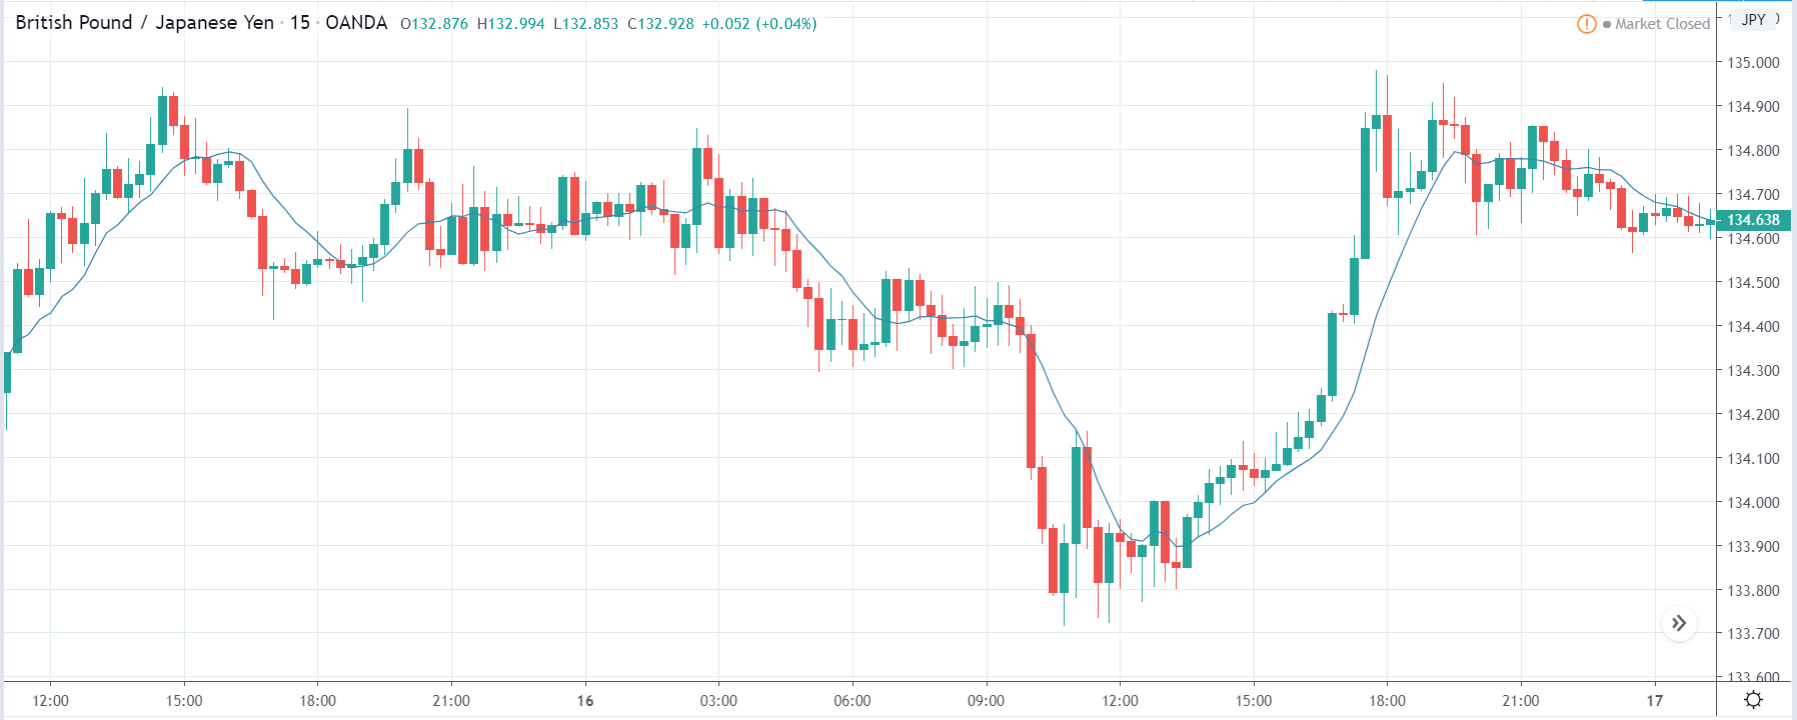
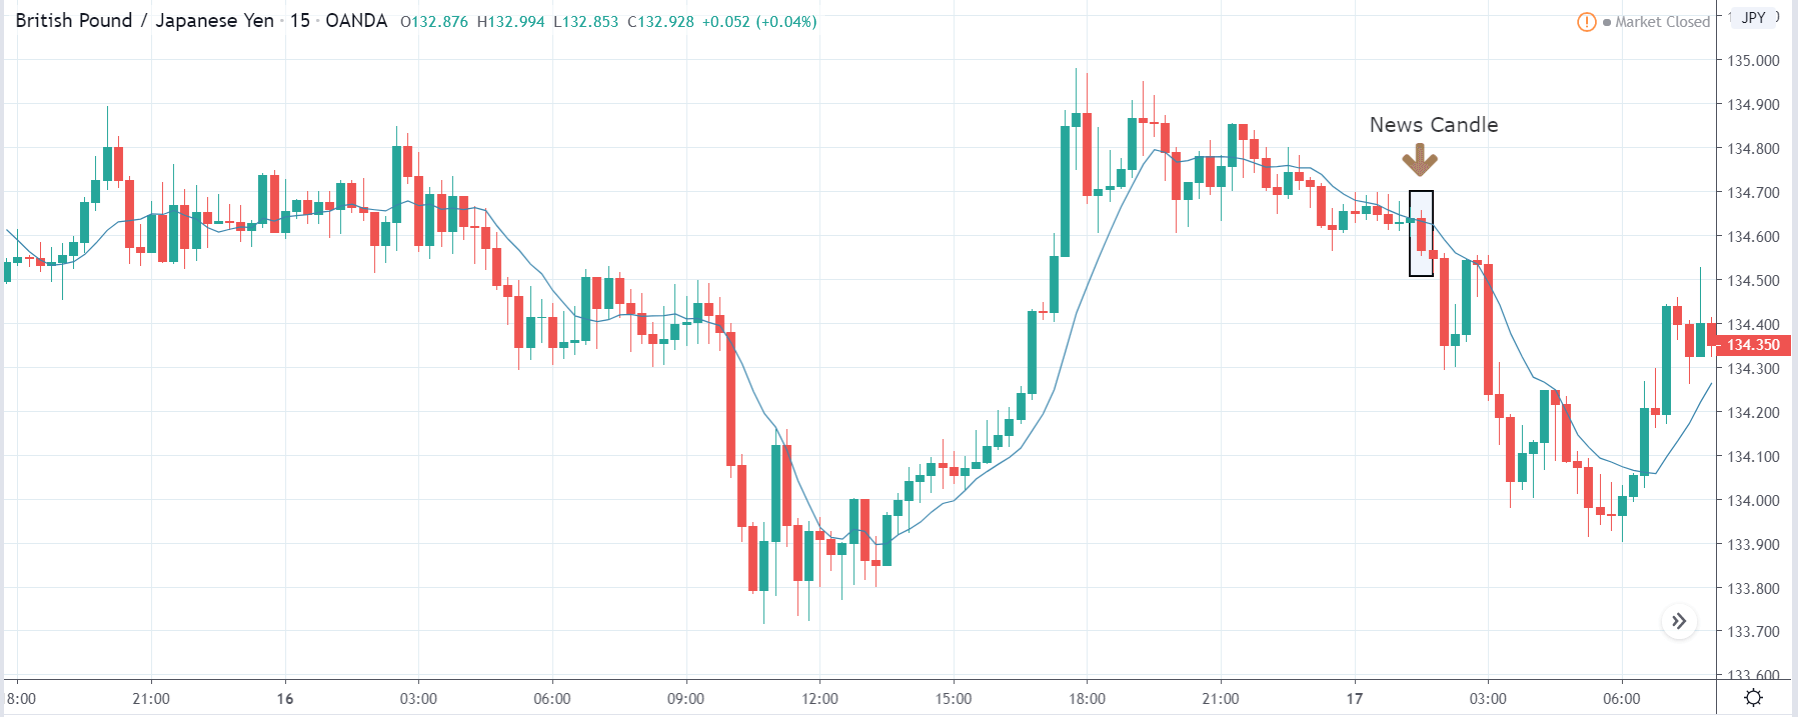
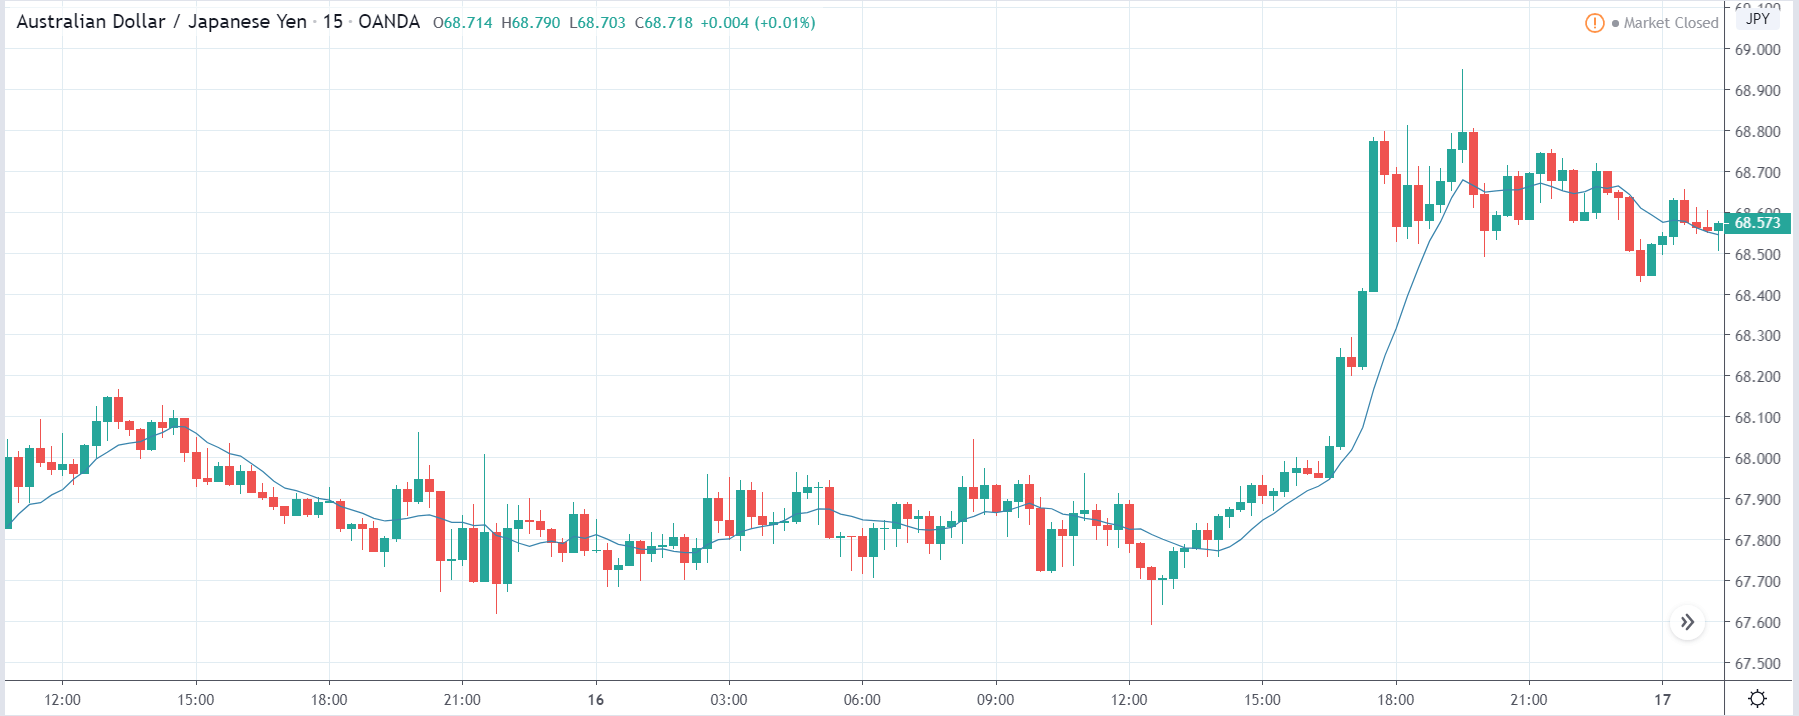
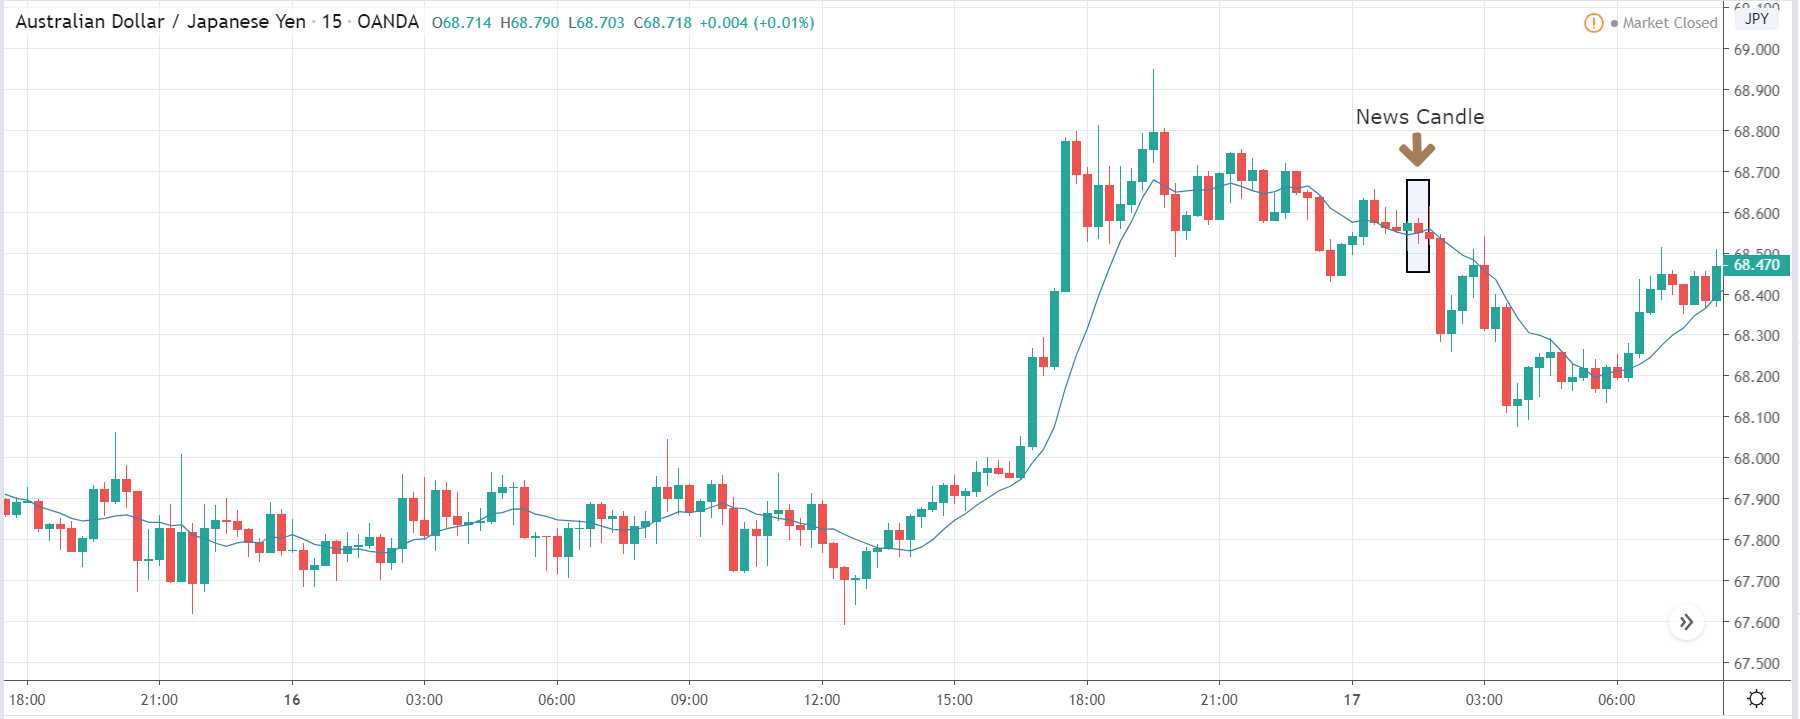
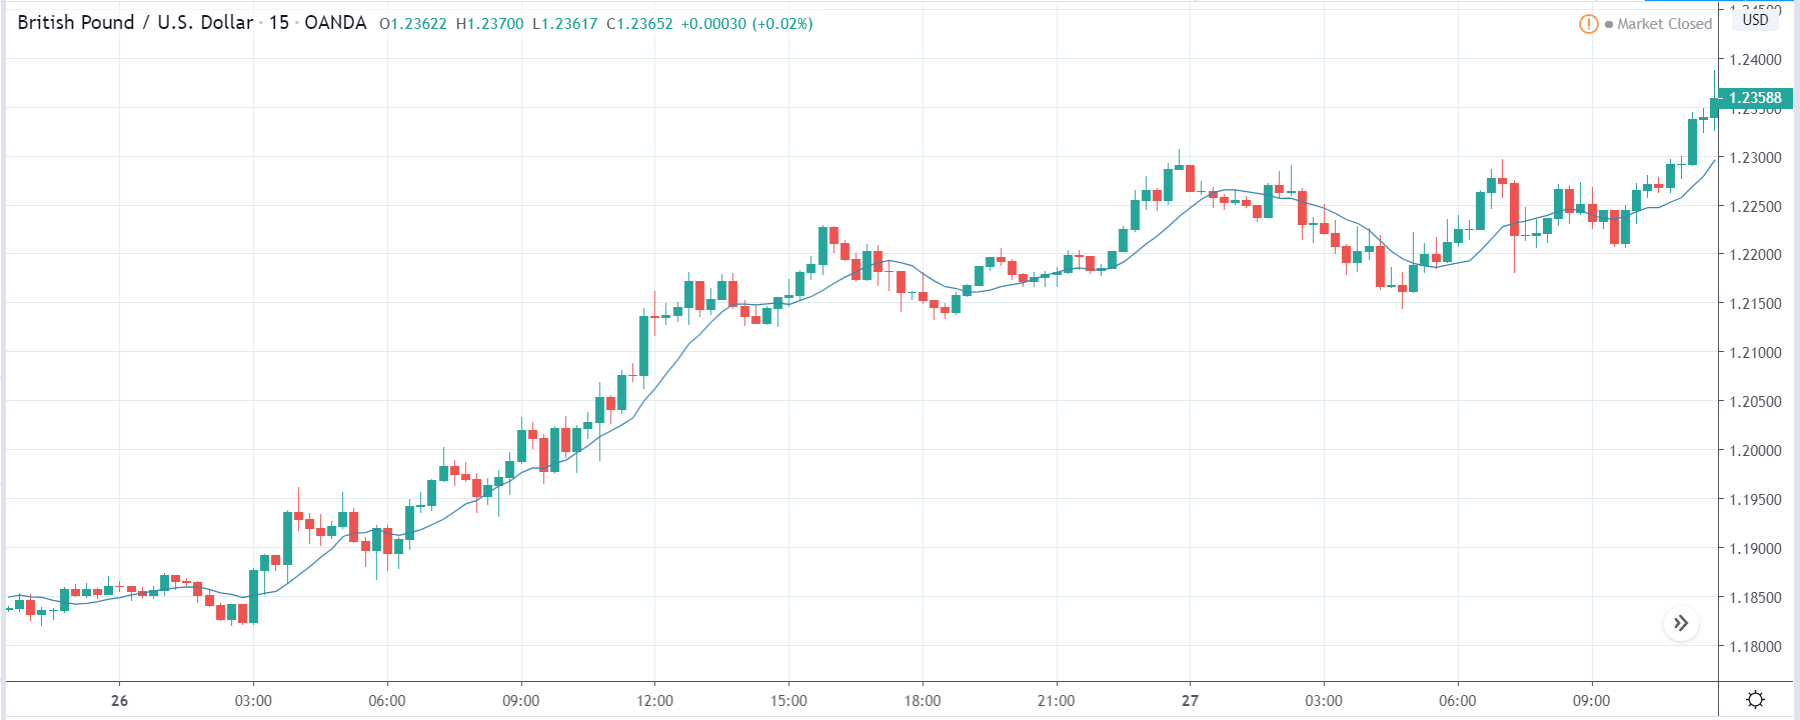
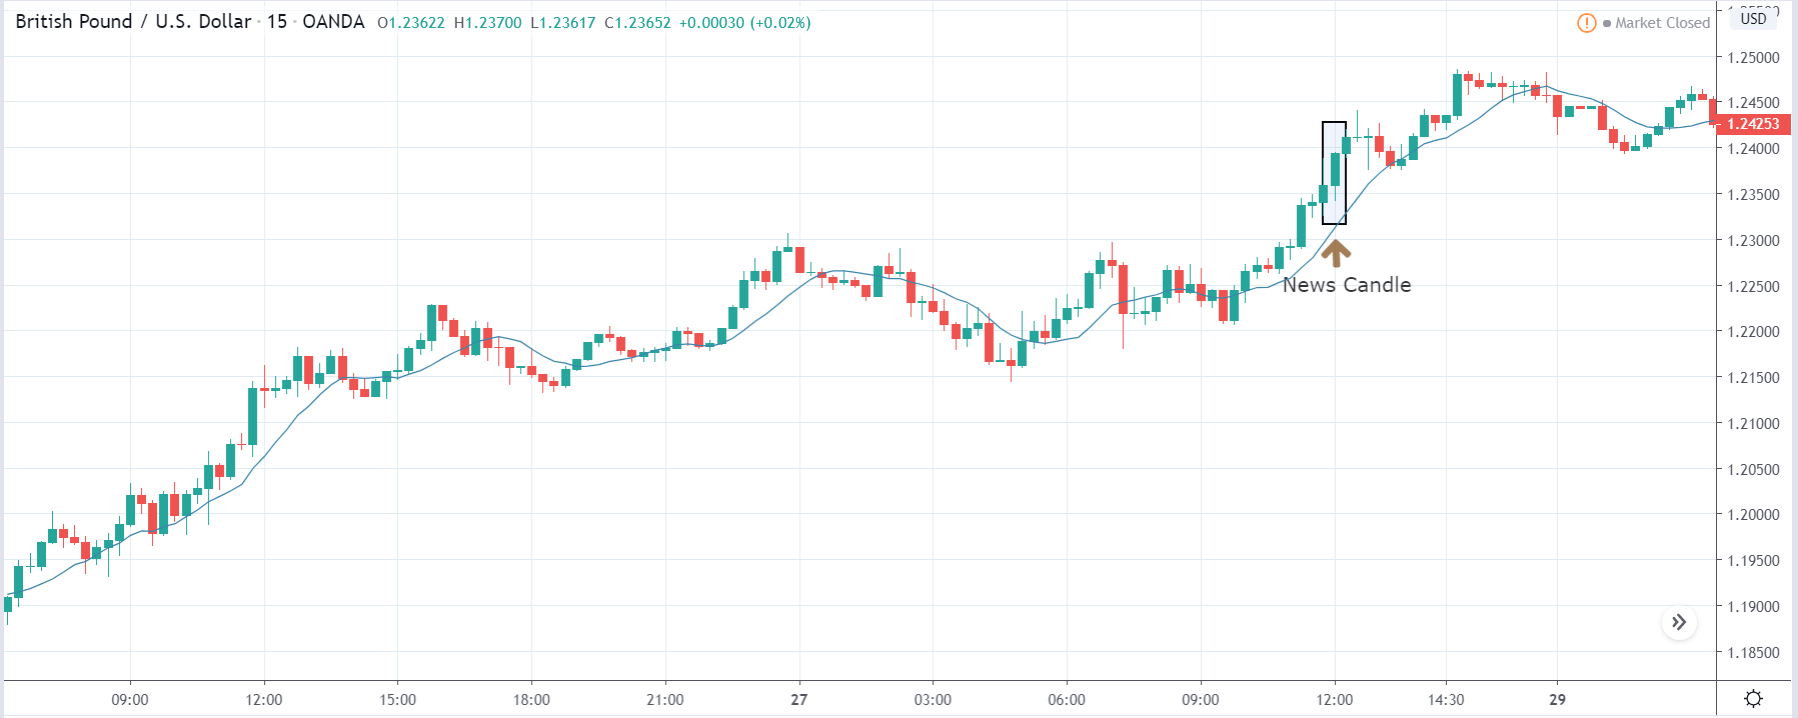
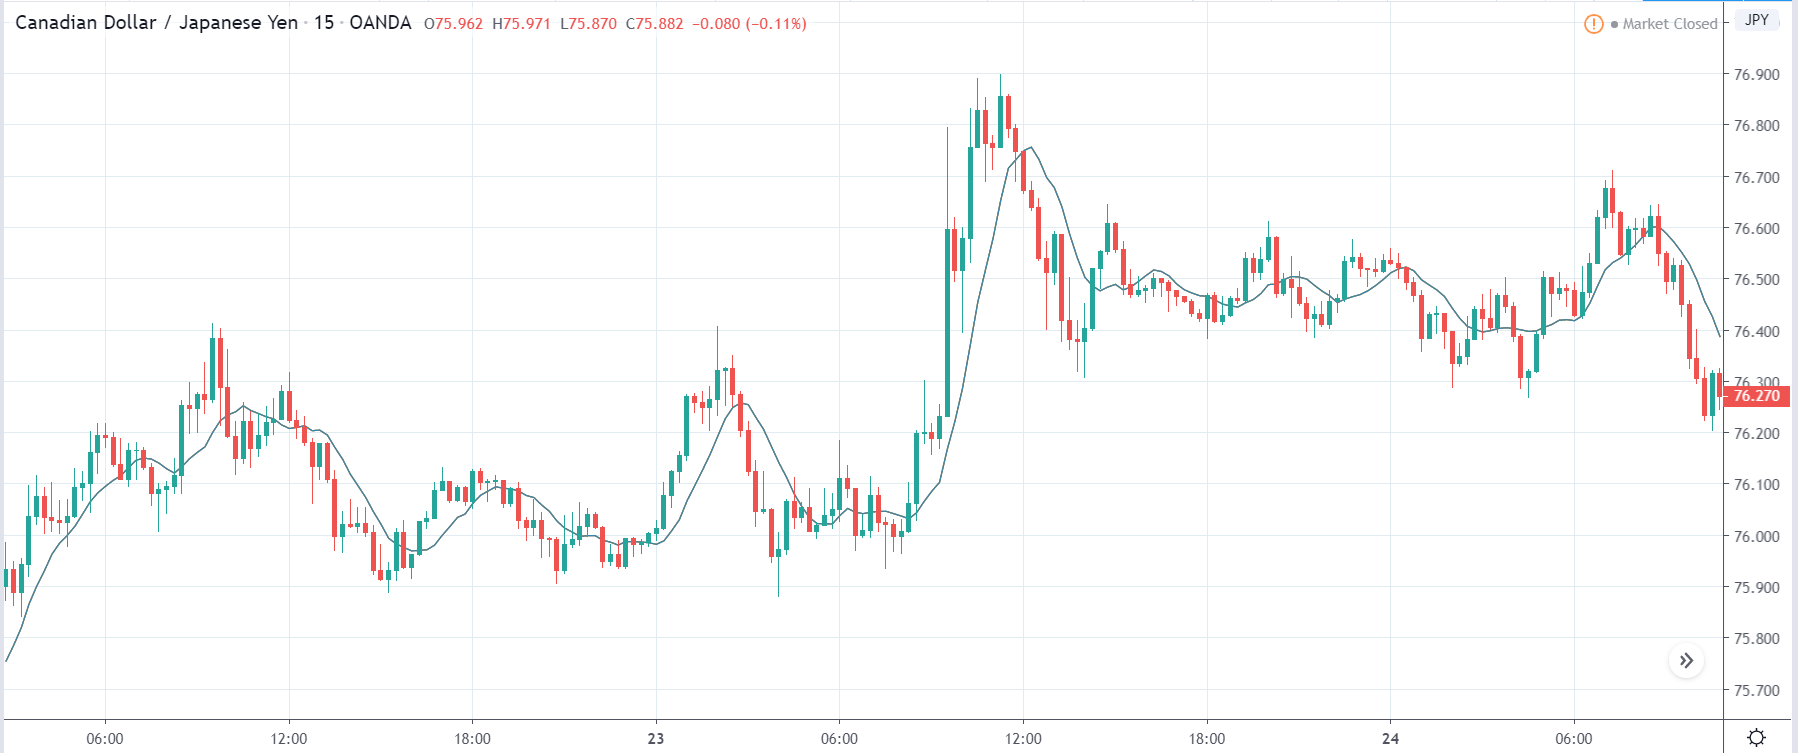
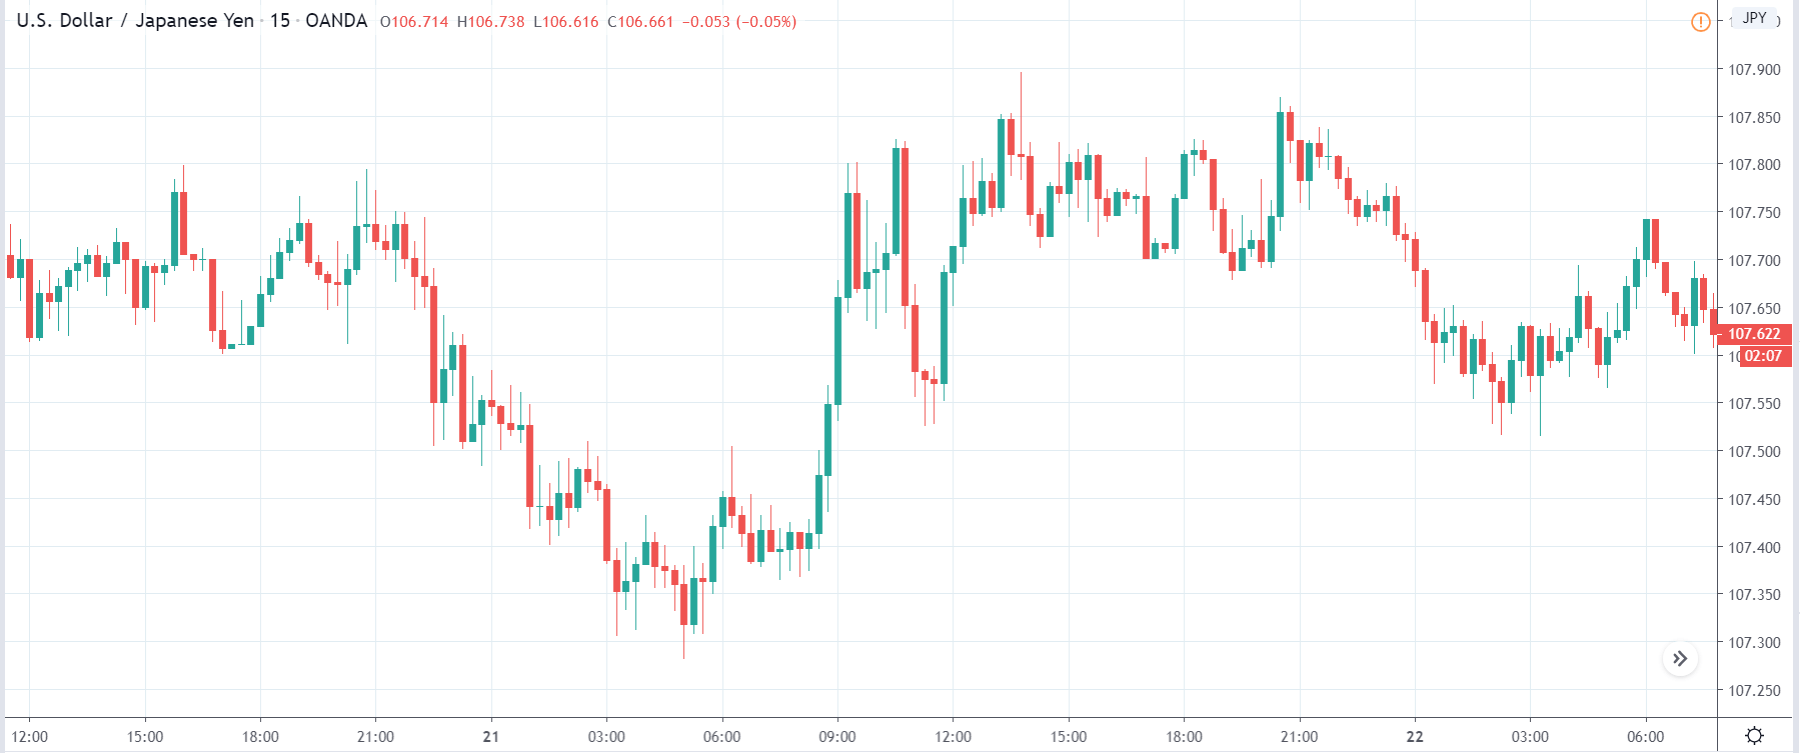
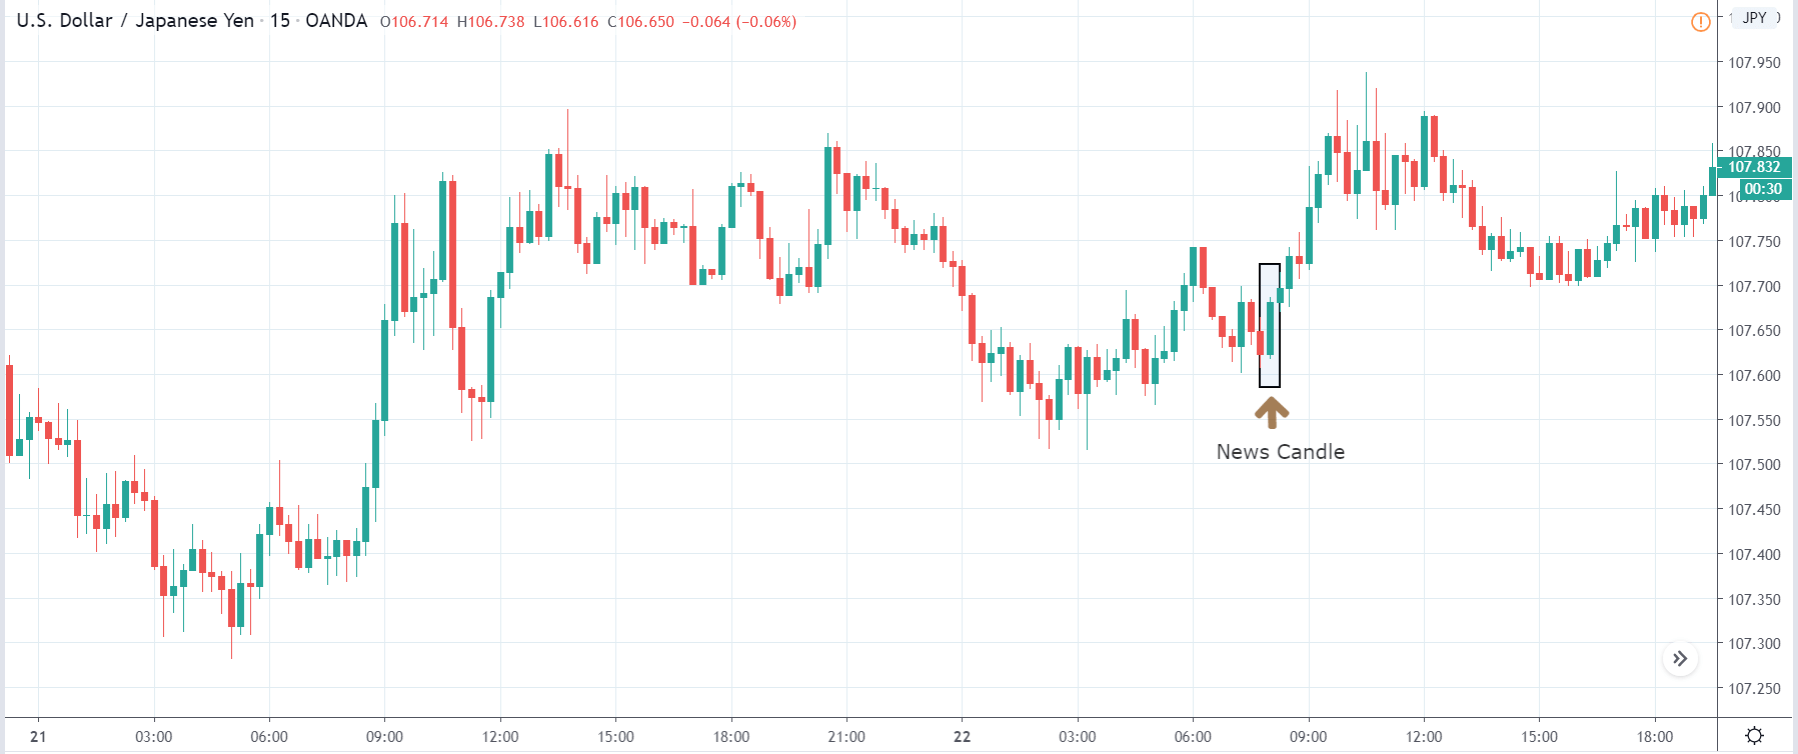
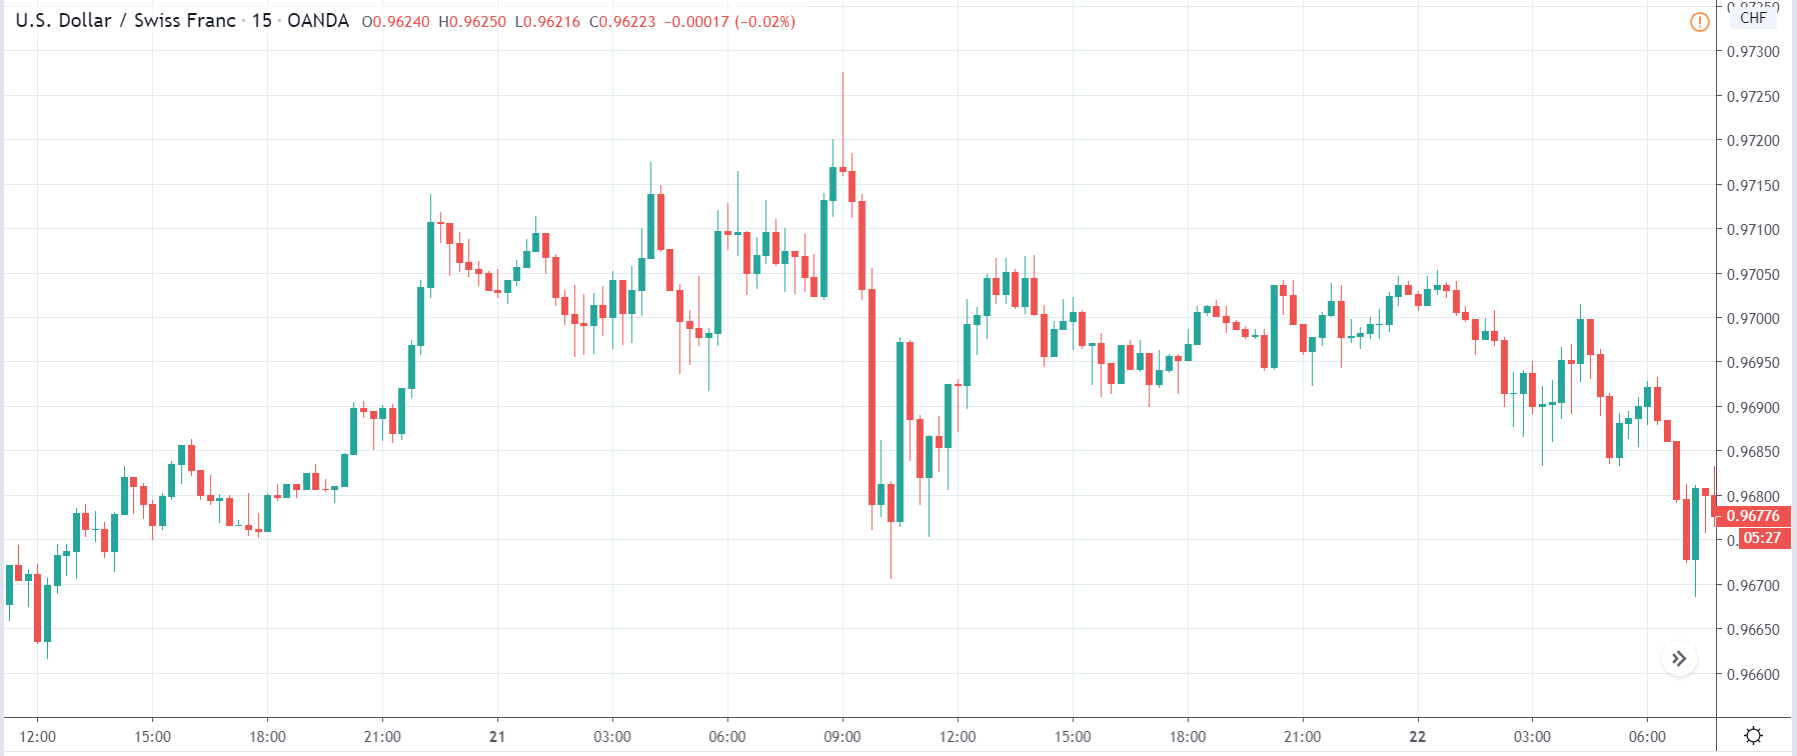
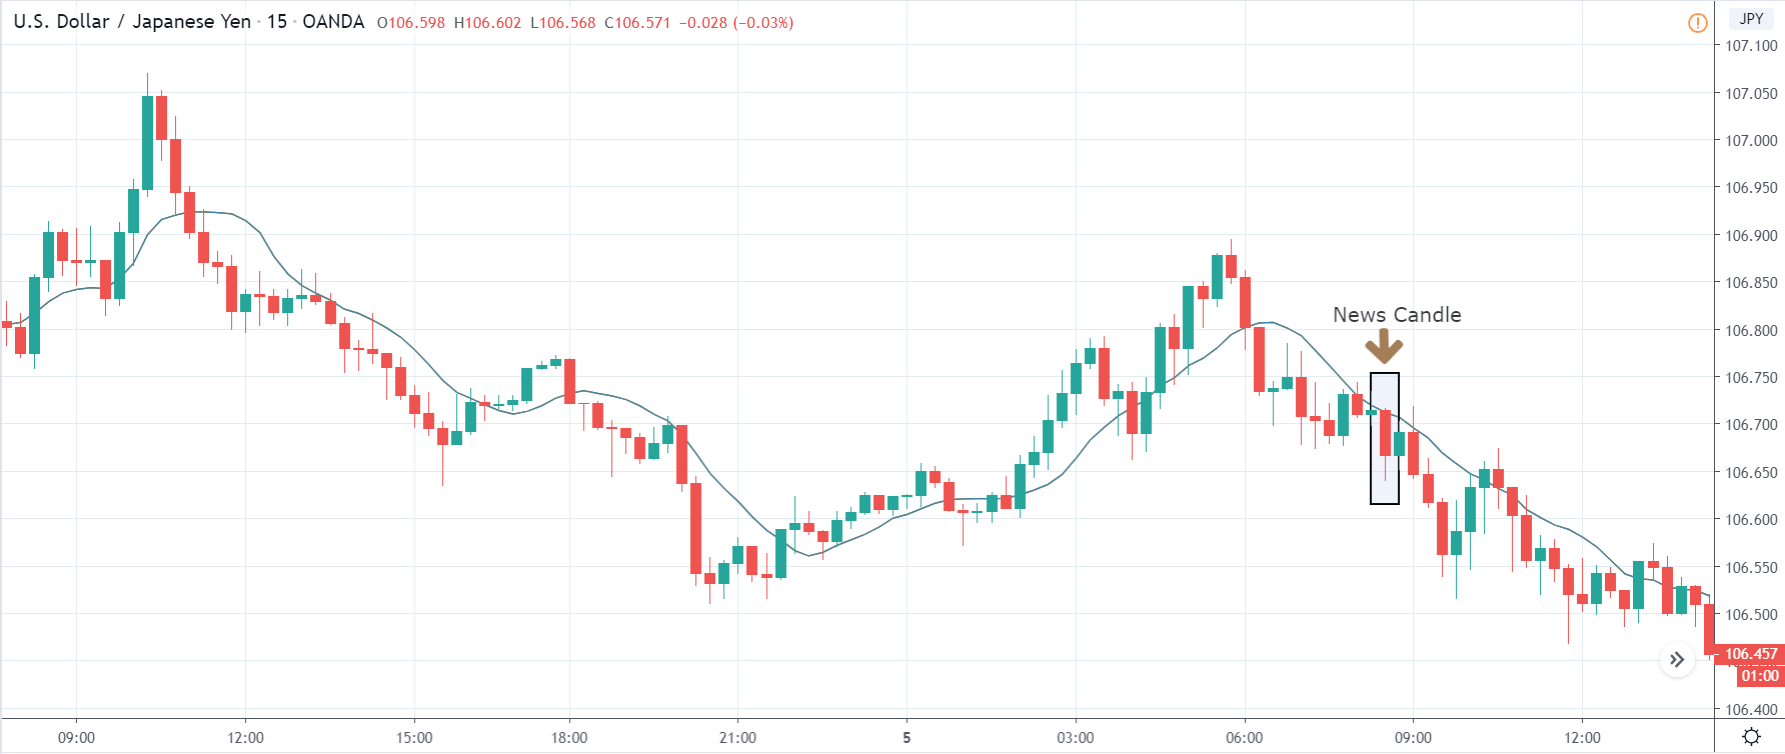
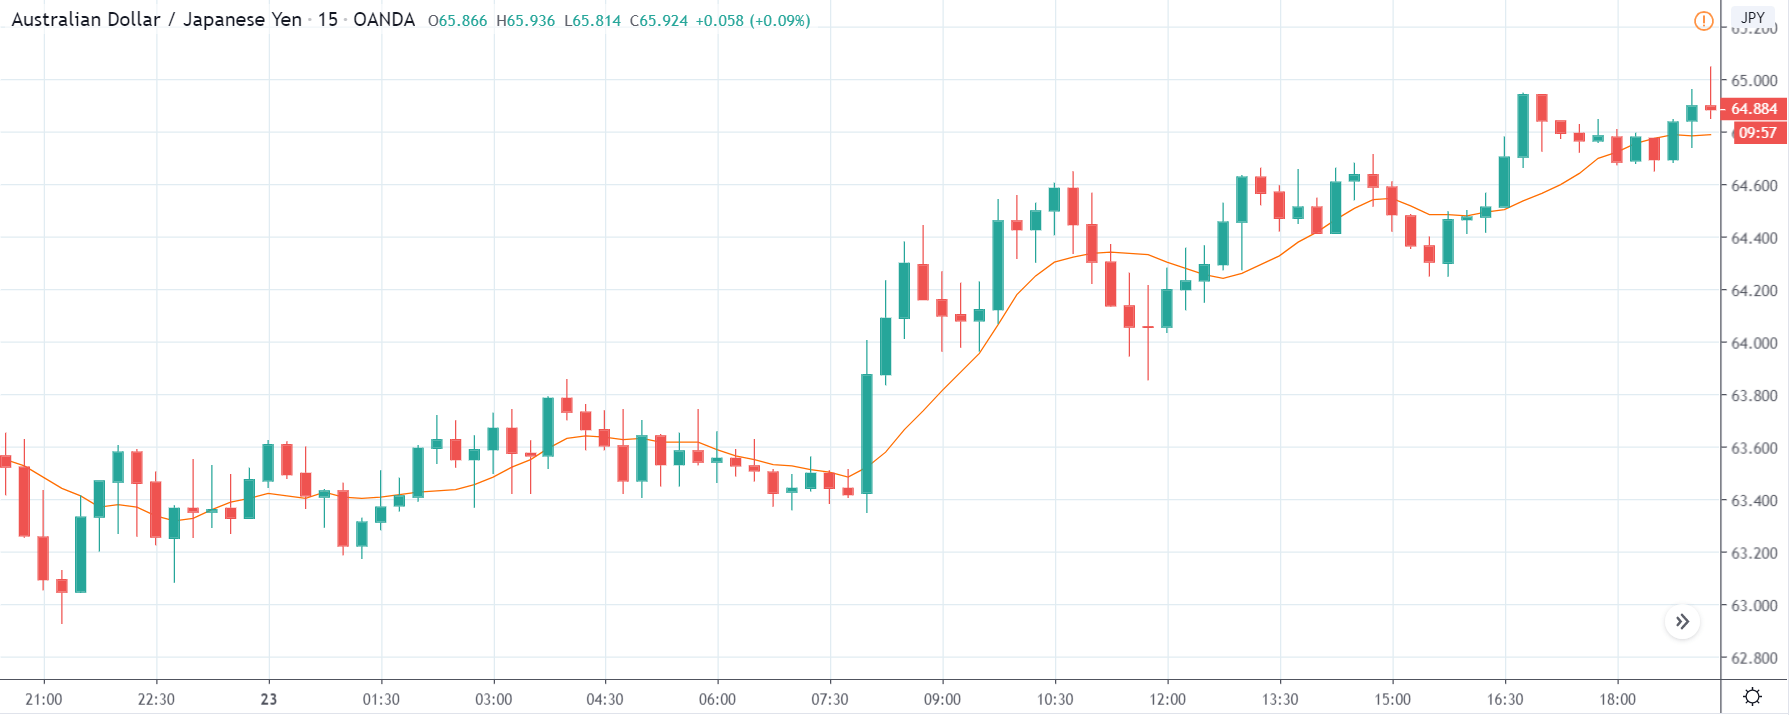
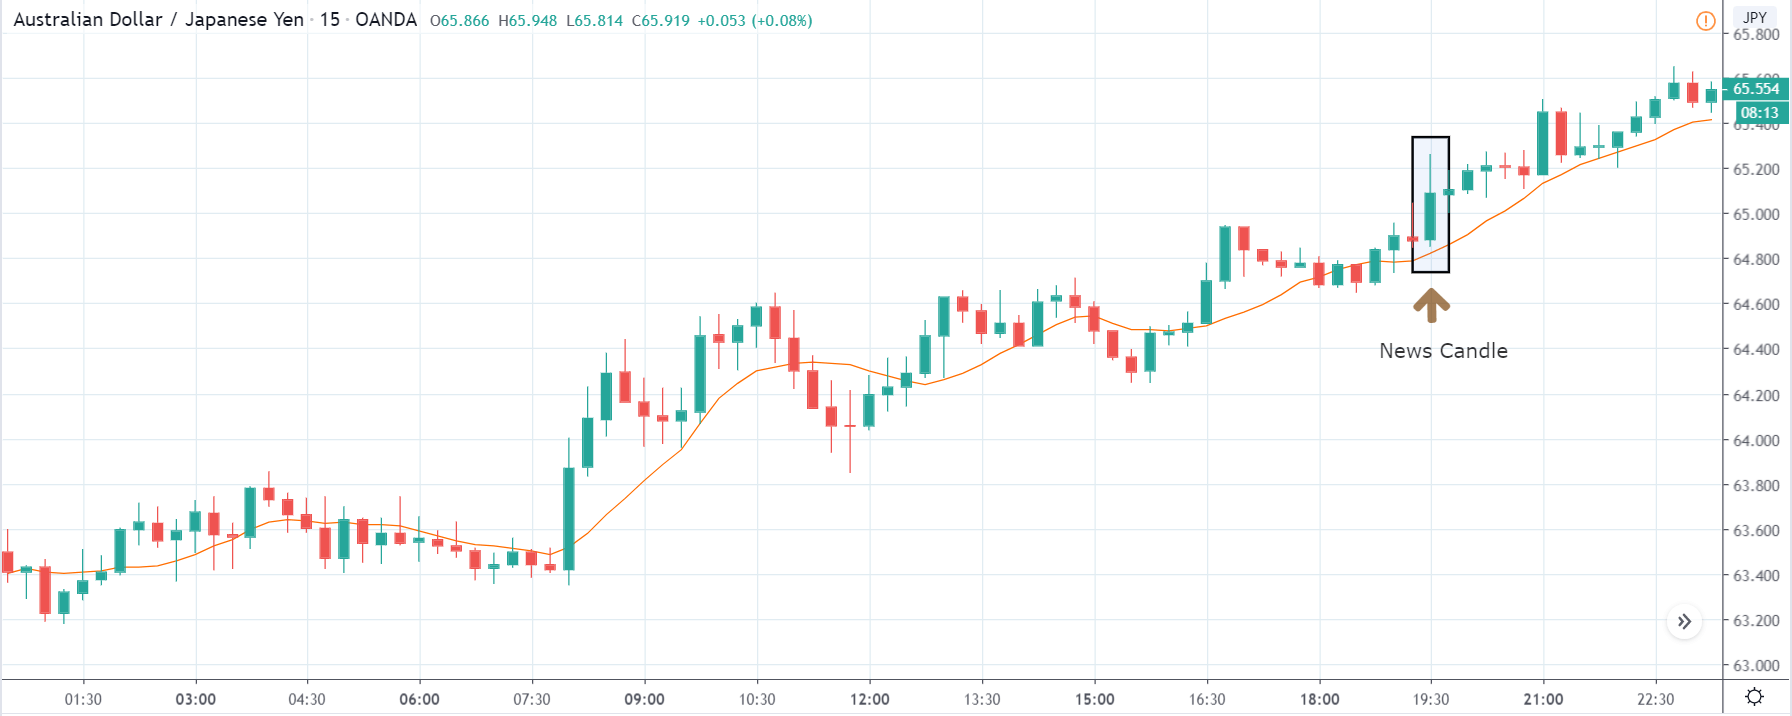
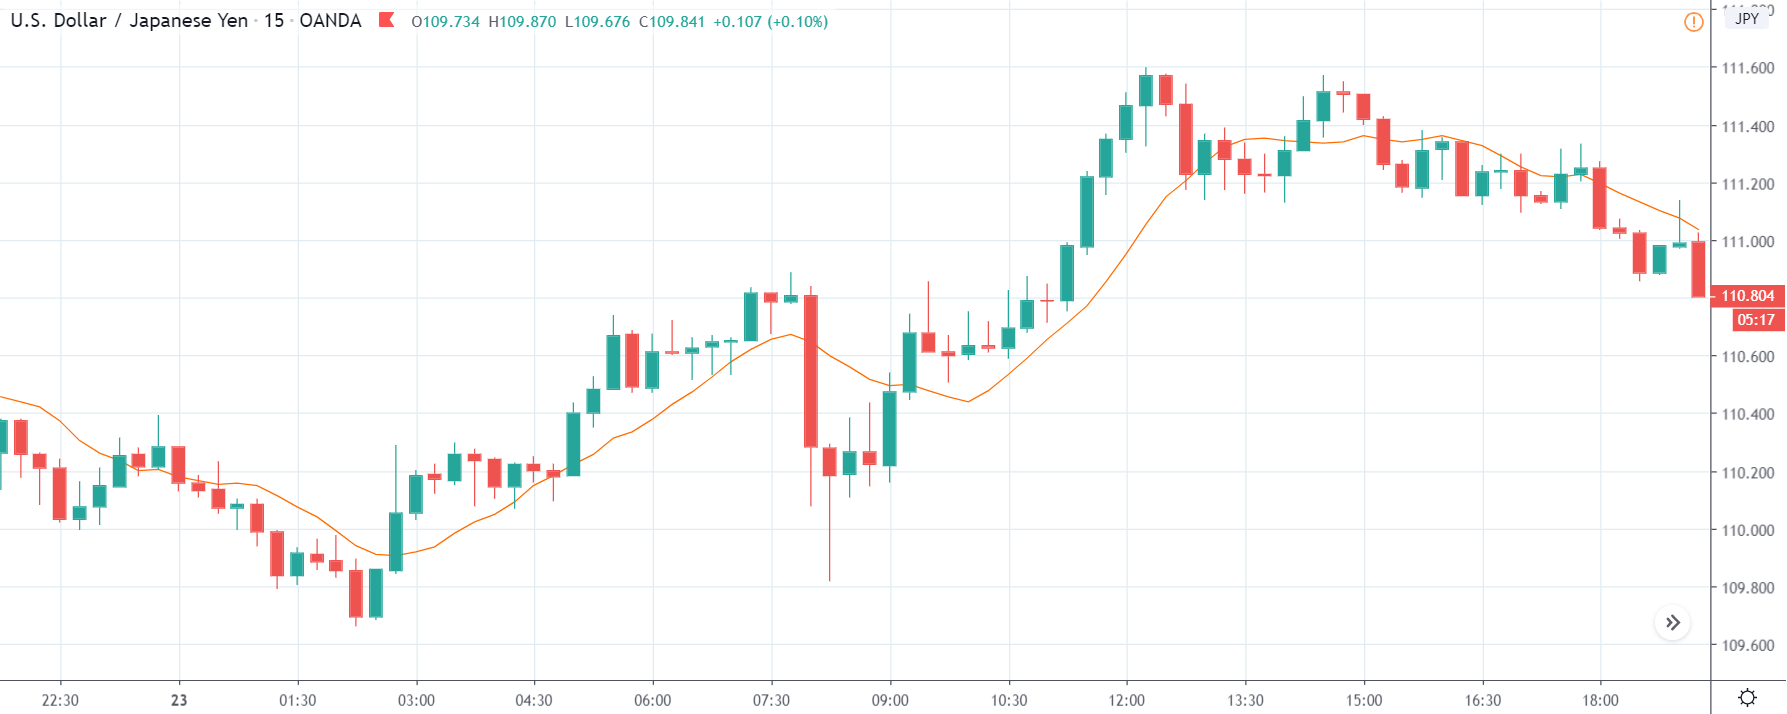
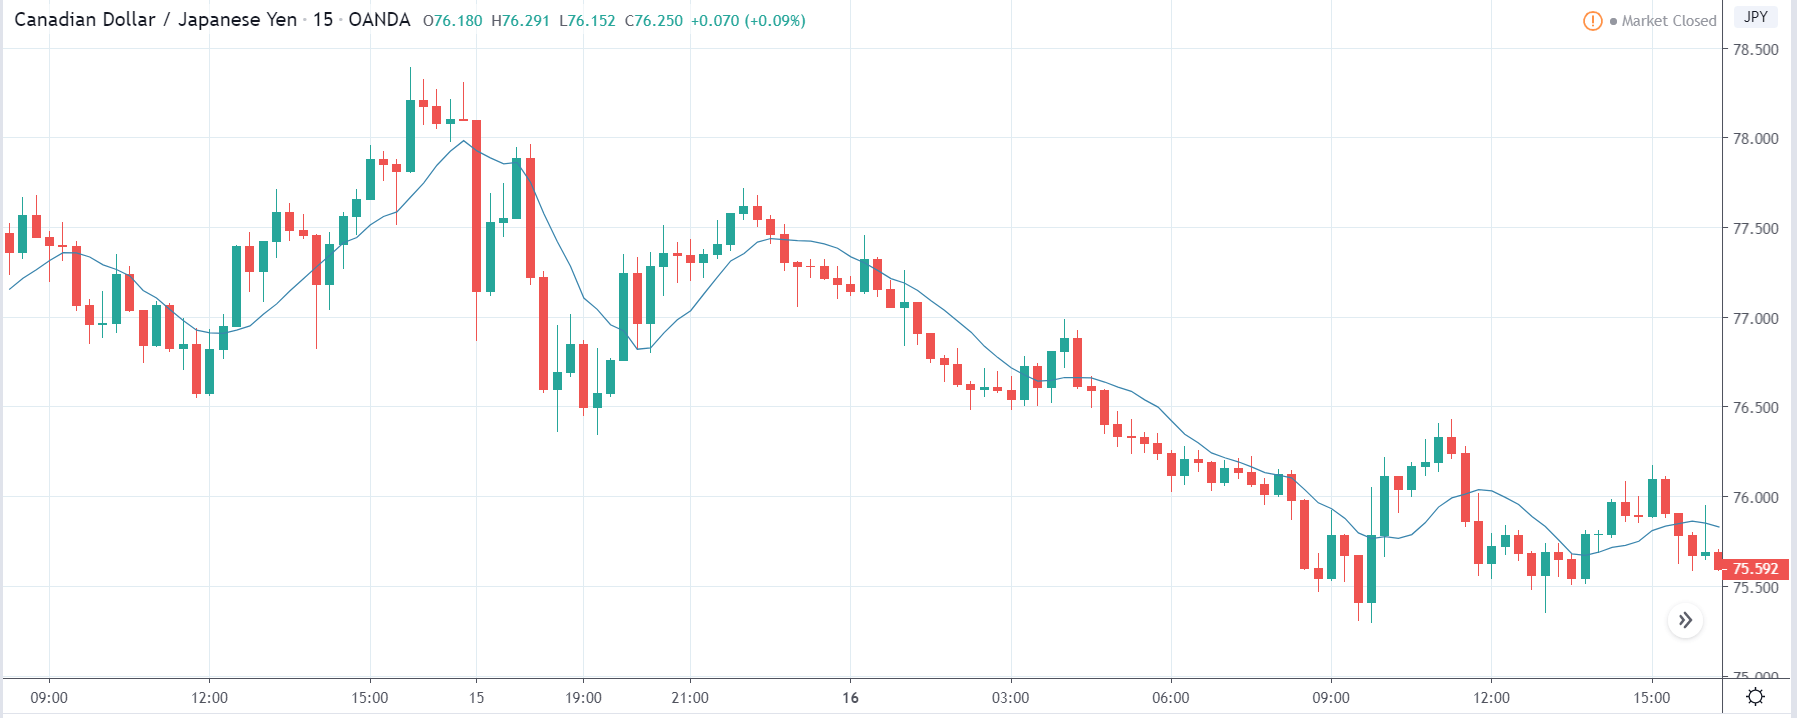
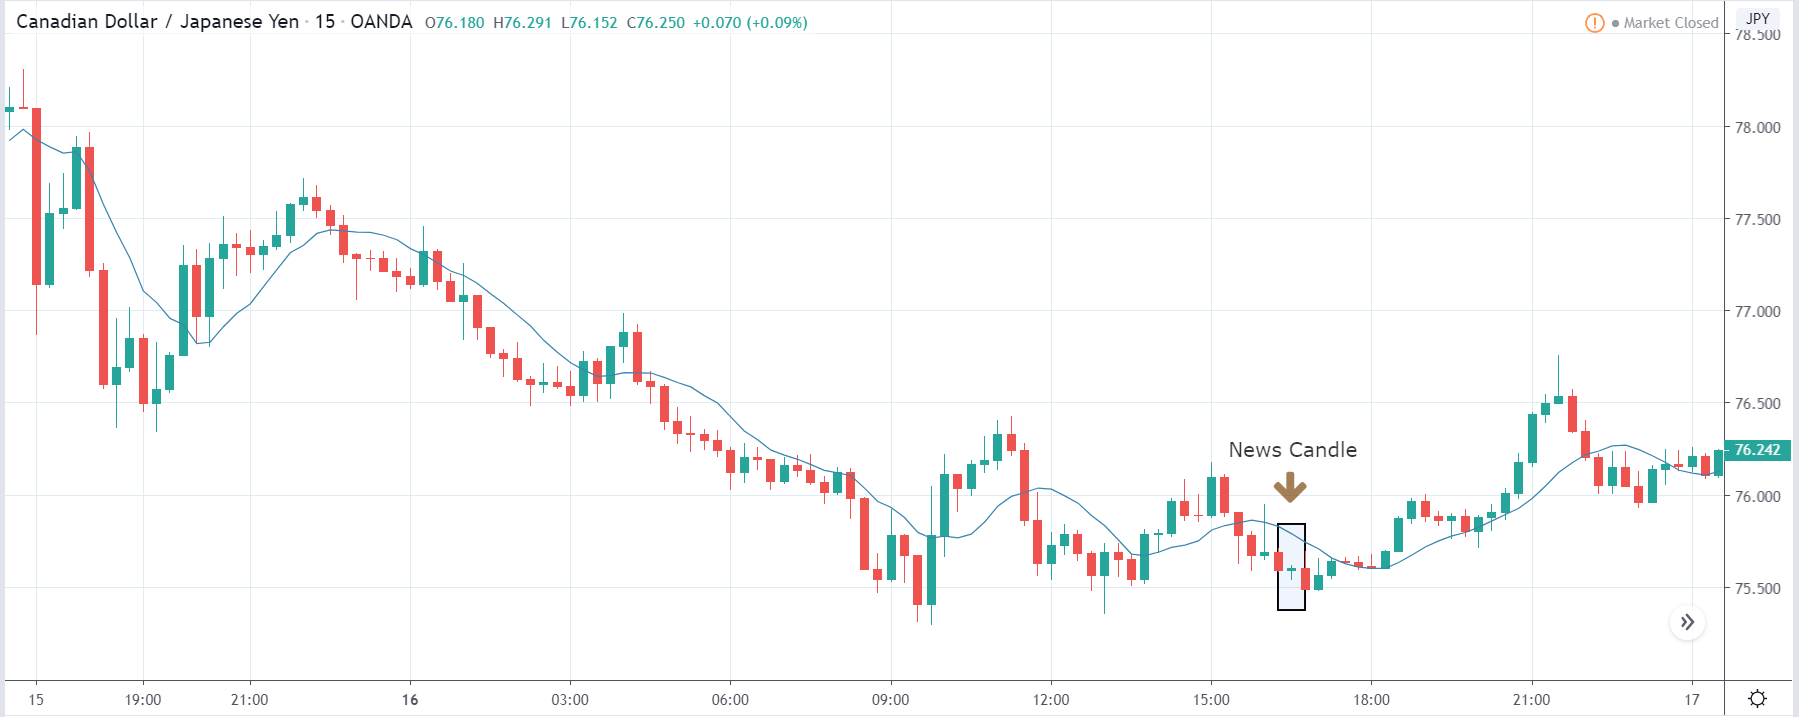
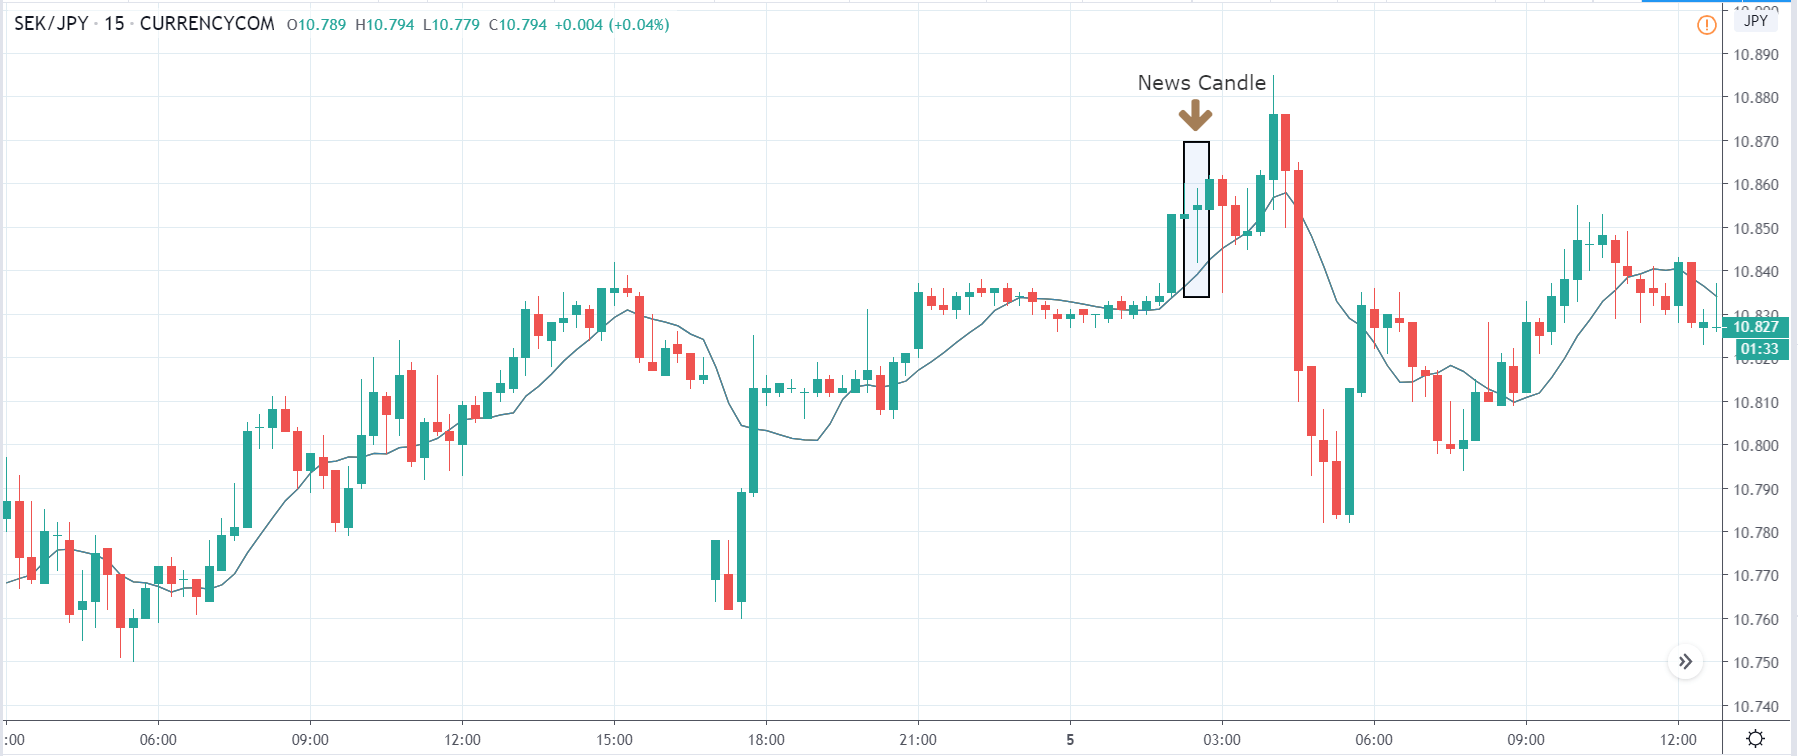
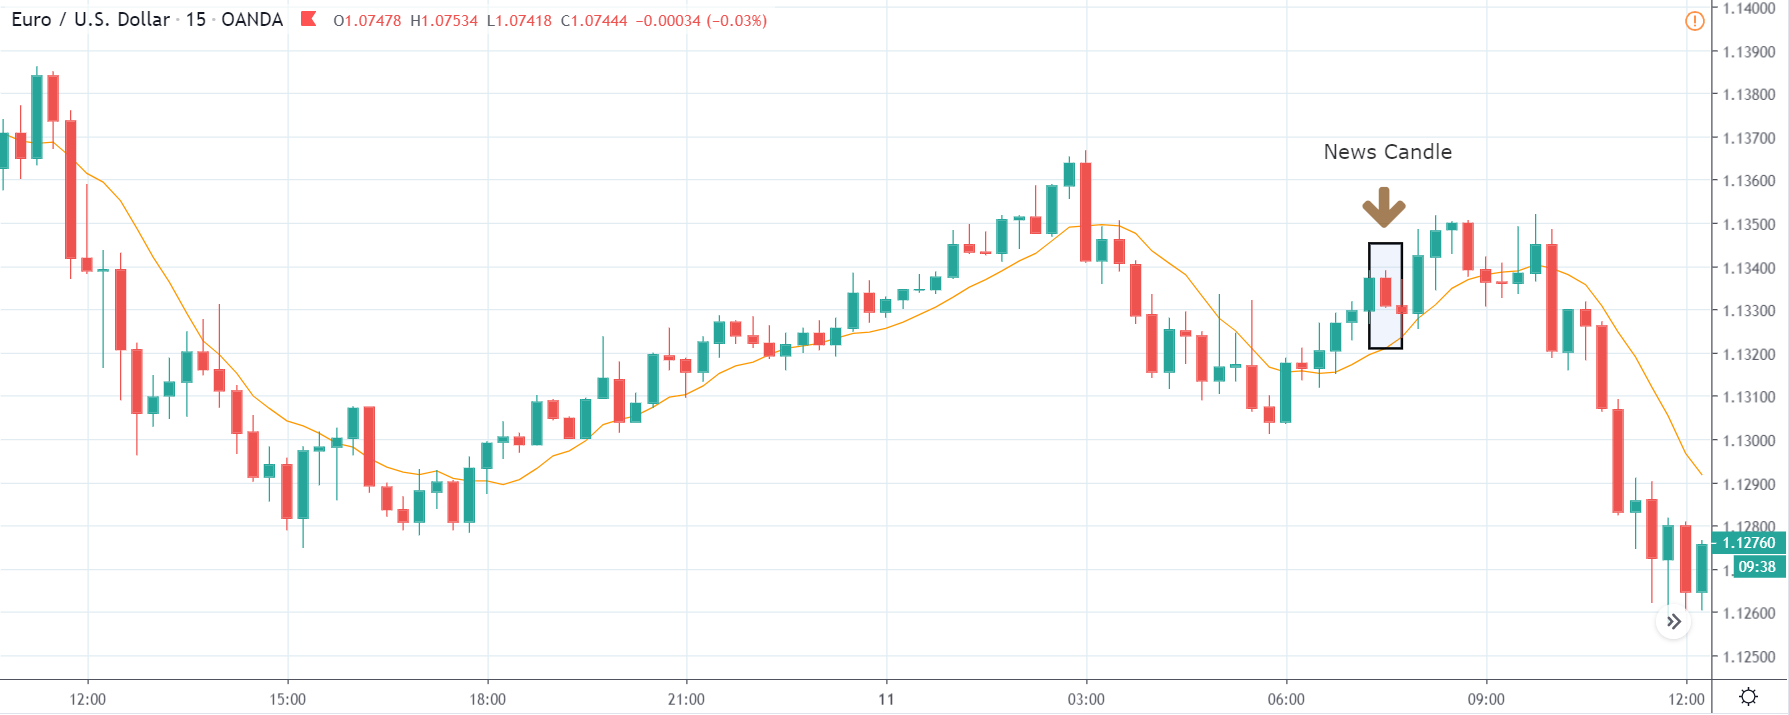
GBP/JPY | Before The Announcement

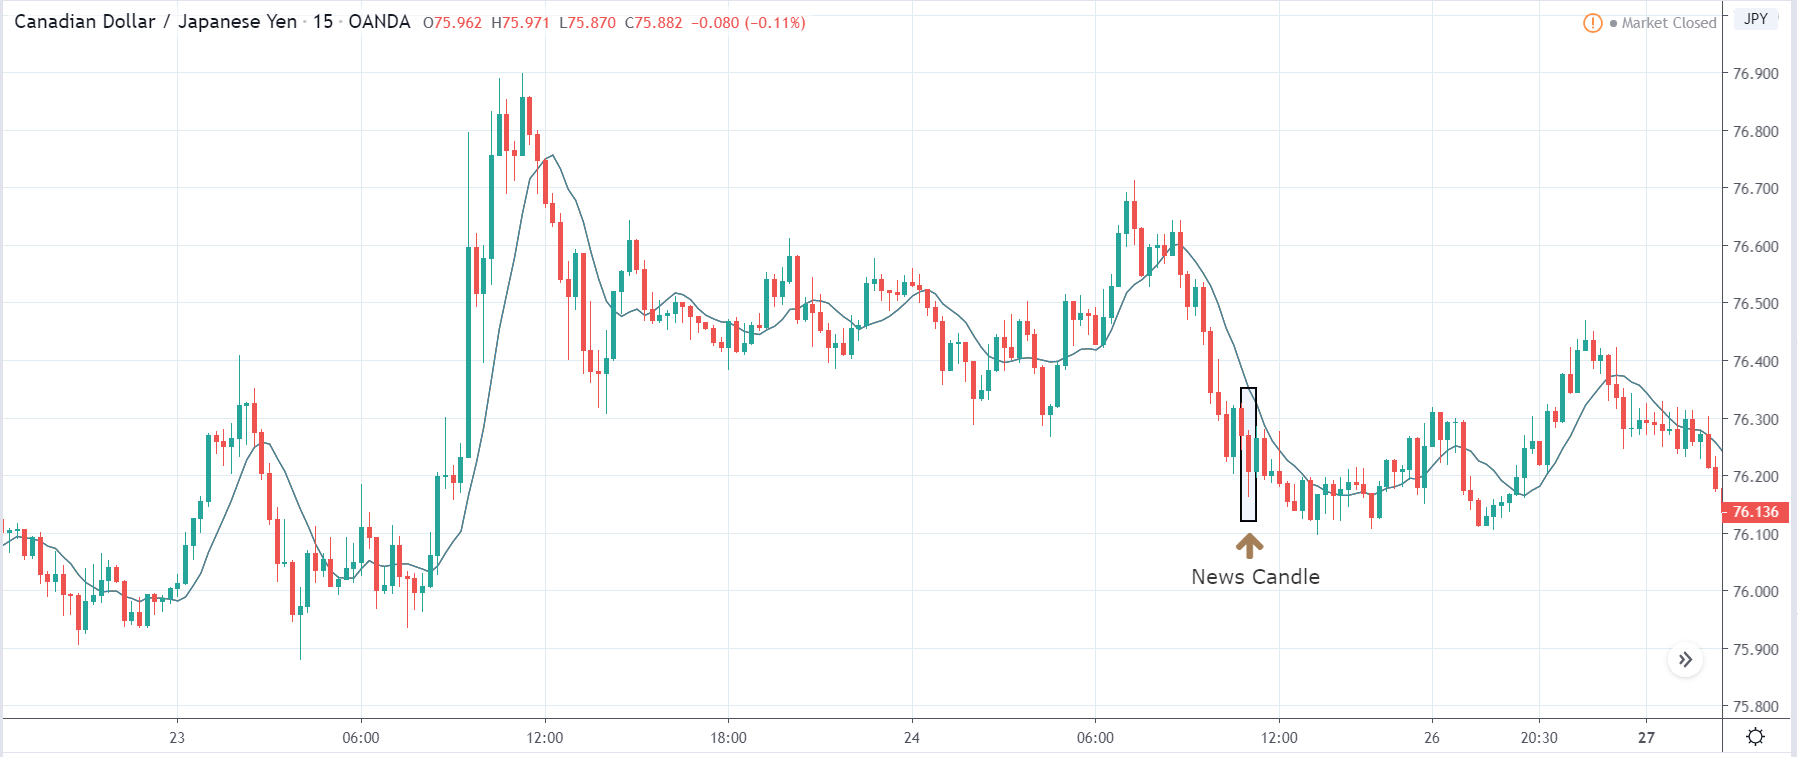
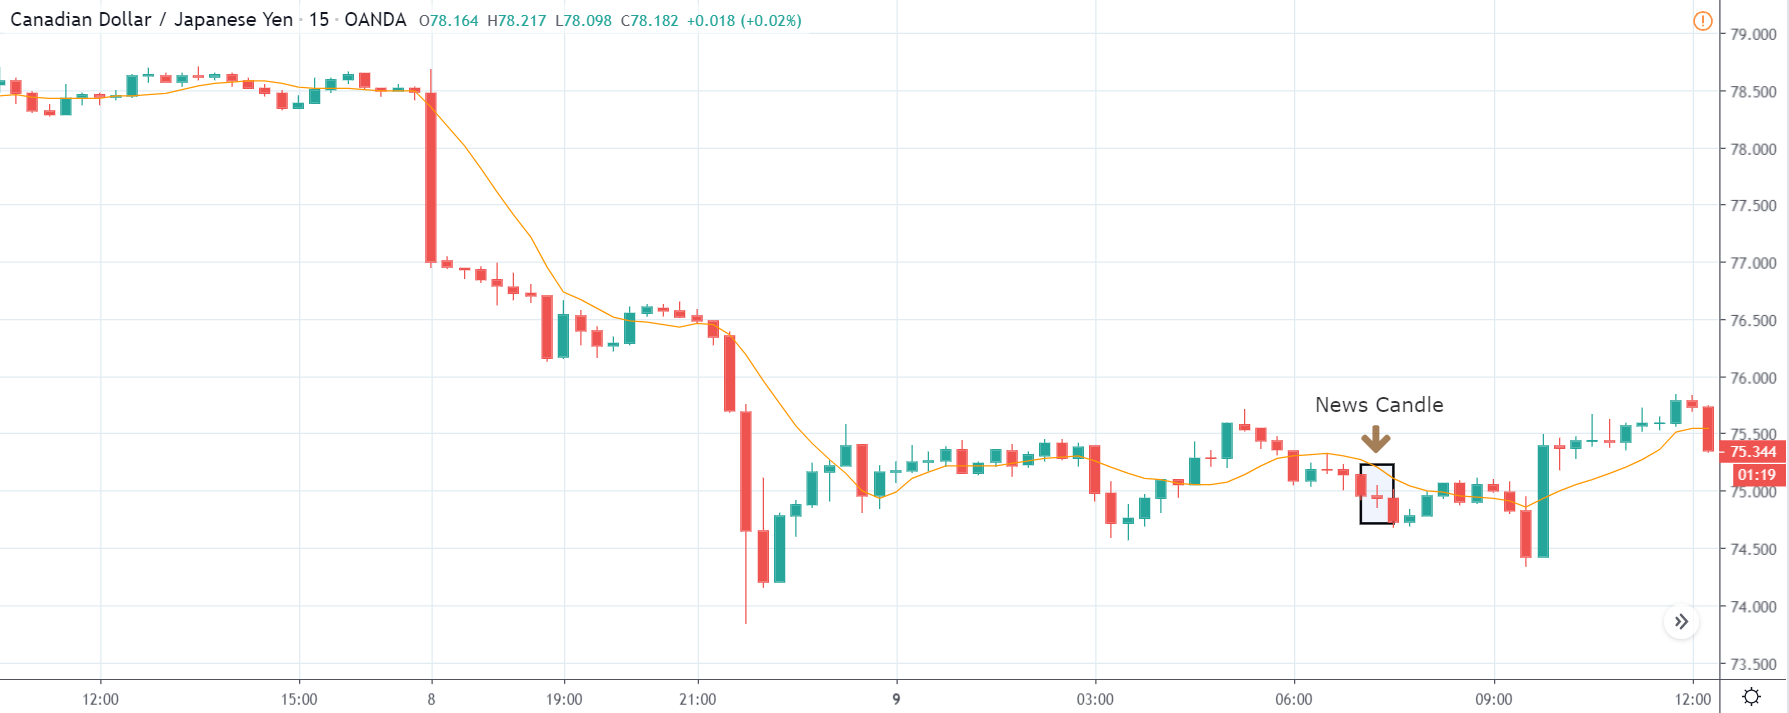
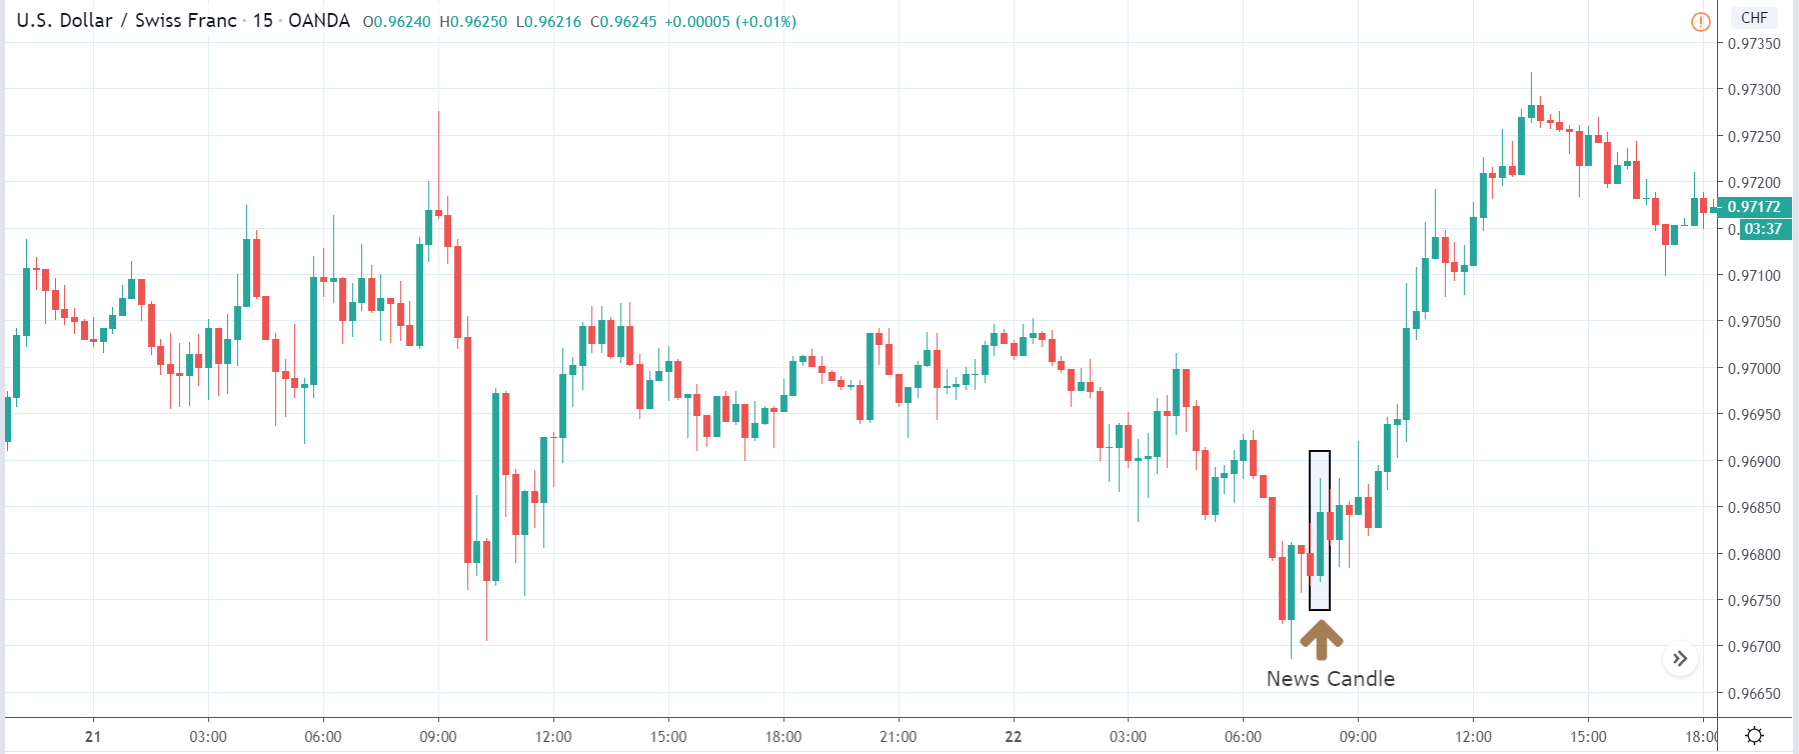
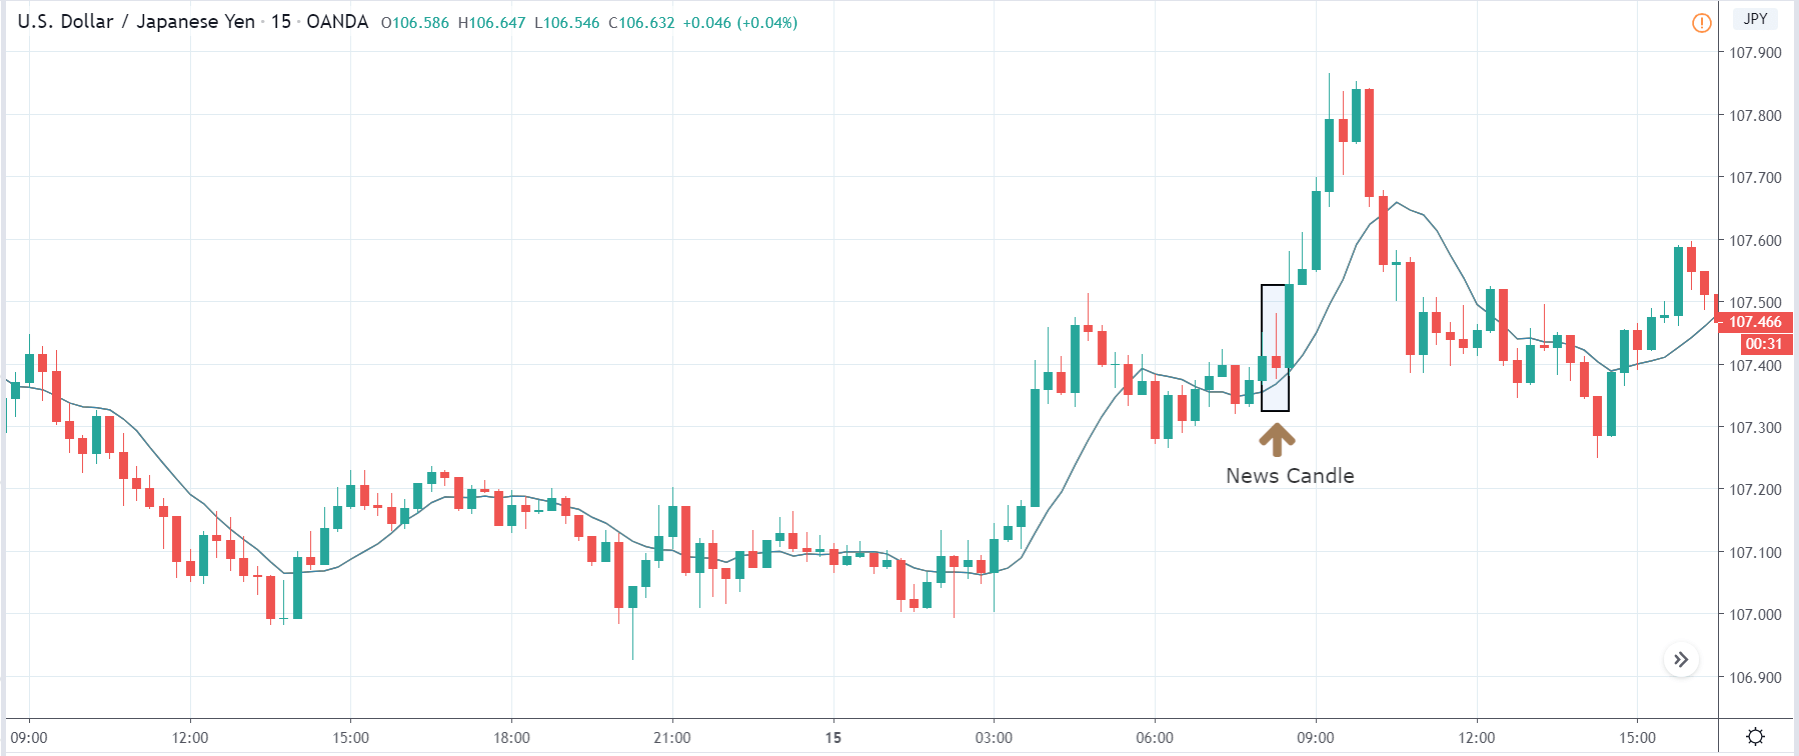
GBP/JPY | After The Announcement

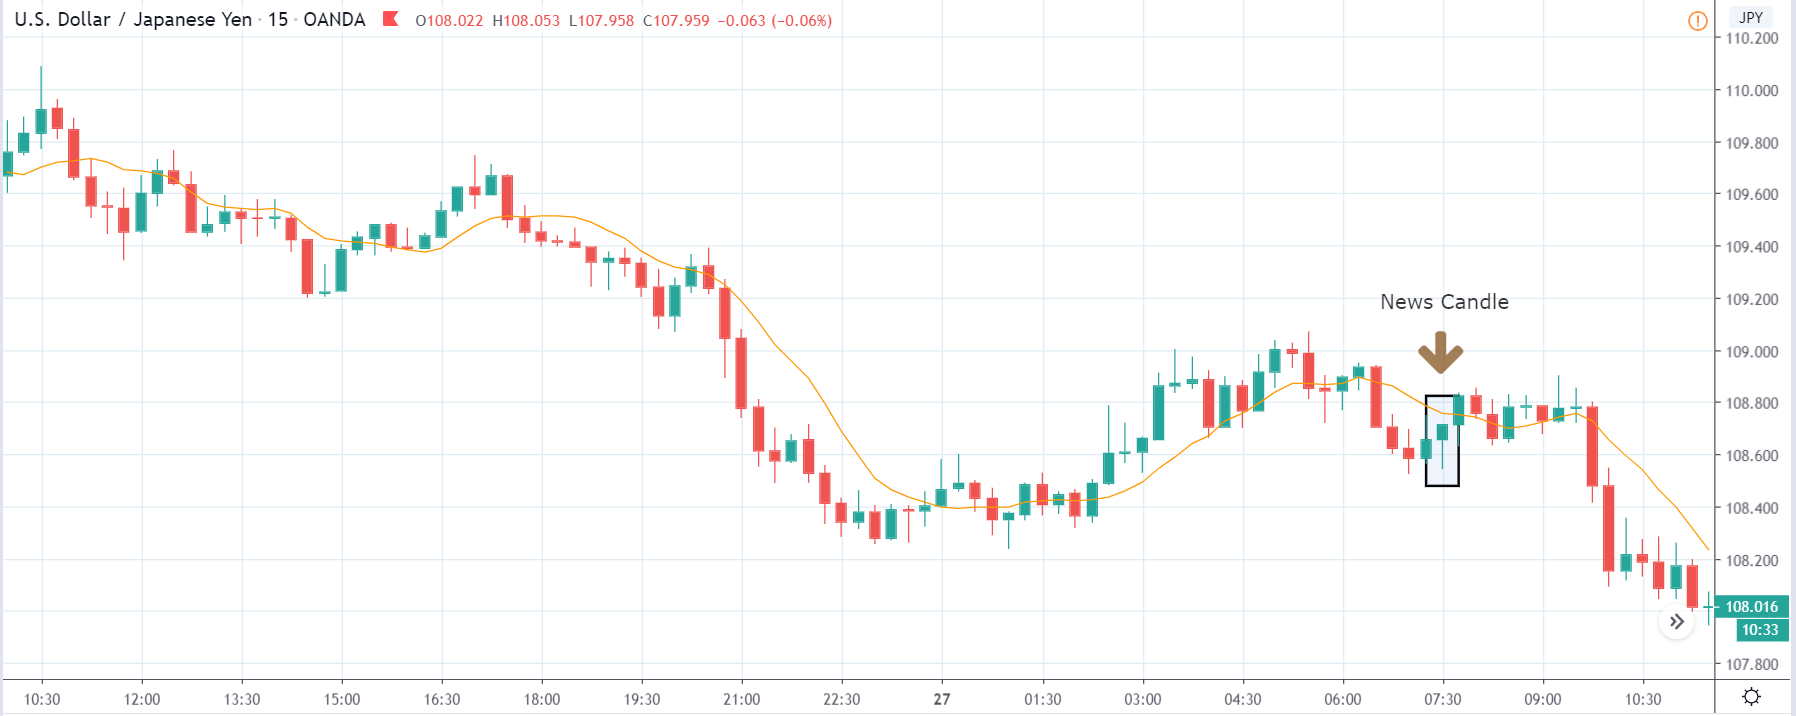
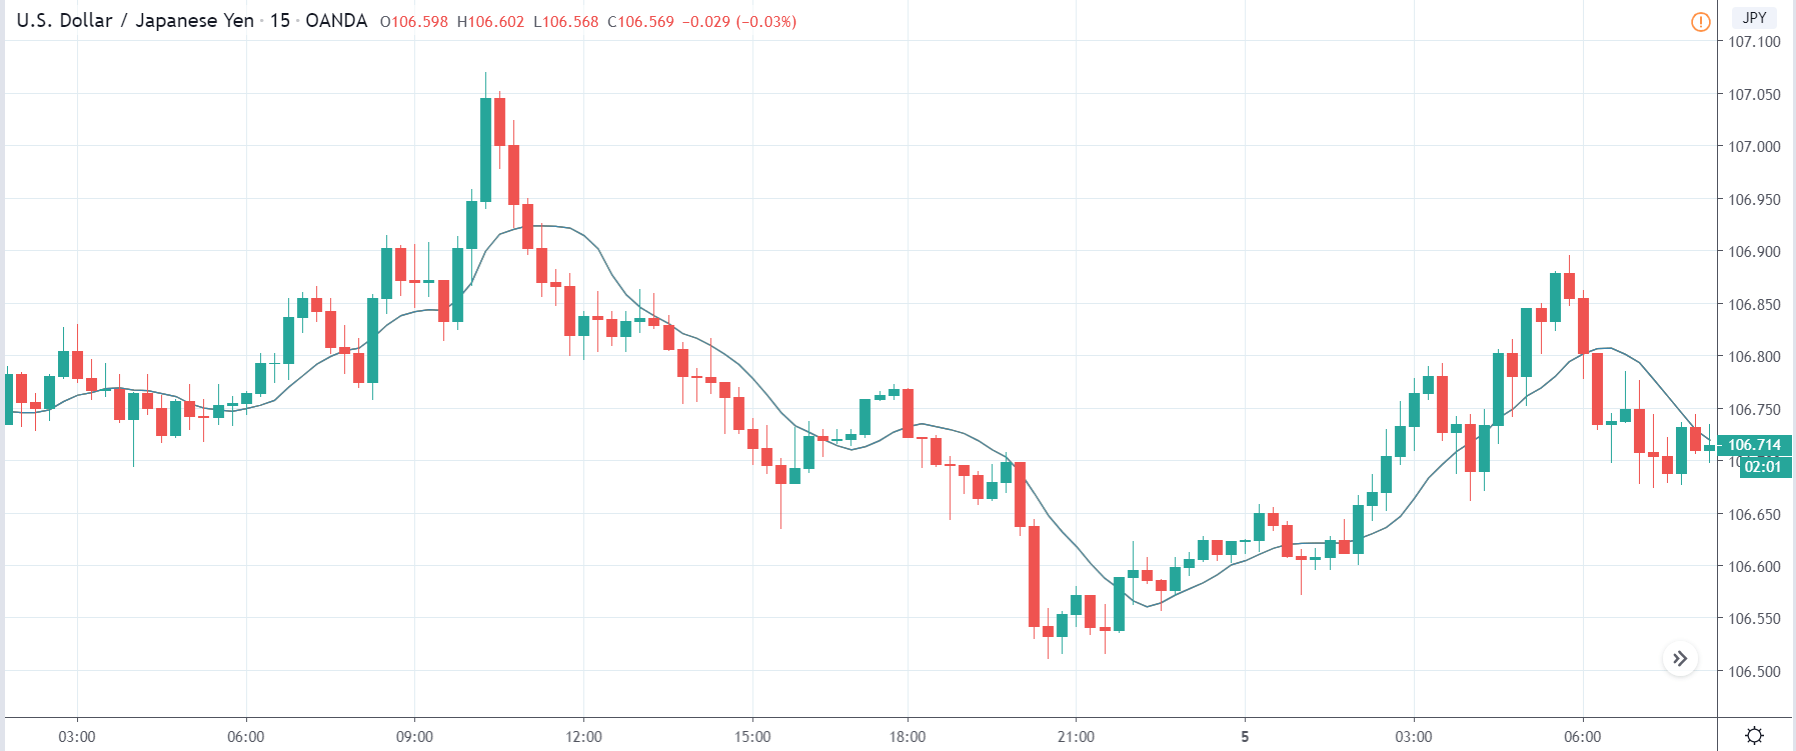
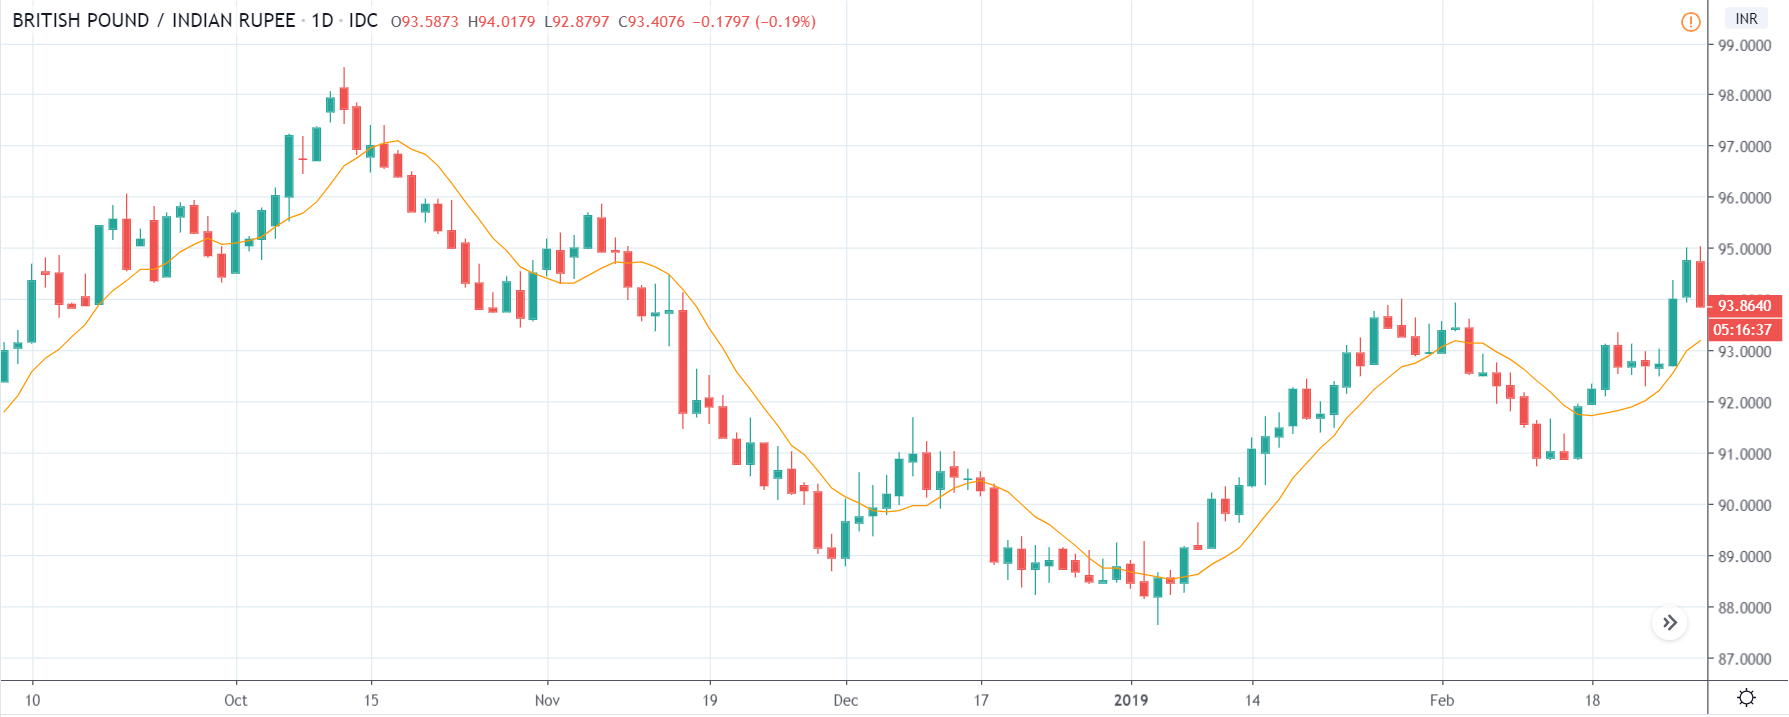
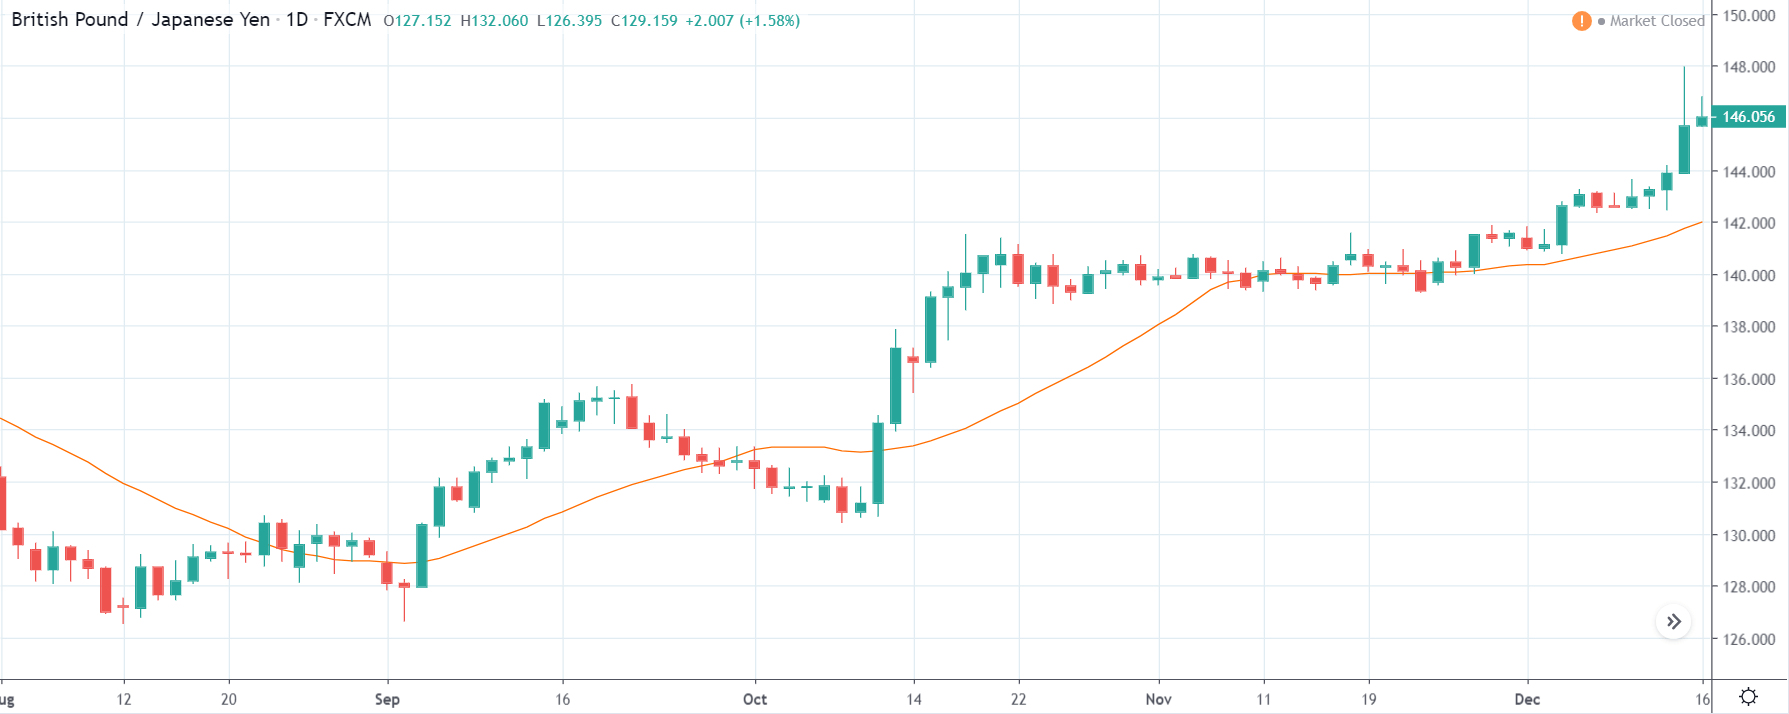
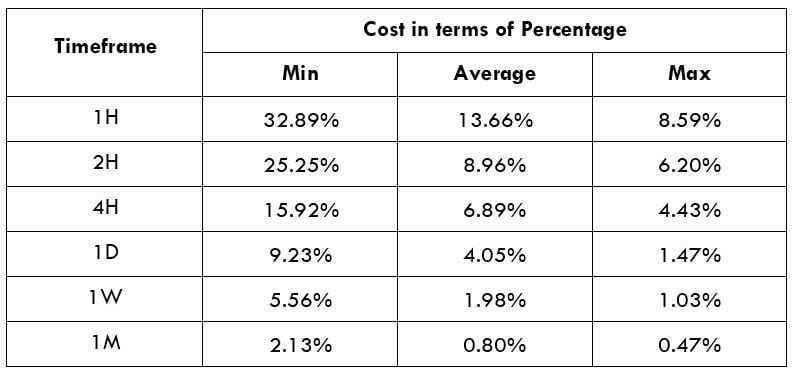
The above images represent the GBP/JPY currency pair where the chart characteristics are almost the same as that of the GBP/CAD, but with a difference that, the uptrend is more extended in this pair. When the market is trending strongly in one direction, we need to cautious while making trades in the opposite direction of the market. Here too, since we are not sure of the Credit Rating data, we cannot position ourselves on any side of the market.

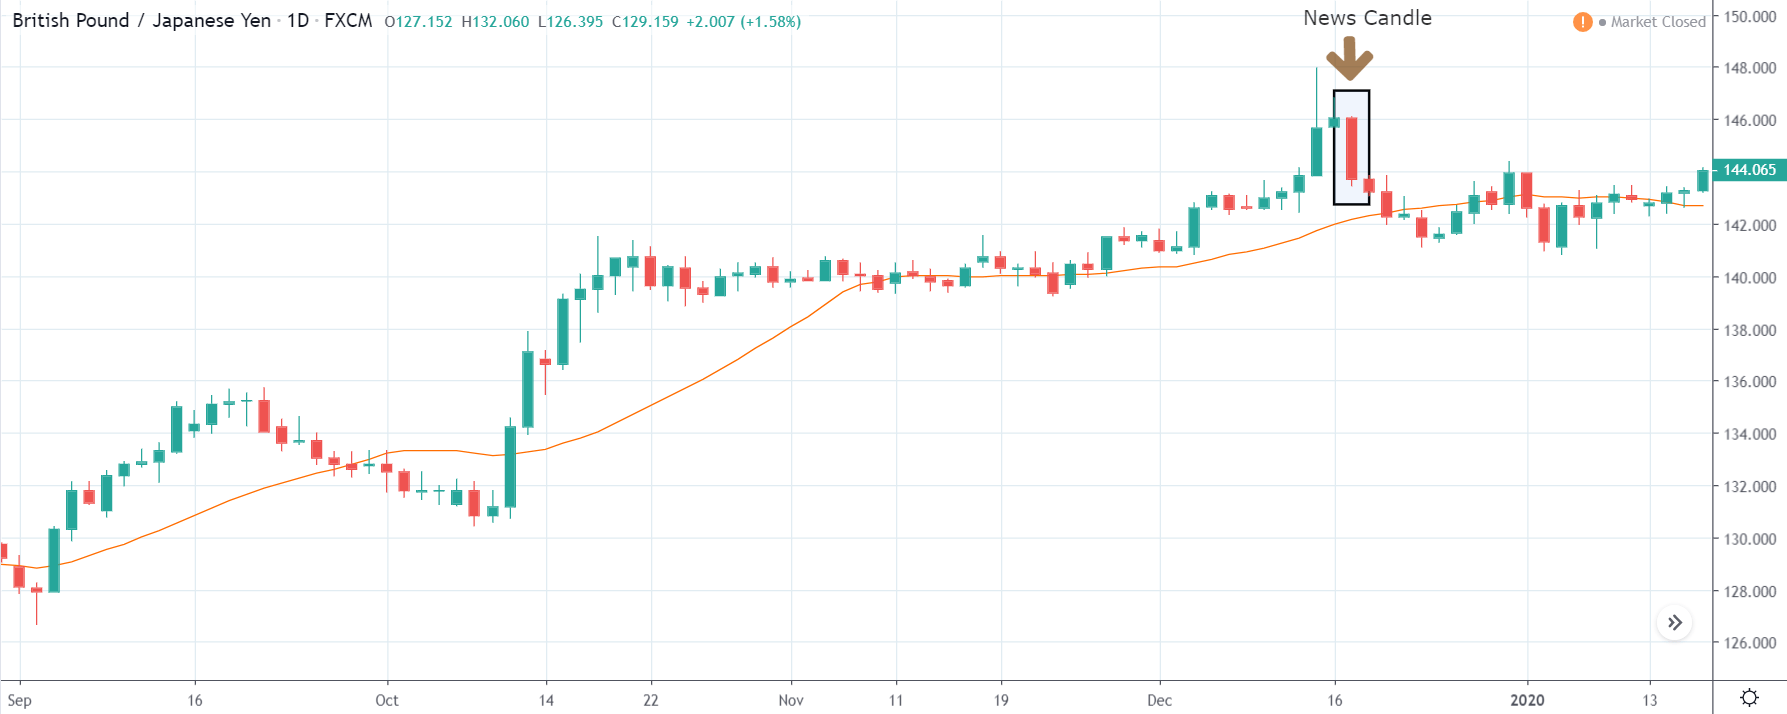
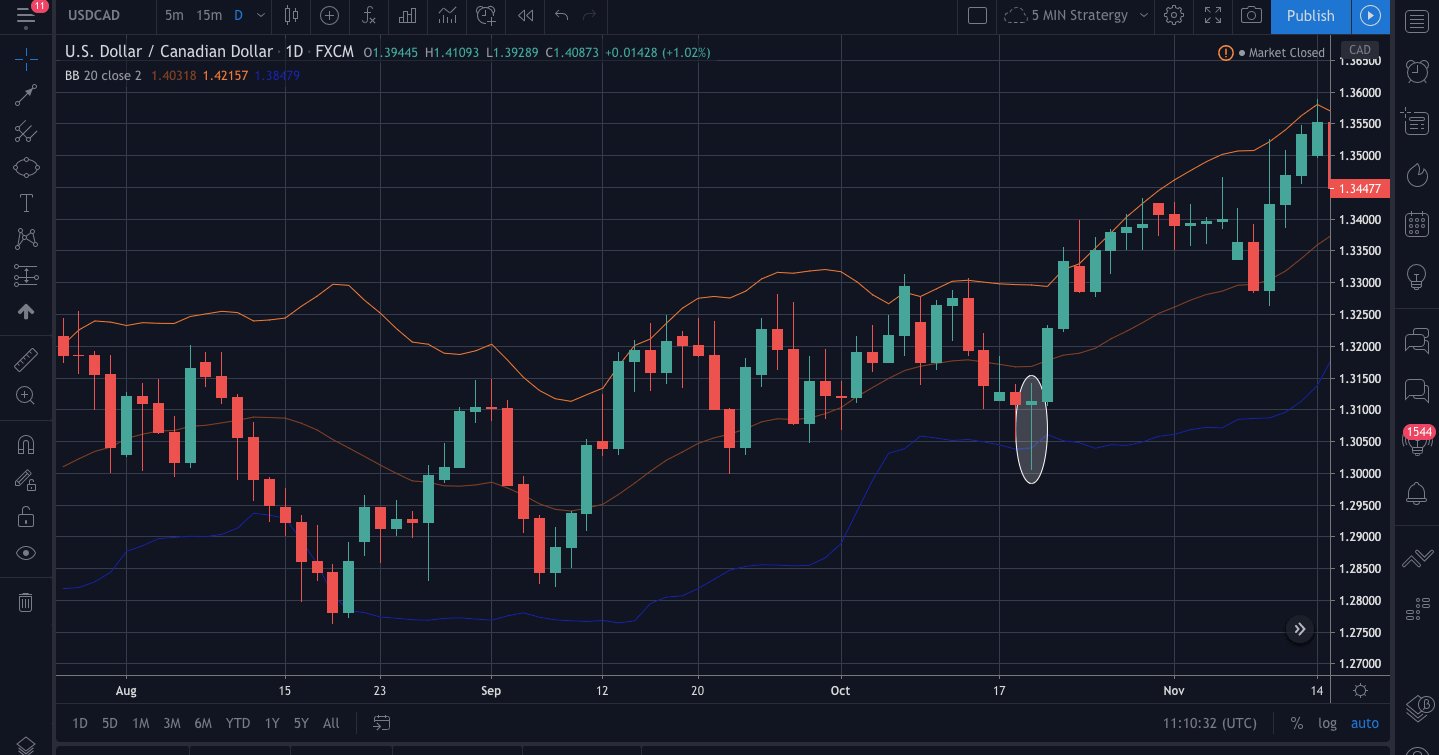
After the news announcement, the British Pound falls but as much as in the above case. There is an increase in volatility on the downside but not sufficient enough to take a ‘short’ trade. Another reason behind a lesser fall in price could be the weakness of the Japanese Yen. Also, the price, even after bad news, is still above the moving average.

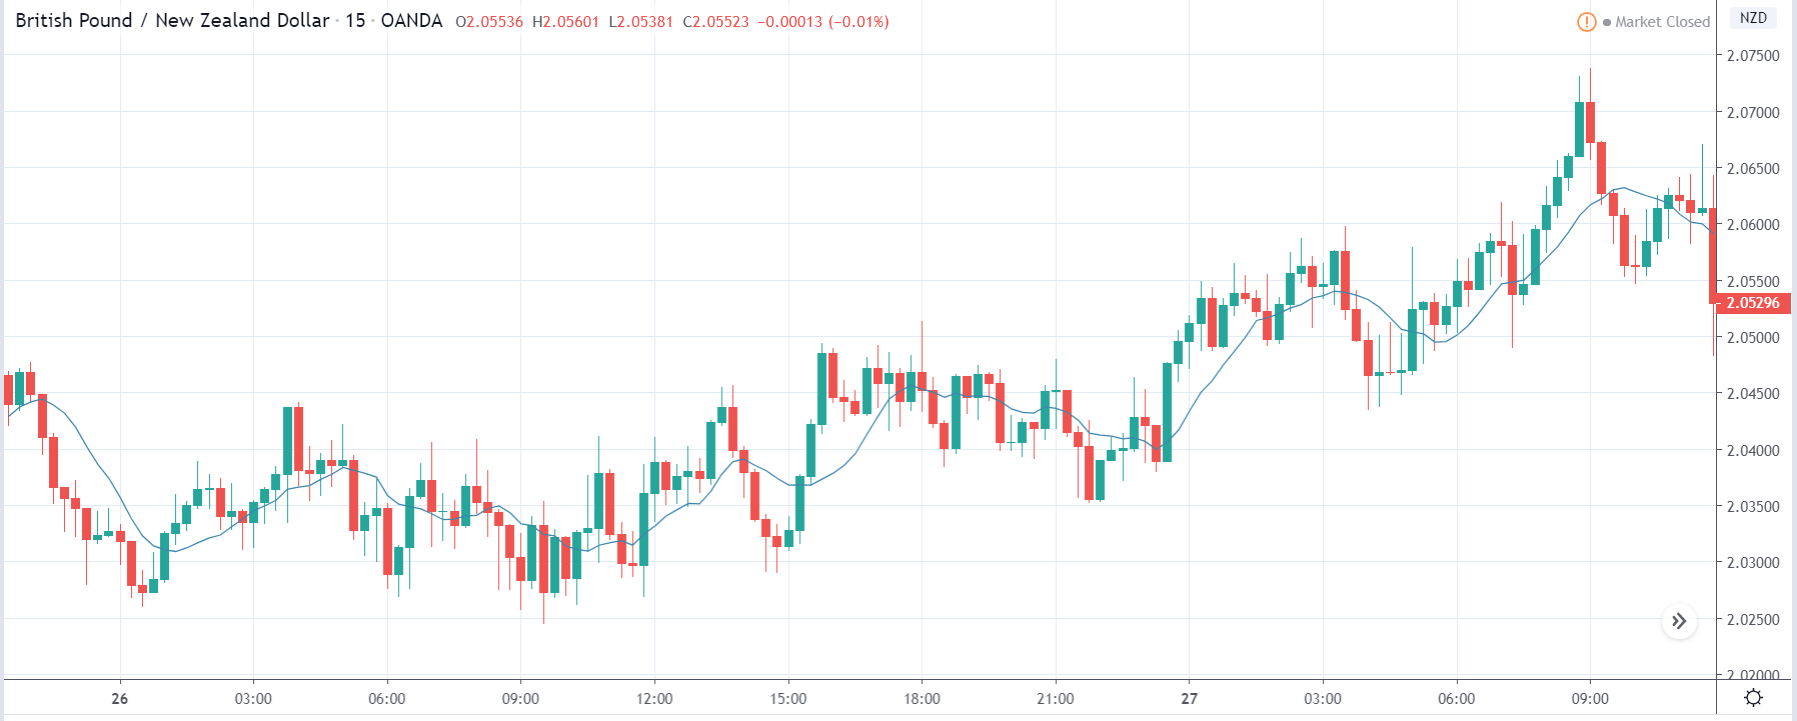
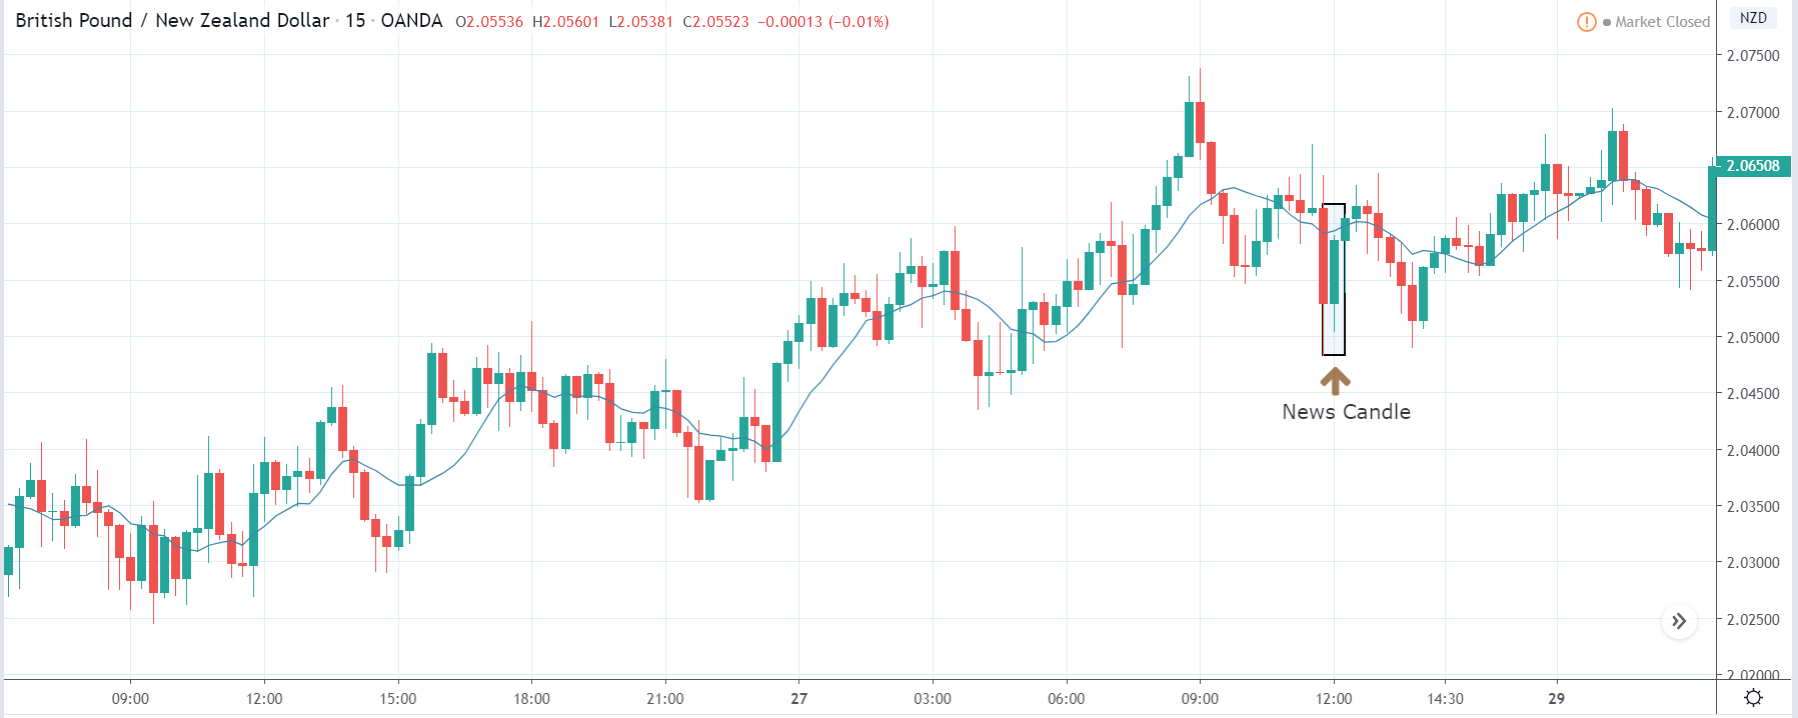
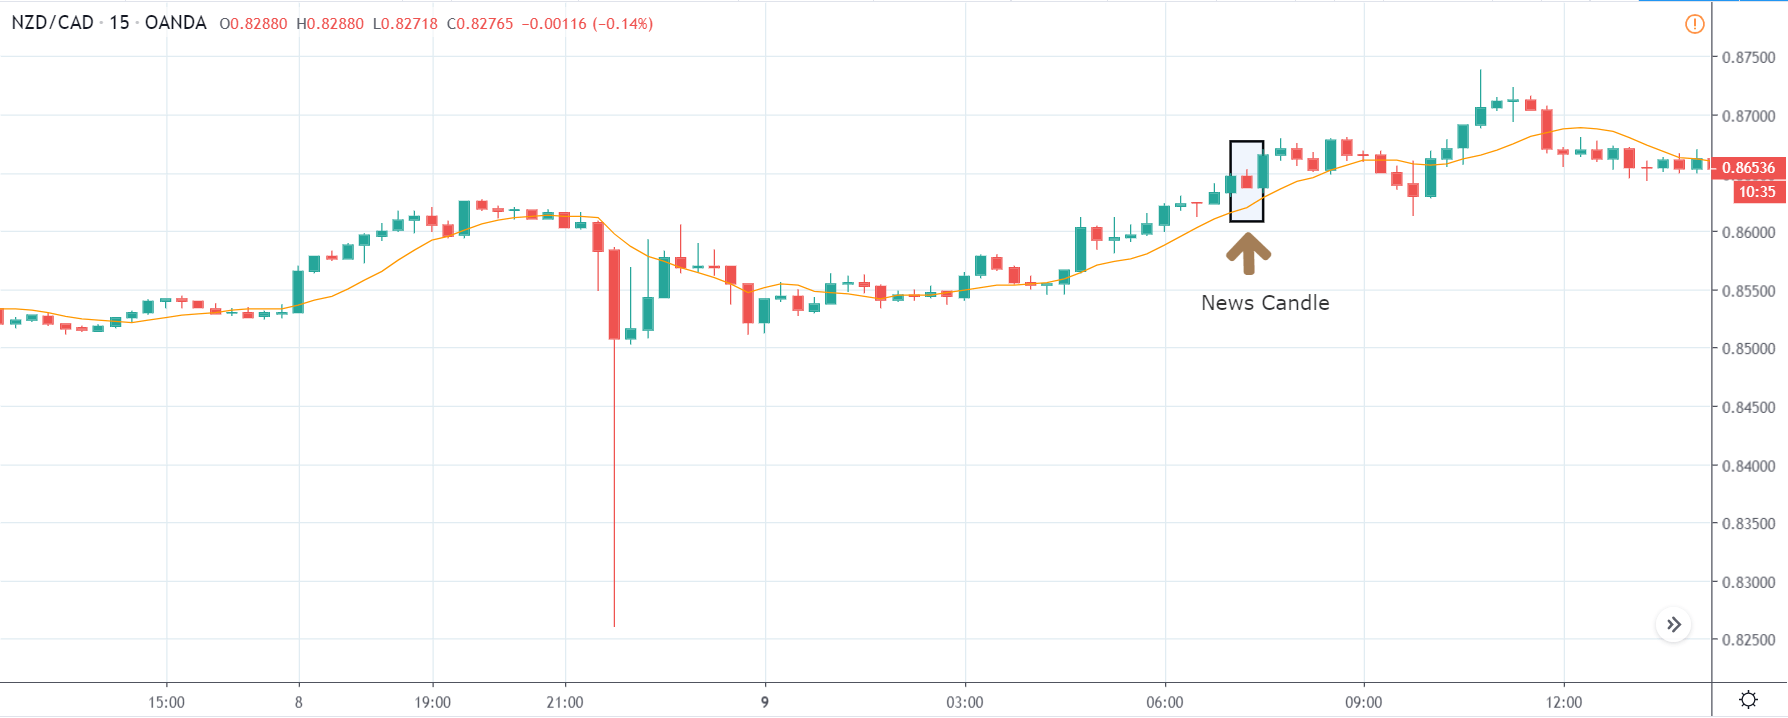
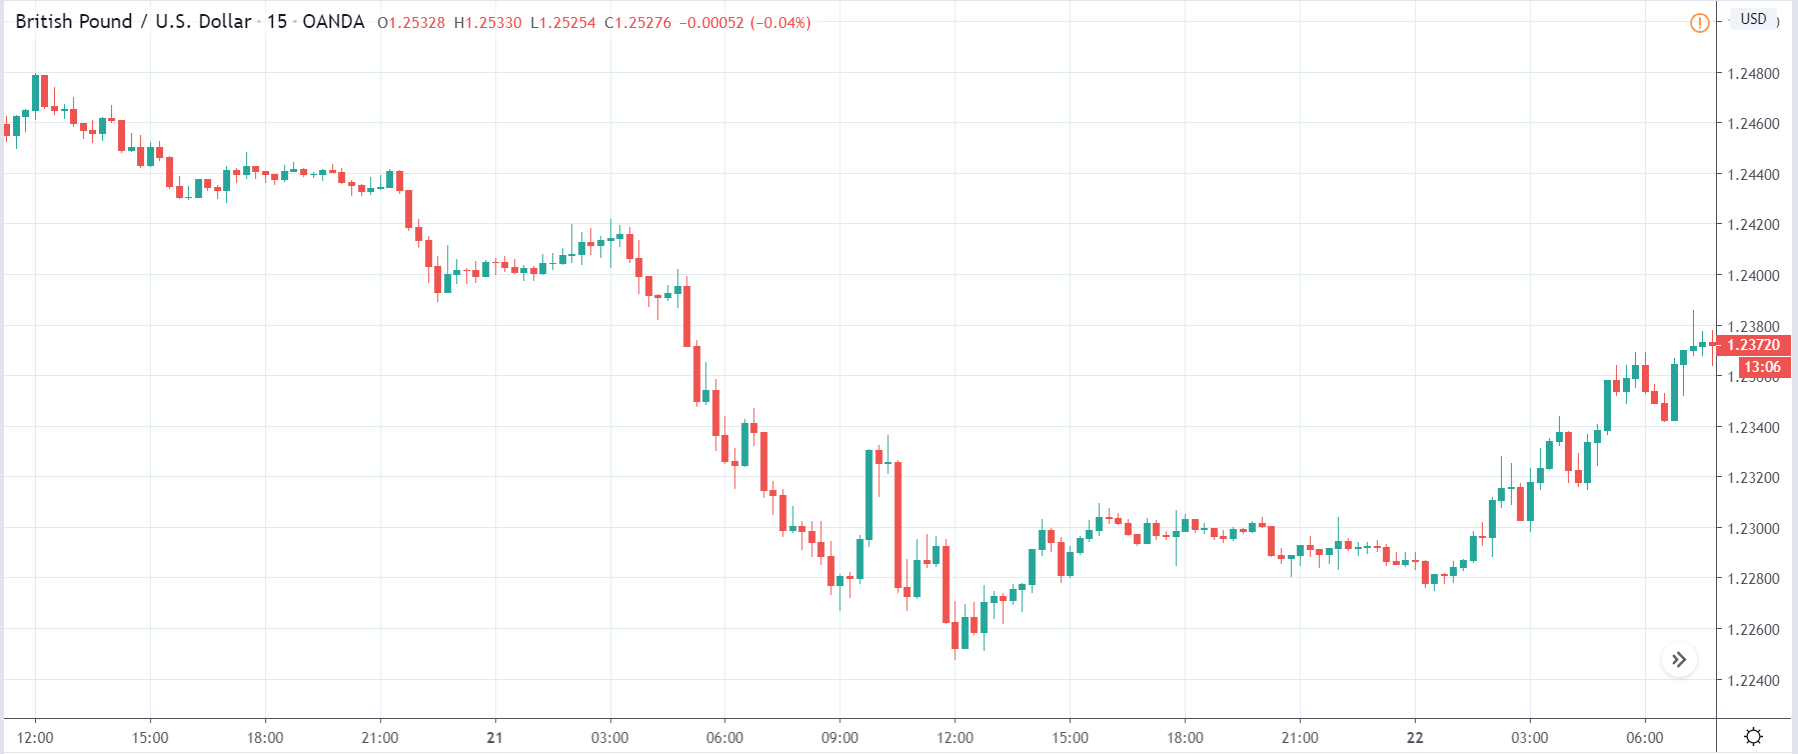
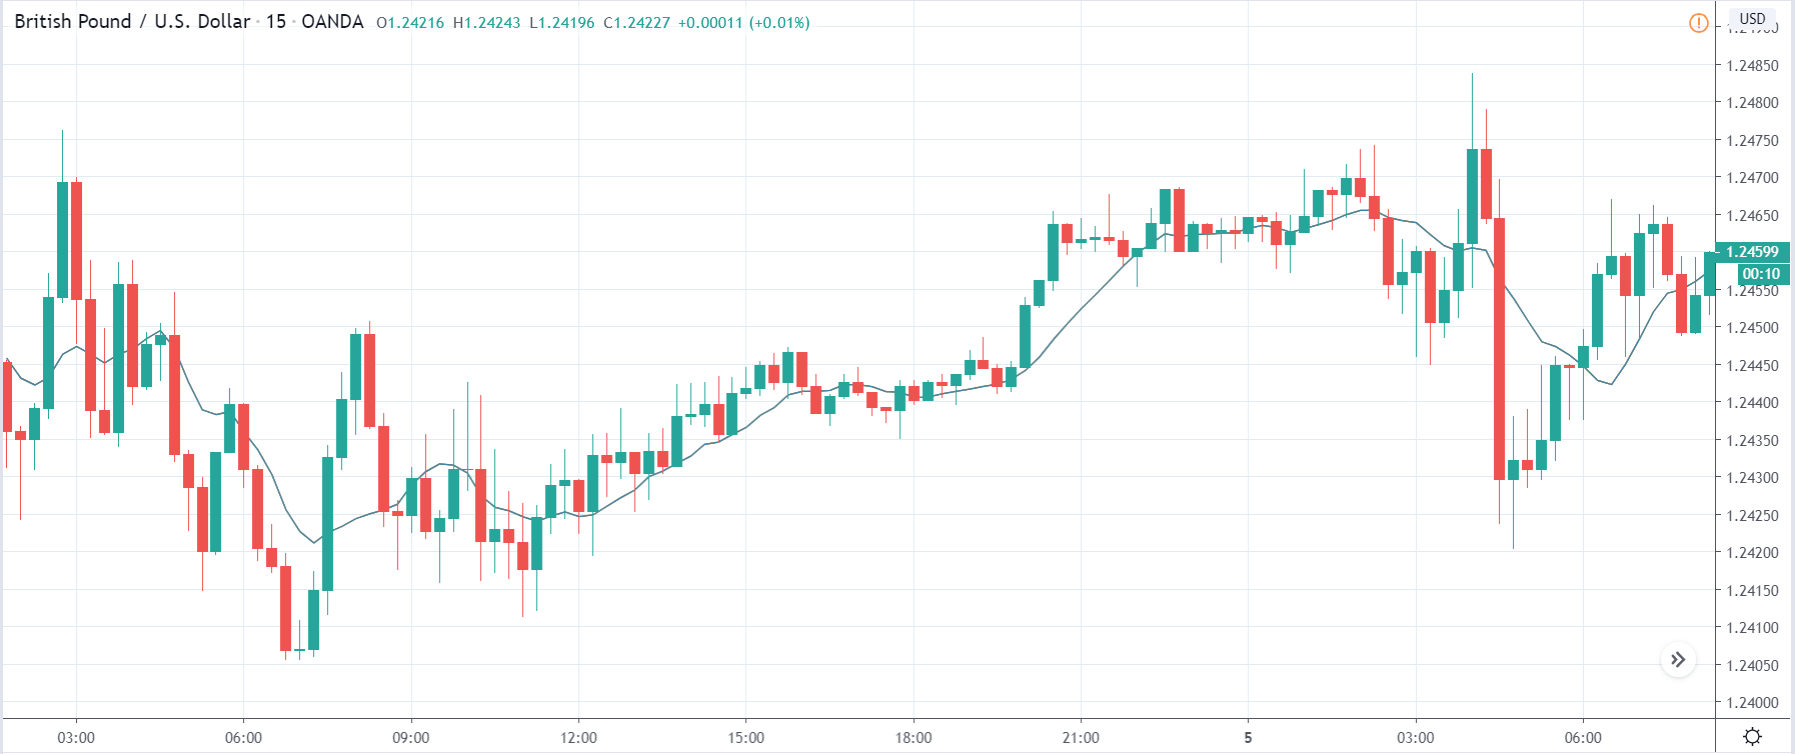
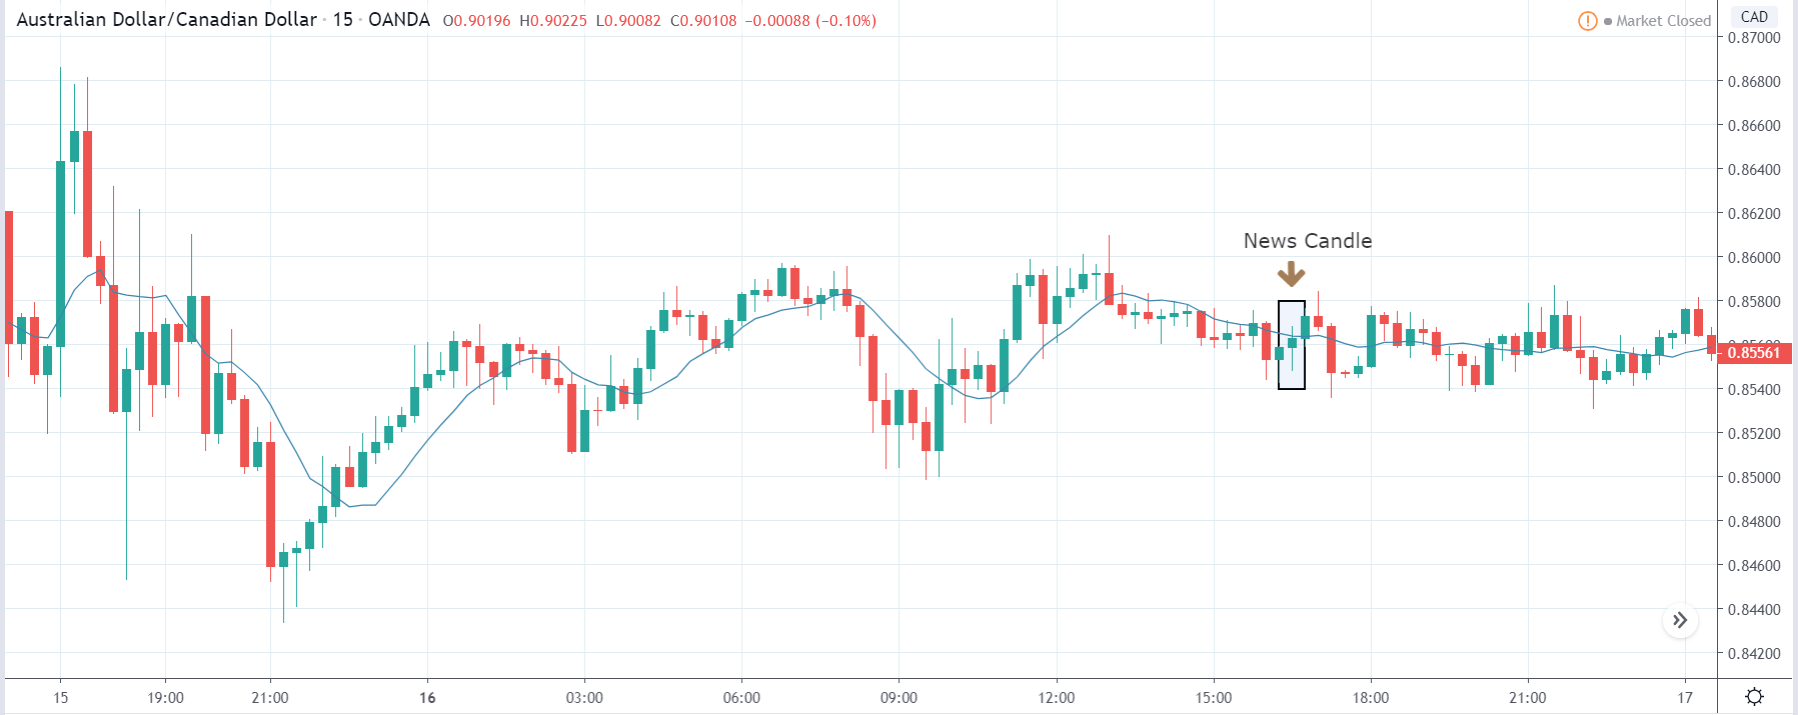
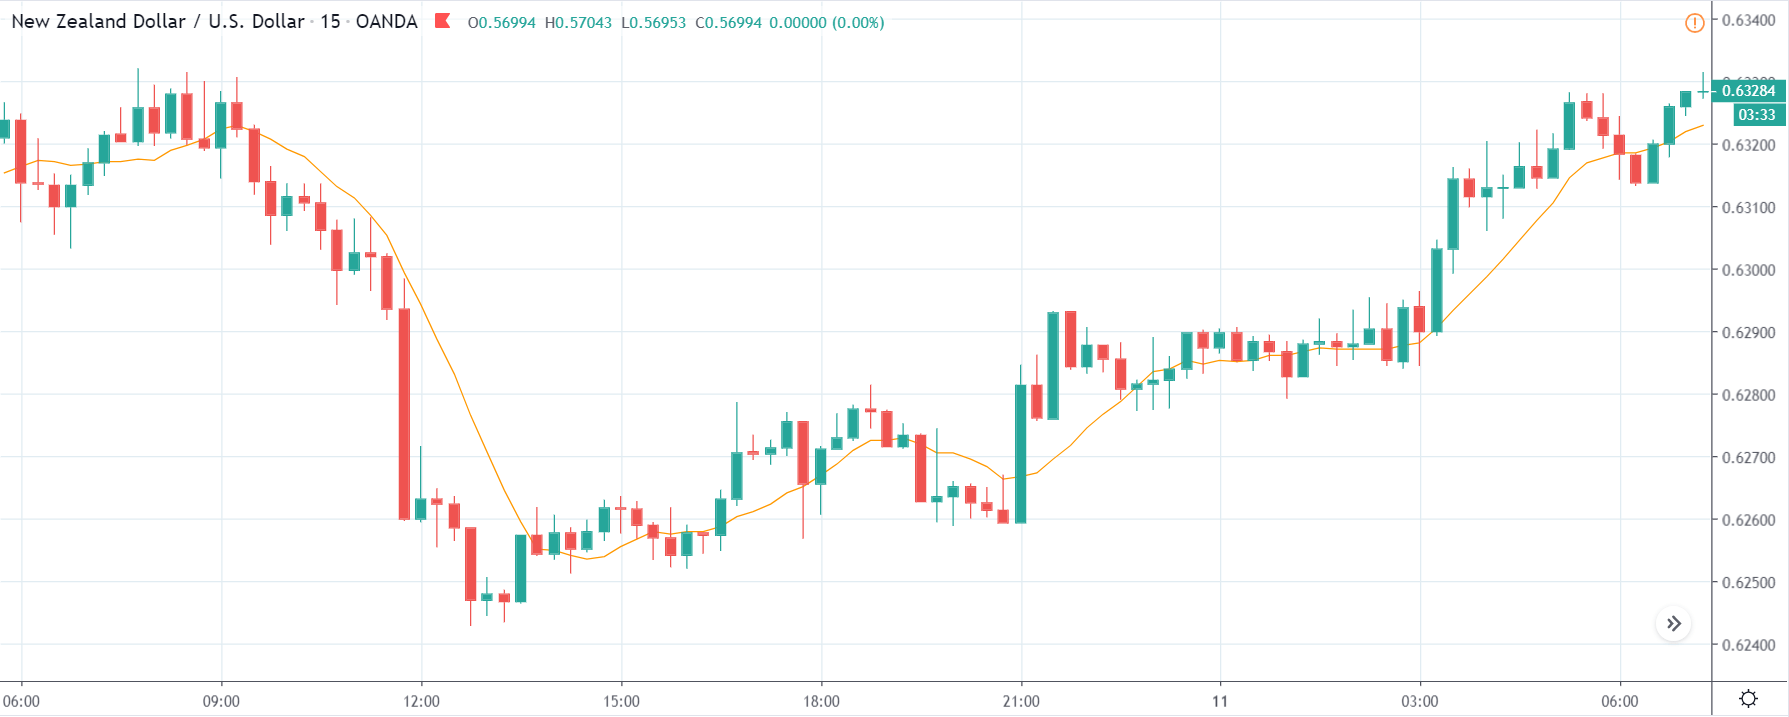
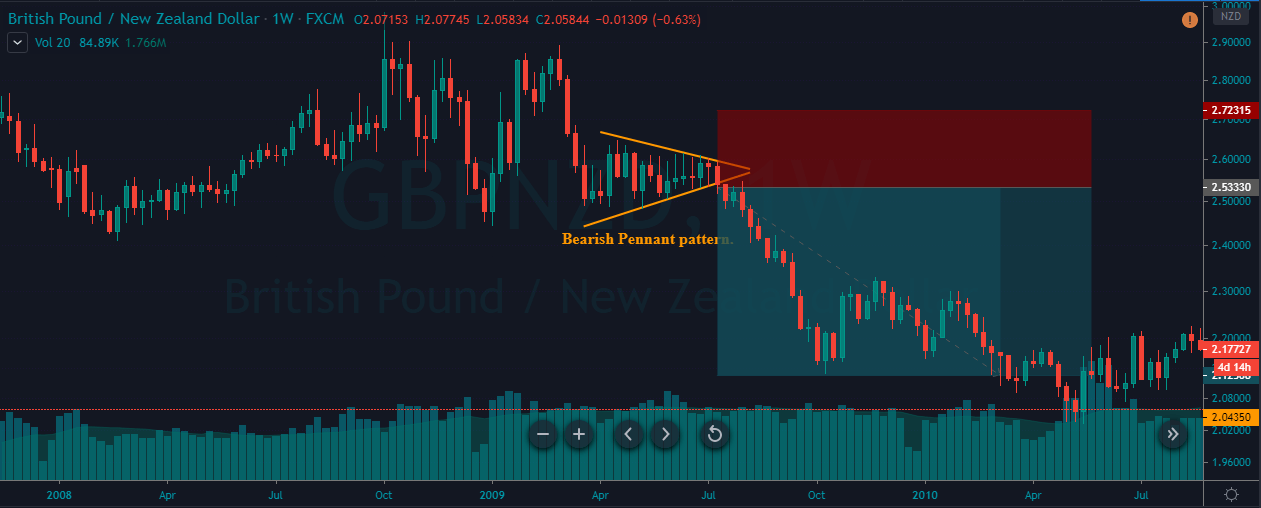
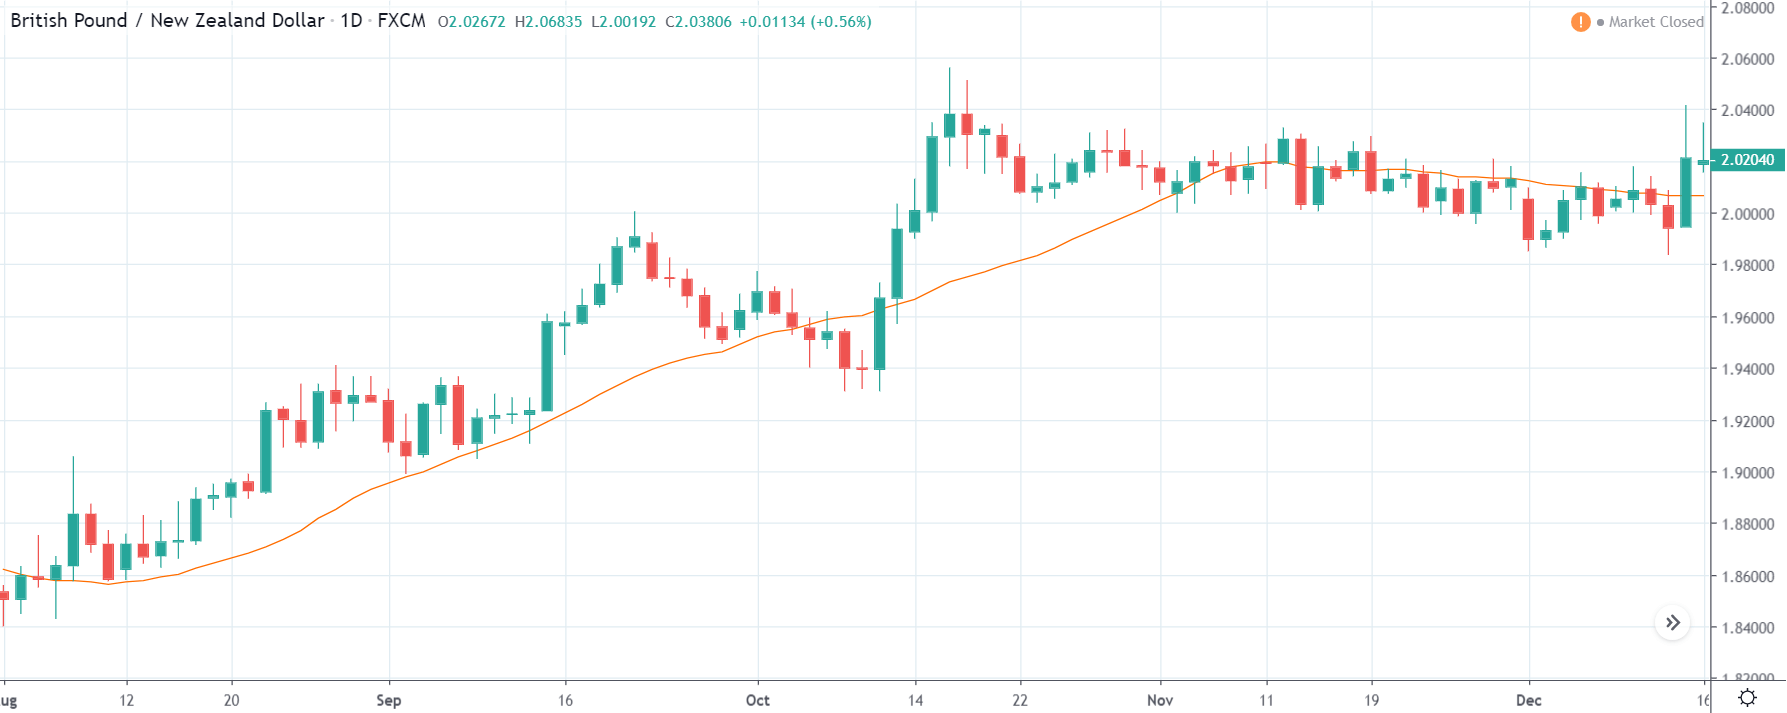
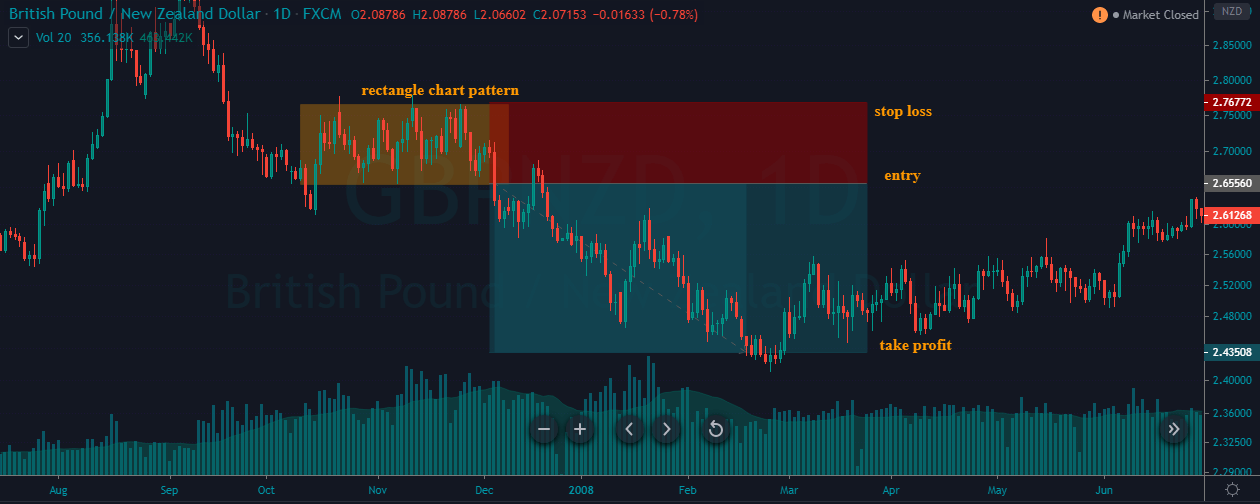
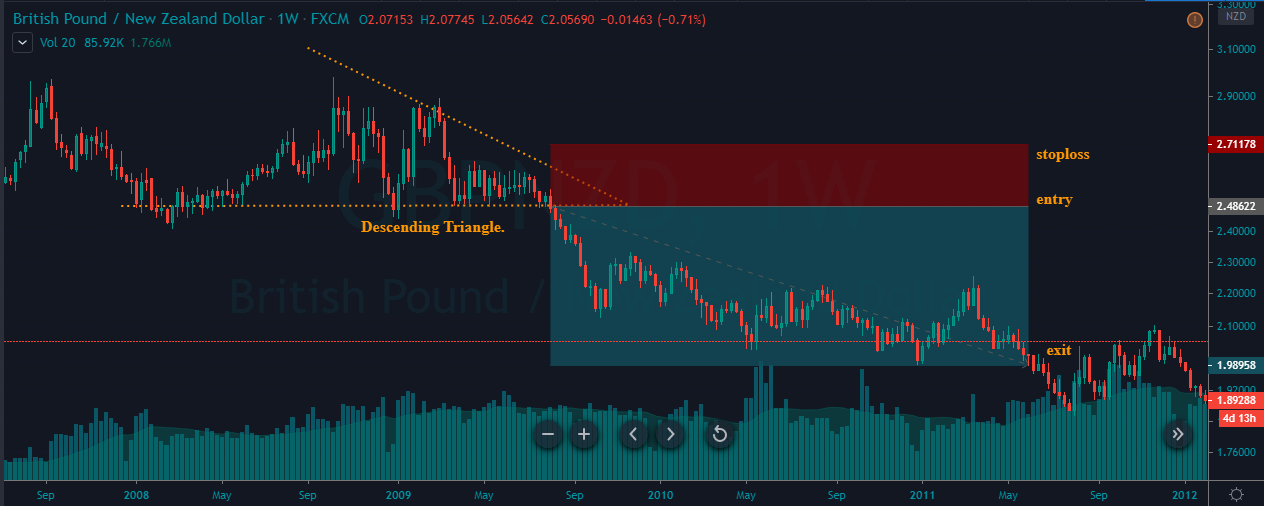
GBP/NZD | Before The Announcement

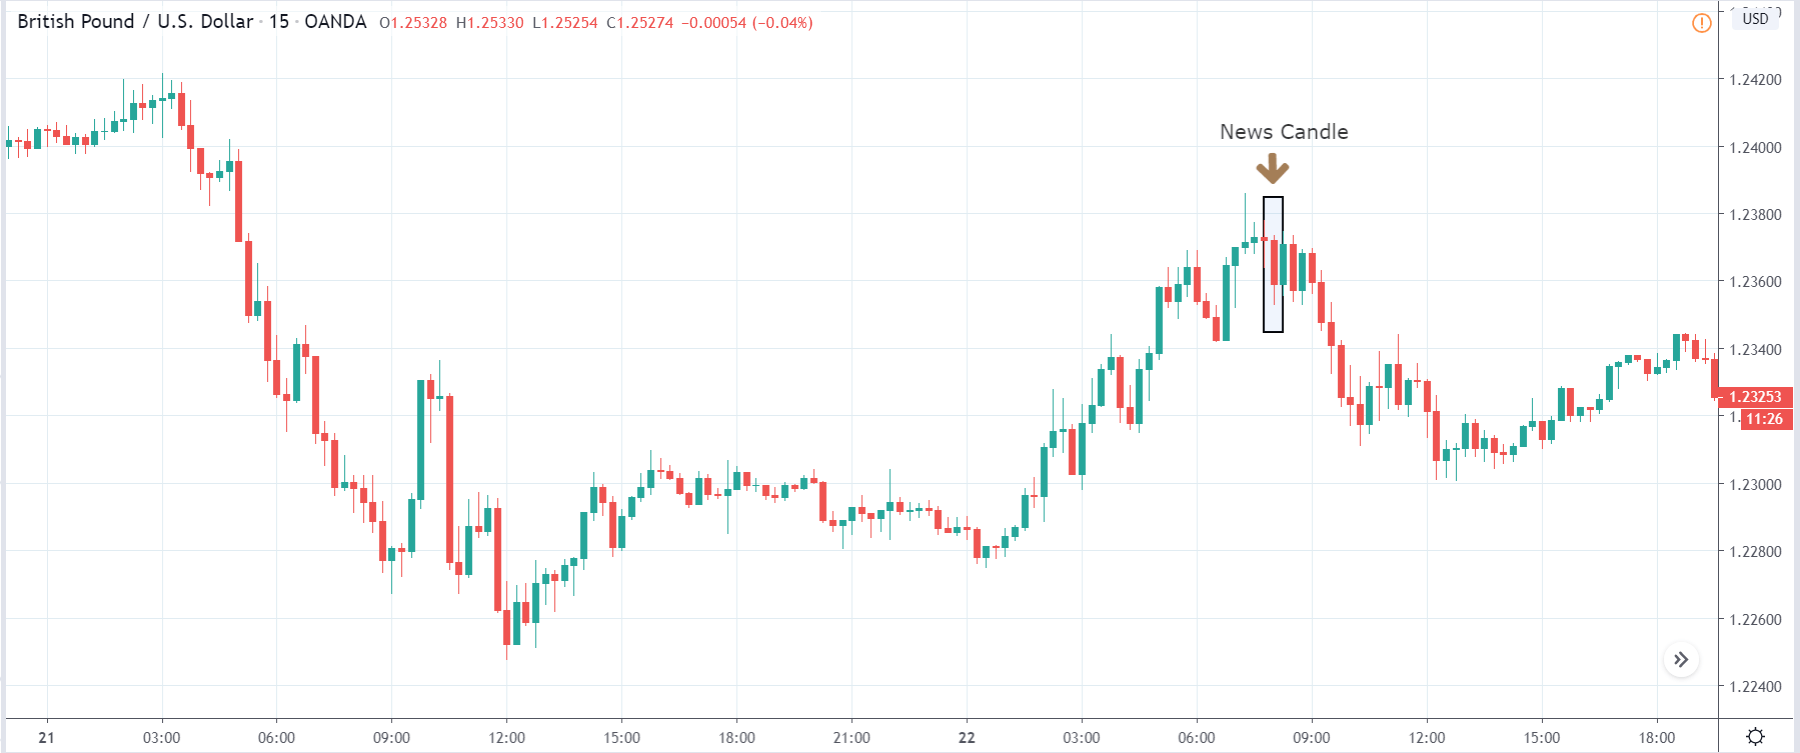
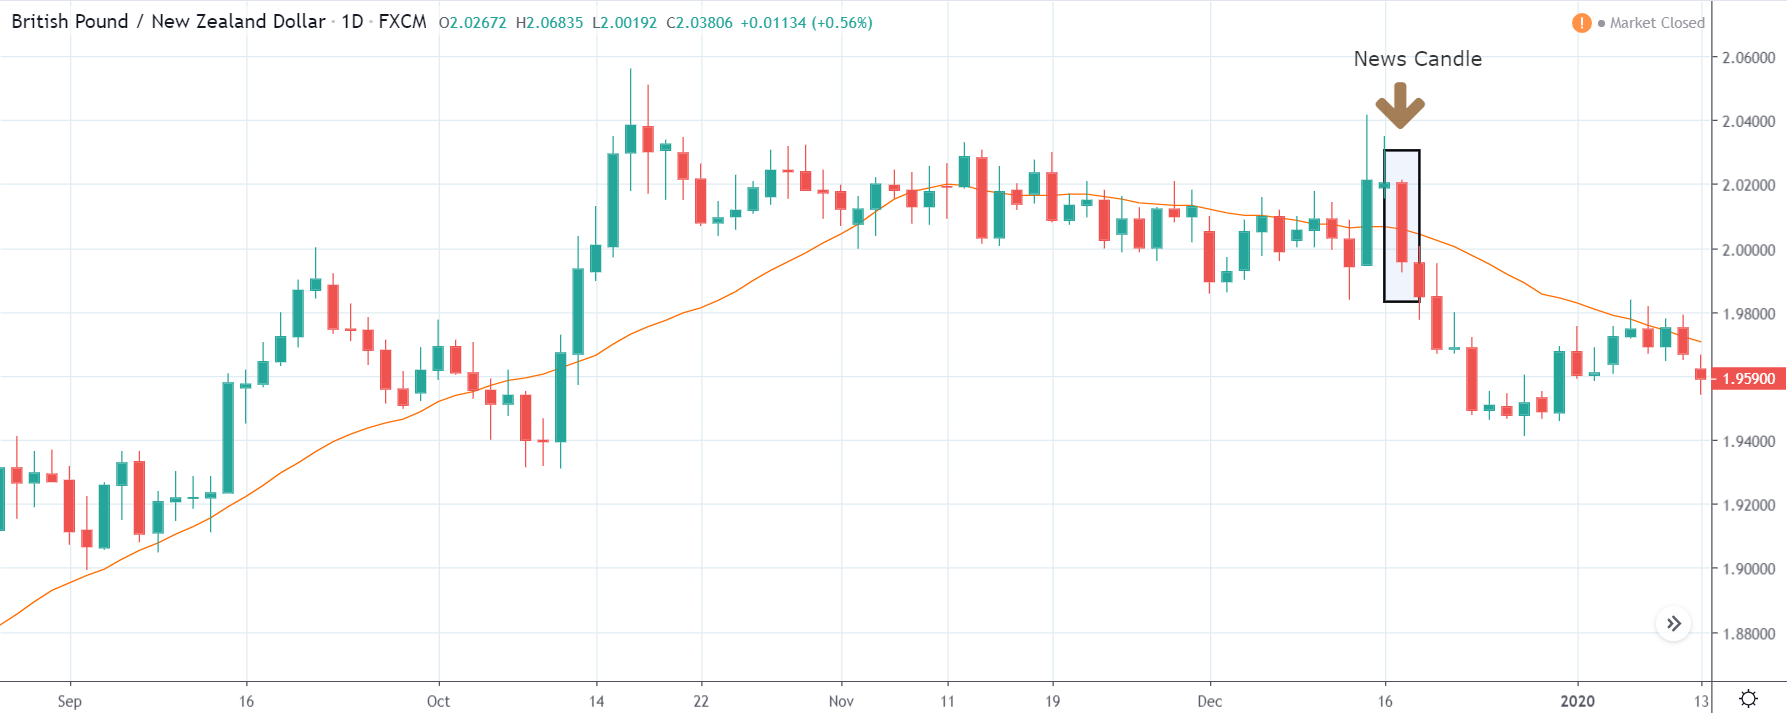
GBP/NZD | After The Announcement

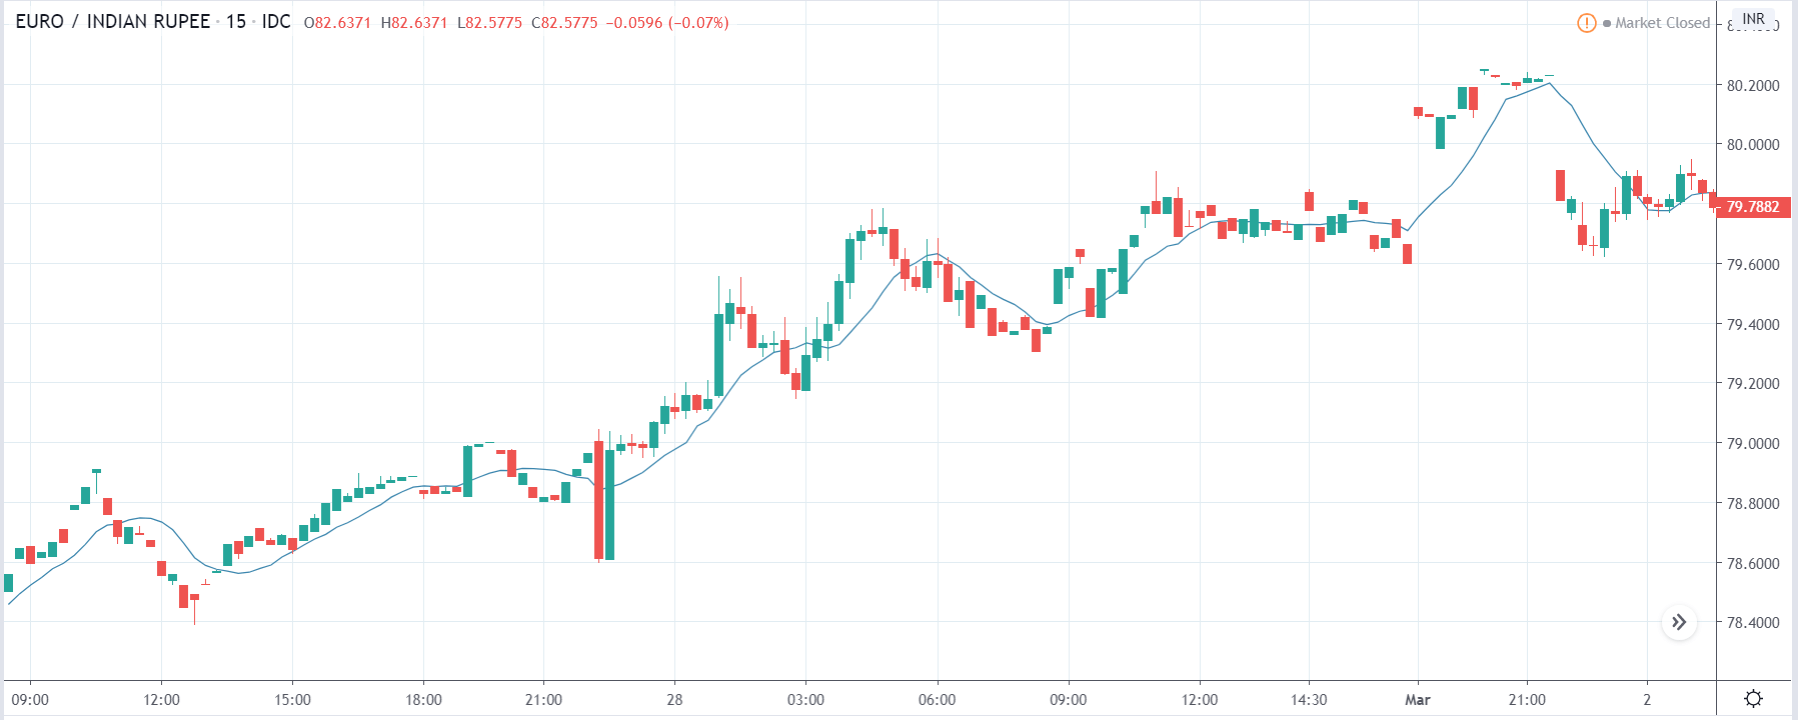
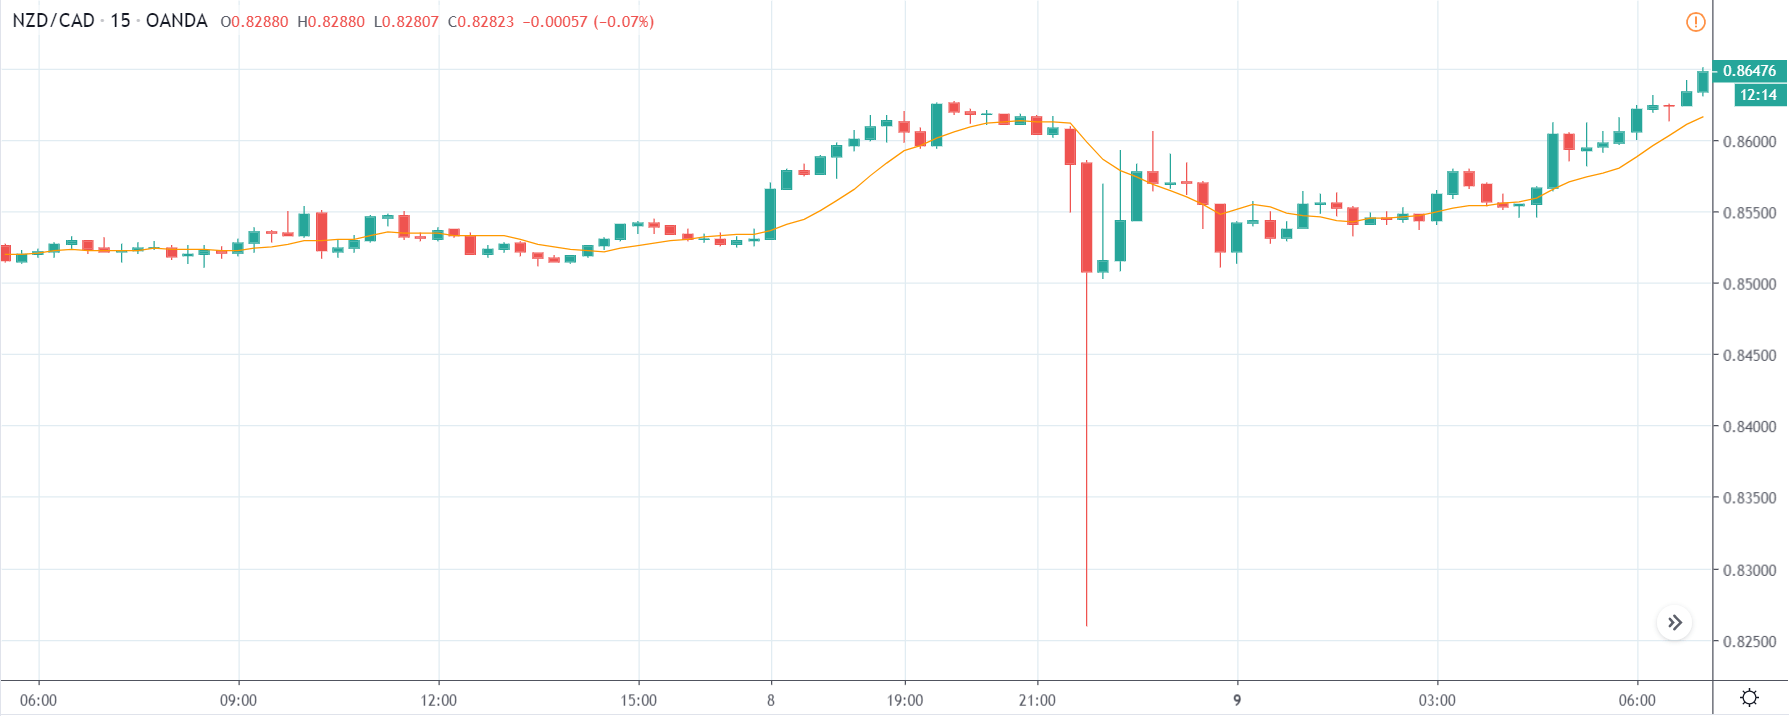
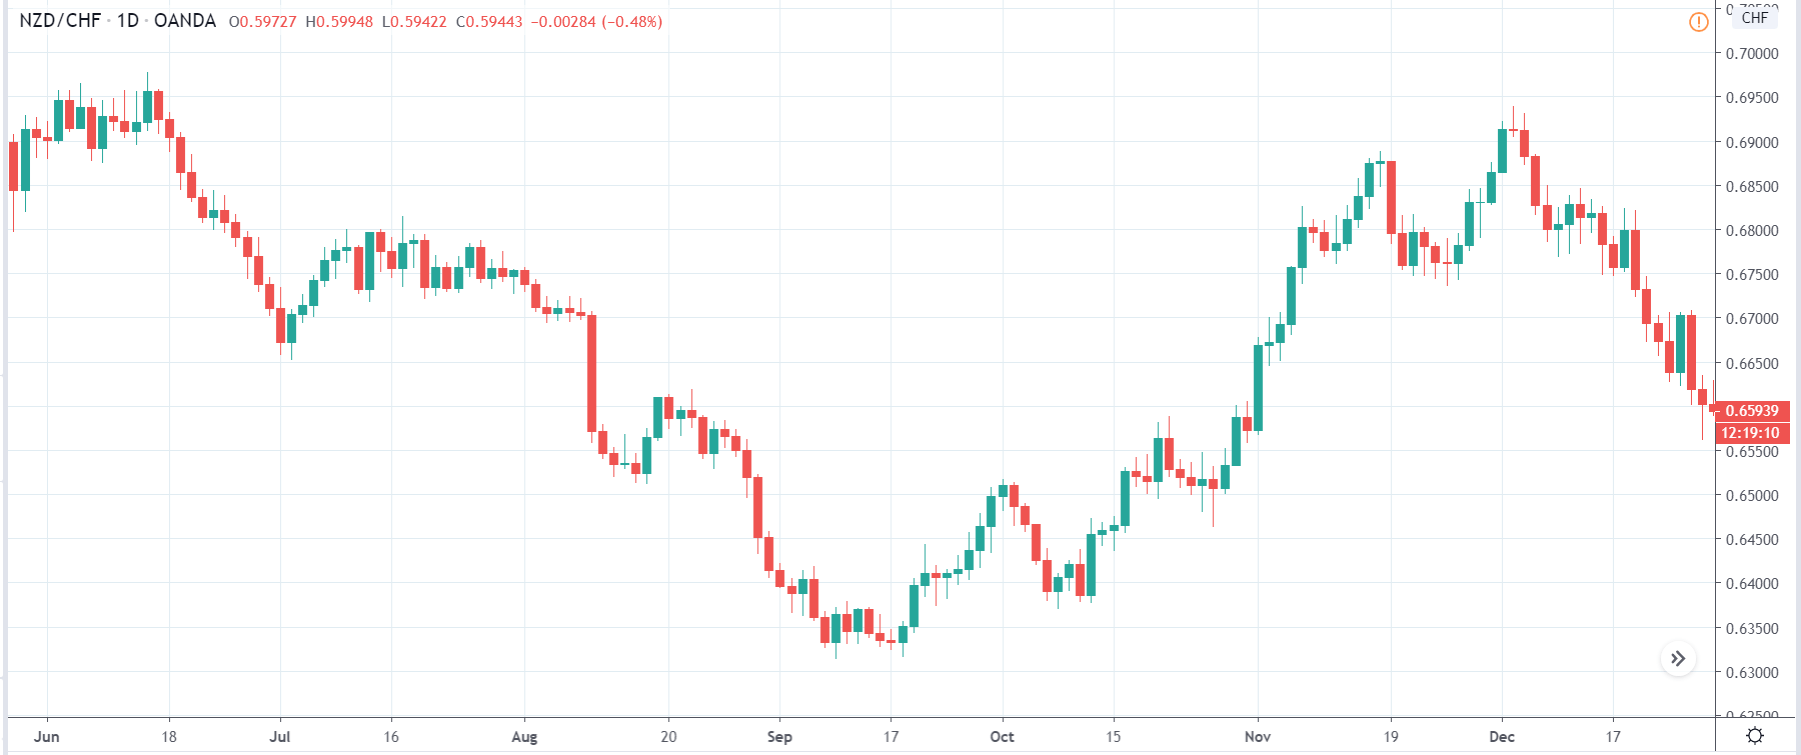
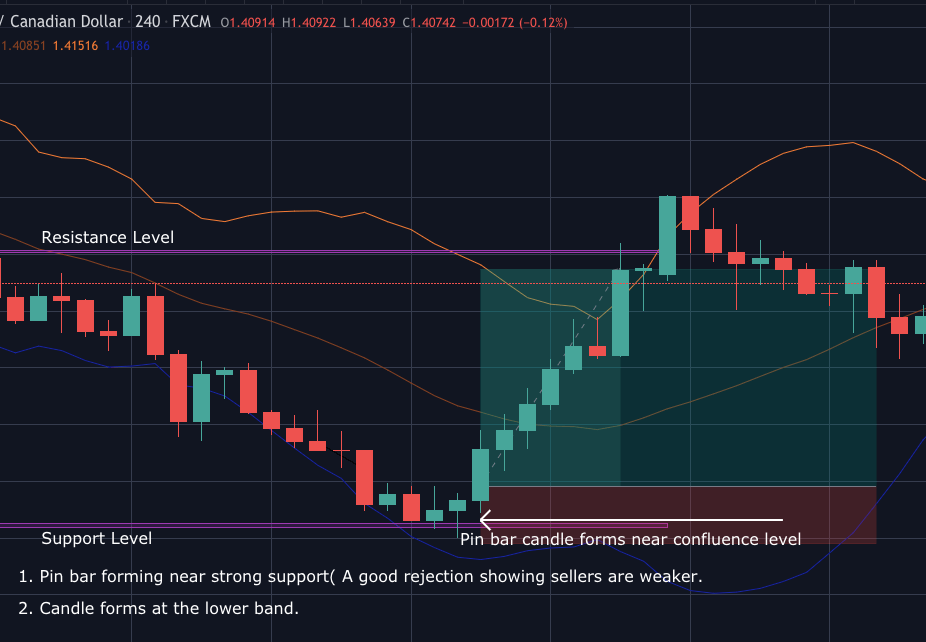
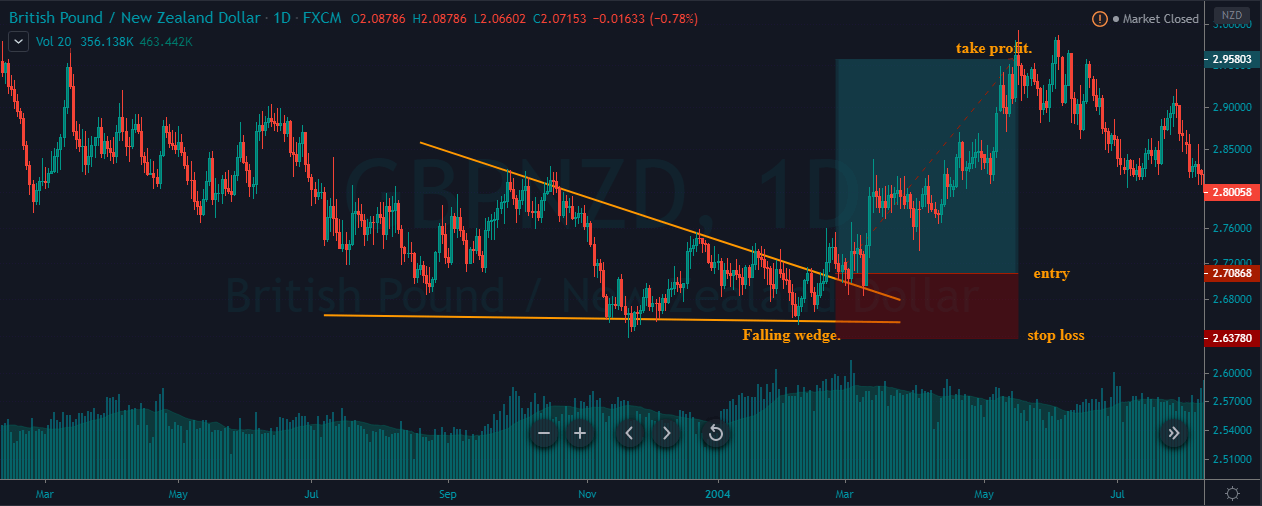
In GBP/NZD currency pair, before the Credit Ratings are declared, we can see that the market is showing signs of weakness. Since the overall trend is up, we need to wait for the news release and get a confirmation from the market. We can still trade in the ‘options’ segment of the market and profit from the increased volatility on either side after the news announcement.

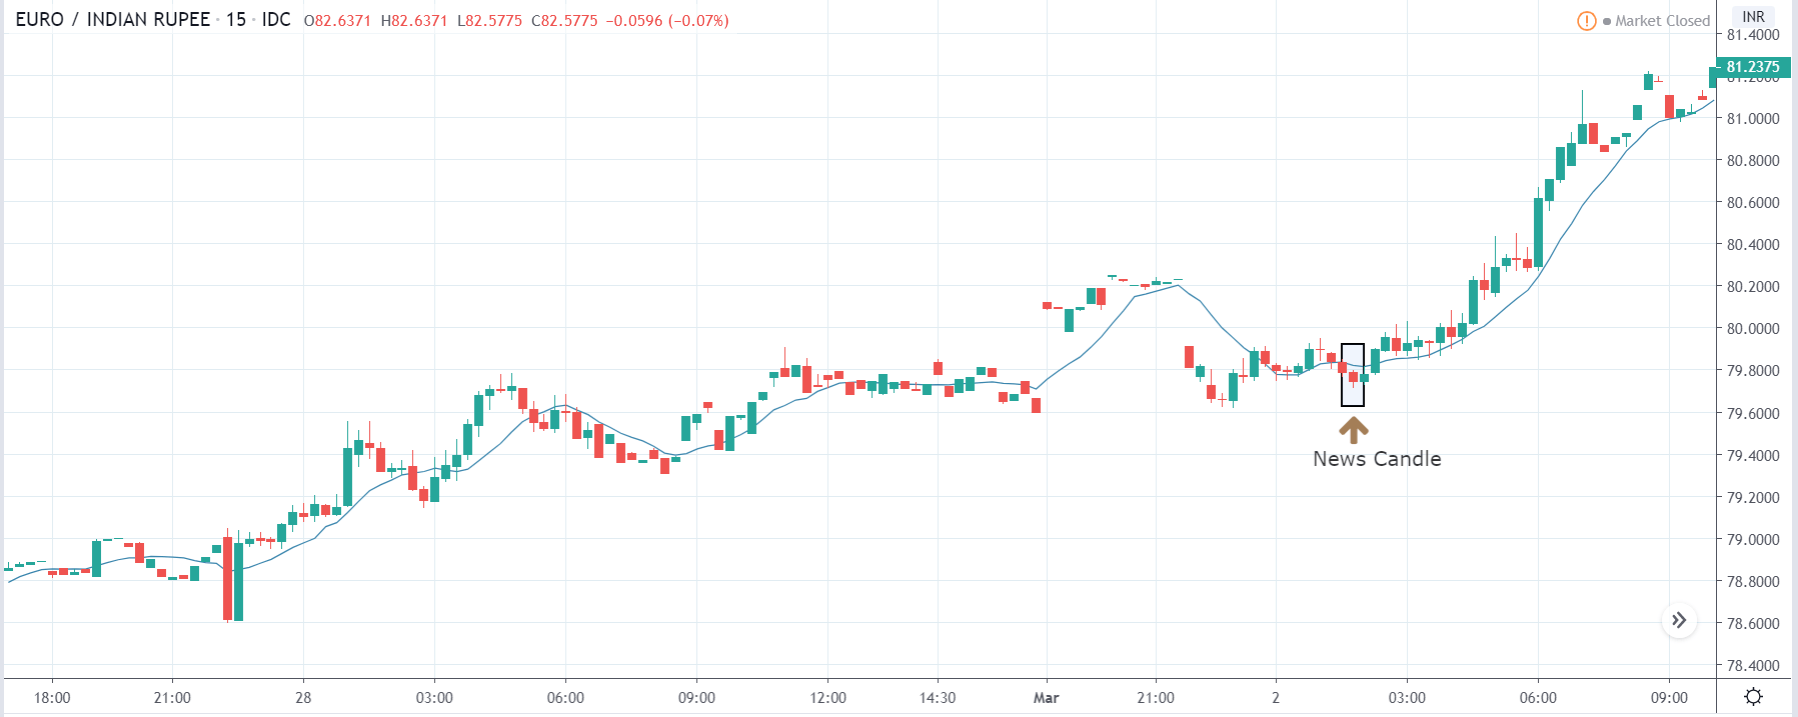
After the Credit Rating data is announced by different agencies, the market falls, and volatility increases on the downside. This is a result of the negative Credit Rating given to the United Kingdom, which disappointed the market participants. Since the market was already showing weakness, this could prove to be the best pair to go ‘short’ with a much higher risk-to-reward ratio.

That’s about ‘Credit Rating’ and its relative impact on the Forex market after its news release. If you have any queries, let us know in the comments below. Cheers!

Categories
Crypto Guides

How Different Is Permissioned Blockchain From Permissionless Blockchain?

Introduction

Blockchain has created ripples throughout many industries. Its security futures are ever essential now with increasing data due to IoT. Artificial Intelligence and Machine learning are used to analyze the data generated to find different patterns as per the requirement. Blockchain is essential to secure the data or transfer the data securely.

Different industries are trying to implement the blockchain technology to improve their business. Hence, it is essential to design the platform in terms of their requirement. To facilitate the same, we have different types of blockchain platforms available. They are as follows:

  1. Permissioned blockchain or Private blockchain
  2. Permissionless blockchain or Public blockchain.
  3. Hybrid blockchain.

Permissionless Blockchain

Cryptocurrency platforms are classic examples of permissionless blockchain platforms. As the name suggests, it is a public blockchain. Anyone can join the network to perform different activities in the network, like users, miners, developers, or community members. Since the network is transparent, anyone can have a look at the transactions getting confirmed in the network.

🔓 Permissionless blockchain networks follow all the underlying principles of a real blockchain network. These networks are genuinely decentralized.

🔓 Authorities cannot shut down the network as no single entity controls the network. People, regardless of nation, location can join the network from anywhere.

🔓 Mostly all public blockchains are linked to a token with some intrinsic value. Based on the network-specific number of coins are mined at the beginning itself, or new coins are mined after every block is confirmed.

🔓 Miners are rewarded with these tokens to keep running the network smoothly.

🔓 Bitcoin is an example of a permissionless blockchain network.

Permissioned Blockchain

Enterprise blockchains are an excellent example of permissioned or private blockchains. Permissions should be given for different entities to join the network.

🔐 Everyone should have valid credentials to join the network.

🔐 These networks are not genuinely decentralized as these networks are created for the purposes of enterprises.

🔐 Not all the members of the network can see the transactions unless they have appropriate permissions.

🔐 Different Hyperledger platforms developed for different enterprise use cases are good examples of permissioned blockchain networks.

🔐 These blockchains are often not associated with tokens as enterprises run these.

Consortium Blockchains

Consortium blockchains are nothing but private blockchains but run by different entities together. Blockchain, being niche technology, different companies, even rivals, are coming together as a consortium to develop the technology.

R3 Corda is one such example in the financial place formed to create the technology for Fintech purposes.

Hybrid Blockchain

Hybrid blockchains offer the functionalities of private and public blockchains together at the same time. The entities involved can choose which data should be open or closed, depending on their functionality. The users need not forgo one feature completely to utilize the other functionality.

🔐🔓 Interoperability is very much possible, enabling to form multichain because of the hybrid nature of the platform.

🔐🔓 Dragonchain is an excellent example of Hybrid blockchains.

These are different types of blockchains available as of now, enabling the adoption of various industries as per their requirement.