Introduction
Housing Index is a broad and long term metric for investors and traders to judge the Housing Market in a country or specific region. There is a good correlation between the Housing Market, Stock Market, and economic growth. Housing Markets generally reflect the health and strength of the economy. Hence, the Housing Index serves as a pulse check or double-check for traders to affirm their economic assessments.
What is the Housing Index?
It is a measure of changes in the price movement of single-family houses. It generally measures the changes in residential housing prices as a percentage change from an index period (base period). The Housing Price Index for the base period is 100, and subsequent reports measure the change relative to this period.
For example, an HPI of 110 indicates a 10% appreciation in the single-family housing prices in a region. Hence, it is a direct measuring tool for housing price trends and serves as an indirect measurement tool for housing affordability, mortgage default rates, and prepayments, etc. It is often expressed as change with regards to the previous month in percentage also.
Although different agencies are measuring the Housing trends, the most prevalent is the Housing Price Index by the Federal Housing Finance Agency in the United States. The FHFA HPI is a weighted, repeat sales index. It means it takes Houses that have also been refinanced into account. This data is obtained from reviewing the repeat mortgage transactions on single-family properties that have been securitized by Fannie Mae or Freddie Mac.
The HPI covers the entire 50 states, and also publishes for the nine Census Bureau Divisions, for Metropolitan Statistical Areas (MSA) and Divisions for more specific and detailed analysis.
How can the Housing Index numbers be used for analysis?
Housing Index is a widely used economic indicator by traders and investors. It gives a head check to the economic health of a country or region.
Generally, people buy houses through mortgages. When the Housing Price rises, it indicates that the market or citizens can pay for much higher rates. It indicates that the liquidity of the economy is good.
Secondly, people buy homes using mortgages most of the time, and it indicates the ease of obtaining a loan from banks at cheaper interest rates. It indicates that the bank has enough reserves to dish out mortgage loans at such low rates. It ultimately means the economy has an actively circulating wealth in the system.
Rising Housing Prices are accompanied by wage growth, employment in the construction industry, especially. It also stimulates confidence for the owners of Houses to know that they have a high-value asset with them that generally translates to increased consumer spending. Overall the total demand increases, boosting the economy and resulting in a higher GDP print.
When the Housing Prices fall, it indicates that consumers are less willing to purchase Houses as they are less confident about their future financial security. It can also indicate that banks are also lending at higher interest rates that are not affordable by middle and lower-middle-class families. The Housing Sector slowing down is a reflection of the economy in this sense. Slowdown accompanied by Mortgage defaults can be warning signs for investors, and traders about an oncoming slowdown or recession.
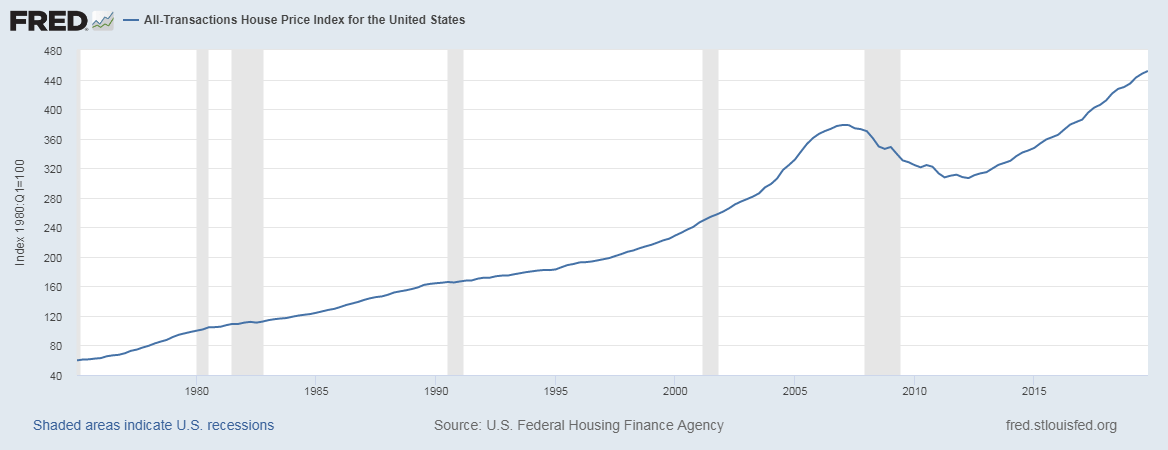
The below graph confirms our analysis as the housing prices fall during recession periods. As it can be seen that the Housing Index is not market sensitive and does not fluctuate to temporary shocks and instead, it has a trend that builds up over a time frame of certain months or years. Hence, it is a better tool for long term trends than a short-term trend.
Impact on Currency
The Housing Price Index is a coincident and lagging indicator in the short run, as it is a consequence of what has already happened in the economy. When the citizens feel confident about their financial security sufficiently, then only would they take a step to purchase a house. Hence, the Housing Price Index is a confirmation of a trend that would have been predicted by the leading economic indicators.
But for investors and traders who are looking for long term trends, the Housing Price Index acts as an efficient tool to assess current market prices and use it to predict the trend.
Potential shifts in the Housing Price Index can move the stock markets. The currency market movement depends on the strength of the economy.
When compared with indicators like Building Permits and Housing Starts, it relates to as a coincident indicator. In the long run, it can be used as a leading indicator to spot the trend that has already begun.
It is a proportional indicator, meaning when the Housing Price Index rises, it has a ripple effect through jobs, wages, and other industries related, and hence increased economic activity translates to higher GDP prints and appreciating currency.
Economic Reports
The Housing Price Index (HPI) is released by the Federal Housing Finance Agency (FHFA). It gets data from Fannie Mae and Freddie Mac, which are Government Sponsored Enterprises (GSE).
It releases monthly and quarterly reports for HPI on its official website. The dates for the subsequent year are already announced and are typically released at 9:00 AM on the specified date.
Many other agencies provide Housing Indices, one such popular one is the S&P’s Case-Shiller Index, which uses a slightly different approach in measuring the Housing Prices.
Sources of Housing Index
The Housing Price Index from FHFA is available here
All the current and previous reports are available here
We can find the different Housing Indices on the St. Louis FRED website here
We can find Housing statistics for various countries in the statistical form here
Impact of the ‘Housing Index’ news release on the Forex Market
In the previous section, we discussed the House Price Index (HPI) economic indicator, which essentially is a measure of the single-family house prices movement, with mortgages backed by government-sponsored enterprises. This report helps to analyze the strength of the country’s housing market and the economy as a whole. The house price index contributes only a small portion of the GDP of the country. Thus investors do not give much importance to the news release.

In today’s example, we will be exploring the impact of the announcement of the U.S. House Price Index on different currency pairs and witness the change in volatility. A higher than expected number is considered to be positive for the currency, while a lower than expected reading is taken negatively. This report is published by the Federal Housing Finance Agency. The above image shows an increase in the value of the House Price Index from the previous month, which should be positive for the currency. Let us see how the market reacts to this data.
![]()
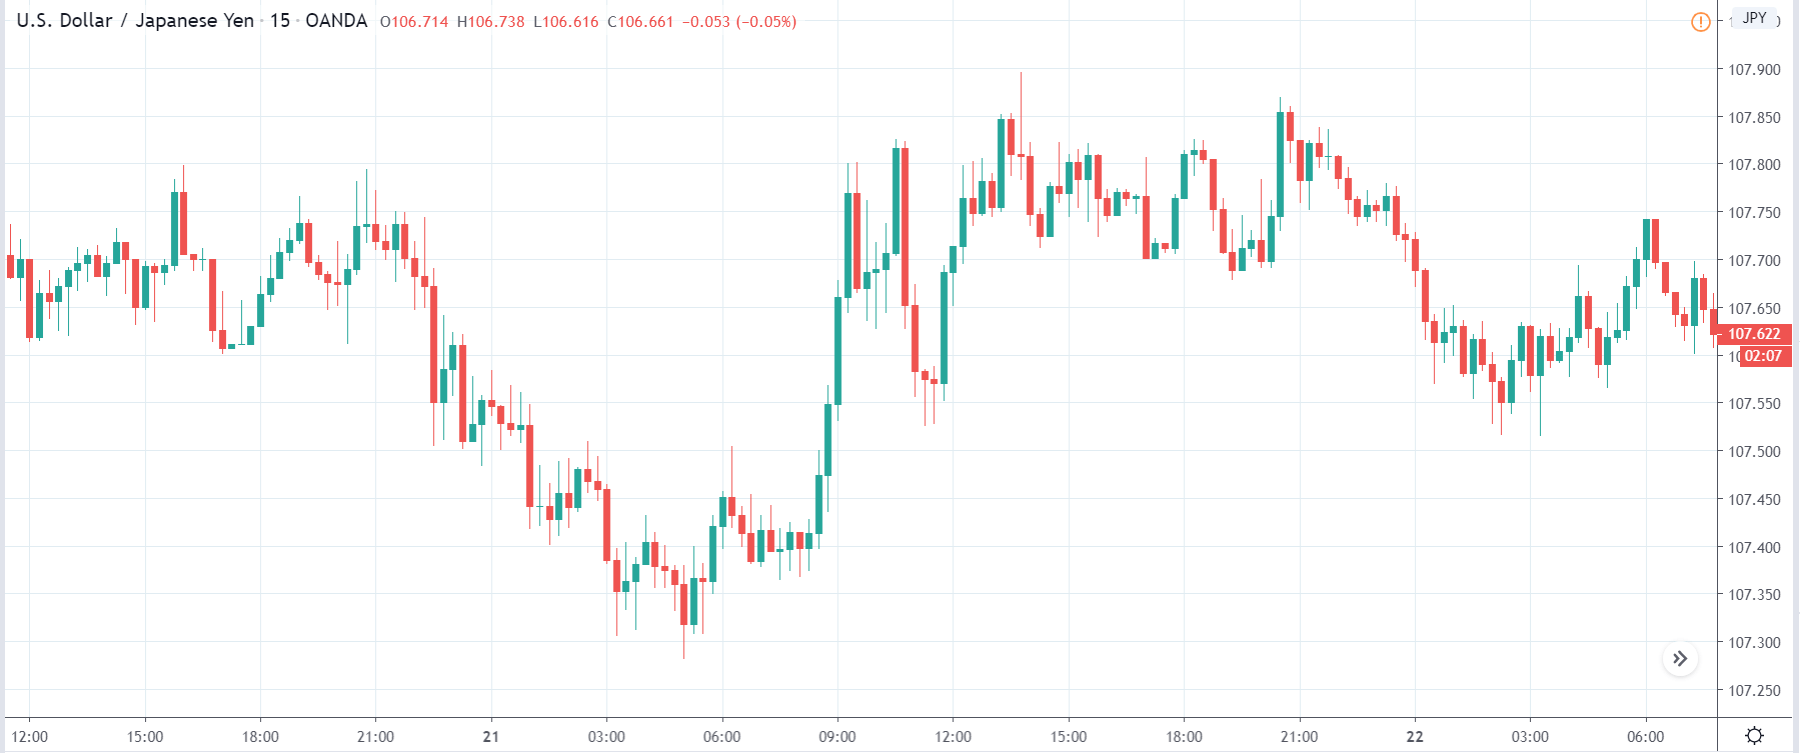
USD/JPY | Before the announcement:
Let’s begin with the USD/JPY currency pair and try to analyze the impact on the pair. As we can see in the above chart, the price is an overall uptrend and recently has retraced to a ‘demand’ area. Looking at the price, we can say that the price might move higher and continue the uptrend, but we need to wait and see if the news announcement causes major changes to the dynamics of the chart.
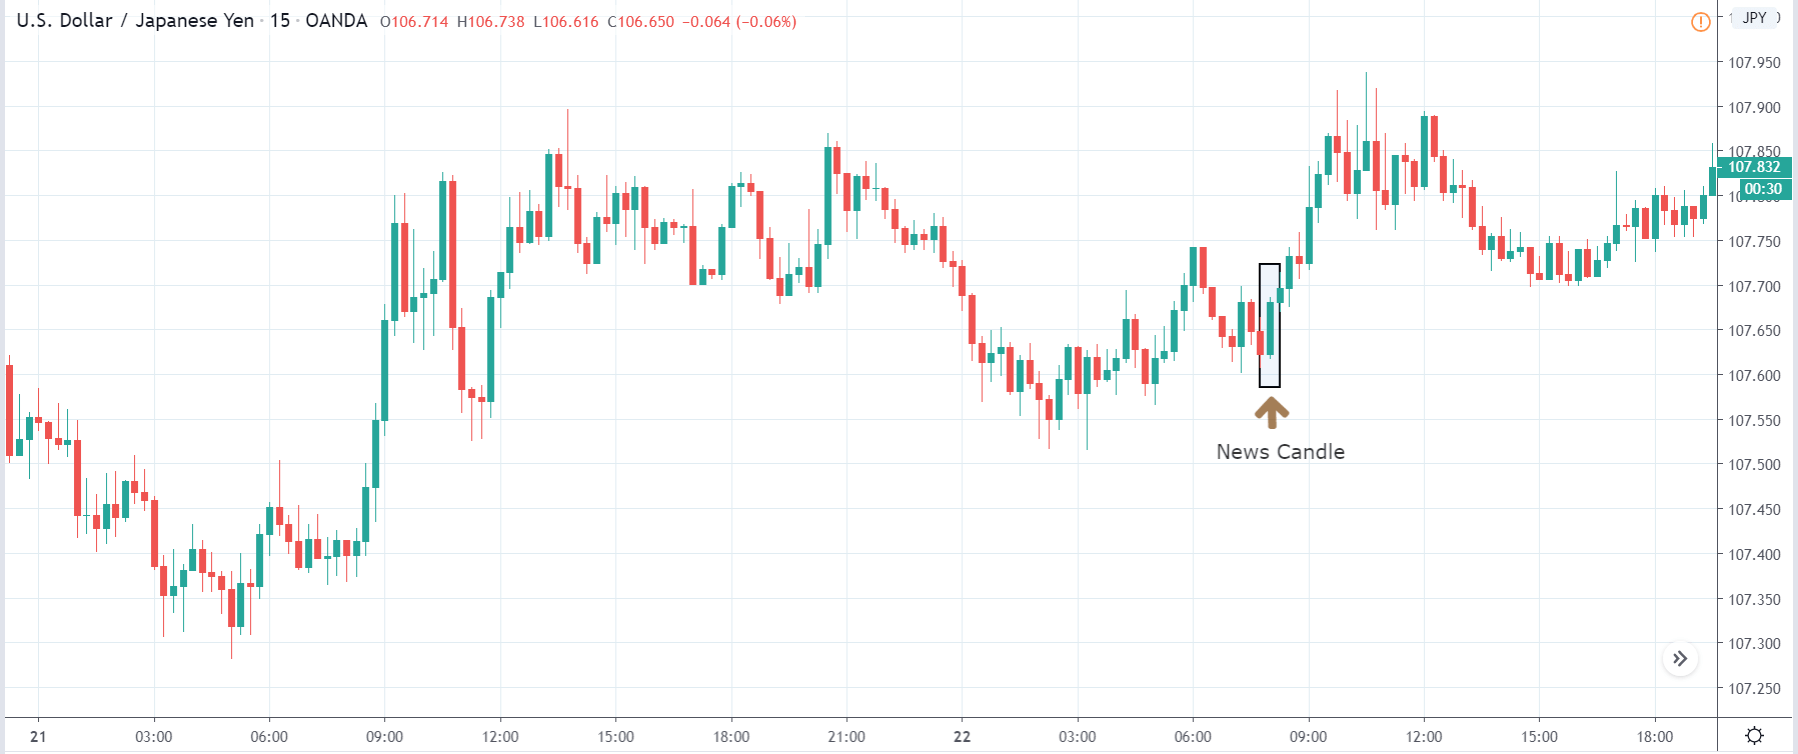
USD/JPY | After the announcement:
After the news announcement, the price sharply moves higher, and we see a bullish ‘news candle,’ indicating that the House Price Index data was positive for the economy. The volatility, which was quite less before the news release, suddenly increases to the upside after the release. This was a result of the increase in the House Price Index by 0.2% for the current month, which made traders go ‘long’ in the U.S. dollar. This is a confirmation sign that the market will further move up.
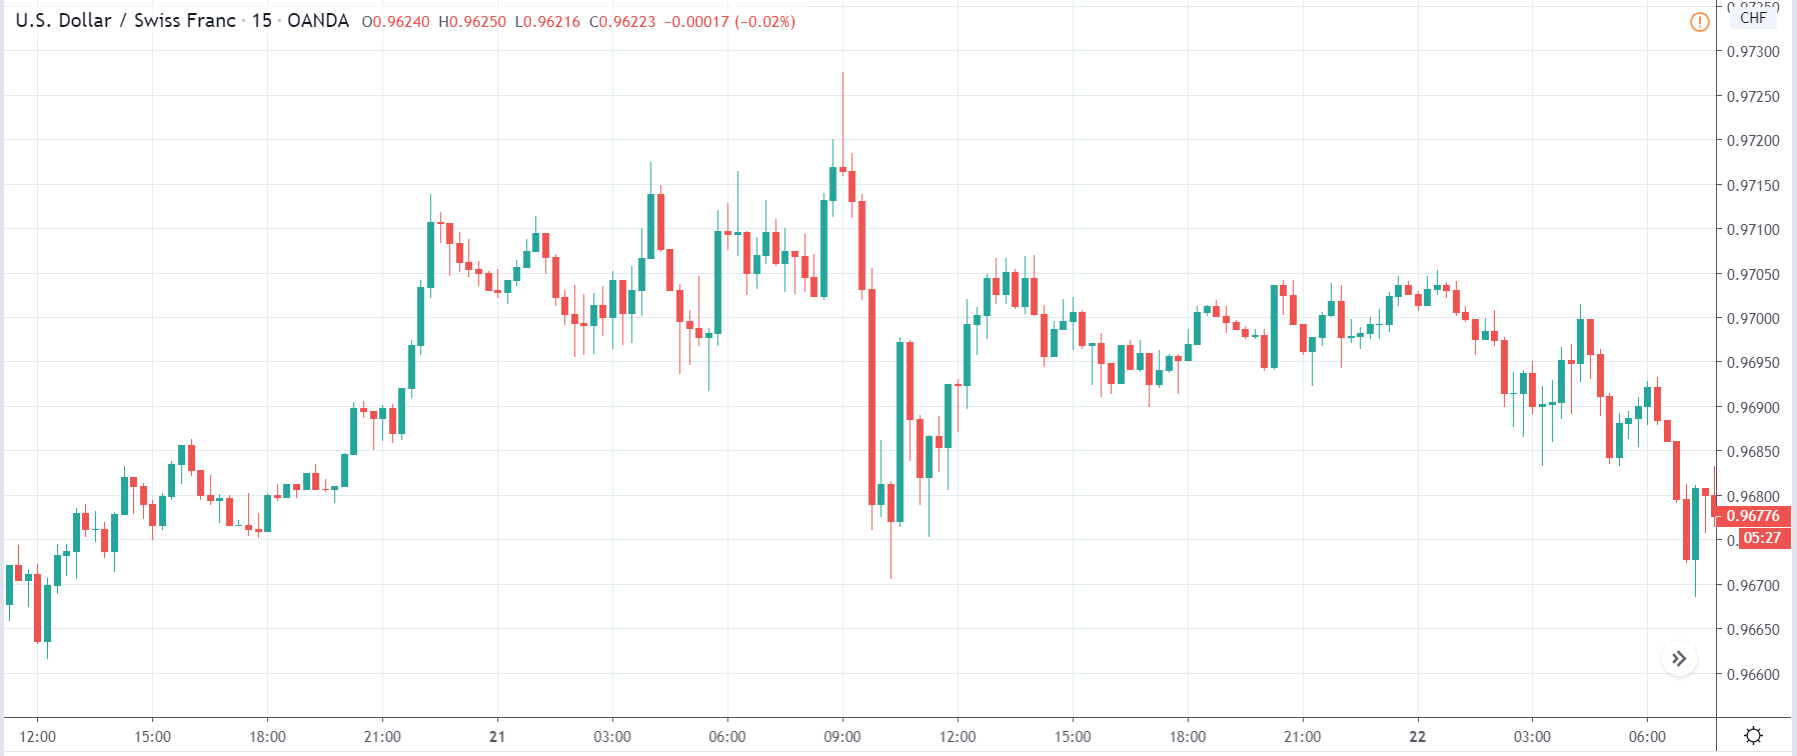
USD/CHF | Before the announcement:
USD/CHF | After the announcement:
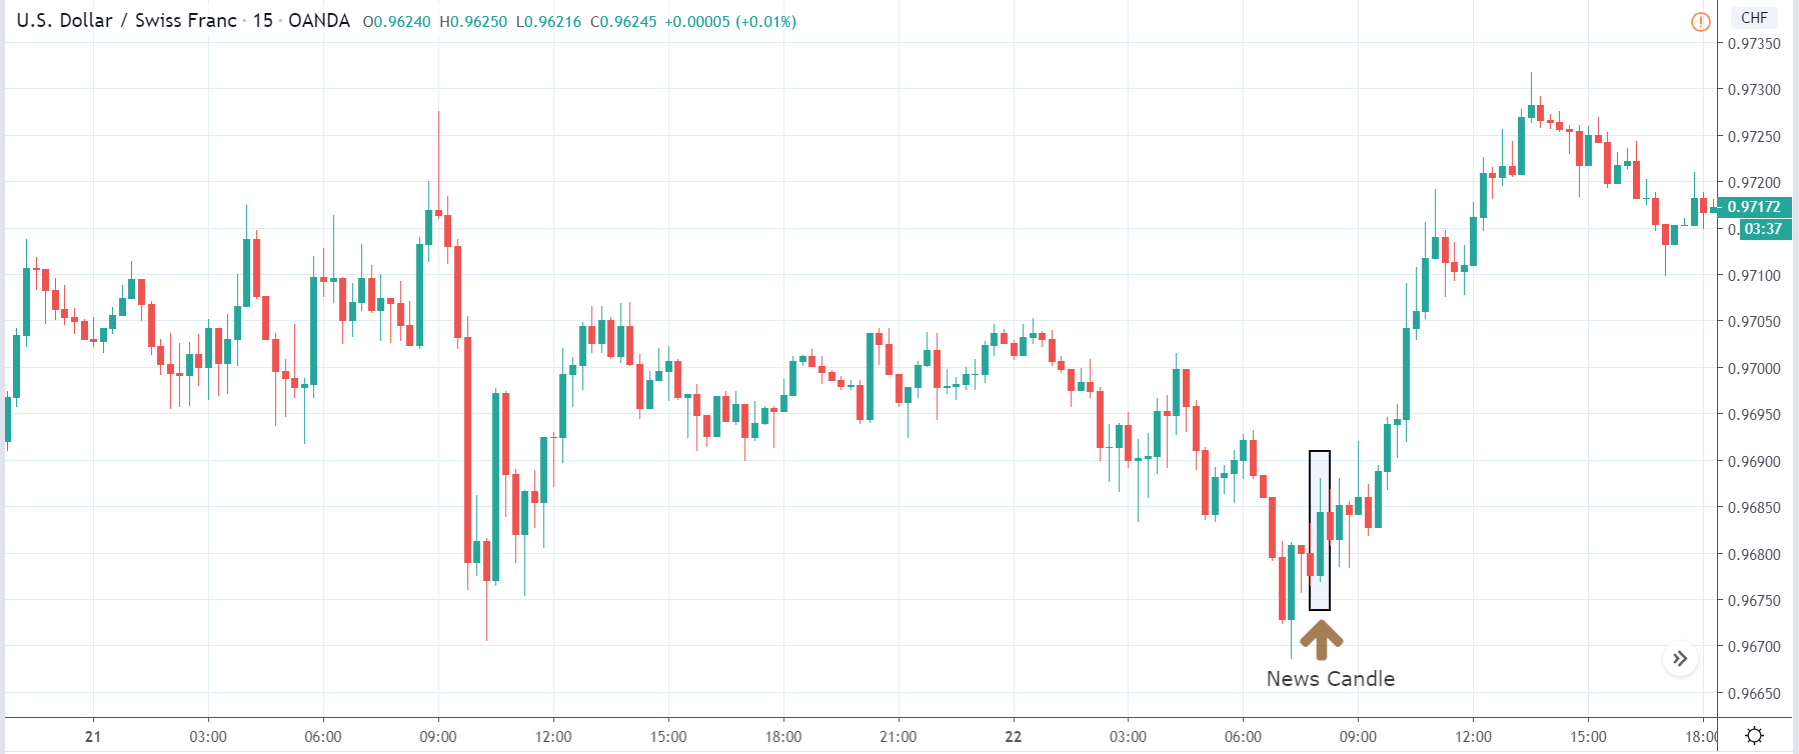
The above images represent the USD/CHF currency pair where we that before the news announcement, the market is in a downtrend, and currently the price is at the lowest point. This means the U.S. dollar is showing weakness in this pair, or Swiss Franc is strong. When the price is strongly moving lower, it is not recommended to have any ‘buy’ positions as it could be very risky. Thus, it is better to wait for the news release and gain some clarity about the data. Based on the data, we can take a position in the market. After the news announcement, there is a sharp rise in the price and a spike in volatility to the upside. This again came from the fact that the House Price Index news data was better than last time, which brought cheer in the market and made investors buy more U.S. dollars. The bullish ‘news candle’ is a sign of trend reversal that could be extended further.
GBP/USD | Before the announcement:
GBP/USD | After the announcement:
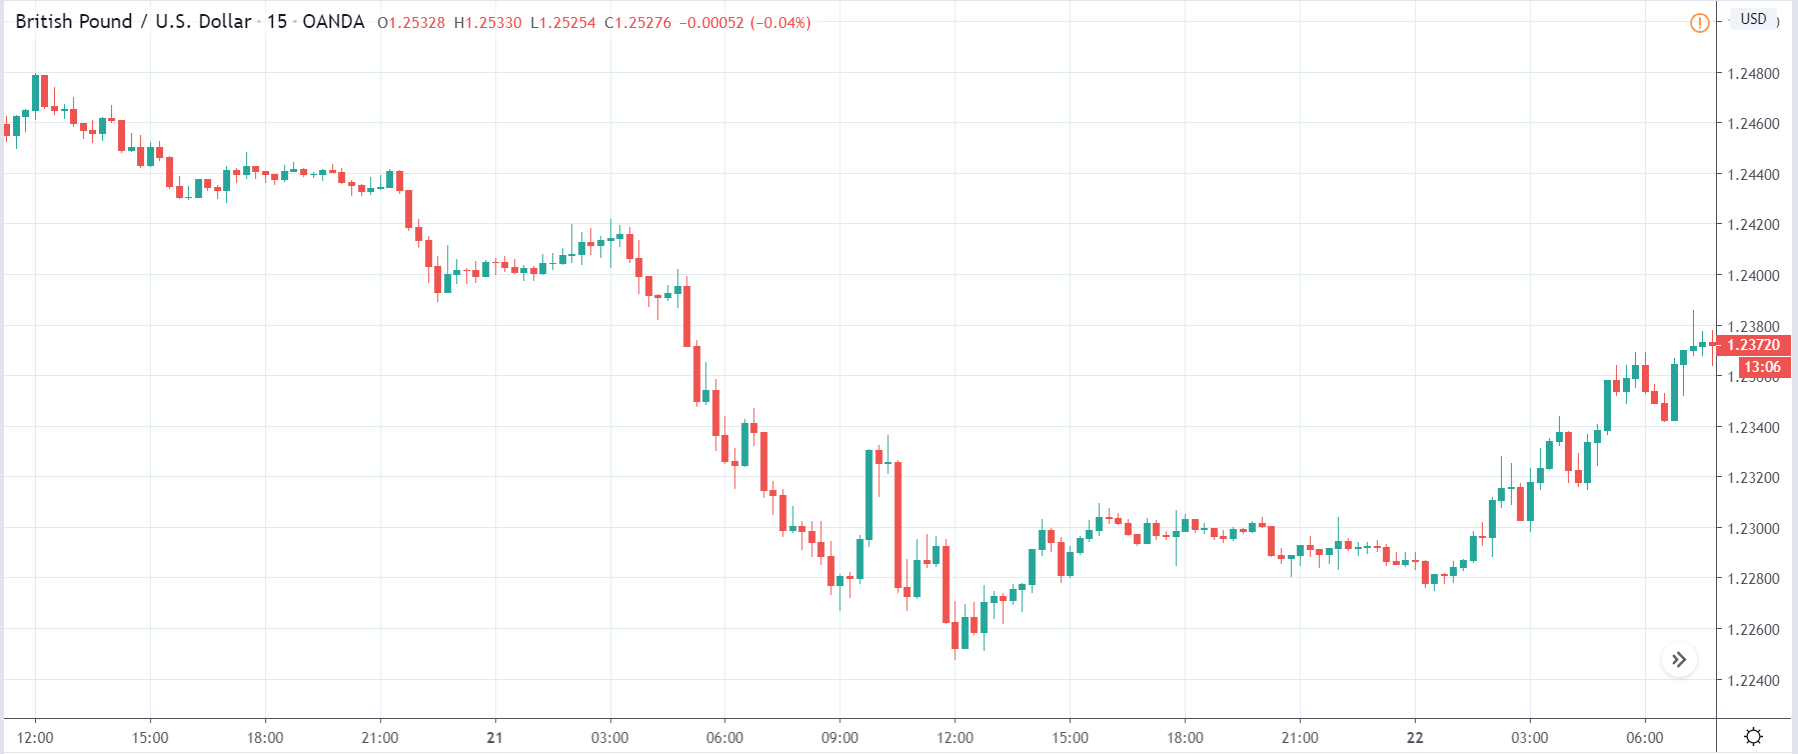
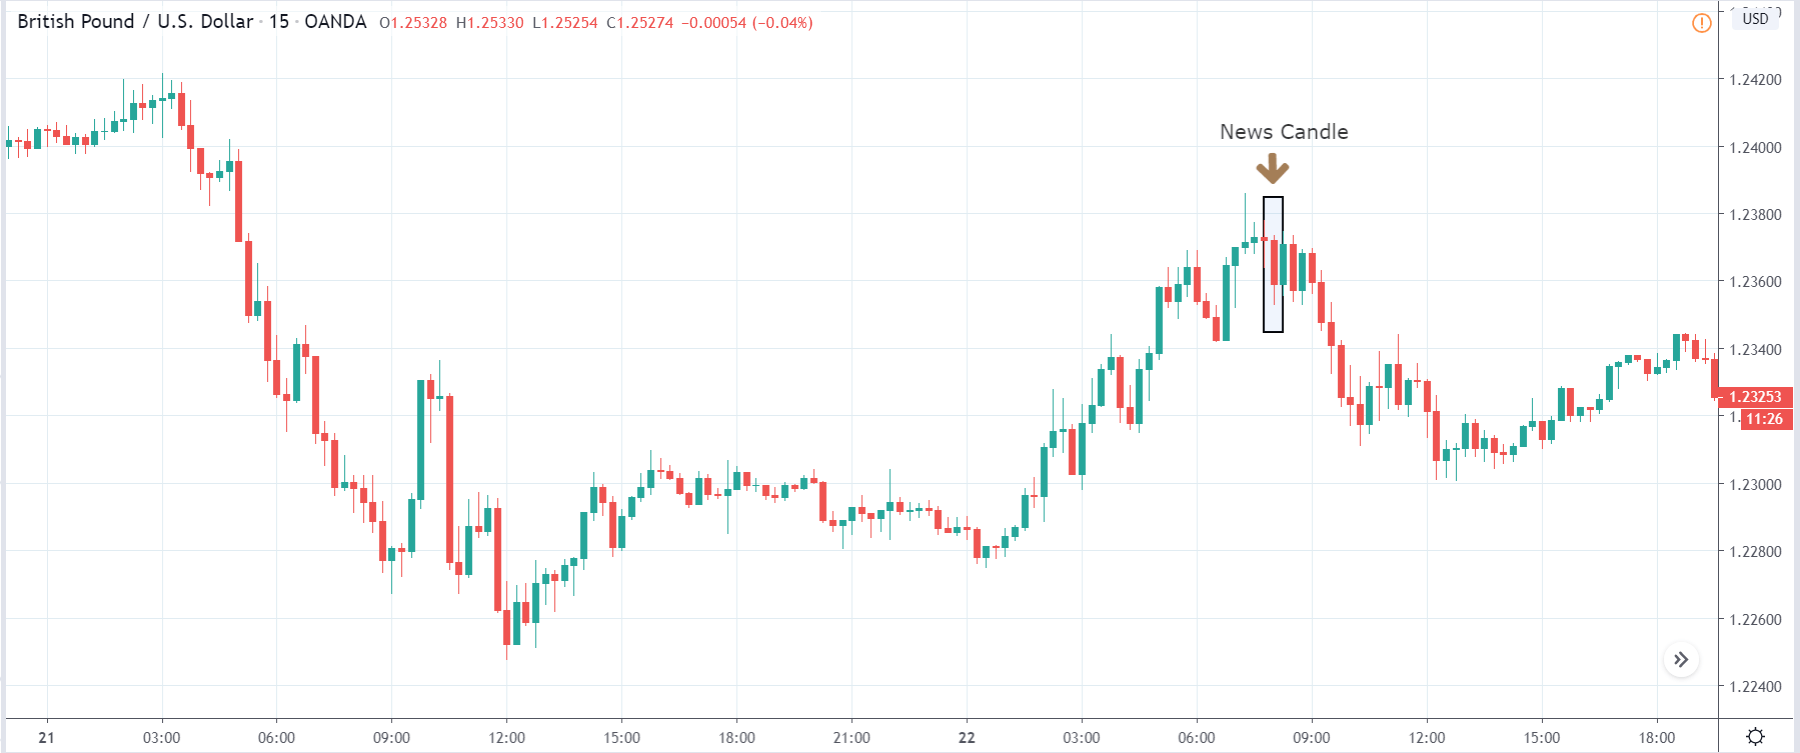
The above images are that of the GBP/USD currency pair, where we see that the overall trend of the market is down, and recently the price has pulled back from its ‘lows.’ Here, since the U.S. dollar is on the right-hand side of the pair, a down-trending implies strength in the U.S. dollar. We will be looking to trade this pair after we see some trend continuation patterns in the market, indicating that the downtrend will continue. After the news announcement, the price falls by a good amount, and the volatility increases to the downside. The bearish ‘news candle’ signifies that the House Price Index news was positive for the economy that took the price lower and increased the selling pressure.
That’s about the ‘Housing Index’ and its impact on the Forex market after its news release. If you have any questions, please let us know in the comments below. Good luck!


