Categories
Forex Course

110 – The Key Rules in the Elliot Wave Theory

Introduction

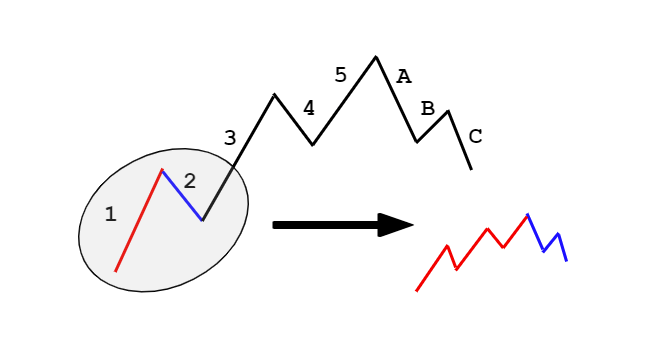
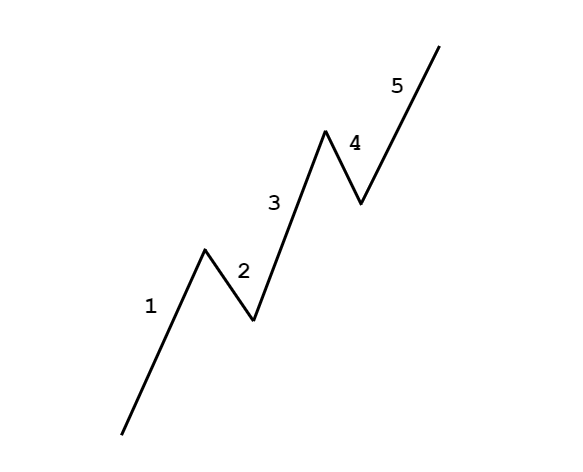
The Elliot Wave theory is a subjective topic. The key to trading Elliot waves is to find and comprehend the waves correctly. By understanding the wave theory correctly, we will be able to figure out which side of the market we have to be on. For doing so, there are a few rules we can lay on the Elliot waves while confirming the legitimacy of a wave. They are based on waves in the 5-3 wave pattern. And most importantly, these rules must never be broken.

The Three Golden Rules of Elliot Wave Theory

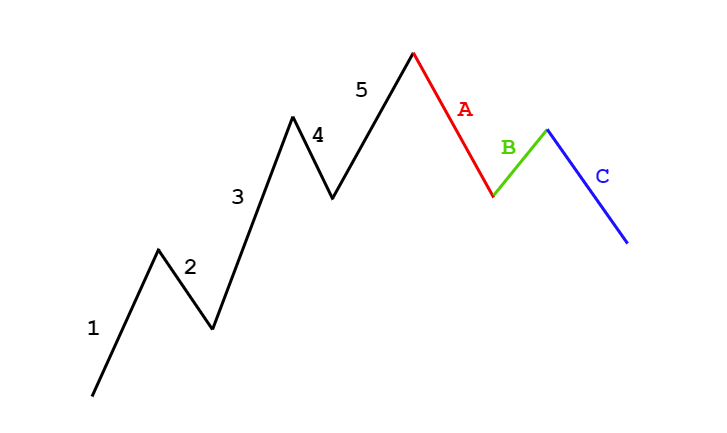
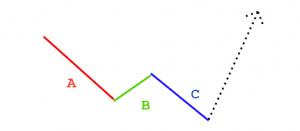
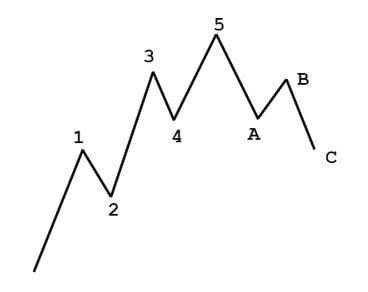
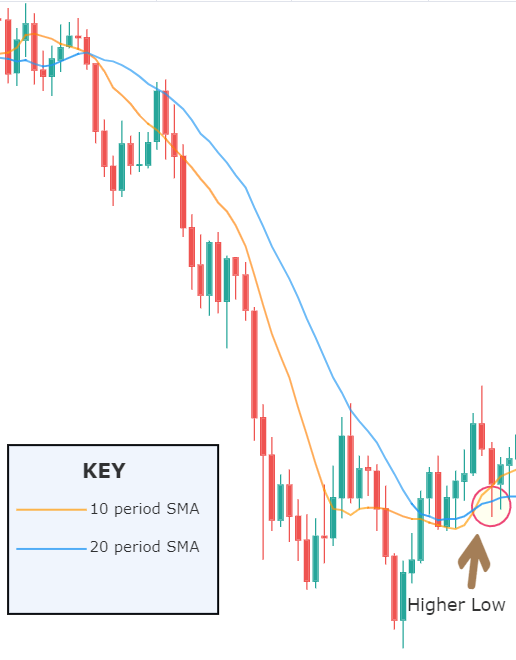
Rule 1: Wave 2 must be above wave 1

Wave 1 is the impulse wave, which is towards the trend, while wave 2 is a smaller corrective wave against the trend. So, to hold the definition of an uptrend, the second wave must never go below the first wave. In other terms, there should be a higher low in the price.

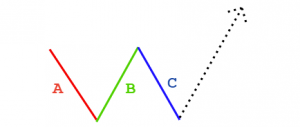
Rule 2: Wave 3 must never be the shortest impulse wave

Wave 3 is the second push towards the overall trend. This wave represents the move where all big players buy into the market. Hence, this wave is the strongest and the longest. According to the rule, the wave 3 can be shorter than either wave 1 or wave 5, but not BOTH.

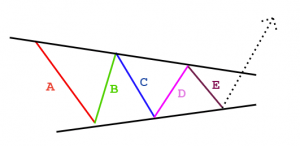
Rule 3: The Wave 4 must stay above the wave 1

Wave 4 is the second corrective wave in the 5-wave pattern. And this wave should never cross below the area of wave 1. In technical terms, the low of Wave 4 must be higher than the high of Wave 1.

This sums up the rules that need to be mandatorily followed while trading the Elliot Waves. So, even if one of the rules is not satisfied, then the Elliot wave pattern must be counted from the beginning, and the current must be discarded.

Guidelines for trading Elliot Waves

Now that you are clear about the rules, here are some guidelines for trading the Elliot waves. Note that these are guidelines and not rules. Hence, they are not a necessary condition to trade Elliot waves.

🌊 When Wave 5 is the longer impulse wave, then wave 5 can approximately be as lengthy wave 1.

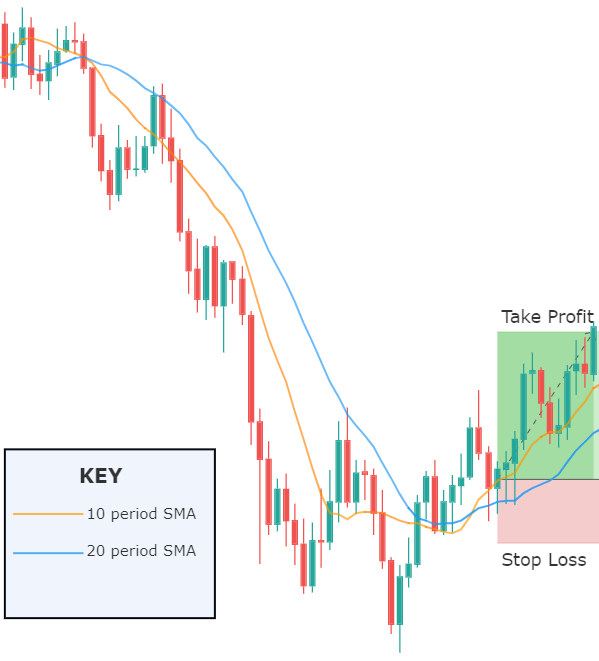
🌊 It is useful in targeting the end of Wave 5. Traders also determine the length of the Wave 1 and add it with the low of Wave 4 and use it as a possible target.

🌊 Wave 2 and Wave 4 will usually be different forms. For instance, if Wave 2 was a sharp correction, then Wave 4 will be a flat correction and vice versa. With this, chartists can determine the time of correction of Wave 4

🌊 After a strong Wave 5 impulse wave advance, the 3-wave ABC correction pattern could come down only until the low of Wave 4.

These are the guidelines traders must understand and interpret in their own meaningful way. With this, we have come to the stage where we can apply the concepts and trade the Forex market. So, stay tuned for the next lesson.

[wp_quiz id=”71849″]
Categories
Forex Course

109. Fractals – Elliot Waves within an Elliot Wave

Introduction

The 5-3 wave pattern is made up of the combination of 5-wave impulsive pattern and a 3-wave corrective pattern. The 5-wave pattern is inclined towards the predominant trend, while the 3-wave pattern is always against the trend. It is basically a pullback to the overall trend.

However, it does not end there. Within each wave in the impulsive and corrective waves, there is a set of other impulsive and corrective waves. And in that each smaller set of impulsive and corrective waves, there exists another miniature set of impulsive and corrective waves. This top-down approach goes on and on, forever.

The Top-down Approach

The Top-down approach can be considered as a synonym for fractals. In the Elliot wave theory, each wave is made of sub-waves and so on. In an uptrend, the 5-wave impulsive pattern faces upside. In these five waves, waves 1, 3, and 5 are towards the overall trend, while waves 2 and 4 against the trend.

In the same uptrend, the corrective wave pattern faces against the trend, where waves A and C face against the trend (downwards), and wave B faces towards the trend (upwards). In this sequence, there are five waves towards the overall trend (with two minor pullbacks) and three against the trend (with one minor pullback).

According to the fractal theory, each push up and push down has the above sequence. For instance, if we extract wave 1 and wave 2, then wave 1 will be made up of a 5-wave impulsive pattern, and wave 2 will be made up of a 3-wave corrective pattern. In conclusion, the combination of two waves (1 and 2) results in a set of 5-3 wave pattern. Refer to the below figure to get a clear understanding.

The Ordering and Labelling of Elliot Waves

We know that every wave can be broken into smaller waves and so on. But referring to these waves becomes the challenging part. So, to make simplify the labeling of these waves, Elliot has assigned a series of categories to the waves in terms of its size (from largest to the smallest).

Conclusion

We saw that every Elliot wave is made up of another miniature Elliot wave, and this break-down goes forever. But, according to Elliot, the degree identification is not a necessary factor in Elliot wave analysis. As a trader, our goal is not to assign the right degree to the wave pattern but to just understand the timeframe in which it is occurring. In the end, all that matters is the basic analysis of the wave theory. The identification of degree always remains secondary. Cheers.

[wp_quiz id=”71844″]
Categories
Forex Course

108. What Are Corrective Waves & How To Comprehend Them?

Introduction

In the last lesson, we discussed the impulsive waves and 5-wave pattern corresponding to it. A trend is made up of the combination of the 5-wave pattern and the 3-wave pattern. The 5-wave impulsive pattern moves along the original trend, while the 3-wave corrective pattern moves against the trend. In this lesson, we shall discuss the corrective wave and then interpret the 5-3 waves.

Corrective waves

In case of an uptrend, the impulsive waves are towards the upside, and the corrective waves are towards the downside. Continuing with the example mentioned in the previous lesson, the corrective waves are represented in the below figure.

In the above figure, waves a, b, and c represent the corrective waves. The overall trend of the market is up, but corrective waves are against it. In other terms, the 3-wave corrective wave can be considered as pullback for the uptrend.

Note: The 3-wave corrective wave is also referred to as the ABC corrective wave pattern.

Reverse Corrective Wave Pattern

The Elliot wave theory is applicable to both uptrend and downtrend. So, for a downtrend, the impulsive wave faces downwards following the overall trend, while the corrective wave faces upwards. Below is a figure representing the 5-3 wave pattern for a downtrend.

Types of Corrective Wave Patterns

The above illustrated corrective wave is not the only type of corrective wave that occurs. According to Elliot, there are twenty-one 3-wave corrective wave patterns, where some are simple and some complex. However, a trader need not memorize all of them at once. The following are three simple corrective waves that are most occurring in the market.

The Zig-Zag Formation

The zig-zag formations are very steep compared to the regular one and are against the predominant trend. In the three waves, typically, wave B is the shortest compared to wave A and wave C. Note that, the Zig-Zag pattern can happen twice or thrice. Also, the zig-zag patterns, like all other waves, can be broken into 5-wave patterns.

The Flat Formation

As the name suggests, in flat corrective wave patterns, the 3-wave pattern is in the sideways direction. That is, the wave C does not go below wave B, and wave B makes a high as much as wave A. Sometimes, the wave B goes higher than wave A which is acceptable as well.

The Triangle Formation

The Triangle formation is a little different from the other corrective patterns. The difference is that these patterns are made up of 5-waves that move against the overall trend. These corrective waves can be symmetrical, ascending, descending, or expanding.

These were some of the most used corrective patterns used by traders. These must be known to technical traders by default. In the next lesson, we shall discuss another important concept related to the Elliot Wave theory.

[wp_quiz id=”71613″]
Categories
Forex Course

107. Comprehending The Impulsive Waves In Elliot Wave Theory

Introduction

In the previous lesson, we got started with understanding the fundamentals of the Elliot Wave theory. An introduction to impulsive waves and corrective waves was also discussed. This lesson shall go over the concept of impulsive waves.

There are two types of waves in the Elliot theory, impulsive and corrective. And as a whole, Elliot stated that a trending markets move in 5-3 wave patterns. The 5-wave pattern corresponds to the impulsive wave, and a 3-wave pattern corresponds to the corrective wave. And the combination of the 5-wave and 3-wave patterns form a trend.

Formation of Impulsive Wave

The impulsive waves are formed by five waves numbered from 1 through 5. Wave numbers 1, 3, and 5 are motive, i.e., they are the waves that go along the overall trend, while wave numbers 2 and 4 are corrective waves that go against the overall trend. Below is a diagram that represents the 5-wave impulsive pattern.

This is the impulsive wave that is formed in all types of instruments. It claimed that this wave patterns form not only in stocks but on currencies, bonds, gold, oil, etc. as well. Now, let’s interpret each wave in the impulsive wave pattern.

🌊 Wave 1 – This is the first up move in the market. This is typically caused by a handful number of people who think that the currency is at a discounted rate and is the right time to buy.

🌊 Wave 2 – This move is against the previous move. There is a dip in the market as the initial buyers are booking profits, thinking it is now overvalued. However, it does not go down until the previous lows because it is also considered to be at a discount for other traders.

🌊 Wave 3 – Wave 3 resembles the wave 1. This wave is usually the longest and the strongest in terms of momentum. This is because, as the price goes higher and higher, the mass public begins to buy along with the institutional players. Hence, it is stronger than wave 1.

🌊 Wave 4 – After a strong up move (wave 3), some traders start to book profit, assuming the security has become expensive. However, this down-move is not quite strong because there are traders who still believe in the bullishness and hence see this as a discounted price.

🌊 Wave 5 – Wave 5 is when most people start to buy security. This is solely due to panic and is considered to a rat trap. Wave 5 is when the security has reached the news. All traders and investors on the news channels advice the public to buy.

But, in reality, this is when the security is considered to be overpriced. The big investors and institutions begin to short and square off their positions. And the liquidity for it is provided by the mass public.

All these waves together form the 5-wave impulsive pattern. We hope you were able to comprehend this concept of impulsive waves. If not, shoot your questions in the comment section below, and don’t forget to take the below quiz.

[wp_quiz id=”71436″]
Categories
Forex Course

106. Introduction to Elliot Wave Theory

Introduction

Elliot Wave Theory is one of the most popular strategies applied by traders. This theory works exceptionally well if read correctly. In the early 1930s, there was this professional accountant named Ralph Nelson Elliot. He was a stock market expert who analyzed the data of stocks closely for 75 years’ timeframe. He thought that markets move in random chaotic directions but later realized that they don’t. After years of analysis and research, he published a book titled The Wave Principle. This book explained in detail about the theory he had proposed.

Elliot Wave Theory

According to Elliot, the market moves in repetitive cycles. The cause for these cycles is the emotions of mass retail investors, primarily due to psychological factors. It was seen that the upward and downward swings in prices caused by the collective psychology of traders always showed a repetition in the same manner. These swings were referred to as ‘waves.’

So, if traders have a clear understanding of these repetitive cycles, one can predict future price movements. In fact, traders can identify points precisely where the market is going to reverse.

Basic Terminologies

There quite a lot of terms involved in the Elliot Wave Theory. For now, we shall the two most fundamental terms and understand others in the later lessons.

Wave

Elliot proposed that trends are formed as a result of the psychology of investors. He proved that swings formed by this mass psychology were a recurring pattern. And these swings were termed as waves. Elliot’s theory, to an extent, resembles the Dow theory, which also mentions that prices move in ‘waves.’

Fractals

Generally speaking, fractals are structuring whose split parts are like a similar copy of the whole. These structures repeat themselves even on an infinite scale. Apart from individual stocks, Elliot discovered that stock indices showed the same recurring structures. So, he moved to the futures market to analyze if the theory worked there as well.

Predicting the Market with Elliot Waves

Elliot studied the stocks in detail and concluded that predictions could be made using the characteristics of wave patterns. It is known that for a trending market, there is a pullback or correction for it. It is usually said that “what goes up, must come down.” That is, price action is divided into trends and corrections. Trends represent the main direction of the market, while corrections are against the trend.

The Elliot wave theory also uses a similar principle. There is an Impulsive wave that moves in the same directions as the larger/main trend. It always shows five waves in its pattern. Then there is a corrective wave that travels in the opposite direction of the larger trend. On a smaller scale, under each impulsive wave, five other waves can be found again. And such a pattern repeats by going into smaller and smaller scales.

Wondering what the above figure represents? To interpret it, stay tuned for the next lesson.

[wp_quiz id=”71282″]
Categories
Forex Course

105. Summary of Leading and Lagging Indicators

Introduction

In the previous lessons, we have understood what leading, and lagging indicators are. We also saw how these indicators could be further divided into other types. Here’s a summary of everything we’ve learned so far in this space.

Leading Indicators

Leading indicators are those who forecast prices in the market using historical prices. It indicates a signal for the continuation or reversal of a trend the event occurs. However, these indicators do not work with complete certainty. As they are making a prediction, it is more probability driven.

Lagging Indicators

Lagging indicators, as the name suggests, are lagging in nature. These indicators confirm the market trend using past prices. They are called the trend-following indicators as they give an indication once the trend has been established in the price charts. However, these confirmatory indicators are more reliable than the leading indicators as they give more accurate signals though they are late in doing so.

Please refer to this article to know the differences between these two types of indicators.

In the industry, there are three types of indicators that are widely used. They are

  • Oscillators
  • Trend-following indicators
  • Momentum indicators

If we were to put them into the bag of leading or lagging indicators, Oscillators are leading, trend-following indicators and momentum indicators are lagging. Note that an indicator may not be under one of the types; they can be a combination of two or all three.

Oscillators

An oscillator is a leading indicator that moves within a predefined range. These are to our interest when it crosses above or below the specified bound. These areas determine the oversold and overbought conditions in the market. These indicators are very helpful in determining market reversal. Some of the most popular oscillators include MACD, ROC, RSI, CCI, etc. The usage and interpretation of oscillators have been discussed in detail in this article.

Trend-Following Indicators

Trend-following indicators are lagging indicators that are usually constructed with a variety of moving averages. Crossovers are the typical strategy used with these indicators. These indicators give a signal to buy or sell when the market has already begun its move. Hence, these indicators give us late entries but are more convincing than leading indicators. For example, Moving Averages and MACD are the most used trend-following indicators.

Momentum Indicators

As the name clearly indicates, these indicators show the speed or the rate of price change in the market. Since the momentum can be calculated after the price moves, it is considered a lagging indicator. These indicators indicate when there is a slowdown in the buyers or sellers. And with this, we can assume for a possible reversal. More about this can be found here.

Conclusion

This sums up the concept of leading and lagging indicators. Having an understanding of these indicators is necessary because it is risky if a lagging indicator is analyzed as a leading indicator and vice versa. Also, it is recommended to use these indicators in conjunction with each other for better results. In the upcoming course lessons, we will be discussing interesting topics related to Elliot Wave Theory.

Categories
Forex Course

104. Understanding the Essence of the Momentum (Using MACD Indicator)

Introduction

Momentum indicators are those indicators that determine the rate of price changes in the market. These indicators are helpful in determining the change in the market trend. In this lesson, we shall be talking about the MACD indicator, which is one of the most extensively used momentum indicators.

Moving Average Convergence Divergence – MACD

Moving Average Convergence Divergence – MACD is a momentum indicator that primarily works on the relationship between two moving averages of an instrument’s price. Precisely, it takes Exponential Moving Average into consideration for its calculation.

A misconception in the industry is that MACD is a lagging indicator. There are a set of people considering it as a leading indicator, while some see it as a lagging indicator and use it as a confirmatory tool. Note that MACD is both leading as well as lagging indicators.

MACD is said to be a leading indicator when it is used to identify oversold and overbought conditions. It indicates the possibility of a reversal when the market is actually moving in the other direction. However, this form is not widely used. On the other hand, it is said to be a lagging indicator if it is used for crossovers. One will be aware of the market trend when there is a crossover on the indictor. But when this happens, the market would have already made its move.

Also, that’s not it. The real element of momentum is added by the histogram. This true aspect of MACD reveals the difference between the MACD line and the EMA. When the histogram is positive, i.e., above the zero-midpoint line but is declining towards the midline, then it indicates a weakening uptrend. On the contrary, if the histogram is below the zero-midpoint line, but is climbing towards it, then it signifies a slowing downtrend.

Apart from this, it is also used for identifying divergence in the market. That is, indicates when there is abnormal motion in the market, hence, indicating a possible change in direction.

What is the MACD indicator composed of?

The MACD is made up of two moving averages. One of them is referred to as the MACD line, which is derived by finding the difference between the 26-day EMA and the 12-day EMA. The other is the signal line, which is typically a 9-day EMA. And there is a zero-midpoint line where the histogram is placed.

MACD as a Momentum Indicator

To understand how momentum works in MACD, consider the example given below.

Firstly, the market is in a downtrend where the purple line represents the Support & Resistance level. In other terms, this line indicates a potential sell area. Below the price chart, the MACD indicator has plotted as well. Observing closely at the histogram at the marked arrow, it is seen that the histogram was falling towards the zero-midpoint line indicating the weakness of the buyers. Also, this situation happened in the area where the sellers are willing to hit the sell. In hindsight, the MACD gave the right signal solely from the histogram.

This hence concludes the lesson on momentum indicators. We hope you found this lesson very informative. If you have questions, leave us a comment below.

[wp_quiz id=”71030″]
Categories
Forex Course

103. Analyzing The Power Of Oscillators

Introduction

In the previous lesson, we had an introduction to oscillator indicators and understood how they work. In this lesson, we shall put that into action by analyzing some of the most used oscillators.

Quick Revision

In general, Oscillator is any object that moves back and forth between two points. In simple terms, anything that moves between two points, 1&2, is said to be an oscillator.

The concept remains the same for trading as well. An oscillator is an indicator which moves within two bounds in a range. When trading using oscillators, our eye catches interest when it is around the peaks and troughs. These areas generate buy and sell signals. Precisely, it indicates the end of a trend or the beginning of a new trend.

Trading Oscillators

Stochastic, Relative Strength Index, and Parabolic SAR are the extensively used oscillators by traders.

All these indicators work under the premise that the rate of price change begins to slow; that is, the number of buyers or sellers have reduced at the current trading price. And this change in the momentum indicates a possible trend reversal because the other party is losing its gas. Such indications are given when the oscillators are at the overbought or oversold regions.

Stochastic Indicator

The stochastic indicator is an oscillator whose upper and lower bounds are 80 and 20, respectively. So, if the line moves 80, it enters into the overbought region, and if it drops below 20, it is said to be in the oversold region.

Calculating stochastic variables

There are two line on the stochastic oscillator, namely, %K and %D. Both the values are calculated as follows:

%K = 100 x (Price – L) / (H – L)

%D = (K1 + K2 + K3) / 3

Where, in %K, H and L represent the Low and High for the specified period. And %D represents the average of the most three recent values of the %K.

Note: In the given example, the period is chosen as 14 (last 14 days/candles).

RSI Indicator

The Relative Strength Index (RSI) is a momentum oscillator that measures the rate of change of price and the magnitude of directional price movements. The RSI calculates the momentum as the ratio of higher close values and lower close values for a specified period. As it is an oscillator, it oscillates between the bounds 30 and 70. The interpretation for it is the same as that of other oscillators.

Interpretation Example

To illustrate the use of the oscillators, consider the given chart of USD/CAD on the 1D timeframe. To the price chart, the stochastic and the RSI oscillator has been applied.

At the vertical red lines, it can be seen that the market was overbought according to both the oscillators. This is an indication that the market which was in an uptrend priorly is not losing strength. Hence, in hindsight, the market falls as the oscillators start to make their way back into the range.

Bottom Line

Oscillators are great leading indicators that help in determining oversold and overbought conditions. It also gives traders an indication of the possibility of a market reversal. From the above example, it is seen that these indicators work like a charm. However, one must note that oscillators work in your favor, but not always. Sometimes, one oscillator indicates a buy while the other does not. These are the times when traders must avoid trading such instruments. As shown, oscillators must be used with other oscillators or technical tools to achieve the best out of it.

[wp_quiz id=”70760″]
Categories
Forex Course

102. Brief Introduction To Momentum Indicators

Introduction

Leading and lagging indicators are not the only categorizations of technical indicators. If we dig deeper, we can find more classifications and momentum indicators are one such classification in leading indicators. Before getting into momentum indicators, let’s first define the term momentum. Momentum, in general (physics), is the product of mass and velocity. The meaning of momentum is not different in trading too.

What are the Momentum Indicators?

Momentum indicators are a type of indicator that determines the velocity or the rate at which the price changes in security. Unlike moving averages, they don’t depict the direction of the market, only the rate of price change in any timeframe.

Calculating Momentum

The formula for the momentum indicators compares the most recent close price with the close price of a user-specified time frame. These indicators are displayed as a separate line and not on the price line or bar. Calculating momentum is simple. There are two variations to it but are quite similar. In both, momentum is obtained by the comparison between the latest closing price and a closing price ‘n’ periods from the past. The ‘n’ value must be set by the user.

1) Momentum = Current close price – ‘n’ period close price

2) Momentum = (Current close price / ‘n’ period close price) x 100

The first formula simply takes the difference between the closing prices while the second version calculates the rate of change in price and is expressed as a percentage.

When the market is moving upside or downside, the momentum indicator determines how strongly the move is happening. A positive number in the first version determines strength in the market towards the upside, while a negative number signifies bearish strength.

How are Momentum Indicators useful?

As mentioned, momentum indicators show/predict the strength of the movement in prices, regardless of the direction, be it up or down. Reversals are trades where one can make a massive killing with it. And momentum indicators help traders find spots where there is a possibility of the market to reverse. This is determined using a concept called divergence, which is discussed in the subsequent section.

Momentum indicators are specifically designed to show the relative strength of the buyers and sellers. If these indicators are combined with indicators that determine the direction of the market, it could turn out to be a complete strategy.

Concept of Divergence

Consider the chart of EUR/USD given below. The MACD indicator (momentum indicator) is plotted as well. From the price chart, the market was in a downtrend, but the divergence was moving upward. It means that the indicator has diverged from the price chart and is indicating that the sellers are losing strength.

In hindsight, the market reversed its direction and started to move upwards. Hence, the MACD predicted the reversal in the market. Moving forward, when the market laid its first higher low, the MACD too was inclined upwards, indicating that the buyers are strong, and the uptrend is real. And yet again, the MACD proved itself right.

This concludes the lesson on momentum indicators. In the coming lessons, let’s get more insights over this topic. Don’t forget to take the below quiz before you go.

[wp_quiz id=”70612″]
Categories
Forex Course

101. What Are Oscillators & How To Interpret Them?

Introduction

Technical Indicators are primarily used to confirm a price movement and the quality of a candlestick pattern, and also to create trading signals with them. Indicators are a great source of strength to confirm an existing analysis. Moreover, some indicators solely help in analyzing the trend, momentum, and volatility of the market.

As discussed previously discussed, there are two types of indicators, leading and lagging. And oscillators fall under the leading indicators. That is, they determine the trend of the market before-hand.

Indicator construction

There are two ways through which indicators are designed:

  1. Non-bounded
  2. Oscillators

Non-bounded, as the name suggests, they are the indicators that are not bound in a specific range. They usually display the strength and weaknesses, and to an extent, generates buy and sell signals.

Oscillators, on the other hand, are indicators that are bound within a range. For example, 0-100 is the range they oscillate between. However, based on the type of oscillator, the range varies.

Oscillators

Oscillators are technical indicators that are mainly used to determine the oversold and overbought conditions. These non-trending indicators are used when the market is not showing any certain trend in either direction. They are unlike the moving averages (MA), which determine the trend and overall direction of the market.

When security is under an overbought or oversold situation, the oscillators show its real value. It indicates that one of the parties is losing its strength, and the other is slowly starting to gain together.

Interpreting Oscillators

Oscillators are constructed with lower and upper bounds. And these bounds form a range. In the below oscillator, the purple region represents range-bound, where 30 is the lower bound, and 70 is the upper bound. The upper and lower bounds are also referred to as peaks and troughs. Typically, the peaks and troughs in the oscillator correspond to the peaks and troughs in the market as well.

Extreme Regions

The oversold and overbought regions are the extreme regions. That is, when the oscillator line shoots above the upper bound, the market is considered to be overbought. On the contrary, if the oscillator falls beneath the lower bound, the market is said to be overbought.

An overbought market means that the buying volume has diminished over a few trading days. So, there could be a possibility for investors to sell their positions. However, note that this interpretation holds true when the market was in a predominant uptrend and is currently consolidating.

An oversold market indicates that the selling volume, which was high in the past days, has now diminished. This could mean that the sellers are done selling with the security and might begin closing their positions. Hence, indicating a turn-around in the market.

Midpoint Line

A crossover at midpoint region of the range depicts the gain in strength of the buyer or sellers. From the oscillator given, 50 is the midpoint line. So, if the oscillators cross above the 50 mark, it indicates bullishness in the market. And if cuts below 50, it could indicate bearishness in the market.

This concludes the lesson oscillators. In the coming lessons, we shall discuss some strategies using a few oscillators. Stay tuned. Happy trading!

[wp_quiz id=”70529″]
Categories
Forex Course

100. Leading and Lagging Indicators: How are they different from one another?

Introduction

When getting started with trading, the first things people look out for are indicators. Indicators exist in both technical analysis and fundamental analysis. The difference between the two beings, fundamental indicators indicate or predict a long-term trend while technical indicators predict or confirm a short-term trend.

One of the best forms of analyzing the markets is by using indicators, as it helps interpret the trend in the market and also the opportunities available in them. Indicators are of two types, namely, leading indicators and lagging indicators. The former one is used to predict the future trend while the latter is used to confirm a trend.

What is a Leading Indicator?

It is a type of technical indicator that forecasts future prices in the market using past prices. That is, when the indicator makes its move, the prices follow a similar move. These indicators lead the price; hence they are called leading indicators.

However, never there is a 100 percent surety that the price will move in the direction as predicted by the indicator. Yet, traders can get their ideas from the indicators, see how the market unfolds, and then act accordingly.

What is a lagging indicator?

A Lagging indicator is also a technical indicator that uses past prices and confirms the trend of the market. It does not predict future price movements. Basically, it follows the change in the prices.

Classifying Indicators

There are five types of indicators in technical analysis. Let’s put these indicators in the right bag.

Trend indicators – It is a lagging indicator to analyze if the market is moving up or down.

Mean reversion indicators – A lagging indicator that measures the length of the price swing before it retraces back.

Relative strength indicators – It is an oscillator which is a leading indicator that measures the buying and selling pressure in the market.

Momentum indicators – This leading indicator evaluates the speed with which the price changes over time.

Volume indicators – could act as a leading or a lagging indicator that tallies up trades and quantify the buyers and sellers in the market.

Examples of leading indicators

The widely accepted and used leading indicators include:

  • Fibonacci Retracement
  • Donchian channel
  • Support and Resistance levels

Difference between Leading and Lagging Indicators 

Conclusion

All novice traders are in the hunt for the so-called “best indicator” in trading. But there is no such thing as ‘best’ indicator. Every indicator is a useful indicator if applied in the right way. For instance, we cannot use a trend indicator to predict the future of the market and then undermine that it does not work. Instead, one must understand the category under which an indicator falls and then use it accordingly.

I hope you were able to comprehend the types of indicators and the difference between them. In the next lesson, we shall apply some of the indicators into the real market and test them.

[wp_quiz id=”70435″]
Categories
Forex Course

99. Pivot Points: What have we learned so far?

Introduction

In the previous six lessons, we discussed pivot points right from understanding what they are, to the strategies one can apply to trade the markets. Now, let’s summarize what we’ve learned so far and move on with another exciting tool for analyzing the markets.

Pivot Point Basics

A pivot point is a technical indicator in technical analysis trading, which determines potential support and resistance levels in the market. This indicator is stationary, unlike the other indicators that move with the change in price.

The pivot points are levels that are essentially determined using the previous day’s high, low, and close price. So, every trading day, we can obtain one set of the pivot point.

What is the pivot point made up of?

There are up to six levels that make up the pivot point levels. One of the levels is the pivot point level, and the rest are support and resistance levels. The six pivot levels are symbolized as follows:

Pivot Point (PP/P)

First Support (S1), First Resistance (R1)

Second Support (S2), Second Resistance (R2)

Third Support (S3), Third Resistance (R3)

Fourth Support (S4), Fourth Resistance (R4)

Fifth Support (S5), Fifth Resistance (R5)

Note that, most of the time, we stick to the levels until S3/R3 because the price does not usually touch the levels beyond it.

How are the pivot levels calculated?

As mentioned, the pivot points are calculated using the close, high, and low of the prior trading day.

For example, the Pivot Point, First Support, and First Resistance are calculated as follows:

PP = (High + Low + Close) / 3

S1 = (2 x PP) – High

R1 = (2 x PP) – Low

Similarly, one can calculate levels until R5/S5. However, these values need not be calculated practically. There are trading platforms that automatically calculate these values.

Types of Pivot Points

There are four types of pivot points based on how the levels are calculated.

  1. Standard
  2. Woodie
  3. Camarilla
  4. Fibonacci

Most of the time, the standard pivot point levels are used.

Strategies using Pivot Points

There are several ways through which one applies pivot points. In our course, we have listed out three strategies.

Range trading strategy

According to this strategy, one can consider buying when the support level of the pivot points coincides with the support level of the range. A similar strategy can be applied for shorting as well.

Breakout Trading Strategy

As the name pretty much suggests, traders can consider going long or short when the price breaks above the resistance or below the support level.

Measuring Sentiment

Traders can use the pivot point level (PP) to determine the trend of the market. If the market breaks above the PP, it indicates a buyer’s market and vice versa.

Summing it up

The pivot point is that indicators that can be used every level of traders from beginners, intermediate to the advance trades. However, this indicator is not a standalone indicator. It must always be used in conjunction with other indicators and tools to have higher odds of favoring you. We hope you enjoyed this series on pivot points. Happy trading!

Categories
Forex Course

98. Do You Know There Are Four Types of Pivot Points?

Introduction

In all the previous lessons of pivot points, we considered the traditional pivot points. But this is not the only type of pivot points that are existing. There are three other types to it as well. In this lesson, we shall cover the four different types of pivot points that exist.

Types of Pivot Points

The four types of pivot point are mentioned as follows:

  • Traditional Pivot point
  • Woodie Pivot point
  • Camarilla Pivot point
  • Fibonacci Pivot point

Since we’ve already discussed the traditional pivot point in detail, we shall be concentrating on the rest of the types. Note that, in all the different types of pivot points we will be studying, the only difference is the calculation of the pivot point levels. As far as the concept to trade using these pivot points is concerned, it remains the same as the traditional approach.

Woodie Pivot Point

The Formulae

Pivot point (P) = (High + Low + 2Close) / 4

First Resistance (R1) = (2 x P) – Low

Second Resistance (R2) = P + High – Low

First Support (S1) = (2 x P) – High

Second Support (S1) = P – High + Low

From the above formulas, we can notice that the way of calculations is pretty different from that of the traditional type. In the traditional, we considered the difference between High and Low to calculate support and resistance levels. But, in this case, consider the range as well as the close of the previous day. Some traders prefer this over the traditional pivots because it gives more weightage to the close price of the previous day.

Camarilla Pivot Points

The Formulae

P = (High + Close + Low) / 3

S1 = Close – ((High – Low) x 1.0833)

S2 = Close – ((High – Low) x 1.1666)

S3 = Close – ((High – Low) x 1.2500)

S4 = Close – ((High – Low) x 1.5000)

R4 = Close + ((High – Low) x 1.5000)

R3 = Close + ((High – Low) x 1.2500)

R2 = Close + ((High – Low) x 1.1666)

R1 = Close + ((High – Low) x 1.0833)

If we look closely, we can infer that the support and resistance levels are calculated using the range and the close price similar to the Woodie calculation. The only major difference being, in Camarilla, four levels of Support and Resistance is calculated and is multiplied by a multiplier.

The theory with which Camarilla was created is based on the concept that the price has a natural tendency to return to the mean (here, close of the previous day). So, the simple strategy here is to sell when the price reaches the R3 or R4 level and buy when the price bottoms to S3 or S4 level. However, if the price breaches the S4 or R4 level, it indicates a strong trend in the market.

Fibonacci Pivot Points

The Formulae

P = (High + Low + Close) / 3

S1 = P – ((High – Low) x 0.382)

S2 = P – ((High – Low) x 0.618)

S3 = P – ((High – Low) x 1.000)

R3 = P + ((High – Low) x 1.000)

R2 = P + ((High – Low) x 0.618)

R1 = P + ((High – Low) x 0.382)

For calculating Fibonacci level, the pivot point level is calculated using the traditional method. Then the Support and Resistance levels are obtained by finding the product of the previous day’s range and the corresponding Fib level. The most used Fib levels are 38.2%, 61.8%, and 100%. Finally, adding/subtracting this value with the pivot point yields the Support and Resistance levels.

All of these indicators will be available with most of the brokers and charting tool software. Consider trying all of these pivot points on a demo account and use the ones that work the best for you. This hence brings us to the end of this lesson as well as the concepts involved in the pivot points. In the next lesson, we’ll summarize this topic and move ahead with another interesting technical analysis tool. Cheers!

[wp_quiz id=”70131″]
Categories
Forex Course

97. Where Are The Pivot Point Levels Put To Use?

Introduction

In our previous two discussions, we enlightened you with different strategies for using the pivot points. If you noticed, there we focused only on the pivot support and resistance levels. We didn’t really touch base on the Pivot Point (P) level. So, in this chapter of pivot points, we shall understand how the pivot point level is useful.

The usefulness of Pivot Point

The pivot point is used to measure market sentiment. Yes, with pivot points, we can even gauge the sentiment of the market. In other words, the pivot point helps us determine the direction of the market. It tells us in which direction is the money flowing in the market. So, basically, it indicates the trend of the market. Now, let’s take a few examples to understand the use of pivot points.

What does a Pivot Point tell us?

We know that the pivot point determines the type of market we are in. Inferences are made when the price falls below or above the pivot point.

  • When the market breaks below the pivot point (P), it indicates a bearish market or a market where the sellers are under control.
  • When the market breaches above the pivot point (P), it indicates a bullish/buyer’s market.

Bearish Example

Consider the chart below representing the GBP/JPY on the 15min timeframe. The pivot points are indicated as shown. Initially, we can see that the market was holding above the Pivot Point (P). Later in the day, it broke below the pivot point and then continued to move south. Also, it didn’t even respect the support levels. From this, we can conclude that the support levels do not work every single time. It perfectly fine when it is combined with other tools of analysis. However, a breakout trader would’ve profited the most from it.

Most importantly, one must not use this pivot point level as a tool to enter a trade. It is only an indicator that determines the sentiment of the market. It only tells us if the buyers are showing interest in the currency pair or the sellers. And with information in hand, we use other trading techniques to time the market.

Bullish Example

In the below chart, we can see that the market was trading below the pivot point level. Then it shot up and broke the pivot level as shown. This marks the start of an uptrend. And it is clearly visible that the market headed north by breaking through R1 as well as R2. But at R3, it found resistance. Now since the market is trending up, one can look at the price drop from R2 as a discount and anticipate buying at the R2 level, which is ‘resistance turned support.’

Similarly, traders can determine the direction of the market using the pivot point level and time their entry based on other technical tools and ideas. We hope you found this lesson informative and interesting. Cheers!

[wp_quiz id=”69915″]
Categories
Forex Course

96. Trading Breakouts using Pivot Points

-Introduction

We know that pivot points are no different from the typical support and resistance levels. We also saw how these levels were respected when trading a ranging market. But, could it used to trade breakouts? Let’s find out in this lesson.

Just like your normal Support and Resistance, the pivot levels don’t hold forever. At one point or the other, the price breaks out from these levels. In our range strategy, we always hit buy at the support and sell at the resistance. But there are times the market breaks from these levels and stops us out. When such things happen, we can develop another plan ready for the same and take advantage of it.

In the trading community, there are two types of traders: aggressive traders and conservative traders. And the approach to trade breakouts is different for both. So, we made two strategies to benefit the aggressive as well as the conservative traders.

The Pivot Points Breakout Strategy

Doing it the Aggressive way

The aggressive approach to trade breakouts is very simple. The strategy for such traders is to trigger the trade when the price breaks above resistance or below the support. The logic to this is that the resistance/support which was supposed to hold is now not being respected. It means that the opposite party is showing more strength. Hence, we will also be following the stronger side.

Aggressive traders are the ones to catch the initial move of the breakout. But there is high risk involved in these types of entries.

Trade Example

Below is the chart of GBP/CHF on the 15min timeframe. The pivot points are marked as shown. Initially, we can see that the price broke below S1 support. Here, aggressive traders can get in for a sell after the close of the candle. Later, the price continued to fall down and ended up breaking the S2 support as well. This could be another entry for the aggressive breakout traders.

Placements

As aggressive traders, it is important to have good risk management on the trades. The most basic necessity is the placement of stop-loss and take-profit orders. For the above trades, traders can keep the stop-loss just above the level they entered the trade. However, it would be better to place the stop-loss much higher than that level because we can stay safe from spikes. And a typical TP would be the next Support level. Refer to the above chart to get better clarity on it.

Doing it the Conservative way

The conservative approach is more of a safe approach to trade breakouts. According to this strategy, look to enter the trade when the price retests the level after breaking through that level. In trading terms, this is called the ‘role reversal’ concept. This concept simply means the turning of ‘support into resistance’ and ‘resistance into support.’ For example, when the price breaks below the support level, it is not a ‘support’ anymore; but is now ‘resistance.’ Now, let’s put this into action.

Consider the same chart shown above. We shall be looking if there are opportunities for conservative traders in the same market. In the below chart, we can see that the market broke below the S1. So, now we treat S1 as the resistance and prepare to sell when the price retraces to the S1 level. Similarly, we can enter for a sell when the price breaks below S2 and retests back to S2.

When it comes to the placement of stop-loss and take-profit, one can follow the same approach, as explained in the aggressive traders’ placement.

This brings us to the end of this lesson. Note that the above strategy is only to get an understanding of how to trade breakouts using pivot points. It is highly recommended to apply other technical tools to have more odds in your favor. Cheers.

[wp_quiz id=”69720″]
Categories
Forex Course

95. Adding Pivot Points to Your Range Strategy

Introduction

In the previous two lessons, we completely understood the basics of pivot points as well as how to calculate and interpret them. And now, we can move on and start applying this indicator to our charts and find trading opportunities using it.

In this lesson, we shall use the pivots points in our range trading strategy. We will be giving you a complete guide on the trading range with the assistance of pivot points.

Incorporating Pivot Points into Ranges

The Basics

As we already learned, pivot point has S1, R1, S2, R2, etc. which represents Support and Resistance whose working principles are the same as the typical Support and Resistance. According to the definition, support is the area in which the market tends to hold and move up, and resistance is the area where the market holds and typically moves downwards.

Talking about a range, it is the state of the market which moves in a sideways direction and repeatedly bounces off from support and resistance level. So, we shall be testing the pivot points as the place where the market can hold and possibly reverse.

The Thumb Rule

When the market is at any of the upper Resistance levels, we look to go Short on the security. When the price is at any of the lower Support levels, we look to go Long on the security.

Live Chart Example

Below is the chart of GBP/CAD on 15min timeframe. We can see that currently, the market is in a range (as shown in the box). The market was ranging on the 16th of March. With these values of 16th March, we calculate the pivot points for the next day and find trading opportunities.

Now consider the same chart after we’ve determined the P, S1, R1, S2, R2 pivot levels. Following up range, we can see that the S1 level was formed exactly at the bottom of the range. Now, both S1 and the bottom of the range is indicating a Buy a signal. Hence, when the price touches the S1 level, we can go long on this pair.

From the chart, we can clearly see that we found two opportunities to hit the buy at the first Support level S1.

Placements

Having a predetermined take profit and stop loss is vital in trading. In this particular example, the take profit can be placed at the pivot point (P) and stop loss below the S1 such that the trade yields 1:1 Risk Reward. Note that there are times when the take profit can be placed at the R1 level as well. But this requires expertise in technical analysis as well as in pivot points.

The above example is the way for traders to get the hang of how to trade pivot points. To do it more professionally, one must use other technical analysis tools to have a confirmation on the pivot levels. For instance, if there appears a Doji candle at the S1 level and also the stochastic indicator is indicating that the market is in the oversold area, then there are more odds in our favor that the support will work in the direction we predicted.

So, to sum it up, one must use the pivot point levels by clubbing it with other technical tools to find optimum results. We hope you comprehended this lesson to the best of your ability. Cheers!

[wp_quiz id=”69435″]
Categories
Forex Course

94. Calculating and Comprehending Pivot Points

Introduction

In the previous lesson, we understood what pivot points are. However, it is also necessary to understand how these levels are calculated. So, in this lesson, let’s go ahead and figure out how these levels are marked and comprehended.

Before getting right into it, let’s brush up the previous topic real quick.

  • The pivot point is an indicator used to identify Support and Resistance levels.
  • It is a static indicator, unlike the other indicators that move with the price.
  • It helps in determining the overall trend of the market in any given timeframe.
  • It is calculated using high, low, and close values.

Below is an image of how pivot points look when applied on the charts. As already mentioned, S stands for Support, R stands for Resistance, and P(PP) stands for Pivot Point. Now we shall see what exactly is S1, R1, S2, R2, etc.

Calculating Pivot Points

Different levels of Support and Resistance are shown when calculating the Pivot point’s support and resistance levels, and they are represented as S1, R1, S2, R2, etc. Now, let’s calculate each one of them. The Pivot Point P(PP) value is given by the average of the high price, low price, and the close price.

Pivot point P(PP) = (High + Low + Close) / 3

First level Support and Resistance Formula:

First Resistance (R1) = (2 x P) – Low | First Support (S1) = (2 x P) – High

Second level Support and Resistance Formula

Second Resistance (R2) = P + (High – Low) | Second Support (S2) = P – (High – Low)

Third Level Support and Resistance Formula

Third Resistance (R3) = High + 2(P – Low) | Third Support (S3) = Low – 2(High – P)

In the above formulas:

High represents the high price from the previous trading day,

Low represents the low price from the previous trading day, and

Close represents the closing price from the previous trading day.

Note: Since the forex market is open 24 hours, the New York closing time, i.e., 5:00 pm EST, is taken as the previous day data. For example, if you want to calculate the levels for Wednesday, you must consider the values of Tuesday.

Comprehending Pivot Points

In this indicator, we came across three levels, namely, Pivot point level, Support level, and the Resistance level. Let’s now understand what they actually depict.

The pivot point is a level drawn at the price of the average of the High, Low, and the close price of the prior trading day. So, if the market falls below the pivot point level on the subsequent trading day, we say that the market is showing bearish sentiment. And if the price goes above the pivot point, we say that the indicator is indicating bullish sentiment.

When it comes to the Support and Resistance levels, their meaning is the same as that of the actual Support and Resistance that is defined in the industry. The Support level is the price at which the market tends to shoot up, and Resistance is the level where the market tends to fall.

This brings us to the end of this lesson. In the coming lessons, we will understand how to trade the markets applying the Pivot Points indicator.

[wp_quiz id=”69225″]
Categories
Forex Course

93. Introduction to Pivot Points

What is a Pivot Point?

The pivot point is a technical indicator that shows the levels typically used to determine the overall trend of the market in different timeframes. These points are essentially used by professional traders to identify support and resistance levels. As a retail trader, one must keep an eye on these levels to identify potential buy/sell signals. To put in simple terms, the pivot points and its corresponding support and resistance levels are places at which markets can possibly change its direction.

The reason this indicator is very enticing is because of its objective. Unlike other technical indicators, there is no decision making involved. The Pivot Points are very similar to the Fibonacci levels. This is because these levels are pretty much self-fulfilling. However, there are some differences in some respects, which shall be discussed in the next section.

It is important to know that the pivot point indicator is mostly designed for short-term traders who wish to take advantage of small price movements. The technique to trade this is similar to that of trading support and resistance, where we participate in the market on a break or bounce from these levels.

The Difference between Pivot Points and Fibonacci Retracements

Though Pivot points and Fibonacci retracements are made by drawing horizontal lines to depict potential support and resistance levels, there vary in few aspects. In Fibonacci levels, there is subjectivity involved in picking the swing lows and highs. But, in pivot points, there is no discretion involved.

In Fib retracements, the levels can be constructed by connecting any price points on a chart. Once the levels are determined, the lines are then drawn at percentages of the selected price range. In the case of pivot points, fixed numbers are used instead of percentages. And the fixed values are the high, the low, and the close of the prior day.

Interpreting Pivot Points

Pivot points indicator is typically used by traders who trade the market using technical analysis. This indicator can be applied to the Stock, Forex, Commodity, Futures as well as the Cryptocurrency market. This indicator is unique from the other indicators because it doesn’t move with the price action.

It is static, and the levels drawn remain at the same prices throughout the day. This means that traders can plan their strategy much in advance. For example, in most of the approaches, if the price falls below the pivot point, traders will go short on the security. And similarly, if the price goes above the pivot point, they will look for buying opportunities.

How do Pivot Points look?

When the standard pivot points are applied to the charts, it will look something like this (as shown below).

In the above chart, P stands for Pivot Point | stands for Support | stands for Resistance

There are R1, S1, R2, S2, etc. as well, but it shall be explained in the upcoming lessons. Stay tuned!

[wp_quiz id=”69068″]
Categories
Forex Course

Introduction To Forex Course 4.0

Hello People,

As you all know, we have completed Course 3.0 successfully. Thanks a lot for the brilliant response and great job on the quizzes you all have taken. We have covered some of the most critical fundamentals pertaining to technical analysis in course 3.0. Please make sure to practice all the concepts we have discussed in a demo account. Without practice, it is impossible to ace the Forex Market using technical analysis. We have also made a quick navigation guide for Course 3.0 so that it’ll be easier for you to get a quick recap whenever required. You can find that guide in the link below.

Quick Navigation Guide – Forex Academy Course 3.0

With all these learnings in mind, we will be moving on to the Forex Academy Course 4.0. We have discussed most of the basics concerning technical trading in the previous course. Hence, we will be exploring some sophisticated strategies and intermediate to advanced concepts of technical analysis in Course 4.0. It is crucial to have acquired the knowledge of whatever we have studied in the previous course to catch up with these complex concepts. So it is highly recommended to finish the previous course before starting off with this one.

Topics that will be covered in Course 4.0

Forex Chart Patterns & Their Importance

Trading The Most Popular Chart Patterns

Oscillators

Momentum Indicators

Pivot Points & their importance

Each of these topics will have about 7 to 10 course articles with corresponding quizzes. The USP of this course are the writers who prepared TOC and the related content. They are professional technical & price action traders who have a combined experience of 20+ years in the Forex market. So make sure to follow all the concepts that are discussed in this course and practice them well to become a successful Technical Trader. Also, try to answer the quiz questions until you get all the questions right. We wish you all the luck. Cheers!

Categories
Forex Course

90. The ATR Indicator & Its Corresponding Trading Strategy

Introduction

ATR (Average True Range) is a popular volatility indicator in the market. It is used to find how much the instrument moves on an average over a given period of time. This indicator is introduced by J. Welles Wilder Jr. in his book, ‘New Concepts in Technical Trading Systems.’ Apart from ATR, this book also includes some of the most famous technical indicators such as RSI, ADX, and Parabolic SAR, etc.

The ATR indicator was originally developed to trade the commodities market, but it has been modified in such a way that it could be widely used for stocks, indices, and the Forex market as well. This indicator is not developed to indicate the price direction. Instead, it is used to measure the volatility of the instrument, which is caused by the gaps, up & down moves. ATR is a boundless indicator, unlike the other indicators we learned till now. Higher the ATR level, higher is the market volatility, and lower the ATR level, lower is the volatility of the underlying asset.

Below is an illustration of how this indicator looks on a price chart.

Trading With The ATR Indicator

The image below represents the ATR indicator on a GBP/AUD Forex chart. The orange box indicates the pullback phase, and at this phase, we can see the ATR indicator keeps going down. This means that there is currently low volatility in this pair. Conversely, the uptrend in the Green box indicates high ATR value. This means the big players are back in the business, and they are accumulating big chunks. As a result, the instrument is quite volatile. Furthermore, the yellow box again shows a decline in volatility.

Traders can use this indicator to get an idea of how far the price of an asset is expected to move on a daily basis. We suggest you use this way of trading only on higher timeframes such as daily, weekly, and monthly. If the last closed candle of a daily chart shows 50 ATR value, it means that the last candle has moved 50 pips, and we can expect the next day price movement to move similarly.

First of all, we must find out the ATR value of the last closing candle on the daily chart. Then we can look for buy/sell opportunities at the opening of a new day’s candle. The profit target should be based on the last day’s ATR value. Some traders also use double the value of the ATR indicator to place their take-profit orders. It all depends on what kind of trade you are. If the ATR value is 50, we can go for 50 pip target (conservative move), or you can even go for the 100 pip target (aggressive move)

We can also use the ATR indicator for placing Stop-loss orders. When the ATR gives us the value of the present day, we can use those values to place the stop-loss orders below or above our entry points. If the market hits the stop-loss, it means that the daily price range is moving in the opposite direction. Hence we must exit our positions as soon as we can. The major benefit of placing the stop-loss orders by using the ATR value is that we can avoid the ‘market noise.’ That is, the unusual up and down moves will not stop us out.

Changing the Settings of this Indicator affects its Sensitivity

The standard setting of this indicator is 14, which means the ATR indicator will measure the market based on the last 14 candles. If we use a setting lower than 14, it makes the indicator more sensitive, and it will show us a choppier ATR line. On the other hand, a setting above 14 makes the indicator less sensitive to the price action and shows smoother reading.

In short, most of the Traders use the ATR indicator to check the market volatility and to place the stop-loss & take-profit orders. The higher value of the indicator implies that we must go for deeper stops, and the low value means we must go for smaller stops.

That’s about the ATR indicator and its use cases. Try using this indicator to check the market volatility and place accurate stop-loss orders. There are traders who use this indicator to enter the market as well, but those are advanced strategies that we will be discussing in the future. Cheers.

[wp_quiz id=”68339″]
Categories
Forex Course

89. Identifying Trading Signals Using The ‘ADX’ Indicator

Introduction

The ADX indicator is created by a technical analysis legend, ‘J Welles Wilder.’ ADX (Average Directional Index) shows how strong the market is trending in any direction. This indicator doesn’t have a negative value, so it is not like the oscillators that may fluctuate above and below the price action. The indicator gives a reading that ranges between 0 and 50 levels. Higher the reading goes, stronger the trend is, and lower the reading goes, weaker the trend is.

The ADX Indicator Consists of Three Lines.

  1. The ADX Line.
  2. The DI+ Line. (Plus Directional Movement Index)
  3. The DI – Line. (Minus Directional Movement Index)

The chart above is the visualization of the ADX indicator. We can see the green line (DM+), the Red Line (DM-), and the Yellow Line. (ADX)

Trend Direction and Crossovers

Buy Example

To take a buy trade using this indicator, the first requirement is that the ADX line should be above the 20 level. This indicates that the market is in an uptrend. We go long when the DI+ crosses the DI- from above as it indicates a buy signal.

The chart below is the EUR/AUD Forex pair, where we have identified a buy trade using the ADX indicator. As we can see, the market was in an uptrend, and it is confirmed by the ADX line going above the 20 level. At the same time, we can also see the crossover happening between the DI+ and DI- lines of this indicator. This clearly indicates a buying trade in this pair.

The stop-loss placed below the close of the recent candle is good enough, and we must exit our position when the ADX line (yellow line) goes below the 25 level.

Sell Example

The first requirement to take a seeling position using the ADX indicator is that the ADX line must be below the 20 level. This indicates that the market is in a downtrend. We go short when the DI+ line crosses the DI- line from below as it indicates a sell signal.

The below chart of the GBP/USD Forex pair indicates a sell signal. In a downtrend, when the ADX line (yellow line) goes below the 20 level, it confirms the strength of the downtrend. At the same time, when the DI+ crosses the DI-  from below, it shows that the sellers are ready to resume the downtrend.

Breakout Trading Using The ADX Indicator

This strategy is similar to the crossover strategy that is discussed above. However, we are adding the price action breakout part to it. The idea is to go long when the ADX line is above the 20 level and when the DI+ crosses the DI- line from above. Also, the price action must break above the major resistance level to confirm the buying signal.

As we can see, in the below USD/CAD Forex chart, when the ADX line goes above the 20 level, it indicates that the uptrend is gaining strength. It also means that we can expect a break above the resistance line soon. When the price action broke above the resistance line, we can see the crossover on the ADX indicator. This clearly indicates a buy trade in this currency pair.

We can exit the trades when the opposite signal is triggered. Most of the time, breakout trades travel quite far. So if your goal is to ride longer moves, exit your position when the momentum of the uptrend starts to die or when the price action approaches the major resistance area.

That’s about the ADX indicator and related trading strategies using this indicator. If you have any questions, please let us know in the comments below. Cheers!

[wp_quiz id=”68035″]
Categories
Forex Course

88. Trading The Forex Market Using The Amazing ‘Parabolic SAR’ Indicator

Introduction

Parabolic SAR is a trend following indicator that was developed by ‘Welles Welder.’ The SAR in the name stands for the ‘Stop and Reverse.’ Welder introduced this indicator in his 1978 book “New Concepts in Technical Trading System.” In this book, he also introduced many of the revolutionary indicators like RSI, ATR, and Directional Movement Concept.

As the trend of the currency pair extends over time, this indicator trails the price action. If the indicator is below the price action, it means that the price of the currency is rising, and when it goes above the price, it indicates that the market is in a downtrend. In this regard, the Parabolic SAR stops and reverses when the trend of the instrument changes its direction.

During the volatile market, the gap between the price action and the indicator widens. In a choppy or consolidation market, the indicator interacts with the price quite frequently. Most of the technical indicators represent the overbought and oversold market conditions, whereas the Parabolic SAR visually provides us an insight on where to exit our position.

Parabolic SAR – Trading Strategy

The basic strategy while trading with this indicator is to go long when the dots move below the candlestick and go short when the dots go above the candlestick. It is advisable to use this way only in a strong trending market. If the trend is choppy or if the price action is continuously being pulled back, this indicator will continuously give us the buy-sell signal. All of these trading signals won’t be genuine and can produce many losses if we trade all of those signals generated.

As we can see in the below EUR/NZD price chart, the market was in an uptrend. But the momentum of the buying trend was quite weak. That’s the reason why this pair gives a lot of buying and selling opportunities in this pair. If we trade every opportunity, we will end up on the losing side. This is the reason always we must always find the pair which is in a strong uptrend or downtrend.

Buy Example

First of all, find a currency pair that is in a strong uptrend. While the price is in an uptrend wait for the indicator to go below the price action when the price pulls back. If this happens, we can take buy entry. We can expect a ~ 50+ pip movement if the market is trending. Place the stop-loss just below the dots of the Parabolic SAR.

As we can see in the above image of the EUR/USD Forex pair, the market was in a strong uptrend. We have identified two trading opportunities, and both the trades gave us 150+ pip profit. One crucial thing to remember is, in an uptrend, only go for the buying trades and ignore all the sell signals. Place the stop-loss just below the parabolic dots and book the profit when the market gives an opposite signal.

Sell Example

For identifying sell opportunities, we must first find out a strong downtrend. When the indicator goes above the price action, we can activate our sell trades.

In the below chart, we have identified a couple of selling opportunities in the EUR/USD Forex pair. We can see that each trade travels a significant amount of time before we see the next trading opportunity. This is because the sellers were super strong. Parabolic SAR provides amazing trading opportunities in strong trending markets only. This is the only way to use this indicator for buying and selling.

That’s about the Parabolic SAR indicator and how to use it to trade the markets. This indicator can be combined with others to find the accuracy of the trading signals generated. Try using this indicator and let us know if you have any questions in the comments below. Cheers.

[wp_quiz id=”67826″]
Categories
Forex Course

87. Using Ichimoku Cloud To Identify Trading Signals In The Forex Market

Introduction

The Ichimoku Cloud is a Japanese charting method and a trading system developed by Mr. Goichi Hosoda. This indicator consists of many different lines embedded in the price chart. Hence it might look complicated at first and might even make novice traders unforgettable reading the charts. But with enough experience, we can grab all the information presented by the indicator. The indicator consists of five Moving Averages and a cloud formed by two of those averages. The default settings of the indicator are 9, 26, and 52, and these settings are configurable according to the trader preference.

Components of the Ichimoku Cloud

This indicator consists of five lines in total, as discussed. They are a Red Line (Tenken Sen), Blue Line (Kijun Sen), Green Line (Chinoku Span), and Two Orange lines that make the cloud (Senkou Span A and B). Each line of the indicator is a moving average, so we can also look at the Ichimoku cloud indicator as a five moving average indicator.

The Basic Interpretations of the Ichimoku Cloud

When the price is above the cloud, it means the market is in a bullish trend. Contrarily, when the price is below the cloud, it means the market is in a bearish trend. When the price action is in the middle of the trend, it means that the market is in a consolidation phase.

Below is how a Forex price chart looks when the Ichimoku cloud is plotted on it.

Ichimoku Cloud Trading Strategy – Buy

First of all, the price action must be above the cloud as it indicates that the market is in an uptrend. When the Tenken Sen (Red Line) crosses the Kijun Sen (Blue line) from below, it indicates a bullish signal, and we can go long.

Buy Example 1

The image below represents a buying trade in the CAD/JPY Forex pair. We can see that the cloud goes below the price action, and it indicates that the trend is up. Soon after Tenken Sen (Red Line) crosses the Kijun Sen (blue line) below the price action, we know that the pullback is exhausted, and buyers are ready to resume the uptrend.

Buy Example 2

The image below belongs to the Weekly chart of the USD/CHF Forex pair. In Dec 2000, the Ichimoku indicator generated a clear buy signal when the cloud was below the price action, and the crossover of both the lines shows that it’s a perfect moment to go long in this pair.

Ichimoku Cloud Trading Strategy – Sell

The price action must be below the cloud as it indicates that the market is in a downtrend. Go short when the Tenken Sen (Red Line) crosses the Kijun Sen (Blue line) from above as it indicates a sell signal.

Sell Example 1

The below example is from the daily chart. It doesn’t matter which timeframe we trade; this strategy works well on all the timeframes. In the below image, at first, the market was in the consolidation phase. When the cloud goes above the price action, it’s a sign for us to prepare to go short soon in this pair. When the Tenken Sen (Red Line) crosses the Kijun Sen (Blue Line), it indicated that the sellers are now ready to print a new lower low.

Sell Example 2

If you are an investor or a higher timeframe trader, the below example is for you. The Red arrows and the encircled area indicate that the price action is below the cloud. Also, the Tenken Sen (Red Line) crosses the Kijun Sen (Blue line), indicating a sell signal.

The example below we took was from 2016, and the price action continuously goes down for the complete year. We should be patient enough and have control over our emotions to ride longer moves. We have placed the stop-loss above the crossover of two lines and booked the profits when the cloud goes below the price action.

That’s about Ichimoku Cloud and relative trading strategies. There are many other ways through which the signals can be generated using this indicator, but the ones discussed above are the most basic yet reliable ones. Cheers.

[wp_quiz id=”67661″]
Categories
Forex Course

86. Learning To Trade Using The Dependable ‘Stochastic Oscillator’

Introduction

Stochastic is a momentum indicator that was developed in the late 1950s by ‘George Lane.’ This indicator does not follow the volume or price of the underlying instrument; instead, it measures the speed and momentum of the price action. As a result, the indicator changes its direction before the price itself. This makes the Stochastic a leading indicator in the market.
We can change the sensitivity of this indicator to the market movement by adjusting the settings. Stochastic is a bounded indicator which oscillates between the 0 to 100 level. When the indicator reaches the 70-level, it indicates the overbought markets, and when it goes below the 30-level, we can assume that the market is in an oversold condition. The bullish and bearish divergences on the Stochastic indicator help us in anticipating the upcoming price reversals.

Trading Strategies Using The Stochastic Oscillator

Oversold & Oversold Areas

This is the basic yet powerful Stochastic strategy that is widely used by most of the traders. The idea is to go long when the indicator reverses at the oversold area and go short when it reverses at the overbought area. Let’s understand this with an example.

The image below is an NZD/CAD Forex price chart. It represents two buying and one selling opportunity in an uptrend. These trades are solely taken based on the strategy that we discussed above.

We have placed the stop-loss just below the recent candle and close our position when the market gave an opposite signal. The market circumstances don’t matter as this indicator can be used in any situation. The crucial thing is to follow the rules of the indicator very well.

If the indicator generates a buy signal, only take buy entries, and when it says sell, only consider selling opportunities. If we are in a buy trade and if the indicator represents a sell trade, that is the time to close our position. Never be rigid and ignore the indicator signals to hold the position for extended targets. If that happens, we will be on the losing side.

Stochastic Indicator + Bollinger Bands

Bollinger band is a leading indicator, and it consists of two bands, which are above and below the price action. This indicator also has the centerline, which is a Moving Average. The bands of the indicator expand and contracts according to market volatility. They expand if the volatility is more and contract when the volatility is less.

Buy Example

First of all, find an uptrend in any Forex pair. When the price action hits the lower Bollinger Band, see if the Stochastic indicates the oversold market condition. If it does, it means that the sellers now have a hard time to go lower and taking buy entries from here will be a good idea.

As you can see in the below image, the EUR/AUD was in an uptrend. During the pullback phase, the Stochastic reaches the oversold area, and the price action hits the lower Bollinger Band. This is an indication to go long in this pair. As we have activated our trade, the price action blasts to the north. We can close our position when the Stochastic indicator reaches the overbought area. If you want to ride longer moves in the trending market, exit your position at the major resistance area.

Sell Example

First of all, find a downtrend in any Forex pair. When the price action hits the upper Bollinger Band, see if the Stochastic is indicating overbought market conditions. If it does, it means that the buyers now have a hard time to go higher and taking sell entries from here will be a good idea.

The image below is the EUR/CHF Forex pair, and the pair was in an overall downtrend. During the pullback phase, the price action turned sideways. But when the price action hits the upper Bollinger Band and the Stochastic indicator reverses at the overbought area, it is a sign to go short in this pair.

We can place the stop-loss just above the upper Bollinger band, and the take-profit must be at the higher timeframe’s support area. If you are an intraday trader, close your positions when both the indicators give an opposite signal.

That’s about Stochastic indicator and related trading strategies. If you have any doubts, let us know in the comments below. Cheers.

[wp_quiz id=”67442″]
Categories
Forex Course

85. Learning To Trade By Using The ‘True Strength Index’ Indicator

Introduction

The True Strength Index (TSI) is a technical indicator used to analyze the financial markets. ‘William Blau’ developed the indicator in the mid of 1991. If you are interested to know more about William Blau and the technical tools developed by him, we suggest you read his book – ‘Momentum, Direction, and Divergence.’ The True Strength Index abounds between the +100 and -100 levels, and most of the values fall between +25 and -25.

Typically, the price action moves between these levels, and they are considered as overbought and oversold levels. This indicator also warns the weakening of a trend through the divergence and indicates a potential trend changes via centerline. When the indicator goes above the zero-level, it means the indicator is in positive territory, and the buying market is strong. But if the indicator goes below the zero-level, it means that the indicator is in negative territory, and the selling market is strong.

Below is how the price chart looks when the True Strength Index indicator is plotted on it.

True Strength Index Trading Strategies

Traditional Trading Strategy

Buy Example

We must look for buy trades when the crossover of the TSI lines happen at the oversold levels and hold it until the price action reaches the overbought level. The image below represents a buying entry in the AUD/JPY Forex pair. In an uptrend, when the market gives a decent pullback, the TSI indicator reached the oversold area, which means that the sellers are exhausted now and prepare for the buys. Soon after the exhaustion, the crossover happened on the TSI indicator, indicating a buy trade.

Sell Example

Look out for selling opportunities when the crossover happens at the overbought levels and hold it until the price action reaches the oversold level. The below chart represents the sell trade in the AUD/JPY Forex pair. The TSI indicator reached the overbought level when the price action gave enough pullback; the crossover indicates the failure of buyers to move price action higher, and as a result, reversal happened. We can exit our positions at any of the major support levels, or when the indicator gives an opposite signal.

TSI Breakout Strategy

Buy Example

The strategy is to identify a breakout on the price chart. Once the breakout happens, the TSI indicator must be above the zero-line to take the buy trade. We can see that in the below image when the breakout happened on the EUR/CAD Forex pair. After the breakout, we can see that the TSI indicator was also above the zero line, indicating a buy signal in this pair. We can exit our positions at the higher timeframe’s resistance area or exit when the TSI reaches the overbought area.

Sell Example

In a downtrend, find out a sell-side breakout. After the breakout, if the TSI indicator goes below the zero-line, it indicates a sell trade. As we can see in the image below, when the price action broke the trend line, the TSI indicator also breaks below the zero line, which shows that the sellers are ready to print a brand new lower low in this pair.

That’s about TSI and trading strategies related to this indicator. Make sure to try this indicator and these strategies and let us know hoe did your trades go in the comments below. Cheers.

[wp_quiz id=”67291″]
Categories
Forex Course

84. RVI (Relative Vigor Index) & Related Trading Strategies

Introduction

The Relative Vigor Index is one of the most popular indicators in the technical trading community. ‘John Ehlers’ developed this indicator, and it belongs to the oscillator family. The RVI is typically used to determine the strength of a trend in any given instrument. In a rising market, we generally expect the closing price to be higher than the opening price. Likewise, in a downtrend, we expect the closing price of any instrument to be lower than the opening price.

By comparing the opening price to its closing price, the RVI tries to gauge whether the trend is bullish or bearish. This predictive ability of the indicator makes it a leading indicator in the market. RVI consists of two lines, which are Green and Red in color. The Greenline is the standard moving average line, and the Redline is a 4-period volume weighted moving average. The Red is a trigger line as it provides the trading signal when it crosses above or below the Greenline.

Below how the price chart looks when the Relative Vigor Index is plotted on it.

Trading Strategies Using The RVI Indicator

A low value of the RVI indicates an oversold market, and when the RVI crosses above the signal line, it indicates a buying opportunity. Conversely, a high value indicates an overbought market, and the RVI crossing below the signal line indicates a selling opportunity.

Overbought and Oversold Crossovers

This is one of the basic and quite popular strategies using the RVI indicator. The trading opportunities that are generated in this strategy works well in all types of market conditions. The idea is to go long when the crossover happens at the oversold area and go short when the crossover happens at the overbought area. We must exit our positions when the indicator triggers an opposite signal.

As you can see in the below chart, we have generated a couple of trading opportunities in the USD/CAD Forex pair using the RVI indicator. We must follow all the rules of the strategy to generate an accurate trading signal. Place the stop-loss just below the closing of the recent candle and book the profit when the market gives an opposite signal.

Pairing RVI with RSI Indicator

In this strategy, we have paired the RVI indicator with the RSI indicator to identify accurate trading signals. Both of these indicators belong to the oscillator family, and when combined, they add great value. RSI indicator has only one line, which oscillates between the 70 to 30 levels. When it goes below the 30-level, it means that the market is oversold and above the 70 level means that the market is overbought.

Buy Example

The idea is to go long when both the indicators give a crossover at the oversold area.

The below charts represent a buy signal generated by both of these indicators in the CAD/JPY Forex pair. When both of these indicators line up in one direction, that trade has a very high probability of performing in the anticipated direction, and we must look for deeper targets. In this kind of situation, we can even risk a bigger amount.

Sell Example

The idea is to go short when both the indicators give a crossover at the overbought area.

In the below chart, NZD/USD was in a downtrend. During the pullback, both the indicators aligned in one direction giving us a selling signal. Expect deeper targets and make sure to exit the position when any of the indicators gives an opposite signal at the oversold area.

That’s about the RVI and the trading strategies using this indicator. Try these strategies in a demo account to master them and only then use them in the live market. Cheers.

[wp_quiz id=”67178″]
Categories
Forex Course

83. Learning To Trade The Donchain Channel Indicator

Introduction

The Donchain channel indicator is one of the quite popular technical indicators in the market. It is developed by Richard Donchian in the mid-twentieth century. This indicator consists of three moving average lines calculated by the highest high and lowest low of the last ‘n’ period. The upper Donchian band marks the highest price of the security over the ‘n’ period of time, whereas the lower band of the indicator marks the lowest price of a security over the “n” period of time. The area between the upper and lower band represents the Donchian channel.

If the price action is stable, the Donchian channel stays in a narrow range, and in volatile market conditions, the Donchian channel indicator will be wider. In this way, the Donchian channel is a wonderful indicator to assess the volatility of the market. The upper Donchian band indicates the extent of bullish energy, highlighting the price action achieved a new high in a particular period. Whereas the centerline of the indicator identifies the mean reversion price for a particular period. The bottom line identifies the extent of bearish energy, highlighting the lowest price achieved by the sellers in a fight with the buyers.

Below is how the price chart looks once the Donchain Channel indicator is plotted on to it.

Trading Strategies Using The Donchain Channel Indicator

Scalping Strategy

This strategy is made for traders who prefer to make quick bucks from the market. By following this strategy, we can get a couple of trades in a single trading session. The idea is to go long when the price action hits the lower band and go short when the price hit the upper band. The preferred time frame will be a 5- or 3-minute chart.

The image above represents a couple of buying and selling trading opportunities. Scalping is the easiest way to make quick bucks from the market. When we take a buy or sell trade, and if the price action goes five pip against your entry, we suggest you close the trade and wait for the price action to give another trading opportunity. Book the profit when price action hits the opposite band of the indicator.

Donchain Channel To Trade The Trending Market

If the market is in an uptrend, it is advisable to go only for the buy trades, and if it is in a downtrend, only go for sell trades. In this way, we can filter out false trading opportunities, and by following the trend, we can easily hold our position for longer targets.

Buy Trade

The below image represents two buying opportunities that we have identified in the EUR/NZD pair. We can see that the trend was up, and if we take any of those small sell trades, we will end up on the losing side. So on a higher timeframe, it is advisable to trade with the trend. We have captured the whole buying movement in this Forex pair. This is the easiest and safest way to trade the market using this indicator

Sell Trade

The below image represents a couple of selling opportunities in the CAD/JPY Forex pair. We can scale our positions when the market gives an opportunity to do so. Or, we can close our positions when the opposite signal is triggered. Always wait for the desired signal with patience to trade the market.

The advantage of trading with the trend is that whenever the market gives us the trading opportunity, we can easily hit the trade without worrying much. Another advantage of trading with the trend is that we can go with a smaller stop-loss as the price action spikes very less in a trending market.

These are only a few applications of the Donchain Channel Indicator. You can follow our strategy section to learn many advanced applications of this indicator. Stay tuned to learn many more technical indicators. Cheers!

[wp_quiz id=”67024″]
Categories
Forex Course

82. Using The MACD Indicator To Identify Potential Trading Signals

Introduction

The MACD indicator was developed by Gerald Appel in the late 1970s. It stands for Moving Average Convergence and Divergence. MACD is quite popular, and it can be considered as one of the safest and most effective momentum indicators in the market. As the name suggests, this indicator is all about the convergence and divergence of the two moving averages. When the moving average moves away from each other, the convergence occurs. Likewise, the divergence occurs when the moving average of the indicator moves towards each other.

MACD fluctuates above and below the zero lines, unlike the RSI indicator that we discussed yesterday. Also, since MACD is an unbound indicator, it is not useful to find out the overbought and oversold market conditions. Instead, traders can look for the signal line crossovers, centerline crossovers, and divergence to trade the market.

The image below represents the MACD indicator on the GBP/USD Forex chart.

How To Trade Using The MACD Indicator?

Signal Line Crossovers

The signal line crossover is one of the most popular trading strategies designed around the MACD indicator. A bullish crossover occurs when the indicator prints a crossover below the zero-line.  Contrarily, A bearish crossover occurs when the MACD prints a crossover above the zero-line.

If you are trading the lower timeframe, these crossovers last for a few hours. But if you are trading the higher timeframe, these crossovers can last a few days or even weeks. In the below chart, we can see a buy and sell signal generated by using the MACD indicator. In simple words, crossover below the zero-line indicates a buying trade, and the crossover above the zero-line indicates a selling trade.

Trade The Zero Line By Following The Trend

When the MACD line goes above the zero-line, it means that the trend of the instrument is gaining strength. When this happens, any buying anticipation will be a good idea. Conversely, when the indicator goes below the zero-line, it indicates a strong downtrend, and going short in the market is a good idea at that point.

If we plan to go long, it is advisable to trade with the trend. In a buy trend, if the MACD line indicates a selling signal, try to ignore that signal and wait for the buy signal. The same applies to the sell-side as well. If we find any breakout or breakdown supporting the MACD signal, that increases the probability of our trade performing in our desired direction.

The below image represents a sell signal by using the MACD indicator. In a downtrend, when the price action broke the major resistance line, we can see a crossover on the MACD indicator below the zero-line. This clearly indicates the gained momentum by the sellers,, and going short from here will be a good idea. Make sure to book the profit when the MACD indicator gives the crossover to the buying side.

MACD Indicator + Double Moving Average

We have learned what Moving Averages are and how to use them on the price charts. In this strategy, we are pairing the MACD indicator with 9-period and 15-period moving averages to identify potential trading signals.

The strategy is to go long when the MACD gives a crossover below the zero-line and the moving averages crossover below the price action. Conversely, go short when the MACD indicator gives the crossover above the zero-line and the moving averages crossover above the price action. It is advisable to use this strategy in healthy market conditions, and the lower period averages work fine for intraday trading only.

As you can see in the below chart, the market was in an uptrend. Using this strategy, we have identified three buying opportunities. All of these three trading opportunities have gives us 70+ pip profit in just two days. As we know that the moving averages act as dynamic support and resistance to price action, it is safe to put the stops just below the moving average indicator and exit our position when any of the indicators give an opposite signal.

That’s about the MACD indicator and how to trade the Forex market using this indicator. If you have any questions, let us know in the comments below. Stay tuned to learn about many more technical indicators in the upcoming sections.

[wp_quiz id=”66874″]
Categories
Forex Course

81. Learn To Trade Using The ‘RSI’ Indicator

Introduction

In our previous article, we have learned how to trade the markets using the Bollinger Bands. We hope you have used that indicator in a demo account and got a hang of it. Now, in this course lesson, let’s learn the identification of trading opportunities using a reliable indicator know as RSI.

RSI is one of the most famous indicators used in the Forex and the Stock market. It stands for the ‘Relative Strength Index’ and is developed by an American technical analyst – J. Welles Wilder. This momentum indicator measures the magnitude of the price change to identify the oversold and overbought market conditions.

The RSI indicator consists of a line graph that oscillates between zero and 100 levels. Traditionally, the market is considered overbought when the indicator goes above the 70-level. Likewise, the market is considered oversold when RSI goes below the 30-level. These traditional levels can be adjusted according to different market situations. But if you are a novice trader, it is advisable to go with the default setting of the RSI.

When the market is in an overbought condition, it indicates a sell signal in the currency pair. Likewise, if the market is in an oversold condition, we can expect a reversal to the buy-side. To confirm the buy and sell signals generated by the oversold and overbought market conditions, it is advisable to also look for centerline crossovers.

When the RSI line goes above the 50-level, it means that the strength of the uptrend is increasing, and it is safe to hold our positions up to the 70-level. When the centerline goes below the 50-level, it indicates the weakening in strength and any open sell position until the 30-level is good to hold.

RSI is one of those indicators which is not overlapped with the price action. It stays below the price charts. Below we can see the snippet of how the RSI would look on the charts. The highlighted light purple region marks the 70 and 30 levels, and the moving line in the middle is the RSI line.

How To Trade Using The RSI Indicator

There are various ways to use the RSI indicator to generate consistent signals from the market. You can use this indicator stand-alone, or you can pair it with other indicators and with candlestick patterns for additional confirmation. In this article, let’s learn the traditional way of using the RSI indicator along with RSI divergence and RSI trendline breakout strategies.

Traditional Overbought/Oversold Strategy

In the traditional way, we just hit the Buy when the RSI indicator gives sharp reversal at the oversold area. Contrarily, we go short when the RSI indicator reverses at the overbought area. The image below represents the Buy and Sell trade in the AUD/CAD Forex pair. We must close our positions when the market triggers the opposite signal. Stop-loss can be placed just below the close of the recent candle.

RSI Divergence Strategy

Divergence is when the price action moves into one direction, and the indicator moves in another direction. It essentially means that the indicator does not agree with the price move, and soon a reversal is expected. In other words, RSI divergence is known as a trend reversal indication.

In the below image, price action prints the RSI divergence twice, and both times the market reversed to the opposite side. When the market gives us a reversal, find any candlestick pattern or any reliable indicator to confirm the trading signal generated.

In the below image, we have identified the market divergence twice, and both the times the market reversed. If traded correctly, this strategy will result in high profitable trades.

Trendline Breakout Strategy

RSI trend line breaks out is a quite popular strategy as it is used by most of the professional traders. In the image below, when price action and the RSI indicator breaks the trend line, we can see the market blasting to the north.

Always remember to strictly go long in an uptrend, and go short in a downtrend while using this strategy. Buying must be done when the market is in an overbought condition, and the selling must be done when the market is in an oversold condition.

If you want to confirm the entry, wait for the price action to hold above the breakout line to know that the breakout is valid. Exit your positions when the RSI reaches the opposite market condition.

That’s about RSI and trading strategies using this indicator. Try using this indicator on a demo account today and experiment with the above-given strategies. Let us know if you have any questions in the comments below. Cheers!

[wp_quiz id=”66690″]
Categories
Forex Course

80. Indicator Based Trading – Bollinger Bands

Introduction

In the previous course lessons, we understood the importance, types, and various pros and cons involved in indicator-based trading. From this lesson, let’s start learning some of the most widely used indicators in the market. We will be starting with Bollinger Bands, which is arguably considered as one of the most widely used indicators in the Forex Market.

What are the Bollinger Bands?

They are a technical analysis indicator, which was developed by one of the famous technical trader John Bollinger in the 1980s. This indicator consists of three lines, which are simple moving average (the middle band), an upper and a lower band. In a volatile market, the bands of the indicator expand, and it contracts in tight market conditions.

Most of the traders think that the Bollinger bands indicator is similar to the moving average envelope, but it’s not true, because the calculations of both of the indicators are different. For plotting the upper and lower bands of the Bollinger Bands indicator, the standard deviation is considered. On the other hand, for moving average envelopes, the lines are calculated by taking a fixed percentage.

Bollinger Bands Indicator Plotted on a Forex Price chart

Using The Bollinger Bands Indicator To Take Trades

Most of the market experts and chartists believe that when the price action continuously touches the upper band, it means that the market is in an overbought condition, triggering a sell signal. Conversely, the closer the price action moves towards, the lower band, the more oversold the market is, triggering a buy signal.

This is the most common way to trade the markets using the Bollinger Bands. As much as this is true, we don’t suggest to use this approach to trade the markets where traders just blindly follow this one single rule. As we all know that the trend is our friend, we must first figure out the trend. Then it is advisable to trade only buy opportunities in an uptrend and sell opportunities in a downtrend. This is one of the most reliable ways to identify the trades on any trading timeframe.

The below image represents the buying opportunities on the EUR/CAD 5 min Forex chart. As we can see, the market was in a strong uptrend. We have identified four buying opportunities in just a couple of hours. The chart clearly represents how many times the price action touched the upper band and didn’t drop instantly. This is the reason why most of the professionals use this indicator to trade the market.

Trading Ranges Using The Bollinger Bands

One more crucial applications of the Bollinger Bands indicator is while trading ranges. This is because the bands of the indicator act like dynamic support and resistance levels to the price action. Higher the timeframe we use to trade the ranges, stronger are the bands will be. That is, price relatively respects these brands than the bands in the lower time frames. Many successful traders ace the market by using this strategy alone.

As we can see in the below chart, the market generated three buying and two selling opportunities when the market is ranging. Do not place the buy or sell orders blindly when prices reach the upper or lower level of the consolidation phase. Instead, wait for the prices to hold there for a couple of candles to activate your trades. In the below image, we have activated our trades only when we saw the confirmation candles. In this way, we can filter out whipsaws and false trading signals.

Conclusion

This lesson is an attempt to give you a basic idea of the working of this indicator. There are many more aspects to this, and you will be learning them once you start exploring Bollinger Bands on the price charts. You can refer to this and this articles to get advanced trading strategies using this indicator. Bollinger Bands can also be combined with technical tools like chart patterns and other reliable indicators to generate more accurate trading signals. One such example can be found here. Cheers!

[wp_quiz id=”66529″]
Categories
Forex Course

79. Is Indicator Based Trading For You or Not? (Pros & Cons)

Introduction

In the previous course article, we have briefly discussed the basics of indicator-based trading. We have also understood the different types of indicators. Before considering how to trade using these indicators, let’s see if indicator based trading is for you or not. For that, we will be listing down some of the significant pros and cons involved in indicator-based trading. After going through this article, we will know why we should be using indicators to trade the markets and what we should be cautious about while using these indicators.

Pros of using Technical Indicators

Simplification

As discussed in the previous course article, Indicators mainly present the existing price and volume data on the price charts. For novice traders who have less knowledge of reading this data, can take the help of indicators to understand the price charts in a more precise way. Also, indicators act as a great tool to identify market strength.

For instance, using the Moving Average indicator, the direction of the trend can be found. By using the stochastic indicator, overbought and oversold areas can be found. These cannot be easily identified by the novice traders if not for these indicators.

Swift Decision Making

Since you aren’t entirely aware of most of the indicators, we would like to give you an example of the indicators we have learned till now. If you remember trading Fibonacci levels, we have taken our entries right after the price bounces after touching the respective Fib levels. It is impossible to make such swift decisions in the absence of these indicators. Hence we can say that indicator based trading allows us to make quick decisions comparatively.

Confirmation Tool

Indicators act like an excellent confirmation tool for experienced traders as well. For example, a technical trader identifies a candlestick pattern and wants to take trades based on that pattern. To confirm if the signal provided by the pattern is accurate or not, he can take the help of any technical indicator like RSI or Stochastic. If the indicator supports the signal provided by the pattern, the trader can confidently make trades.

Combination Capability  

Indicators can be combined to understand the market more clearly. For instance, Moving Averages can be combined with Fibonacci levels, and Stochastic can be combined with many other reliable indicators to generate accurate signals. If we wish to, we can even add an end number of indicators, but these additions should able to simplify the price chart rather than making it more complex.

Cons of using Technical Indicators

Unawareness of the complete picture

Novice traders who get used to trading with these indicators can never get an entire background on what’s happening behind the charts. If they get used to this, they can never become a professional technical trader. Also, they won’t be able to identify if the signal generated by the indicator is accurate or not. Hence, it is always crucial to understand why the indicator is moving the way it is so that we can make better trading decisions.

Not for pure price action traders

Price action trading is also a part of technical trading. It is purely based on the price movements of the asset alone. So price action traders might find indicator based trading a bit redundant because they know why the price is moving the way it is moving. Hence we can say that indicators don’t add more value to pure price action traders.

Lag Issue

By now, we know that there are lagging indicators that portray what has already happened in the market. These indicators do add significant value to indicator based trading, but they can’t be completely used to take the trades.

Final Word

These are some of the pros and cons involved in using indicators for trading the markets. So the answer to the question ‘If the Indicator based trading is for you or not?’ is yes. It is for you. But we have to be cautious and understand the entire picture instead of blindly following the indicators. In the upcoming articles, we will start learning how to take trades using various reliable indicators in the market. Cheers!

Categories
Forex Course

78. Brief Introduction To Technical Indicators & Indicator Trading

Introduction

In the past two sections of this course, we have discussed two of the most important tools in Technical Analysis – Fibonacci & Moving Averages. These two are discussed in an elaborated way because you might be using them in conjunction with many of the other reliable indicators in the market. They can be used standalone not just to take trades but also for different other purposes. For instance, Moving Averages can be used to identify the direction of the trend. Likewise, Fibonacci Levels can be used to test the reliability of any support and resistance level.

Since we have completed learning these crucial tools, it’s time for us to extend our learning to understand specific technical tools known as indicators and oscillators. There are many indicators and oscillators in the market. Some are reliable, and some are not. So in the next few course lessons, we will be discussing some of the most credible and reliable indicators. In this lesson, let’s first understand what an Indicator basically is and why it is important to use them in technical analysis.

What is an Indicator?

An indicator is a tool that is used by technical traders and investors to understand the price charts and market conditions. The important purpose of any indicator is to interpret the existing data and accurately forecast the market direction. These indicators are built on various mathematical calculations by market experts.

These days, with the advent of technology, hundreds of indicators can easily be accessed. They are available on most of the charting platforms that we currently use, like MT4 & TradingView. Many of the reliable indicators we have today are a result of extensive research and back-testing. Any technical indicator considers a lot of important data like historical price and volume to predict the future price of an asset.

Indicators are an integral part of technical analysis, and the number of traders who just rely on indicators to take trades is pretty high. Typically, most of the indicators overlay on the price charts to predict the market trend. However, there are indicators that position themselves below the price chart to make users understand the overbought and oversold market conditions.

Oscillators are nothing but range-bound indicators. Which means, an oscillator can range from 0 to100 levels (0 being the floor and 100 being the roof). Essentially, if the price of an asset is at 0, it represents oversold conditions. Likewise, if the asset’s price is at 100, it represents overbought conditions.

Two Types of Indicators

Indicators are classified into two different types – Leading Indicators & Lagging Indicators. As the names pretty much suggest, leading indicators are those that predict the future price direction of any given currency pair. Essentially, these indicators precede the price action and predict the price.

Leading Indicator Examples: RSI (Relative Strength Index), Stochastic Indicator, & Williams %R.

Contrarily, lagging indicators act more like a confirmation tool. They follow the price action and help traders to understand the complex price charts better. One of the best use cases of a lagging indicator could be while testing the trend. We can confirm the trend along with its strength using a lagging indicator.

Lagging Indicator Examples: MACD (Moving Average Convergence & Divergence) & Bollinger Bands.

That’s about a brief introduction to Indicators and Indicator trading. In the next lesson, let’s understand the pros and cons involved in Indicator trading. Once that is done, we can start learning some of the most reliable indicators and how to trade the markets using them. Cheers.

[wp_quiz id=”66227″]

Categories
Forex Course

77. Moving Averages – Detailed Summary

Introduction

In the past few course articles, we have learned a lot about Moving Averages, their purpose, and various applications of this trading tool. So we just wanted to summarize everything we have discussed until now related to Moving Averages. This article will act as a quick guide for you to recall and remember the concepts better.

What Is A Moving Average?

A moving average is a tool that is used by the traders to identify the direction of the trend. It smoothens the price fluctuations by eliminating the temporary noise in the market. This will eventually help us in identifying the actual trend of the market. There are two types of moving averages, and both of them have different purposes. They are Simple Moving Average and Exponential Moving Average. There are different athematic calculations behind these averages, and we don’t have to know about them in detail. However, if you are interested in knowing, you can find the formula behind the averages here.

The length plays a significant role in the usage of a Moving Average. Lenght is nothing but the predetermined period of the moving average. Smaller MAs always reacts swiftly to the price movements where are longer MAs respond slowly to the price. For example, a 10-period MA always reacts quickly compared to a 20 or 30 period moving average.

SMA vs. EMA

Both SMA and EMA have their own applications to them. They can also be combined to produce more reliable trading signals. But those are sophisticated strategies that are used by some of the experienced traders. The basic approach is that the SMA should be used to protect yourself from the fake-outs that are produced by the market. We might miss out on the opportunity of being a part of the early trend, but we will be safe.

Contrarily, Exponential Moving Average quickly predicts the trend and help us in being a part of the early trend. However, it carries the risk of not identifying the fake-outs. Hence one must use these MAs depending on the market situations. We have also discussed the ways through which we can identify the market trend and taking trades using moving averages.

Applying the Moving Average Indicator On The Price Charts

With the advent of technology, most of the Forex charting platforms these days provide advanced MA indicators. MT4 has all of the moving average indicators by default. However, if you want to download a customized MT4 indicator, you can download it here. If you are a TradingView user, you can plot different period MAs on the price charts just by accessing the toolbar and choosing the MA indicator. You can change the period setting before plotting the MA on the charts.

Conclusion

Moving Average is one of the most basic technical tools but is sturdy. The usefulness of this indicator is increased when we use different period moving averages on the same chart. Also, this indicator can be combined with various other technical indicators to improve the reliability of our signals. If you have been following our strategy series, you would have seen us combining moving averages with other technical tools to filter out fake trading signals. That’s about the basics of moving averages and their applications. In the upcoming lessons, we will be learning about various indicators and their use cases. So stay tuned! Cheers.

Categories
Forex Course

76. Using Moving Average As Dynamic Support & Resistance

Introduction

In the previous article, we saw how moving averages could be used to find potential trade setups that are essentially based on trend reversal. The next fascinating use of the moving average is that they act as crucial Support and Resistance levels. We know the importance of Support and Resistance levels in technical analysis, and we learned how many indicators can be paired with these levels to generate potential trades.

But in the case of moving averages, this indicator itself acts as a potential support and resistance areas. We need to remember that these levels keep changing as and when the market changes its direction. That is why these levels are known as dynamic support and resistance levels. In this article, let’s understand this concept clearly.

In the below chart, we can see that the market repeatedly takes support at 50-Period EMA and then continues its uptrend.

From the above chart, we can also notice that the price at times is going below the EMA before bouncing off. Also, some times, the price is not precisely touching the EMA. In some cases, it is also possible that the market can just crash downwards without respecting our EMA line.

To overcome this problem, we should plot more than one EMA on the chart and then buy or sell once the price is in the middle of the two moving averages. We can also refer to this as the ‘trading zone.’ Let us see how the above chart will look after plotting another EMA on it.

After plotting 100-period EMA on the chart, we can see the price entering the areas between two MAs before going up and does not even touch the second MA. This means moving averages should never be used as single line support and resistance levels; rather, it is a ‘zone’ from where the market has a high chance of reacting.

When we use the concept of ‘zones,’ we get a clear idea of where to put the ‘stop-loss’ and ‘target.’ For example, the ‘stop-loss’ can be placed below the second MA, and ‘target’ could be the new higher high. When we have such a wide area for our ‘stop-loss,’ there is less chance of us getting stopped out before the trade performs in our favor.

Role Reversal of moving averages as Support and Resistance

Now that we know how moving averages act as support and resistance levels, we need to check if follows all the rules of S&R. One of the most significant rules of S&R is support turning Resistance and vice versa. We shall see if MAs follow that.

Below is a chart that shows how the moving average turns into Resistance after it was previously behaving as support. The yellow-colored arrow marks the point where the price broke through and crashed. Later, it started acting as a dynamic resistance level.

Conclusion

Using moving averages as support and resistance levels can be highly profitable when done with proper trade management. Intraday traders mostly use this technique as they fear of getting stopped out due to spikes. The best part of this application of the moving average is that they’re dynamic, which means we just need to plot them and leave it on the chart. We don’t have to keep looking back to spot support and resistance levels. In the next article, we will summarize all that we have learned about the moving averages. Cheers.

[wp_quiz id=”65911″]
Categories
Forex Course

75. Using Moving Average Crossovers To Take Trades

Introduction

In the previous article, we learned how to use the moving average for determining the direction trend. The Moving Average lines not only helps us in identifying the direction of the market but also tells us when a trend is about to end and potentially reverse. In today’s lesson, we will see how the moving averages can be used to enter trades at the reversal of a trend.

The principle of the strategy is to discover the crossover of the two moving averages on the chart. When the moving averages crossover, it is a sign of market reversal halting the existing trend. So at this point, we need to find a suitable ‘entry.’

Moving Average Crossover Strategy

Let us consider an example to explain the above-discussed strategy. Below, we have a daily chart of USD/CHF on which we have plotted the two moving averages (10-Period & 20-period). We can see the market being in a strong downtrend, and it is also confirmed by the two moving averages, where the ‘faster’ MA is below the ‘slower’ MA.

The next step is to find the overlap of ‘faster’ MA with the ‘slower’ MA from above, which is also known as the crossover of MAs. Once the crossover happens, there is a higher chance of the trend reversing. The below chart shows precisely how the crossover takes place, which means the trend can potentially reverse anytime now.

But, we shouldn’t be directly going long soon after the crossover. We need to confirm the trend reversal. A ‘higher low’ after the crossover validates the trend reversal, and this could be the perfect setup for going ‘long’ in this currency pair.

The below chart shows the ‘higher low,’ which is formed exactly after the crossover. Therefore, we now have confirmation from the market, so we can take some risk-free positions.

As we can see, in the below chart, the trade goes in our favor and hits our initial target. However, aggressive traders can aim for a higher ‘take-profit‘ as the new uptrend can reverse the entire downtrend, which is seen on the left-hand side. The reversal is also confirmed by moving averages where the ‘faster’ MA is above the ‘slower’ MA. The stop-loss for this trade is placed below the identified ‘higher low’ with a take-profit at a new high or significant S&R area.

Conclusion

The crossover strategy works beautifully in both volatile and trending markets, but they do not work that well in ranging markets. This is because the crossover takes place multiple times in the ranging market, and this leads to confusion about the market direction. To find high probability trades, one can also combine the strategy with other technical indicators to get additional confirmation of the trend reversal. In the next article, we shall see how moving averages can act as key support and resistance levels.

[wp_quiz id=”65842″]
Categories
Forex Course

74. Using Moving Averages To Identify The Trend

Introduction

In the previous lessons, we have understood the two types of Moving Averages and the difference between them. We have also seen which Moving Average should be used in different market conditions and the one that must be preferred most of the time. From this crouse lesson, let’s explore the real-time applications of Moving Averages and how we can find accurate trades using this indicator.

One of the simplest, yet important use of Moving Average is to determine the direction of the trend. This can be done by plotting the indicator on the chart and then deciding the position of candlesticks with respect to the line of Moving Average.

The ideal way of identifying a trend using MA is this – If the price action tends to stay above the moving average line, it usually signals an uptrend. Likewise, if the price action remains below the moving average line, it indicates a downtrend.

This approach of establishing the trend is too simplistic and also has a significant drawback. Let us understand that with the help of an example.

Below is the EUR/USD price chart, and we have added a 10-period MA line to it. According to the rules of MA, since the price is above the MA, we should be going ‘long’ in this currency pair.

Due to a news event, price drops suddenly and closes below the MA (in the below chart). So, this changes our plan, which means now we should be thinking of going ‘short’ in the currency pair. But before we do that, let us see what happens to the price in the next few candles.

The below image shows that the price fakes out and does not continue its downward trend. Hence, if we would have gone short, that would have resulted in the price hitting our stop-loss resulting in a loss. Let’s understand the problem with this setup.

The strategy mentioned above is right, but the problem is that we are using a single period MA line stand-alone and not combining it with any other indicator. The best way to use MA for determining a trend is by plotting an extra Moving Average line on the charts instead of just one. It will give us a clearer idea if the pair is trending up or down depending on the sequence of the MAs.

The best way is to check if the ‘faster’ moving average is above the ‘slower’ moving average for an uptrend, and vice versa for a downtrend. In the below chart, we can see that the ‘faster’ SMA is above the ‘slower’ SMA, and this shows the strength of the uptrend. Also, the fake-outs that happen because of news releases will also have less impact on the indication given by the Moving Averages. Combining this knowledge with trendlines can help us decide if we have to go ‘long’ or ‘short’ in the currency pair.

Conclusion

Moving Averages can be useful for establishing the direction of a trend, but it should never be used stand-alone. If not other indicators, additional moving averages itself can be combined with an existing moving average to decide the direction of the trend. In the next article, we will be discussing how we can enter a trade using moving averages and profit from this indicator.

[wp_quiz id=”65733″]
Categories
Forex Course

73. Simple vs. Exponential Moving Average

Introduction

After having a fair amount of discussion concerning Simple and Exponential Moving Averages, a question that may arise is, which one to use when? Whether SMA gives accurate trading signals, or is it the EMA that is more accurate and reliable than SMA? Let’s try answering these questions in this article.

We mentioned in the previous article that the EMA responds to price action more quickly. So, if we want to determine a short-term trend, EMA is the best way to go. It can undoubtedly help us in catching the early move of a trend and, in fact, profit from it by taking suitable positions in the market. The downside of the EMA is that it gives us the wrong signals during the consolidation periods of the market.

Since the EMA responds very quickly to price movements, we might think that the price has broken out of the range while it could just be a spike. The EMA proves to be too fast, and this is not desirable in such market scenarios.

In the below chart, we see that the market starts to ‘range’ after a retracement of the big downward move. Due to this, the EMA starts moving up, indicating a buy signal. Later, when the last but one candle of the range breaks out above the range, traders might think that the market has reversed, as this is also confirmed by the EMA. In the very next candle, the price makes a long wick at the top of the candle, and the EMA takes a sharp turn on the downside. This is one of the examples where the EMA can give us false signals.

The opposite is true with Simple Moving Average (SMA).

The SMA should be used when we want the moving average to be smooth and respond to price action slower than the real price movement. This characteristic is particularly useful when we are trading longer trading frames, such as daily or weekly. Since SMA responds slowly to price movement, it can possibly save us from such fake outs.

The below chart represents the weekly chart of a Forex currency pair where we can see the SMA moving up even after the occurrence of the spike. Hence the SMA gives an idea of the overall trend by filtering out spikes.

Conclusion

The SMA should be used when we want to protect ourselves from fake-outs and predict the price movement in the longer term. By using SMA, we might miss the opportunity of getting in on the trend early. On the other hand, the EMA is quick to predict the trend, and thus we can be a part of the initial move of the trend. But it carries the risk of getting preoccupied with fake-outs.

The answer to the above question (which one is better?) is that it really depends on the type of trader we are. Our risk appetite, trading time frame, and strategy will influence the type of moving average we should choose. In the upcoming lessons, we will learn how to use moving averages to determine the trend and take a trade. Stay Tuned.

[wp_quiz id=”65651″]
Categories
Forex Course

72. Understanding Exponential Moving Average

Introduction

In the previous course lesson, we understood the first type of Moving Average, which is SMA. We also saw how spikes could distort the SMA. The solution to this distortion is the Exponential Moving Average (EMA); so, let’s discuss this type of MA in our lesson today.

The EMA gives more weightage to the recent change in prices and does not give much importance to previous data. Learning how to calculate and plot EMA on the chart will provide us with a clear understanding of which Moving Average should be used at different times of the market.

We shall take an example to explain the definition of EMA. This example will also show how the EMA overcomes a significant limitation of the SMA. In the below figure, we have plotted a 10-period SMA on the daily chart of a currency pair. Here we have chosen the USD/CHF currency pair as an example.

Since we are calculating the 10 ‘period’ SMA, we need first to note down the closing prices of the last ten periods days. The prices are as follows:

0.97806,0.97986,0.97528,0.97336,0.97536,0.97461,0.97536,0.97829,0.98156,0.97636.

The next step is to add the above-given numbers together and then divide the result by 10. This equals to 9.76804 / 10 = 0.97680. Therefore, the SMA for the last 10 days is 0.97680. The end of the orange SMA line in the above chart points exactly to the price 0.97860.

Now let us consider a case where, on the sixth day, dollar drops drastically due to a news event that was bad for the US economy. If the sixth candle drops to a price around 0.97000 (closing of all other remaining the same) due to the news release, the new SMA will now be calculated as follows:

(0.97806 + 0.97986 + 0.97528 + 0.97336 + 0.97536 + 0.97000 + 0.97536 + 0.97829 + 
0.98156 + 0.97636) / 10 = 0.97654

The resultant SMA is lower than the SMA we had obtained in the previous step. This means when the price dropped on Day 6, it created a notion that the trend is going to reverse, but in reality, it was just a one-time event that was caused by news. We need a mechanism that will filter out these spikes so that we don’t get the wrong idea. This is where EMA comes to our help.

Taking the above example, EMA gives more stress on the recent price movements, such as the closing prices of the last four candles. This means the spike that happened on the sixth day will be of less value and wouldn’t have much effect on the moving average. It is always a smart and better idea to focus on what traders are doing recently rather than what happened long ago. Always remember that the past data is of less significance to us.

The below chart shows the difference between the two moving averages when they are plotted simultaneously.

Notice that the purple line (10-period EMA) appears to be closer to the candles than the orange line (10-period SMA). This means the EMA is more accurate in representing the recent price action, and now we know why. So, the bottom line is to pay attention to the last few candles rather than candles of last week or last month.

Conclusion

That’s about the two types moving averages with their own advantages. The EMA is a better option to use when you are swing trading as it gives precise analysis than SMA due to the reasons mentioned above. EMA, too cannot be used standalone and should be paired with a trading strategy. In the next article, we will discuss the pros and cons of using SMA and EMA.

[wp_quiz id=”65573″]
Categories
Forex Course

71. Basics Of Simple Moving Average

Introduction

In the previous lesson, we understood the definition of Moving Average, their importance, and the significance of ‘length’ in MAs. We also learned the correct way of choosing the ‘length’ while using Moving Averages. In the upcoming articles, we shall see and understand the different types of moving averages. Let’s start off by learning the first type – Simple Moving Average (SMA).

Simple Moving Average

The SMA is a very simple Moving Average that is calculated by the summation of the last ‘n’ period’s closing prices and then by ‘n.’

Let us understand the above formula with an example.

When we plot 10 ‘period’ SMA on a 1-hour chart, we add the closing prices of the last 10 hours, and then divide it by 10. Similarly to plot a 5 ‘period’ SMA on a 4-hour chart, we need to add the closing prices of the candles in the last 20 hours and then divide that number by 5. These calculations are coded and embedded in the form of indicators. These indicators will be available in almost all of the trading platforms. All we need to do is to pick the indicator from the tools bar and plot them on the charts by selecting the appropriate period and timeframe.

In the below chart, we have potted three different SMAs on the chart. This chart represents the 1-hour time frame of a currency pair. As we see, longer the period of SMA, more it lags behind the price. This explains the reason why the 60 ‘period’ SMA is farther away from the 30 ‘period’ SMA; because the 60-period SMA adds up the last 60 periods and divides it by 60 as mentioned above.

When the period of an SMA is large, it reacts slowly to the price movement. Essential, SMA shows the overall sentiment of the market at any given point in time. However, SMA should always be used to find the direction of the market in the near future but not take trades based on this information alone.

Instead of looking at the current price of the market, we need to have a broader view and predict the direction of the future price movement. Using SMA, we can say if the market is in an uptrend, downtrend, or if it is moving sideways.

One major drawback of SMAs is that they are vulnerable to spikes. So, during the calculations, the prices of the currency pair, which is of no significance (high or low of spike), will be added up and shown by the SMA line. The reason behind less significance to the prices of spikes is because they give false signals, and we might think a new trend is developing, but in reality, it is just a failure of the price.

The below figure shows how the SMA would be when there are too many spikes in the chart. As we can see, the 10 ‘period’ SMA is not uniform and is not able to show the direction of the market in the occurrence of spikes.

Conclusion

The SMA should be plotted to know the market trend when it is not clear. It can also be used to forecast the price movement in the near future. It is very important to combine this indicator with a trading strategy as it can never produce the results when used standalone. In the next lesson, we shall introduce another type of moving average and see how it can solve the issues we face with SMA.

[wp_quiz id=”65345″]
Categories
Forex Course

70 – Introduction To Moving Averages

Introduction

After understanding various applications of the Fibonacci indicator, it’s time to learn about the next best indicator in technical analysis – Moving Average. MA is one of the most popular indicators in the technical trading community. This indicator, just like the Fibonacci Indicator, has a lot of applications and is commonly used by traders for different reasons.

A moving average smoothens the price movements and its fluctuations by eliminating the ‘noise’ in the market. By doing this, MAs shows us the actual underlying trend. A moving average is computed by taking the average closing price of a currency for the last ‘X’ number of candles. There are many moving averages depending on the number of periods (candles) considered.

Below is how a 5-Period Moving Average looks on the price chart.

One of the primary applications of the Moving Average indicator is to predict future price movements with high accuracy. As we can see in the above chart, the slope of the line determines the potential direction of the market. In this case, it is a clear uptrend.

Every Moving Average has its own level of smoothness. This essentially means how quickly the MA line reacts to the change in price. To make a Moving Average smoother, we can easily do so by choosing the average closing prices of many candles. In simpler words, higher the number of periods chosen, smoother is the Moving Average.

Selecting the appropriate ‘Length’ (Period) of a Moving Average

The ‘length’ of the Moving Average affects how this indicator would look on the chart. When we choose an MA with a shorter length, only a few data points will be included in the calculation of that MA. This results in the line overlapping with almost every candlestick.

The below chart gives a clear idea of a small ‘length’ Moving Average.

The advantage of a smaller length moving average is that every price will have an influence on the line. However, when a moving average of small ‘length’ is chosen, it reduces the usefulness of it, and one might not get an insight into the overall trend.

The longer the length of the moving average, the more data points it ll have. This means every single price movement will not have a significant effect on the MA line. The below chart gives a clear idea of a long ‘length’ moving average.

On the flip side, if too many data points are included, large and vital price fluctuations will never be considered making the MA too smooth. Hence we won’t be able to detect any kind of trend.

Both situations of choosing ‘lengths’ can make it difficult for users to predict the direction of the market in the near future. For this reason, it is crucial to choose the optimal ‘length’ of the Moving Average, and that should be based on our trading time frame and not any random number.

Conclusion

Moving Averages generate important trading signals and especially when two MAs are paired with each other. They give both trend continuation and reversal signals with risk-free trade entries. A simple way of reading the MA line is as follows – A rising MA indicates that the underlying currency pair is in an uptrend. Likewise, a declining MA means that the currency pair is in a downtrend.

In the next article, we will be learning two critical types of moving averages – Simple Moving Average and Exponential Moving Average, along with their applications on the charts. Stay Tuned!

[wp_quiz id=”65304″]
Categories
Forex Course

69. Fibonacci Trading – Detailed Summary

Introduction

In the past eight lessons, we have learned many things about Fibonacci levels and ratios. We have understood various applications of these levels and identified many ways through which we can profit from these levels. In this article, we are going to summarize all the learnings related to Fibonacci. This article acts as a quick recap of what we have understood until now.

Taking a Trade Using Fibonacci Levels

Entering a trade using the Fibonacci levels is pretty straight forward. We have to wait for the price to retrace and reach the appropriate Fib levels. In an uptrend, these Fib levels are 50% and 61.8%. In a downtrend, these levels are 50% and 38.2%. Hence, both 61.8% & 38.2% are known as Golden Fib ratios. Once the price reaches these levels, you can enter a trade after getting a confirmation. A detailed explanation of this can be found in this article.

Pairing Fibonacci Levels With Other Technical Tools

Fibonacci levels can be used stand-alone to enter a trade. But it is always recommended to use other technical tools to be extra sure about your trades. This is because the Fib levels are not foolproof. That means the price may not respect these Fib levels 100% of the time. More about this can be understood here.

So, to be extra affirmative on what you are doing, make sure to combine the fib levels with other reliable indicators. Some of the tools we used to explain this concept are Support & Resistance levels, Trendlines, Candlestick Patterns, etc.

Using Fibonacci Levels For Risk Management

Not just for entires, Fibonacci levels can also be used for managing and exiting a trade. We know how important risk management is in trading. These levels will help us in managing risk and maximizing profit if used correctly. What we are trying to tell here is that Fib levels act as a perfect tool to place our Stop-Loss and Take-Proft orders accurately.

Fibonacci extensions must be used to decide the placement of various Take-Profit levels. To place accurate Stop-Loss, just used the Fib level, which is below the point of entry in an uptrend. Likewise, use the Fib level, which is above the point of entry in a downtrend. For a more detailed explanation, you can refer to the below articles.

Stop-Loss | Take-Profit

Downloading The Fibonacci Indicator

Fibonacci indicators these days are very well designed and readily available in the market for free. Almost all of the trading platforms are equipped with a Fibonacci indicator that can be accessed on to the charts with just a click. If you are using the TradingView platform, a comprehensive Fibonacci indicator is present in the left side panel. If you are a MetaTrader user, there are some default Fib indicators, but the best one is the Auto Fib, which can be downloaded here.

Other Applications Of Fibonacci Levels

The applications of the Fibonacci levels are not confined to the ones discussed above. There are many other places where these ratios & levels are used for various other reasons. For instance, to confirm almost all of the Harmonic patterns, we use Fibonacci levels. An example of one such article can be found here. In this example, we have confirmed the formation of the Butterfly pattern on the price charts by using Fibonacci levels alone. So every technical trader needs to know and learn how to use these levels to have the edge over financial markets.

That’s about Fibonacci levels. If you have any doubts, let us know in the comments below. In the upcoming course lessons, we will be discussing more technical tools like Moving Averages, Indicators, Oscillators, etc. Hence, stay tuned for more informative content.

Categories
Forex Course

68. Using Fibonacci Retracements To Place Appropriate Stop-Loss

Introduction

Until now, we have paired the Fibonacci levels with various technical tools to find appropriate trading opportunities. Some of them include support/resistance, trendlines, and even candlestick patterns. In the previous lesson, we also saw how to place appropriate ‘take-profit’ orders to maximize our profits. The uses of the Fibonacci levels do not end here. There is another incredible application of these levels, and that is to find the appropriate ‘stop-loss’ levels. ‘

As a trader, one should always use the ‘Stop-Loss’ orde as they are critical to avoid the risk of bearing huge losses. In some adverse situations, if this order is not used, it would result in a complete drain of trading capital where we can have the risk of losing everything in a single trade. Placing an appropriate stop-loss ensures that we do not expose ourselves to the unbearable risk.

However, placing the stop-loss order randomly might expose us to the risk of getting stopped out very early. So the proper placement of this order is crucial, and it can be hard for traders who aren’t experienced enough. So the Fibonacci tool can be a great help for us in determining accurate stop-loss levels.

Using Fibonacci Levels To Place Appropriate Stop-Loss Orders

In the below chart, we see a big initial move to the upside on which the Fibonacci levels are plotted using the Swing low and Swing high. Using the ‘Fibonacci strategy,’ we can notice a retracement that has reacted fairly well from the 61.8% Fib level, and now if the next candle is green, this could be a confirmation for us to go ‘long.’

We notice in the below chart that the next candle appears to be Green, and now with that confirmation, we can place our ‘buy’ trades with appropriate ‘stop-loss’ and ‘take profit.’ The traditional way of using a stop-loss order is to place it 50 pips away from the point of entry. Most of the novice traders use this method even today. This is said to be a layman’s approach with no suitable reasoning. When we use such methods, there is a high chance of we getting stopped out before the trade moves in our favor.

The below chart shows that how placing a 50 pip stop-loss can prove to be dangerous. We can see the stop-loss getting triggered by the immediate next candle after the entry was made.

Now let’s see how to place the stop-loss order using Fibonacci levels. The strategy is to place the stop-loss at the Fib level, which is below the Fib level from where the retracement reacts and gives a confirmation candle. Taking the above example, since the retracement touched the 61.8% Fib ratio and gave a confirmation candle, the stop-loss will be placed at the 78.6% Fib ratio. This seems to be very simple, yet most traders are not aware of this.

In the above chart, we can see how the price just misses our stop-loss placed at the 78.6 Fib level and later directly went to our take-profit. This shows the precision of stop-loss placement, which was established using the Fibonacci levels.

Conclusion

We must understand that stop-loss determination is a crucial step and has to be calculated mathematically using any reliable technical indicators. Indicators like Fibonacci have a mathematical approach in determining these levels. Make sure to use these levels before going to place your stop-loss levels next and let us know how they have worked for you. Cheers!

[wp_quiz id=”64961″]
Categories
Forex Course

66. Pairing The Fibonacci Levels With Trendlines

Introduction

In the previous articles, we learned how Fibonacci retracements give extra confirmations while trading the support & resistance levels. We also know that Fibonacci levels can be used as a confirmation tool to trade many candlestick patterns as well. Now we shall extend this discussion and understand how Fibonacci retracements can be traded using the trendlines.

Trendlines are a crucial part of technical analysis. They are primarily used to identify trends, be it up or down. Trendlines being such an important part of trading, when combined with the Fibonacci indicator, can produce trades that have the highest probability of winning. So let us see how this can be done.

Combining Fibonacci Levels & Trendlines

In the below chart, we have, firstly, identified an uptrend and drew a supporting trendline to it. The next step is to plot Fibonacci on the chart by identifying a swing low and a swing high. The marked area shows where all our trading is going to take place and the region in which we will find our swing low and swing high.

The traditional way of selecting a swing low is when the point intersects with the trendline, just as we have done in this case (below image). The swing high will be the point where the market halts and reverses for a while.

In the below chart, we have used the chosen a swing low and swing high to plot our Fibonacci indicator. In order to combine the Fibonacci with trendline, we must wait to see if the retracement from the swing high touches the 50% or 61.8% Fib level. After touching any of these levels, if the market gives a confirmation candle, it could be a perfect setup to go long. The retracement, in this case, touches the 50% level, which coincides exactly with the upward trendline. The next and final step is to look for a confirmation candle, if any.

We have gotten a confirmation sign from the market after the second green candle closes above the 23.6% Fib level (below image). Hence traders can now take risk-free positions on the ‘long’ side of the market with a stop-loss below the 61.8% Fib level and with an aggressive target above the recent high. This trade results in a risk to reward ratio of 1.5.

We should not forget that if the retracement does not take support at the 50% or 61.8% Fib level and goes further down, breaking all the levels, it could be a potential reversal sign. Thus the retracement that is coinciding with the trendline and reacting from 50% or 61.8% Fib level is the thumb of the rule of this strategy.

The above is a more widened image of the chart shows that the market continues to trend upwards, crossing our ‘take-profit‘ area. To take advantage of the market’s trending nature, we can place a trailing stop-loss order to maximize our profits.

Conclusion

When trends start to develop in the market, one should start looking for ways to go ‘long’ or ‘short’ by using necessary technical indicators that give a better chance of a profitable trade. The Fibonacci indicator is one such powerful tool to help traders find potential entry points. We hope you understood this concept clearly. Let us know if you have any questions in the comments below. Do not forget to take the quiz before you go. Cheers!

[wp_quiz id=”64779″]
Categories
Forex Course

67. Using Fibonacci Extensions To Place Accurate Take-Profit Orders

Introduction

We have discussed the many applications of the Fibonacci levels in our previous course lessons. Now its time to explore the scope of these levels in the most integral part of trading, which is money management. We are all familiar with the ‘take-profit’ order and also know how crucial it is to determine the same before entering a trade.

There are numerous ways to determine the ‘take-profit‘ levels to maximize our profits, but the Fibonacci levels are said to be extremely accurate. In this article, we will validate the accuracy of the Fibonacci indicator in determining the ‘take-profit’ levels.

Placing Accurate Take-Profit Order Using Fib Levels

To find a trade, we need first to establish a significant trend. The primary trend could either be a continuation of a previous trend or beginning of a new trend after a market reversal. In the below chart, we can observe the market reversal to the upside. We must wait for its retracement; if the retracement follows all the rules of our Fibonacci strategy (discussed in the Fibonacci article), we can proceed to take the trade.

In the below image, we can notice a pullback coming in from the swing high. We will be evaluating this swing high using the Fibonacci levels. The Fibonacci levels used in this particular strategy for determining the accurate ‘take-profit’ placement are different from the usual Fibonacci levels we used in all the previous articles.

We are going to use ‘Fibonacci Extensions’ instead of retracements here. These extensions can be plotted on to the charts by using an indicator that can be found in most of the trading platforms. We use the Tradingview platform for our charting purpose, and this indicator can be found on the drawing panel of TradingView. It is available in the sub-menu of the Fibonacci tool folder and named as ‘Trend-Based Fib Extension.

To plot Fibonacci extension on the chart, first, click on a significant low, then drag the cursor and click on the recent high. Finally, drag the cursor back to the swing low. We can also highlight the Fib ratios by clicking on the retracement levels. Don’t forget to include the Fib ratios on the chart that are above 100%, as our take-profit methodology is based on those ratios.

The below chart shows how the Fibonacci Extensions are plotted on the chart using the swing low and swing high. We also see from the chart that the retracement is exactly reacting from the 50% Fib levels, which could a sign of trend continuation. But to be sure, it is prominent to have a confirmation candle at this place.

We get a bullish confirmation candle in the direction of the dominant trend, after which a potential trade entry can be made to the ‘buy’ side.

Right after entry, it is essential to determine our take-profit and stop-loss areas. Here is the part where we will be using our Fibonacci Extensions. The strategy is to take some profits at 127%, and then at 141% and remaining profits at 161%.

The take-profit points are clearly shown in the below chart. One can see that the market falls exactly after touching the respective Fib extension levels. By following this method, one can maximize their gains by taking profits at every subsequent point. The risk to reward ratio in this trade is also outstanding.

The below chart shows that the market continues to take support at the 50% fib level and eventually breaks out above our final take-profit order. The trend has completely reversed from a downtrend to an uptrend.

Conclusion

The Fibonacci tool can be used to find potential exit points in a trade with a great degree of accuracy. Hence, rather than taking a simple approach to determining the target points of the trade, we must make use of Fibonacci Extention levels to maximize our grains. Please remember that these extensions are not guaranteed levels too. So it is important not to depend upon them completely. Cheers!

[wp_quiz id=”64724″]
Categories
Forex Course

65. Combining Fibonacci Levels With Candlestick Patterns

Introduction

In the previous lessons, we understood how Fibonacci levels could be combined with trendlines to generate confirmation signals. After discussing many applications of the Fibonacci indicator, we are now ready to explore some complex strategies using these levels. In this lesson, we will be discussing how the Fibonacci levels can be used with Japanese candlestick patterns.

The candlestick patterns are an intrinsic part of trading, and we cannot ignore them. We have learned many candlestick patterns in the previous lessons, and you can find them starting from here. We have also learned that these patterns can not be used stand-alone, and we should be using any reliable indicators to confirm the signals generated by these patterns. So we will be using Fibonacci retracements to confirm the opportunities generated by the chart patterns.

For the explanation purpose, let’s discuss one of the most reliable candlestick patterns – Dark Cloud Cover. To know more about this pattern, you can refer to the second part of this article. We will be trading the market today by combining both Fibonacci levels and the Dark Cloud Cover pattern.

Strategy – Dark Cloud Cover Pattern + Fibonacci Levels 

For explaining the strategy, we considered a downtrend, on which we will be plotting our Fibonacci indicator and later evaluate its retracement. The below chart shows the same with a trading region in which we will be identifying our swing high and swing low. We will also see if the retracement shown in the chart is going to react at the important Fib levels.

In the below chart, we can see the market has moved down quite swiftly from the swing high to swing low. This shows the strength of the underlying downtrend. Trading a retracement of a strong and big move on any side is always preferable. The next step is to plot the Fibonacci levels on the chart.

After the Fibonacci indicator is rightly plotted as shown in the below chart, let’s see what happens at the important Fibonacci levels, such as 50% or 61.8% level. In the chart below, we see that the last Red candle of the retracement exactly touches the 50% level and closes midway of the previous Green candle.

These two candles together remind us of one of the very well known candlestick patterns – The Dark Cloud Cover. More importantly, this pattern is formed exactly at the 50% Fib level. So if we get a confirmation to the downside, it could result in a perfect setup to go short on this pair.

In the above picture, we can clearly see the formation of a bearish confirmation candle. So we can confidently take short positions in the market by placing a stop-loss near the 61.8% level with a target below the recent low.

The above chart shows how the trade works in our favor by hitting our pre-determined ‘take profit.’ We can see that, right after the entry was made, the market moves so fast in the direction of the trend producing continuous red candles. This shows the accuracy of candlestick patterns when combined with indicators like Fibonacci. Since the market is still in a strong downtrend, aggressive traders can take profit at the second or third swing low of the trend, after crossing the initial ‘take-profit.

Conclusion

From the previous articles, we have seen how the Fibonacci tool can be used with support resistance levels, trendlines, and now even candlestick patterns. By this, we can be assured that the Fibonacci tool is potent and should never be underestimated. Instead, we recommend you to widen its usage in technical analysis to identify more accurate trading opportunities.

[wp_quiz id=”64541″]
Categories
Forex Course

64. Trading Support & Resistance Levels Using Fibonacci Levels

Introduction

In the previous lessons, we understood how to use the Fibonacci tool to trade the pullback of a trend. We have also learnt how these Fib levels are not foolproof. Now, in this lesson, let’s extend this discussion to see how the Fibonacci tool can be used in conjunction with Support and Resistance – arguably the most critical levels on a price chart.

Support is the area where the price rejects to go down and bounce back further. This area acts as a floor where the price gets stopped. Resistance is the opposite of Support. At this level, the price finds it very hard to go up as it acts as a ceiling. The general idea is to buy at the Support and sell at Resistance. But blindly buying and selling at these levels carry huge risk as there is no guarantee that these levels will work each time.

So let’s use Fibonacci levels to determine the working of these S&R levels. Basically, we are combining both Support Resistance and Fib levels to increase the accuracy of trading signals generated. Let’s get started.

In the below chart, we have identified a strong resistance area, and now we must wait to see if it creates an area of Support after breaching the Resistance. It is always advisable to buy at ‘resistance turned support.’ Also, if the price has broken a strong resistance with multiple touches, there is a higher chance of it turning into Support. At the marked region below, we can see the price breaking the strong resistance area.

In the marked regions below, we can see the price retracing after breaking the Resistance. So in order to combine this support resistance level with Fib levels, we must identify the swing low and a swing high. As we can see below, we have also plotted the Fibonacci levels on the chart using a Fib indicator.

Ideally, if we get a retracement at the 61.8% Fib level and a confirmation candle, we can confidently enter for a buy. If the market does not react at any of the Fib levels, this could be a sign that the Support is no longer strong, and it can be broken.

As per the theory of Support and Resistance, the market must react at the previous Resistance and bounce off. From the below chart, it is clear that the retracement has reached our S/R line, which is exactly coinciding with the 61.8 Fib level. Now it is a clear indication for us to go long once we see a confirmation candle.

In the below chart, we can see that the price has exactly bounced off from the 61.8% Fib level and printed a bullish candle giving us a confirmation sign. Right after the confirmation candle, we can place our buy trade with a stop-loss at 78.6% Fib level and take-profit anywhere near the high.

Further, in the below chart, we can see the market making higher highs breaking the previous resistance levels. From this trade, we learn that, when Fibonacci is used near S/R as a confirmation tool, it increases the odds of that level performing. The price will surely take Support at the Fib levels and continue its trend.

One can notice that the ‘buy’ happens precisely at the 61.8% Fib level near Resistance turned support line. The market continues to take Support at this level until, eventually, it breakouts on the upside. This shows the power of the Fibonacci indicator when combined with S&R levels.

There are many other credible indicators that are reliable and can be combined with S&R levels. But Fibonacci is one of the most used ones by the traders across the world.

[wp_quiz id=”64461″]
Categories
Forex Course

63. Reasons Why We Should Never Completely Depend On Fib levels?

Introduction

In the previous article, we learnt how exactly to trade using the Fibonacci levels. There are many other ways through which Fib levels can be traded. Some of them include trading these levels using S&R, Trendlines, and even candlestick patterns. Before learning all of these ways, we must know that these levels are not guaranteed and cannot be traded stand-alone. So in this article, let’s discuss why one should be very careful while trading Fibonacci retracements.

Fibonacci Levels Will Not Be Respected Always

Every technical level ultimately breaks at a certain point in time, and that is the case with Fibonacci levels as well. In the previous article, we had learnt that Fibonacci levels also act as potential support and resistance areas. So these levels do break just as how S&R levels break. Therefore we must keep in mind that these levels are not foolproof.

Let’s understand this with the help of an example. But before that, make sure to read our article on ‘How to trade Fib retracements’ to understand this better. You can find that lesson here.

In the price chart below, we can see an initial big move to the downside. So basically, here we must wait for the retracement, and that retracement must touch the Fibo levels. Let’s see what happens in the next step.

We saw the retracement (below chart) of the downward move, and we have placed the Fib levels from swing high to swing low since it is a downtrend.

Then we can see the retracement reaching the 50% Fib level and holding there. Ideally, at this point, the retracement must stop, and the market’s original downtrend should continue. Also, we should be placing our ‘sell’ trades as the Red confirmation candle can clearly be seen.

But, to our surprise, we observe that the price did not respect our strategy, and the market shot up to the north, violating all the Fibonacci levels, as shown in the below chart.

While Fibonacci retracement levels give us a high probability of the trade working in our favor, like any other technical analysis tool, they don’t always work. One can never be entirely certain that the price will respect the 50% or 38.2% or any Fibonacci level for that matter.

If you are an experienced technical trader, you wouldn’t have placed a sell trade in the above scenario. It was clear that the sellers are losing momentum. The formation of a bearish Doji candle at the bottom (below chart) is another confirmation of a trend reversal.

So we should be looking at the bigger picture, or we should take the help of any other technical tools to confirm the signals generated by the Fibonacci levels. Never completely depend on them.

Conclusion

Apart from the things that we discussed above, there is another issue while using these Fib ratios, which is determining the appropriate swing low and swing high. Everyone looks at charts differently. They trade at different time frames and have their own fundamental reason for buying or selling the currency pair.

Swing high for one trader might likely be different than swing high for another. And when the Fib ratios are placed incorrectly, of course, the trading signals generated won’t be accurate. Also, the prerequisite for Fibonacci trading is trending markets. When the market is in a consolidation or moving sideways, it is obviously not possible to trade with these ratios.

We hope you understood this lesson well. If you find this complicated or if you have any questions, please let us know in the comments below. Cheers.

[wp_quiz id=”64257″]
Categories
Forex Course

62. Using Fibonacci Retracements To Enter A Trade

Introduction

In the previous article, we understood the definition of Fibonacci and how the Fibonacci levels are derived. Now we shall see how to use these levels to enter a trade and formulate a trading strategy around it.

The strategy we are going to discuss can be used not just in the Forex market. It can also be used in different other markets such as Stocks, Commodities, Cryptocurrencies, and ETFs. This is essentially a trend trading strategy that takes advantage of a pullback in a trend. The Fibonacci levels later prove to be critical areas of support and resistance that most traders keep a close watch on. Let’s get started with the strategy.

Step 1: Identify an initial big move. We are going to trade its retracement.

A trend helps the traders to identify the direction of the market and to determine where the market will head further. A big price movement indicates that the market has reversed from its original direction and will possibly continue further in that direction.

In this example, we have identified a big move on the upside, and we shall see how to trade its retracement to join the trend. Let’s use Fibonacci levels to enter the trend at the right time.


Step 2: Use the Fibonacci tool and plot the levels on the chart

After placing Fibonacci levels on the chart, we need to wait for a retracement and see where it touches the Fib levels. The most desirable condition is when the price bounces off after touching the 50% or 61.8% fib ratio. These ratios are also known as Golden Fib ratios. In the below chart, we can see the formation of a bullish candle as soon as the Red candle reaching the 61.8% level.

In an uptrend, always make sure to plot the Fib levels from Swing Low to Swing High. Likewise, in a downtrend plot, the Fib levels on the chart from Swing High to Swing Low.

Step 3: Enter only after confirmation 

Typically, traders are taught to place their buy orders as soon as the price reaches the 61.8% level. Do not do that. Only place the trades after the appearance of at least a couple of bullish candles. In the below chart, the formation of a green candle at 61.8% gives us an additional confirmation that the trend is going to continue after the retracement. Traders can also confirm this buy signal by using reliable technical indicators. This is how the chart would look at the time of entering the trade.

Step 4: Take-Profit and Stop-Loss placement

It is important to place accurate Stop-Loss and Take-Profit orders to mitigate the risk and maximize profits. In this strategy, stop-loss is placed just below the 61.8% Fib level. If the price breaks this Fib level, the uptrend gets invalidated, and we can expect the beginning of a downtrend.

We can place the take-profit order at the nearest’ high’ of the uptrend and trail the stop-loss until it is triggered. The minimum risk to reward of this trade is 1:1, which is not bad. But since it is a continuation of the trend, we can wait until it makes a new high and take profits there. This will result in a 1:2 risk to reward trade.

Below is how the setup of the final trade looks like.

We can clearly see the price respecting the Fibonacci levels, and the trade here went exactly the way we predicted.

Conclusion

Fibonacci retracements are a part of the trend trading strategy that most traders observe during an uptrend. Traders try to make low-risk entries in the direction of the trend using these Fibonacci levels. It is believed that the price is highly likely to bounce from the Fibonacci levels back in the direction of the initial trend. These Fib levels can also be used on multiple time frames. When this tool is combined with other technical indicators, we can predict the outcome of the trade with a greater degree of accuracy.

[wp_quiz id=”63028″]
Categories
Forex Course

60. Introduction To Fibonacci Trading

Introduction

We have completed learning most of the basics related to candlesticks and its patters in the previous lessons. In the upcoming articles, let’s upgrade our technical trading skills by learning Fibonacci Trading. This field of study deals with trading the price charts using Fibonacci levels and ratios. In this article, we will briefly talk about what this Fibonacci trading is all about.

Fibonacci levels and ratios were devised by a famous Italian mathematician, ‘Leonardo Fibonacci.’ This Italian number theorist introduced various mathematical concepts that we use in the modern world, such as square roots, math word problems, and number sequencing.

Leonardo Pisano Fibonacci 

Picture Source – Thoughtco

He found out a series of numbers that created ratios. The ratios described the natural proportion of things in the universe. The ratios are derived from the following number series: 0, 1, 1, 2, 3, 5, 8, 13, 21, 34, 55, 89, 144. This number series always starts at 0 and then adding 0+1 to get 1, which is the third number. Then, adding, the second and third numbers to get 2, which is the fourth number and so on.

The Fibonacci ratios are generated by dividing a Fibonacci number to its succeeding Fibonacci number. For instance, both 34 & 55 are Fibonacci numbers, and when we divide 34 with 55, we get 0.618, which is a Fibonacci Ratio. We also call them as Fibonacci Retracements. If we calculate the ratios between two alternative numbers, we get Fibonacci Extensions. For example, when we divide 34 by 89, it will be equal to 0.382, which is a Fibonacci Extension. Below, we have mentioned a few Fibonacci Retracement and Extention values for your reference.

Fibonacci Retracements - 0.236, 0.382, 0.500, 0.618, 0.764 etc.

Fibonacci Extensions - 0, 0.382, 0.618, 1.000, 1.382, 1.618 etc.

Many theories say that once the market makes a big move in one direction, the price will retrace or return partly to the previous Fibonacci retracement levels before resuming in the original direction. Hence traders use Fibonacci retracement points as potential support and resistance levels.

Many traders watch for these levels and place buy and sell orders at these prices to enter or place stops. Traders also use Fibonacci extension levels as profit-taking zones. In order to apply Fibonacci levels on the charts, we need to identify Swing highs and Swing low points, which will be discussed in the upcoming articles.

Fibonacci trading is one of the major branches of Technical Analysis. So it becomes compulsory for every trader to learn what this is all about. In the 21st century, almost all of the brokers provide charting software where we can find Fibonacci tools like indicators and Fibonacci calculators, which makes this aspect of trading very simple and easy.

[wp_quiz id=”62566″]
Categories
Forex Course

59. Trading The Candlestick Charts Using Support and Resistance Levels

Introduction

In the previous few lessons, we have discussed many candlestick patterns and how to trade them. Those basics are very important for us to master Technical Analysis. Before leaving the Candlestick topics, let’s discuss THE most important concept in technical trading i.e., Support & Resistance. We shall first understand what Support and Resistance are, and will learn how to trade them on the Candlestick charts.

What Is Support?

Support is the level at which the price finds it difficult to fall below. Eventually, the price will bounce back up at this particular level. The support level acts as a floor that restricts price action to go down further. Some technical traders describe ‘Support’ as an area where demand overcomes supply. Because at this level, the demand for any currency will be more, hence the selling stops, and buying continues. The price reaction of any given asset would look something like the image below at the Support level. We can clearly see the price bouncing back up once it reaches the support level. (Blue Line = Support Level)

What Is Resistance?

Resistance is just the opposite of the support level. It is the level where price finds it difficult to break through to rise above until it is pushed back down. It acts as a ceiling restricting the price action to go up further. Basically, it is an area where supply overcomes demand. The price reaction of any underlying currency at a resistance looks something like the image below. We can see the price reaching the resistance line many times but unable to break through it. We must remember that at any point, Support can turn into Resistance and Resistance can turn into support. Hene, it is called S&R.

Pairing candlesticks with S&R

The fundamental method of technical trading is to buy at Support and Sell at Resistance. But this does not always work as there is no sure shot assurance that the Support and Resistance levels will hold for long. Hence traders need to look at other important factors while trading at Support and Resistance.

When buying near Support, we must wait for the consolidation at that area and only buy when the price breaks above that small consolidation. In that way, we can be sure that the price is respecting that level and is starting to move higher. The same concept applies when selling at resistance. Wait for consolidation and then enter a short trade when the price drops below the low of the small consolidation.

Below is an example of a short trade.

After entering the trade, make sure to place the stop-loss just below the low and above the high of Support & Resistance, respectively.

According to technical analysis principles, if a Support level or Resistance level is broken, their role is reversed, i.e., Support becomes Resistance and Resistance becomes Support. The psychology behind this phenomenon is that, when price breaches a key area, some will get out, and some hold on to their trades to see what happens. When price retraces back to the key area, people who have held it, go out and making the price bounce at the previous Support and Resistance.

Conclusion 

Traders always suspect a reversal at the key Support and Resistance as there is a high probability that price will reverse at these key levels. Some traders who had open positions exit at these price levels and others initiate new positions at these levels, depending on which side the price are they. Support and resistance levels are psychological levels at which many traders place orders to buy (support) or sell (resistance) making them supply or demand levels. That is why it is crucial to learn about Support and Resistance.  Also, support and resistance levels can be identified more easily using candlesticks, as a candle is very graphical, displaying wicks when the price bounces back from bottoms or tops. Identifying these significant levels forms the basis for Technical Analysis. Cheers!

[wp_quiz id=”61918″]