Introduction
In the previous two lessons, we completely understood the basics of pivot points as well as how to calculate and interpret them. And now, we can move on and start applying this indicator to our charts and find trading opportunities using it.
In this lesson, we shall use the pivots points in our range trading strategy. We will be giving you a complete guide on the trading range with the assistance of pivot points.
Incorporating Pivot Points into Ranges
The Basics
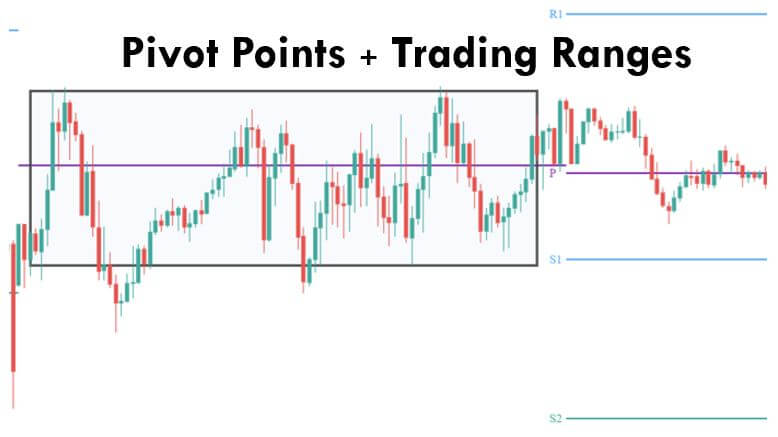
As we already learned, pivot point has S1, R1, S2, R2, etc. which represents Support and Resistance whose working principles are the same as the typical Support and Resistance. According to the definition, support is the area in which the market tends to hold and move up, and resistance is the area where the market holds and typically moves downwards.
Talking about a range, it is the state of the market which moves in a sideways direction and repeatedly bounces off from support and resistance level. So, we shall be testing the pivot points as the place where the market can hold and possibly reverse.
The Thumb Rule
When the market is at any of the upper Resistance levels, we look to go Short on the security. When the price is at any of the lower Support levels, we look to go Long on the security.
Live Chart Example
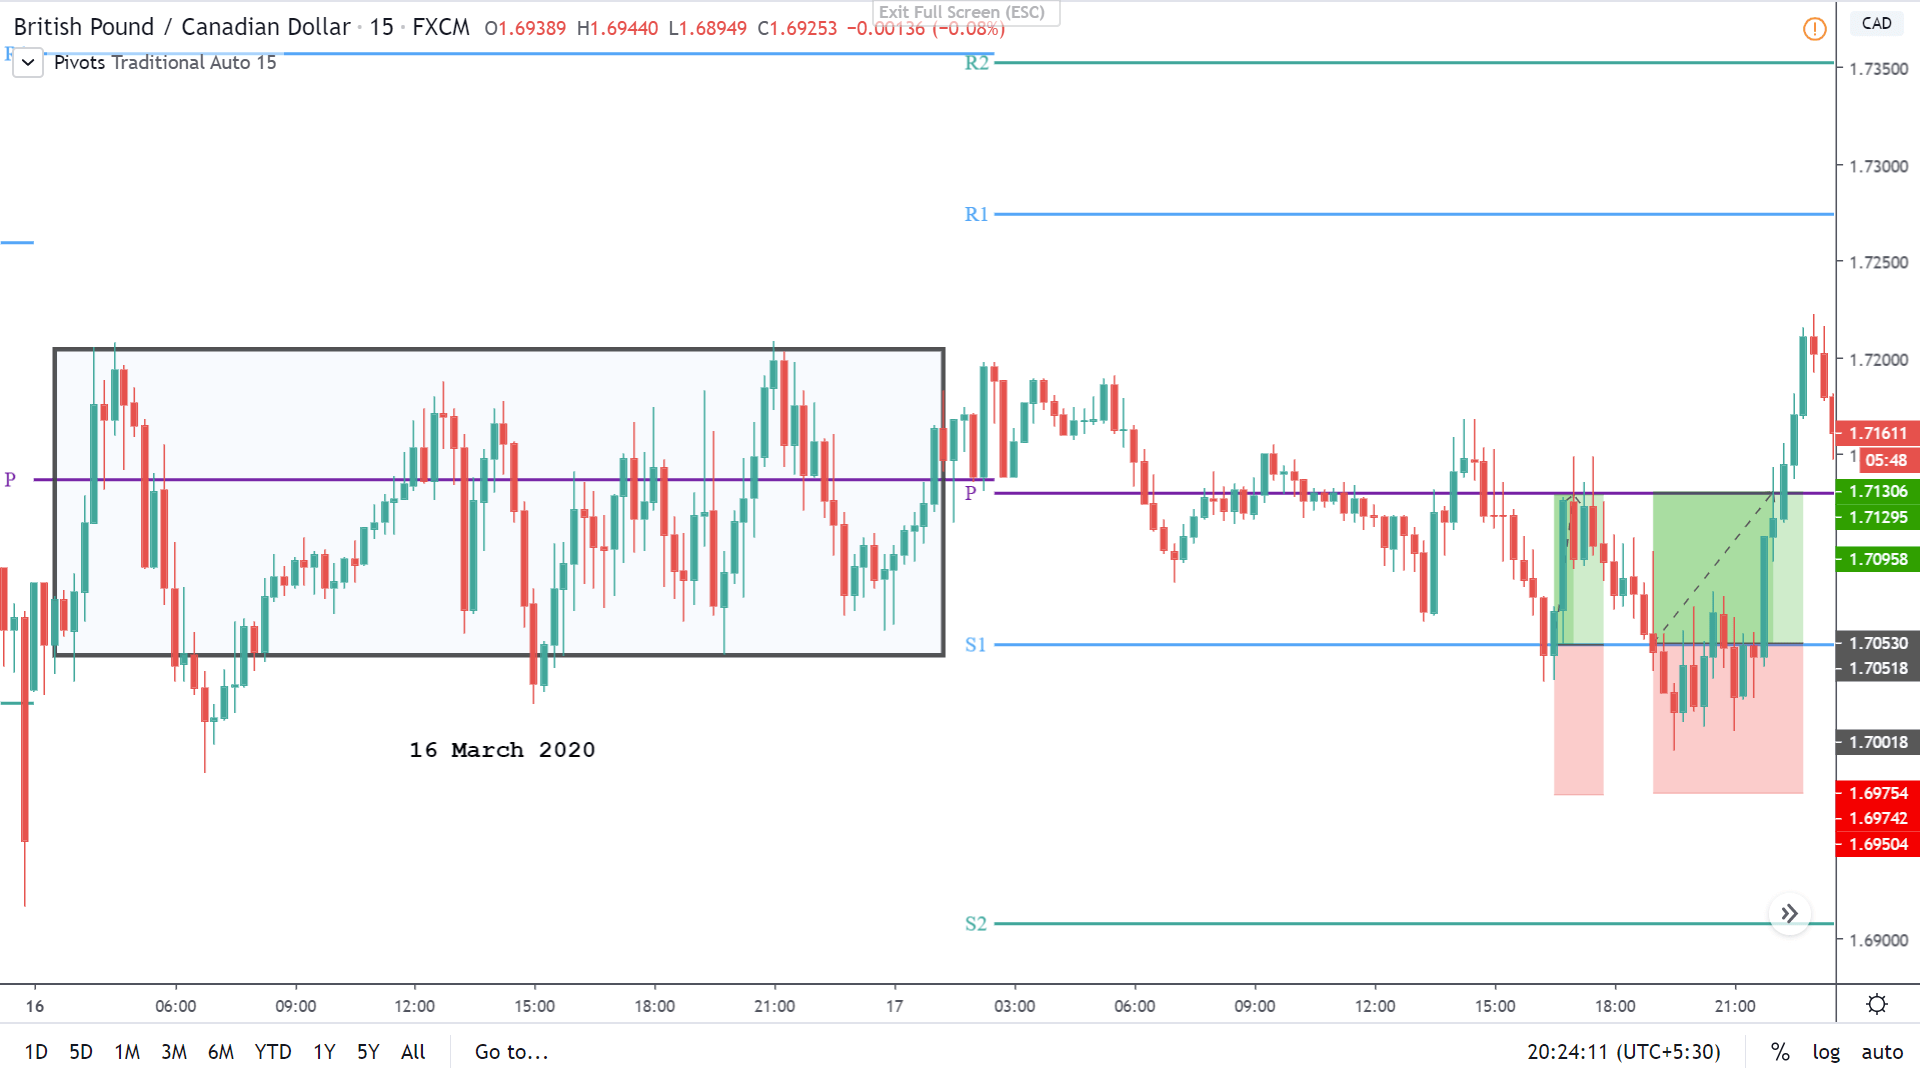
Below is the chart of GBP/CAD on 15min timeframe. We can see that currently, the market is in a range (as shown in the box). The market was ranging on the 16th of March. With these values of 16th March, we calculate the pivot points for the next day and find trading opportunities.

Now consider the same chart after we’ve determined the P, S1, R1, S2, R2 pivot levels. Following up range, we can see that the S1 level was formed exactly at the bottom of the range. Now, both S1 and the bottom of the range is indicating a Buy a signal. Hence, when the price touches the S1 level, we can go long on this pair.
From the chart, we can clearly see that we found two opportunities to hit the buy at the first Support level S1.
Placements
Having a predetermined take profit and stop loss is vital in trading. In this particular example, the take profit can be placed at the pivot point (P) and stop loss below the S1 such that the trade yields 1:1 Risk Reward. Note that there are times when the take profit can be placed at the R1 level as well. But this requires expertise in technical analysis as well as in pivot points.
The above example is the way for traders to get the hang of how to trade pivot points. To do it more professionally, one must use other technical analysis tools to have a confirmation on the pivot levels. For instance, if there appears a Doji candle at the S1 level and also the stochastic indicator is indicating that the market is in the oversold area, then there are more odds in our favor that the support will work in the direction we predicted.
So, to sum it up, one must use the pivot point levels by clubbing it with other technical tools to find optimum results. We hope you comprehended this lesson to the best of your ability. Cheers!
[wp_quiz id=”69435″]