Categories
Forex Signals

Gold Signal Closed In Profit – Quick Update Today! 

The safe-haven-metal prices failed to maintain its previous day gains and dropped to $1,730 from $1,740, the highest since June 02 while representing 0.35% losses on the day as the broad-based U.S. dollar recently took a U-turn from the multi-day low backed by the fresh US-China tussle and contributed to the yellow-metal losses as they both have an inverse relationship. On the other hand, the risk-off market sentiment triggered by fresh conflict between US-China turned out to be one of the key factors that kept a lid on any additional losses in the gold.  

At the USD front, the broad-based U.S. dollar drew bids on the day as investors lose their confidence about sharp economy recovery after details came from the U.S. Federal Reserve’s policy meeting the day before. The U.S. economy will collapse 6.5% this year, and the unemployment rate will be 9.3% by the end of the year, as per the Fed quarterly projections. The reason for the upticks in the U.S. dollar could also be attributed to the fresh on-ging tussle between the United States and China, which eventually fueled the risk-off market sentiment. 

The U.S. dollar was dropped to the lowest since March 10 instantly after the U.S. central bank hit a dovish tone the previous day. Wherein the U.S. Federal Open Market Committee (FOMC) decided to keep the benchmark rate unchanged. In the meantime, U.S. President Donald Trump’s cheer the Fed’s action.

Apart from this, the risk-off market sentiment was further bolstered by the fears of the coronavirus (COVID-19) second wave. The reason behind the risk-off market sentiment could also be associated with the report of the OECD latest Economic Projections. Wherein the report indicated the downside fears for the global economy due to the coronavirus (COVID-19).

Looking forward, the US-China tussle will gain market attention due to the light calendar and become worth watching for a near-term direction. At the data front, the U.S. Weekly Jobless Claims and Producer Price Index for May will be key to wait for new moves in the pair.


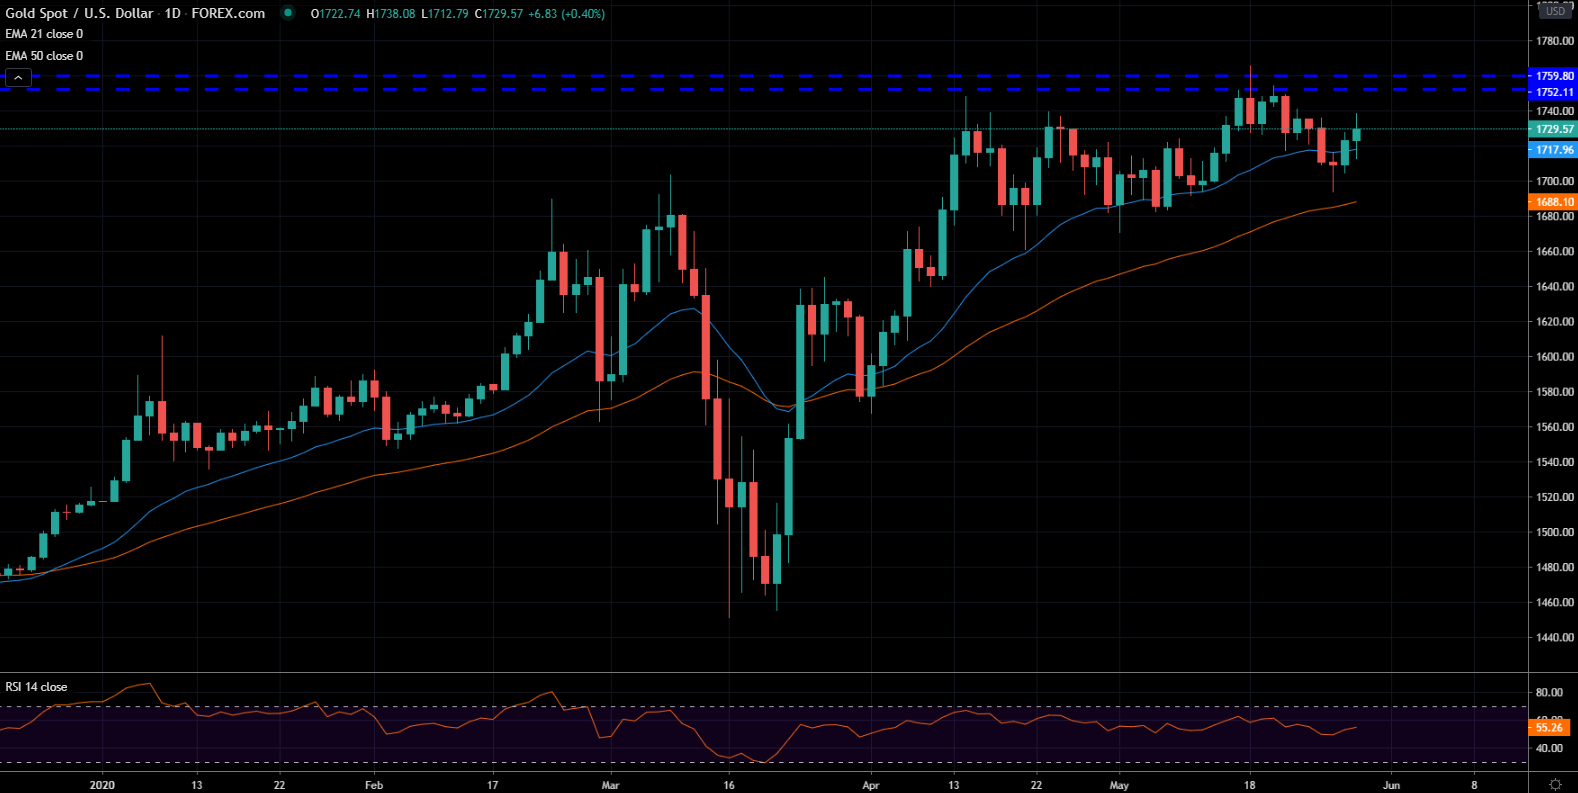
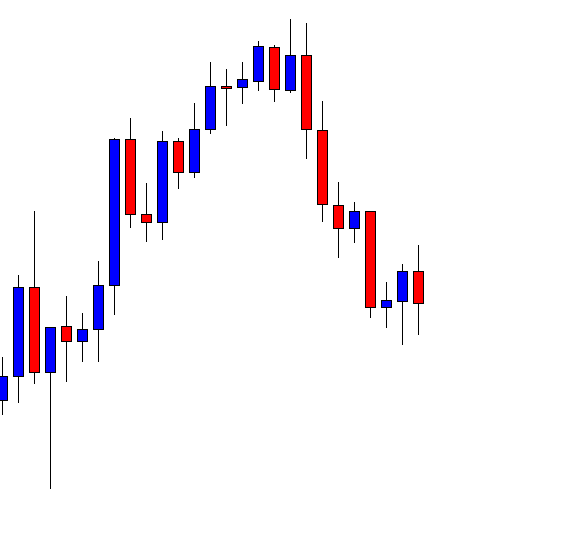
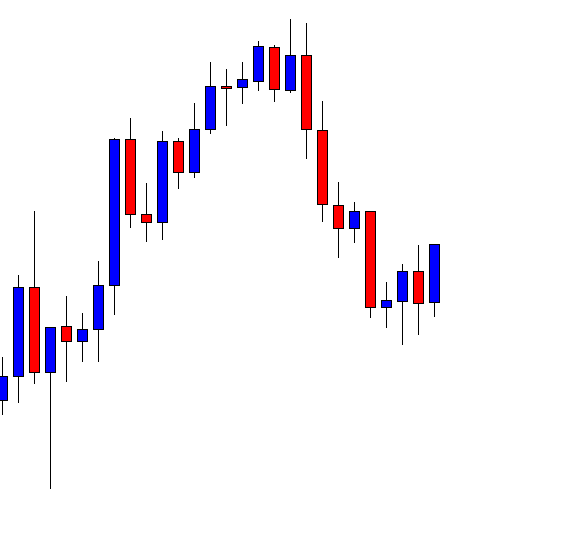
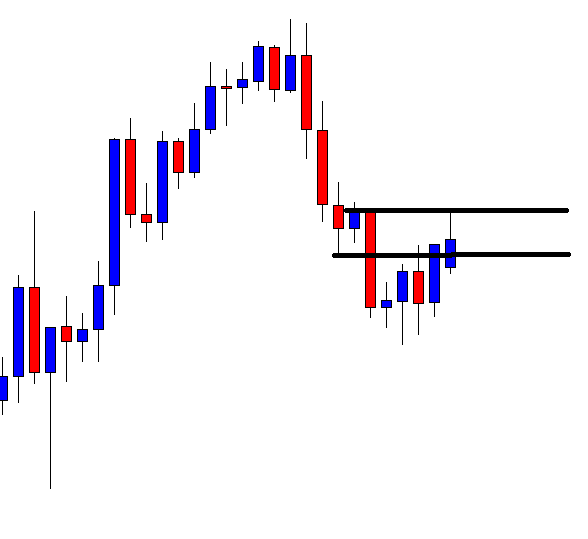
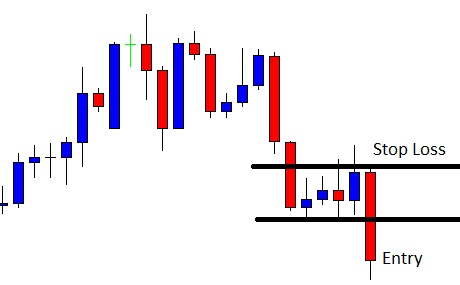
The yellow metal gold was on a bullish break due to the dovish FOMC strategy, where FED stated interest rates are expected to linger on hold until 2022. While they are expecting deflation in GDP, the weaker dollar is encouraging buying in gold; consequently, we may see gold prices flying higher until 1,745 in the coming days. Exactly before this, the overbought gold may sink a bit unto 1,726 range to achieve retracement. So, the immediate support for gold exists at 1,726 and 1,718 levels, while resistance visits at 1,738 and 1,745. So it was a good idea to close at in profit around 1,736 level as the market reversed right after that. 

Entry Price – Buy 1733.15    

Stop Loss – 1728    

Take Profit – 1740.15

Risk to Reward – 1

Profit & Loss Per Standard Lot = -$450/ +$600

Profit & Loss Per Micro Lot = -$45/ +$600

Categories
Forex Options

FX Options Market Combined Volume Expiries for 11th June 2020

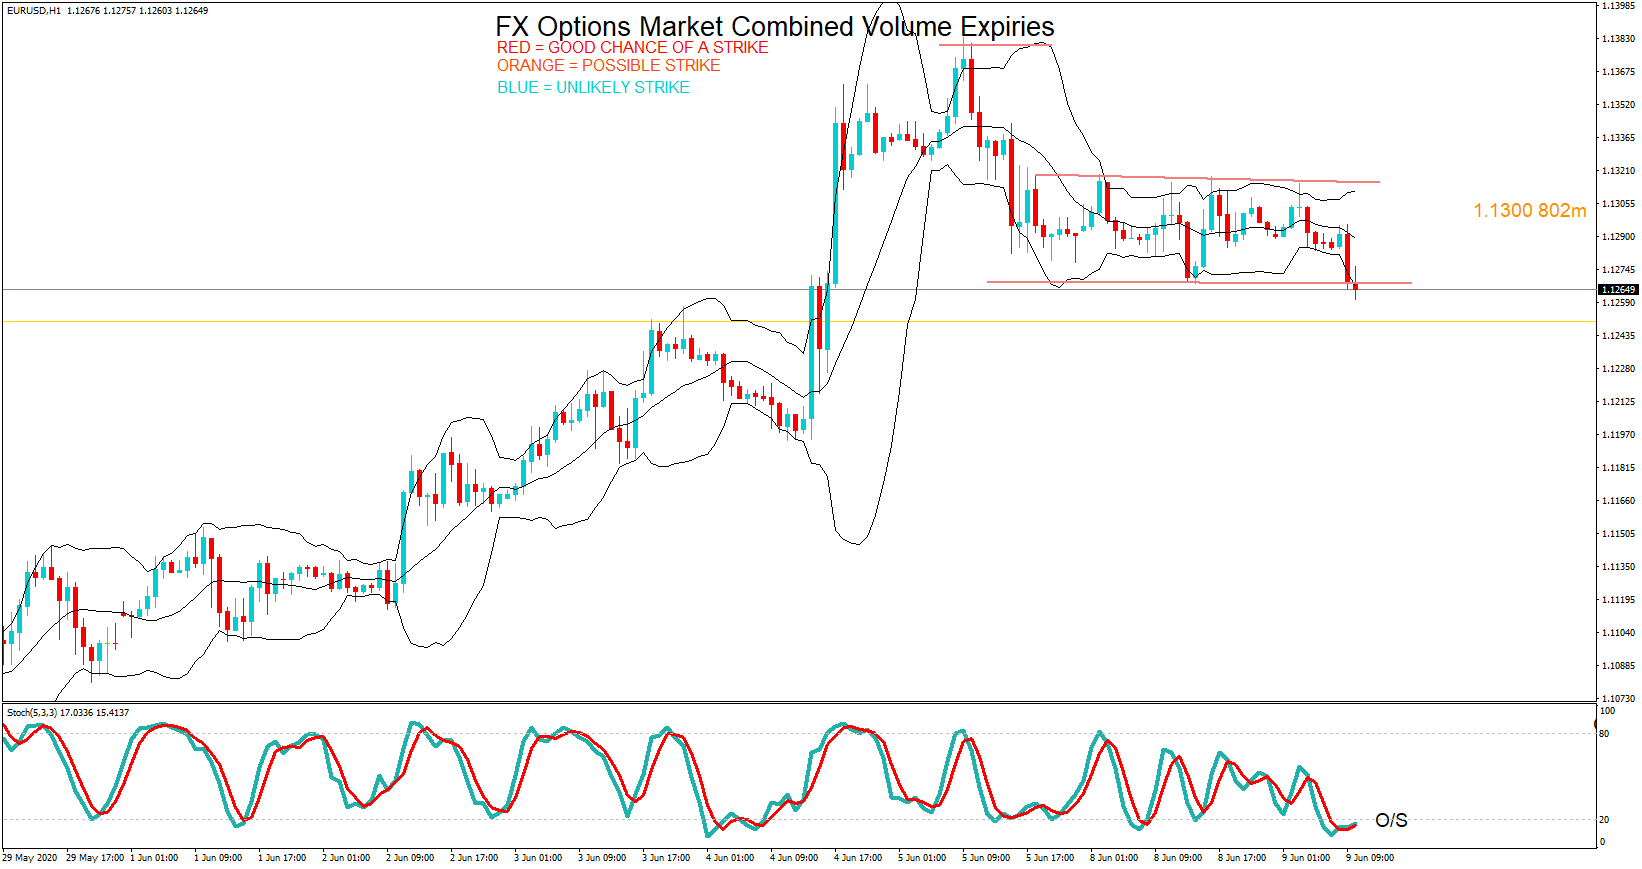
Thank you for visiting the Forex Academy FX Options market combined volume expiries section. Each day, where available, we will bring you notable maturities in FX Options of amounts of $100 million-plus, and where these large combined maturities at specified currency exchange rates often have a magnetic effect on price action, especially in the hours leading to their maturities, which happens daily at 10.00 AM Eastern time. This is because the big institutional players hedge their positions accordingly. Each option expiry should be considered ‘in-play’ with a good chance of a strike if labelled in red, still in play and a possible strike if labelled in orange and ‘out of play’ and an unlikely strike if labelled in blue, with regard to the likelihood of price action meeting the strike price at maturity.

…………………………………………………………………………………………………………………..

FX option expiries for June 11 NY cut at 10:00 Eastern Time, via DTCC, can be found below.

– EUR/USD: EUR amounts

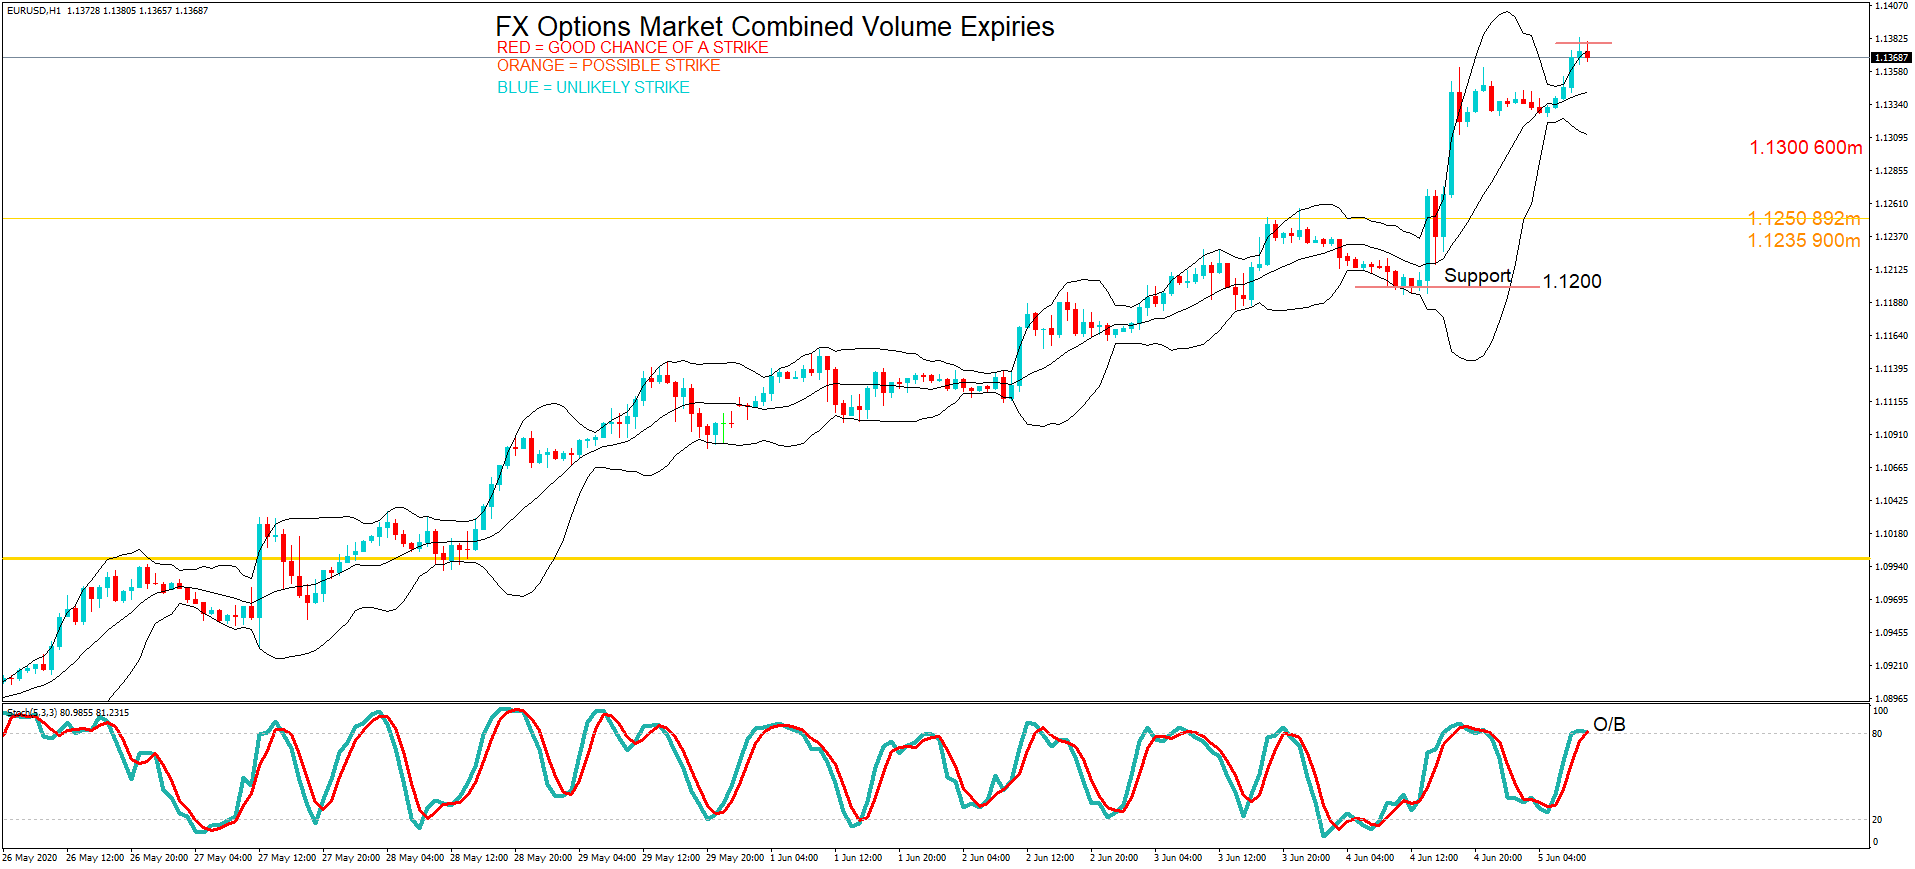
  • 1.1250 915m
  • 1.1350 642m

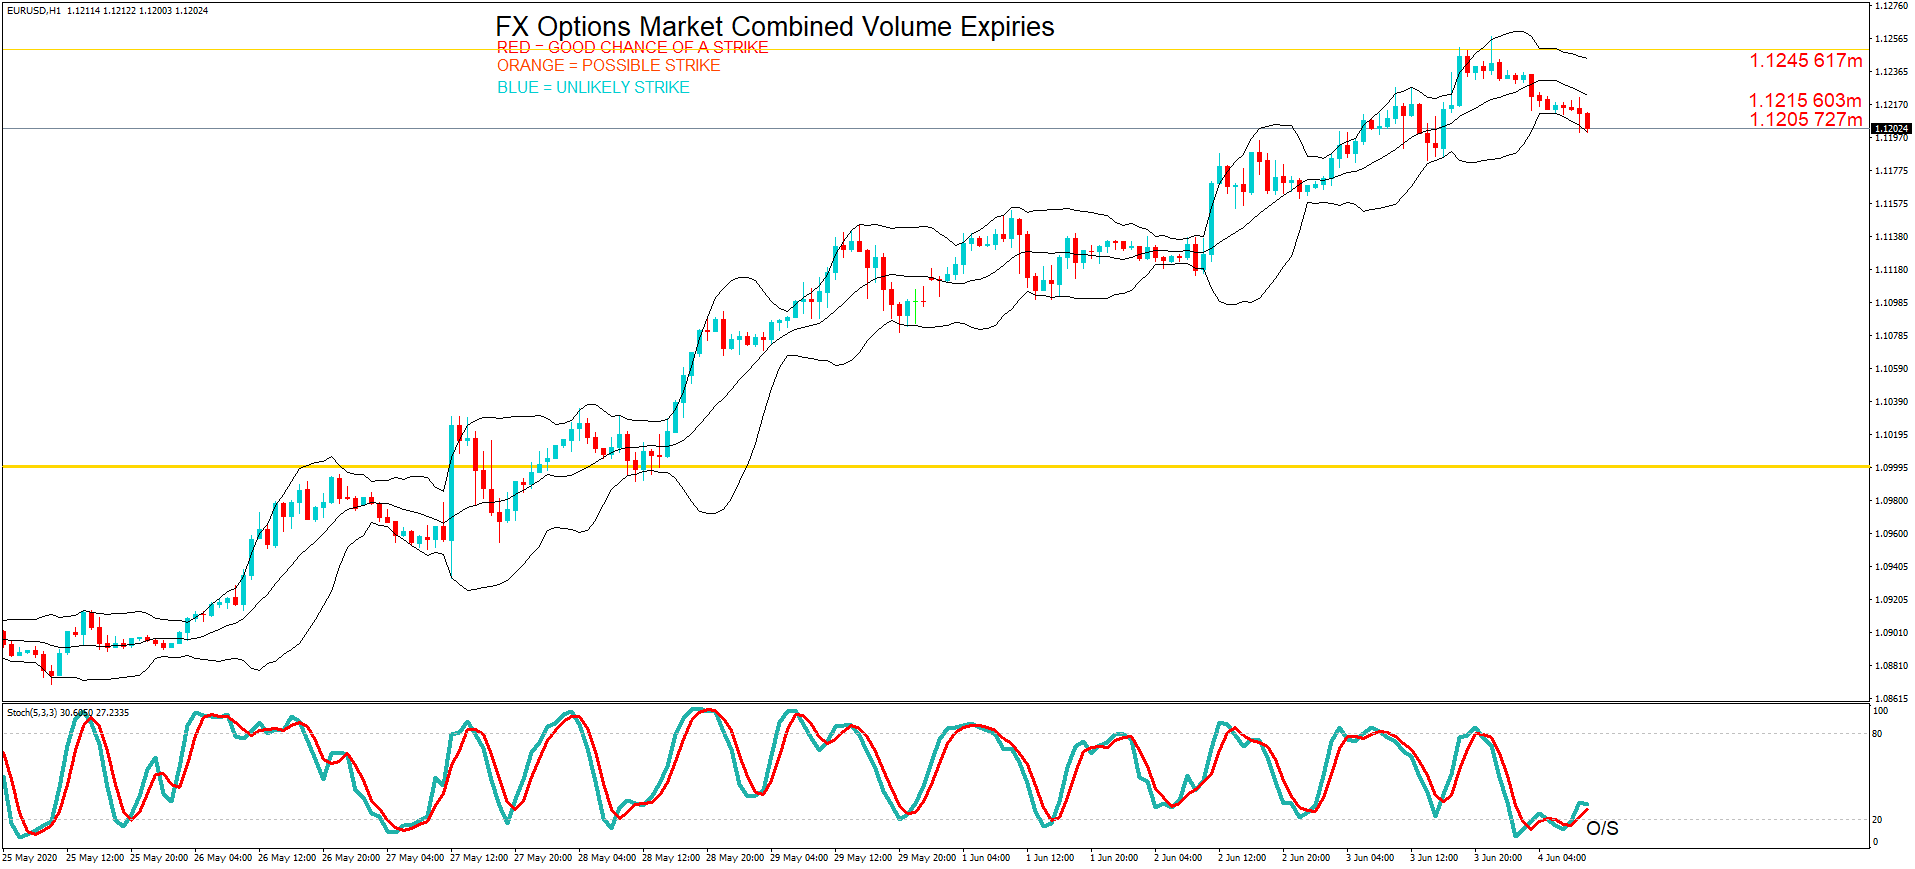
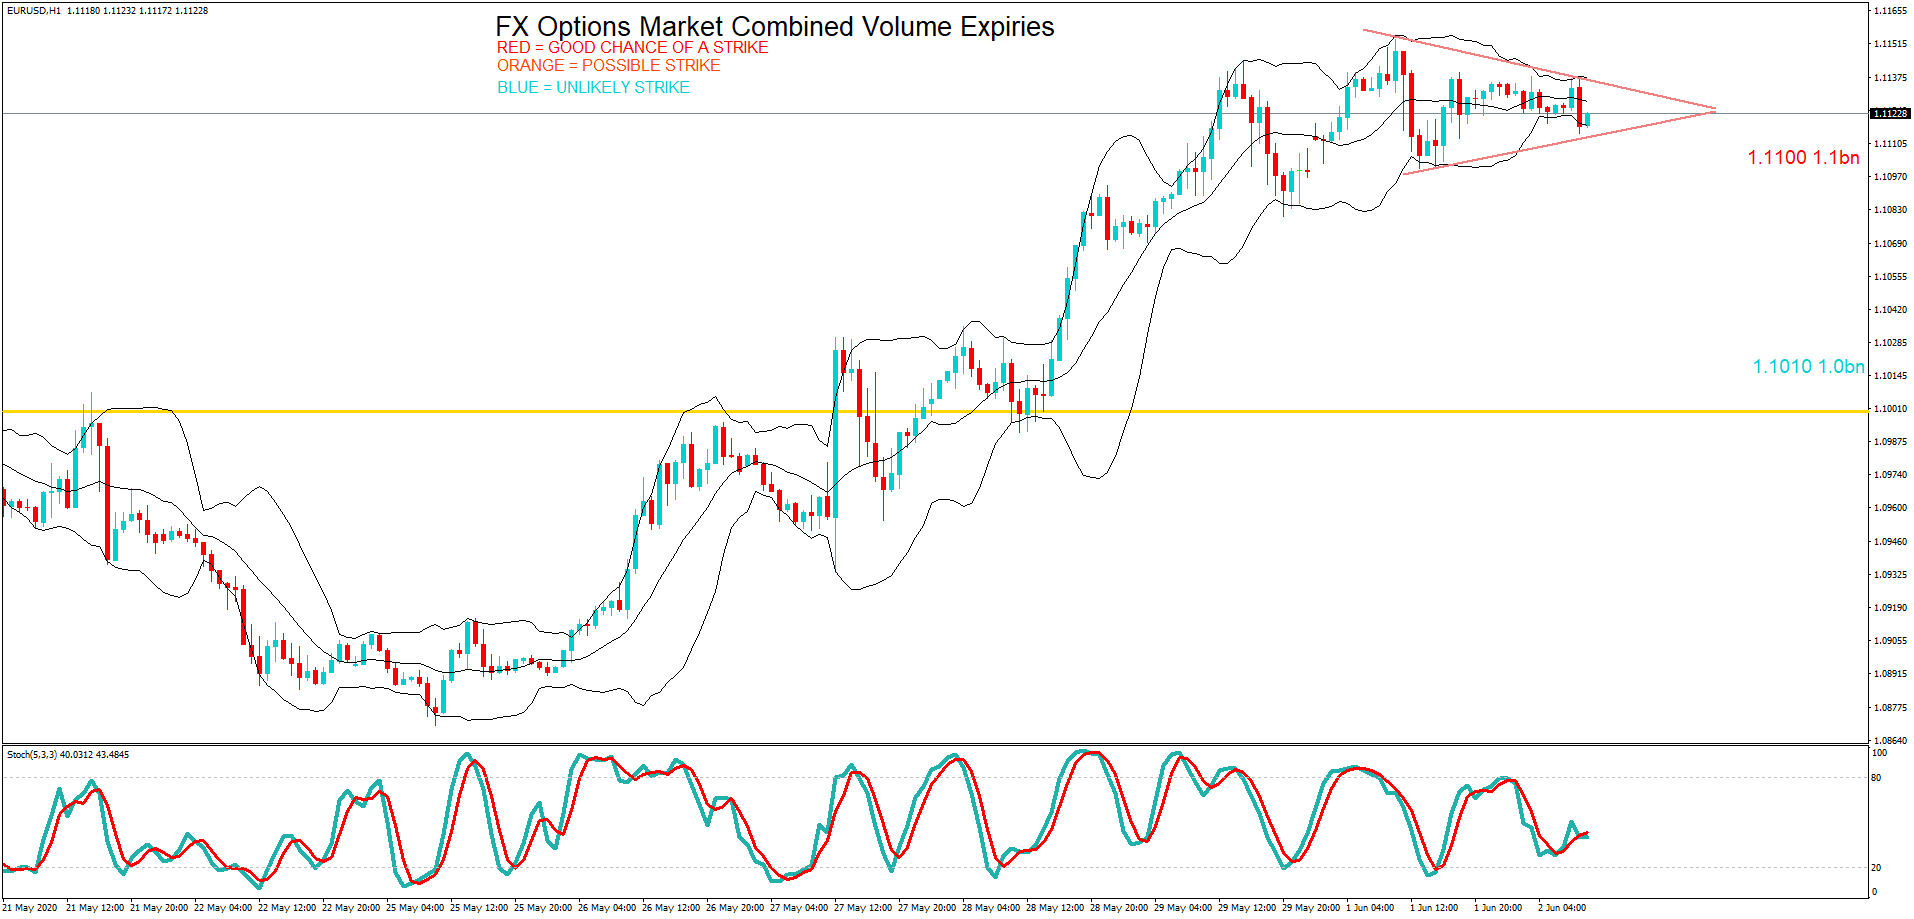
The EURUSD pair has rejected a multi-month high after the FOMC meeting yesterday. And the current price action on our one hour chart is oversold at position A, but the pair looks to be ignoring this and testing 1.1350 to the downside. If this can hold there is a strong chance the pair will conform to technical analysis until the US data including initial jobless claims out later today when the 1.1350 maturity will come into play.

– GBP/USD: GBP amounts        

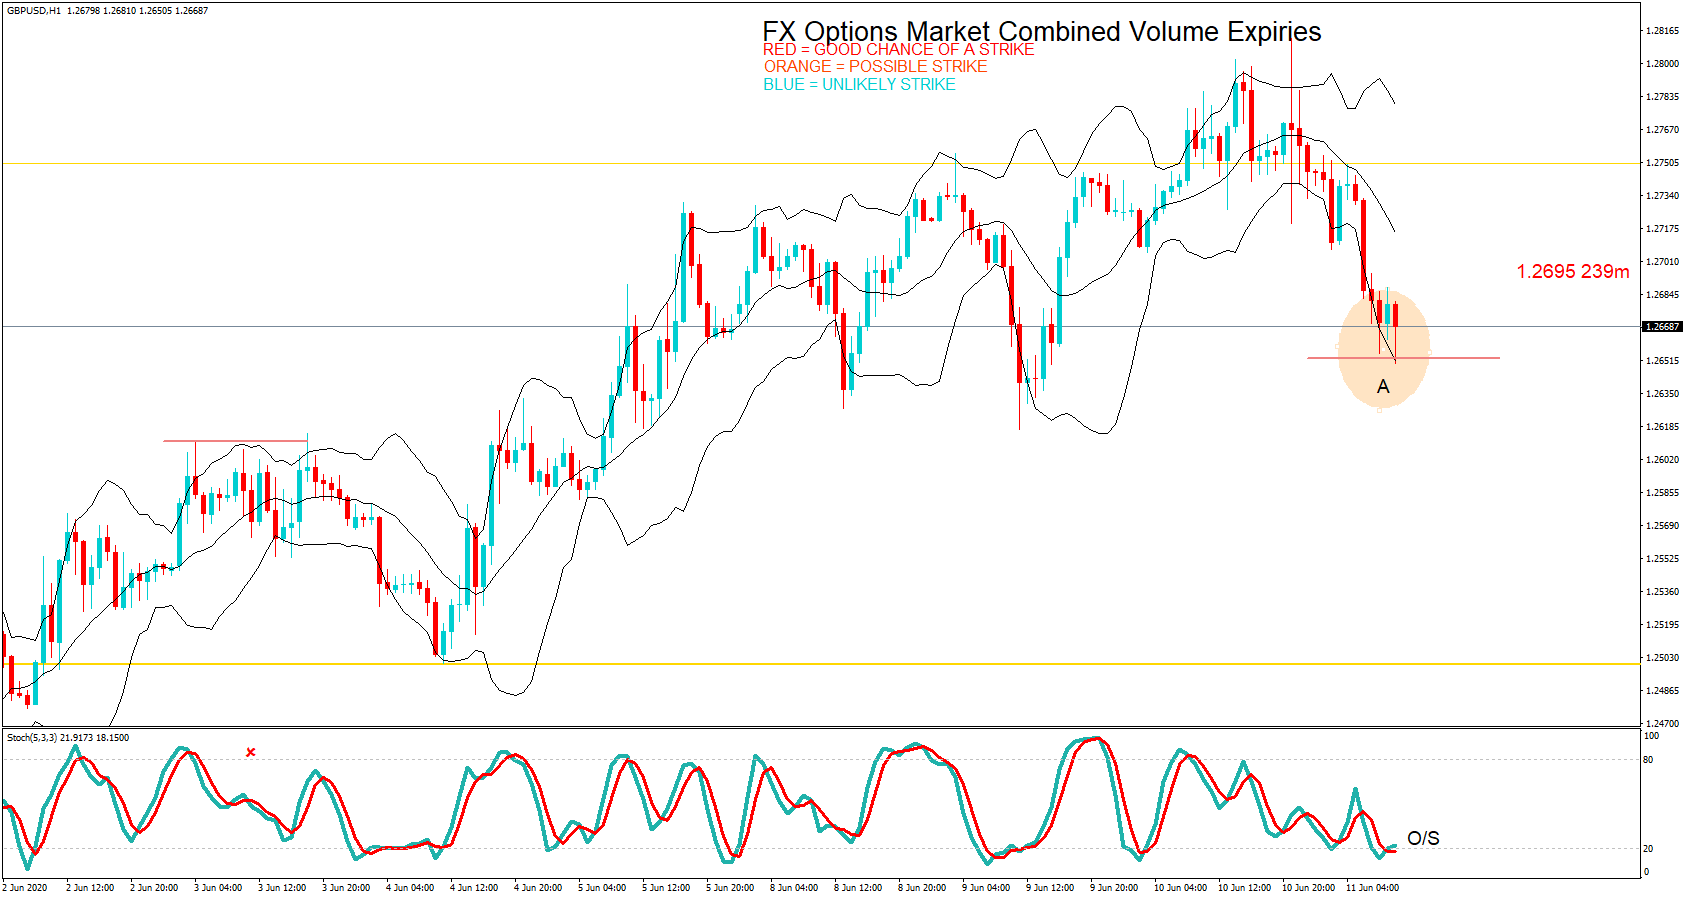
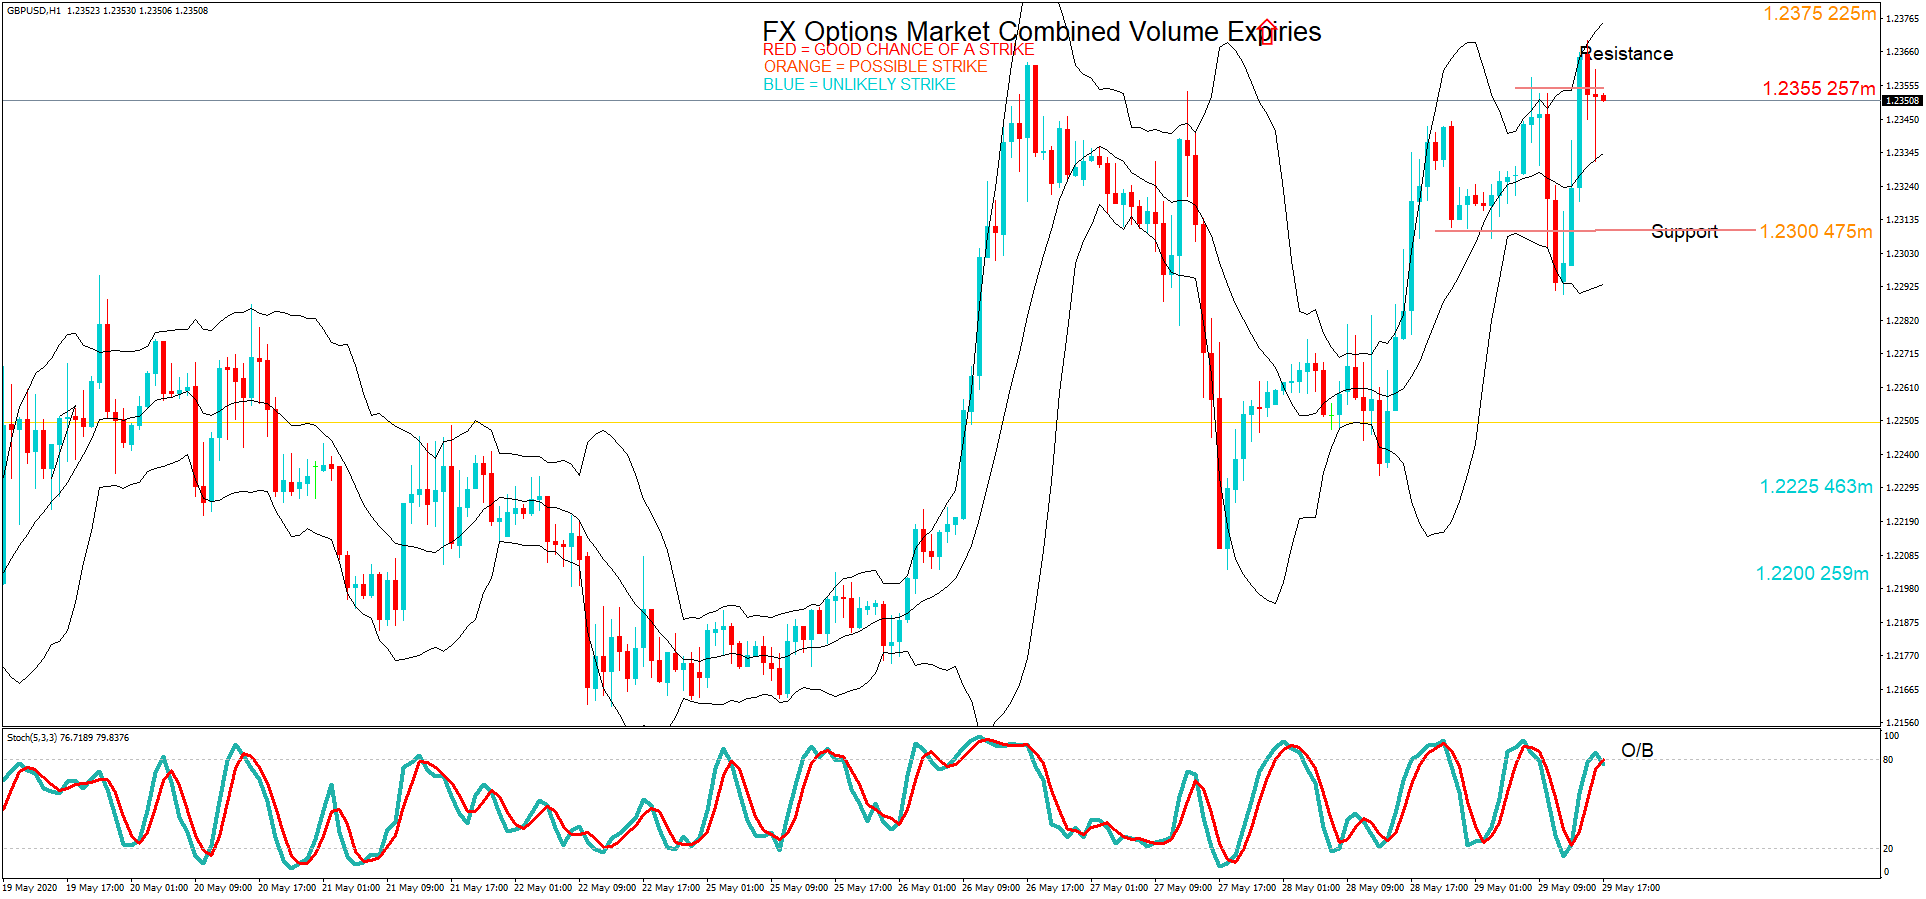
  • 1.2695 239m

The GBPUSD pair is oversold on the one hour chart and is finding support at 1.2653 and which shows long tails at this level for the 3 previous candles. US data later today may spur a break from these levels. The 1.2695 maturity remains in play.

– USD/JPY: USD amounts         

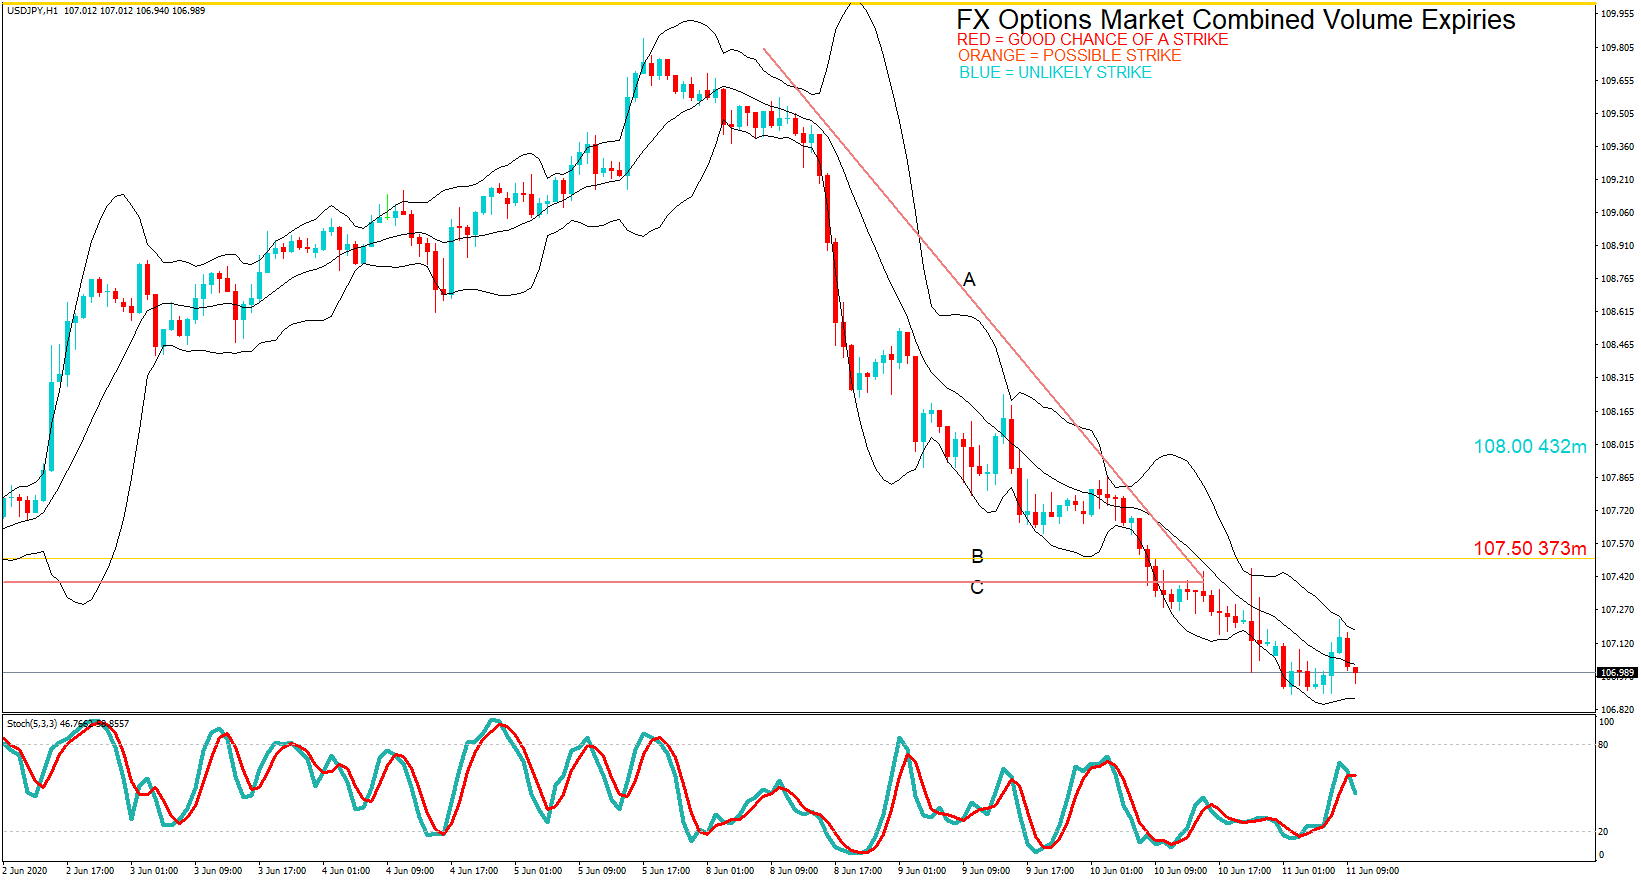
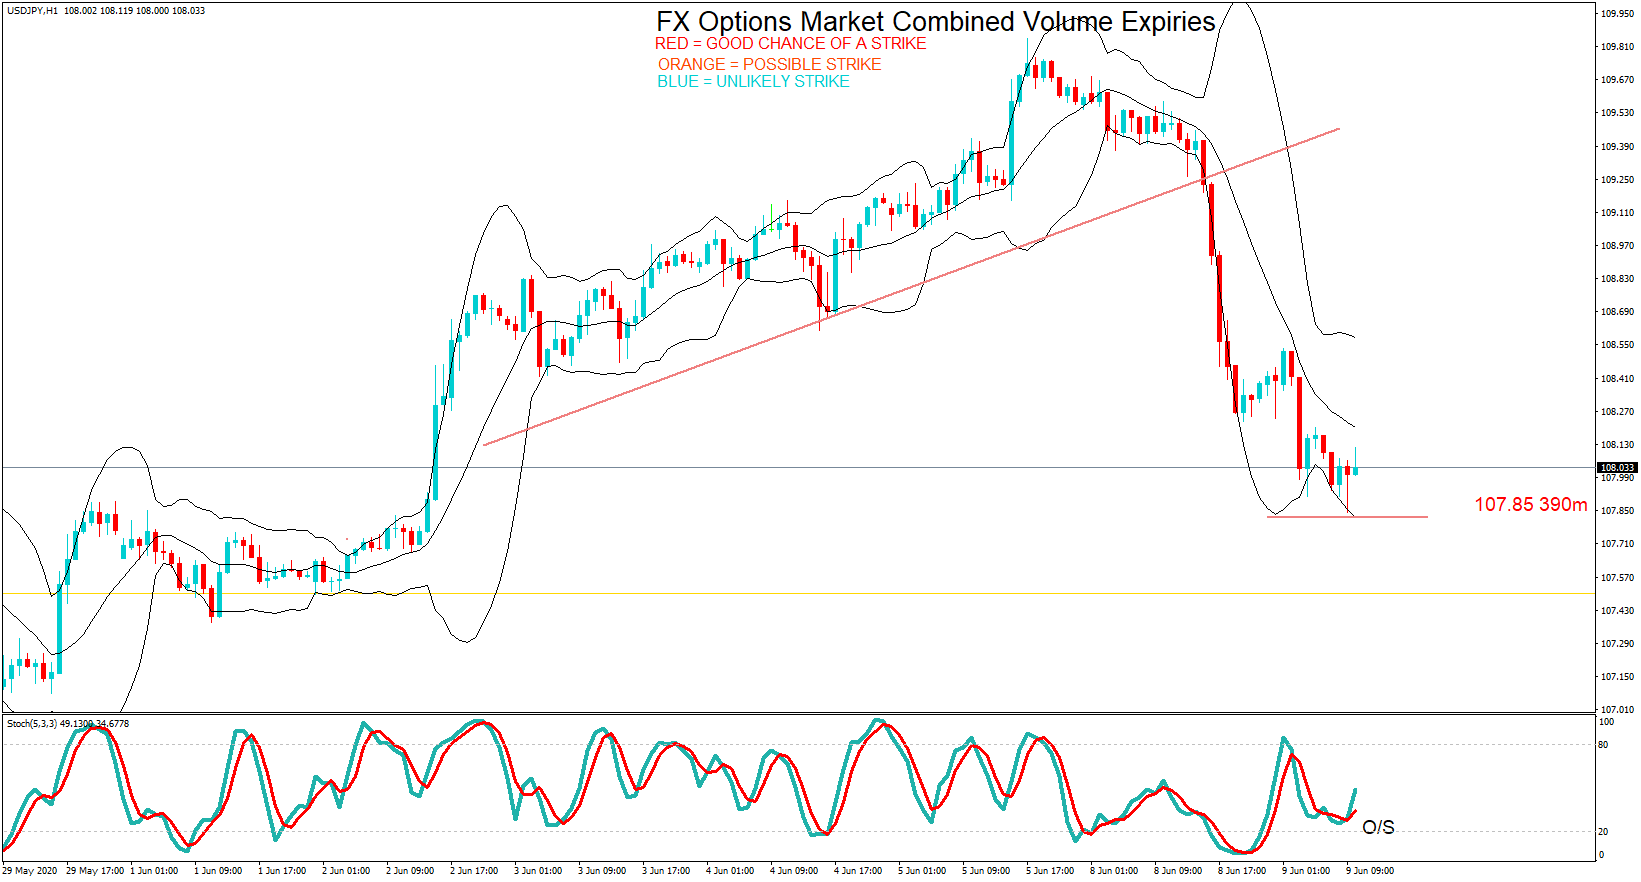
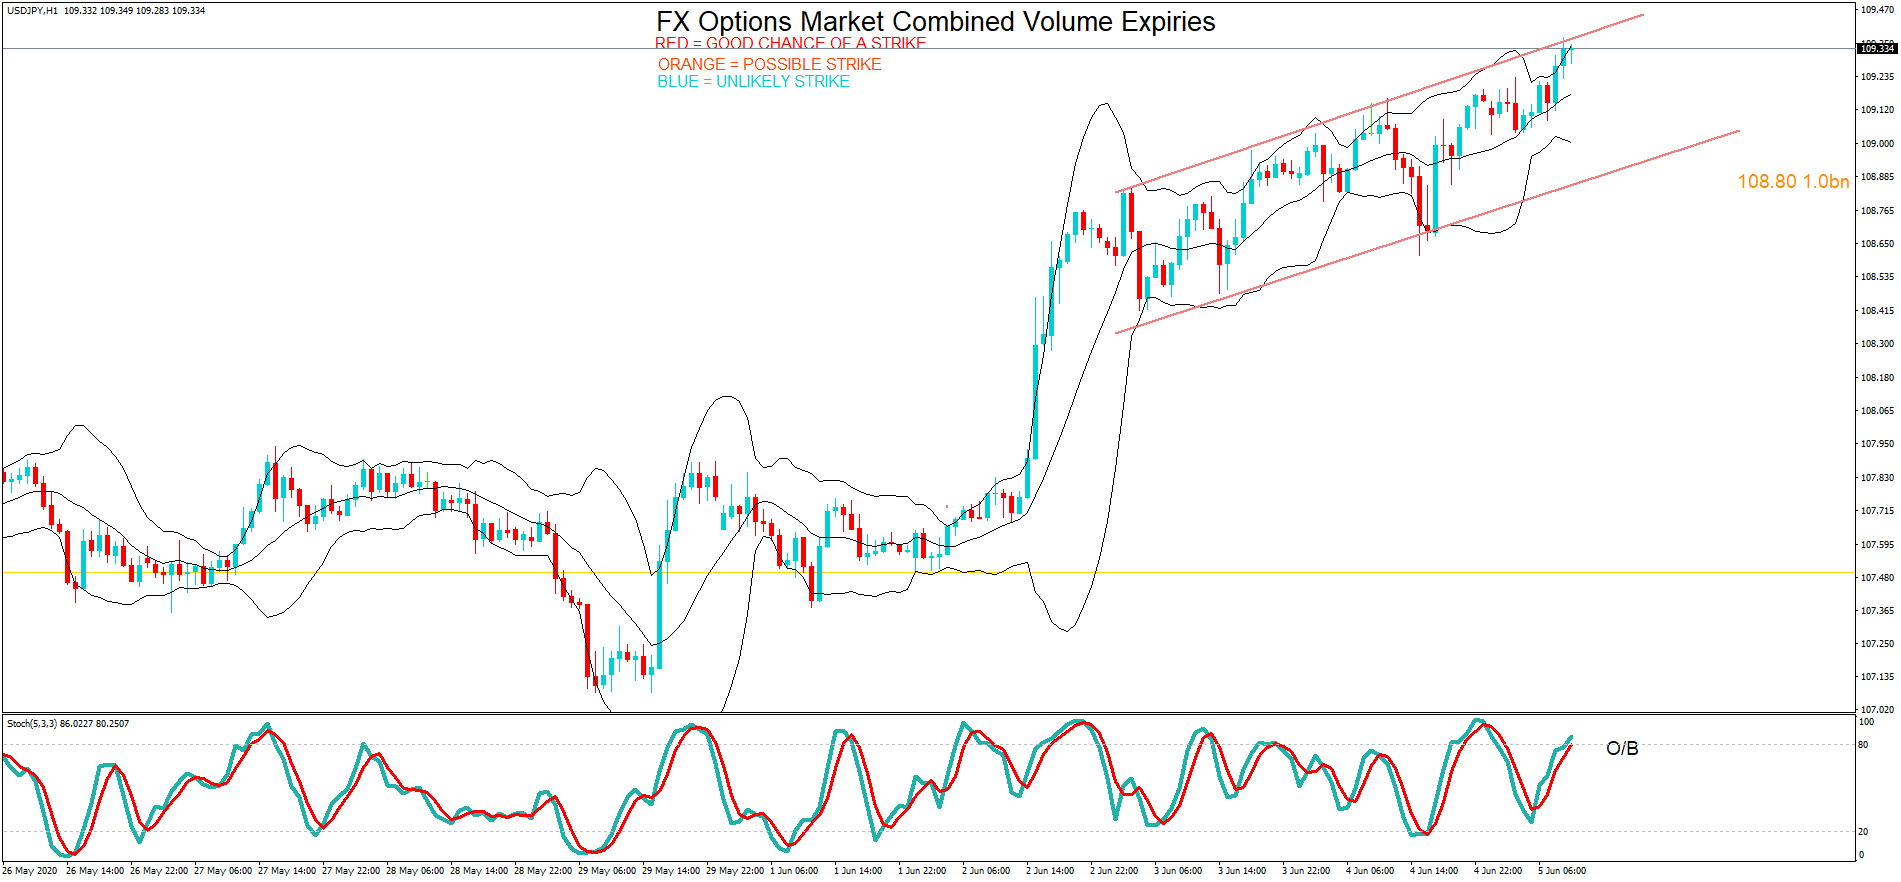
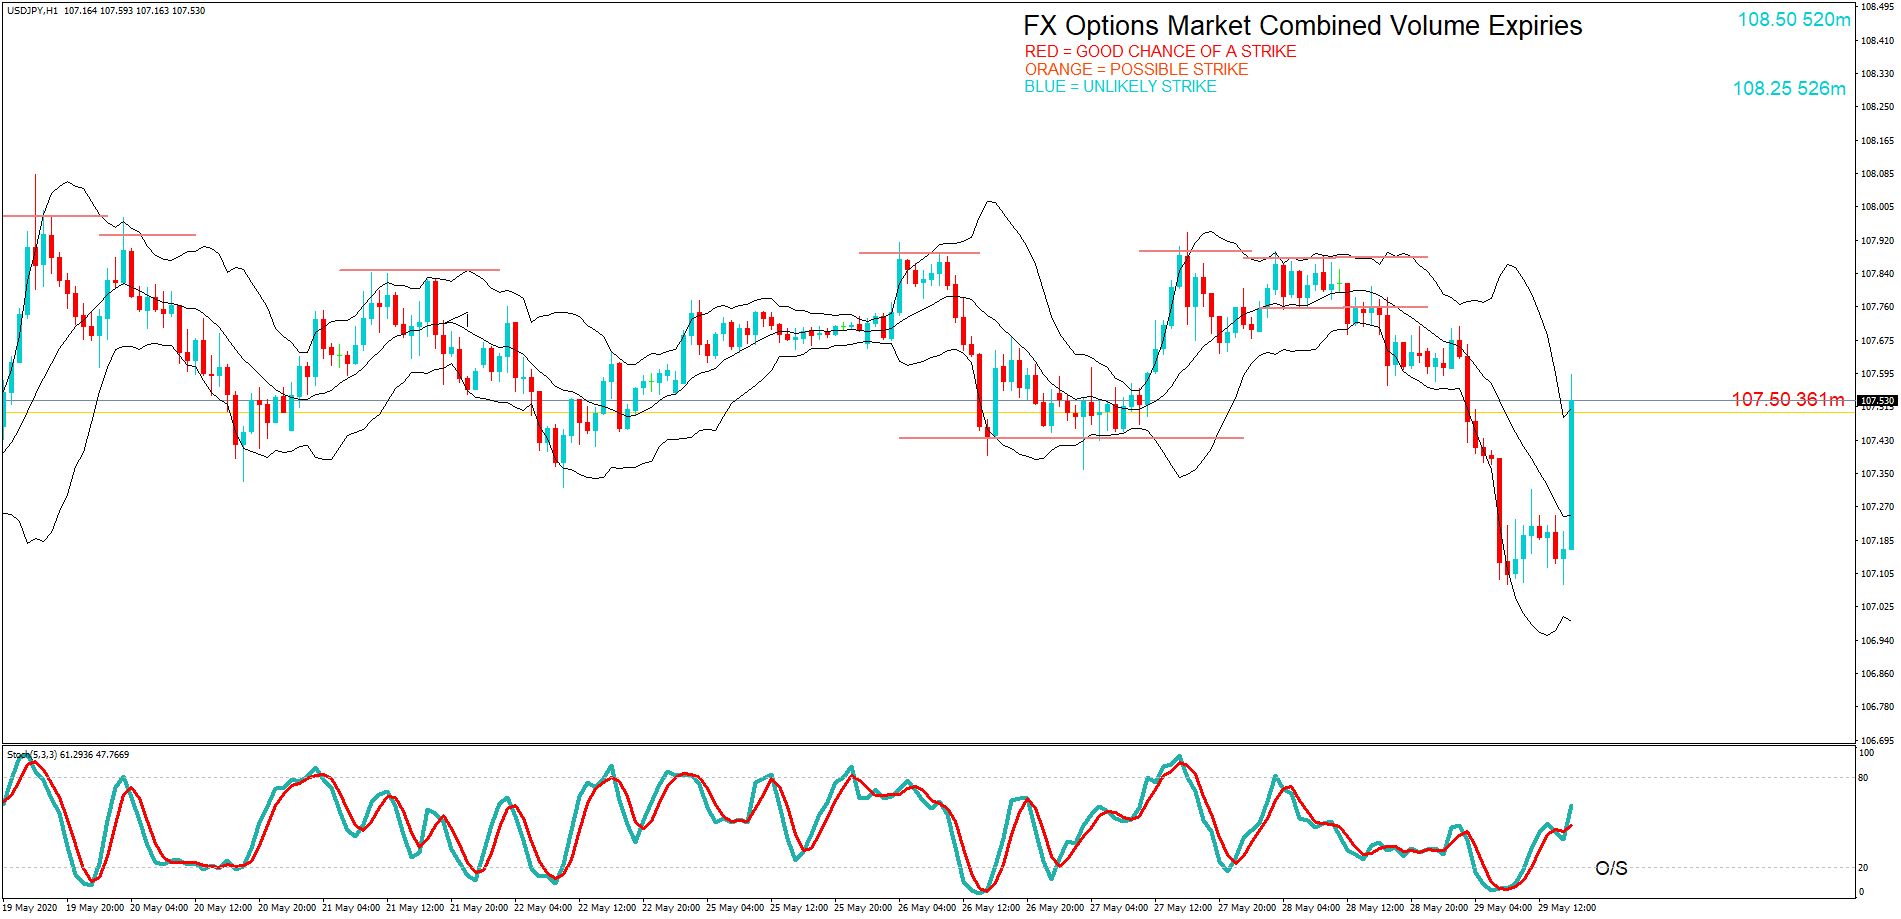
  • 107.50 373m
  • 108.00 432m

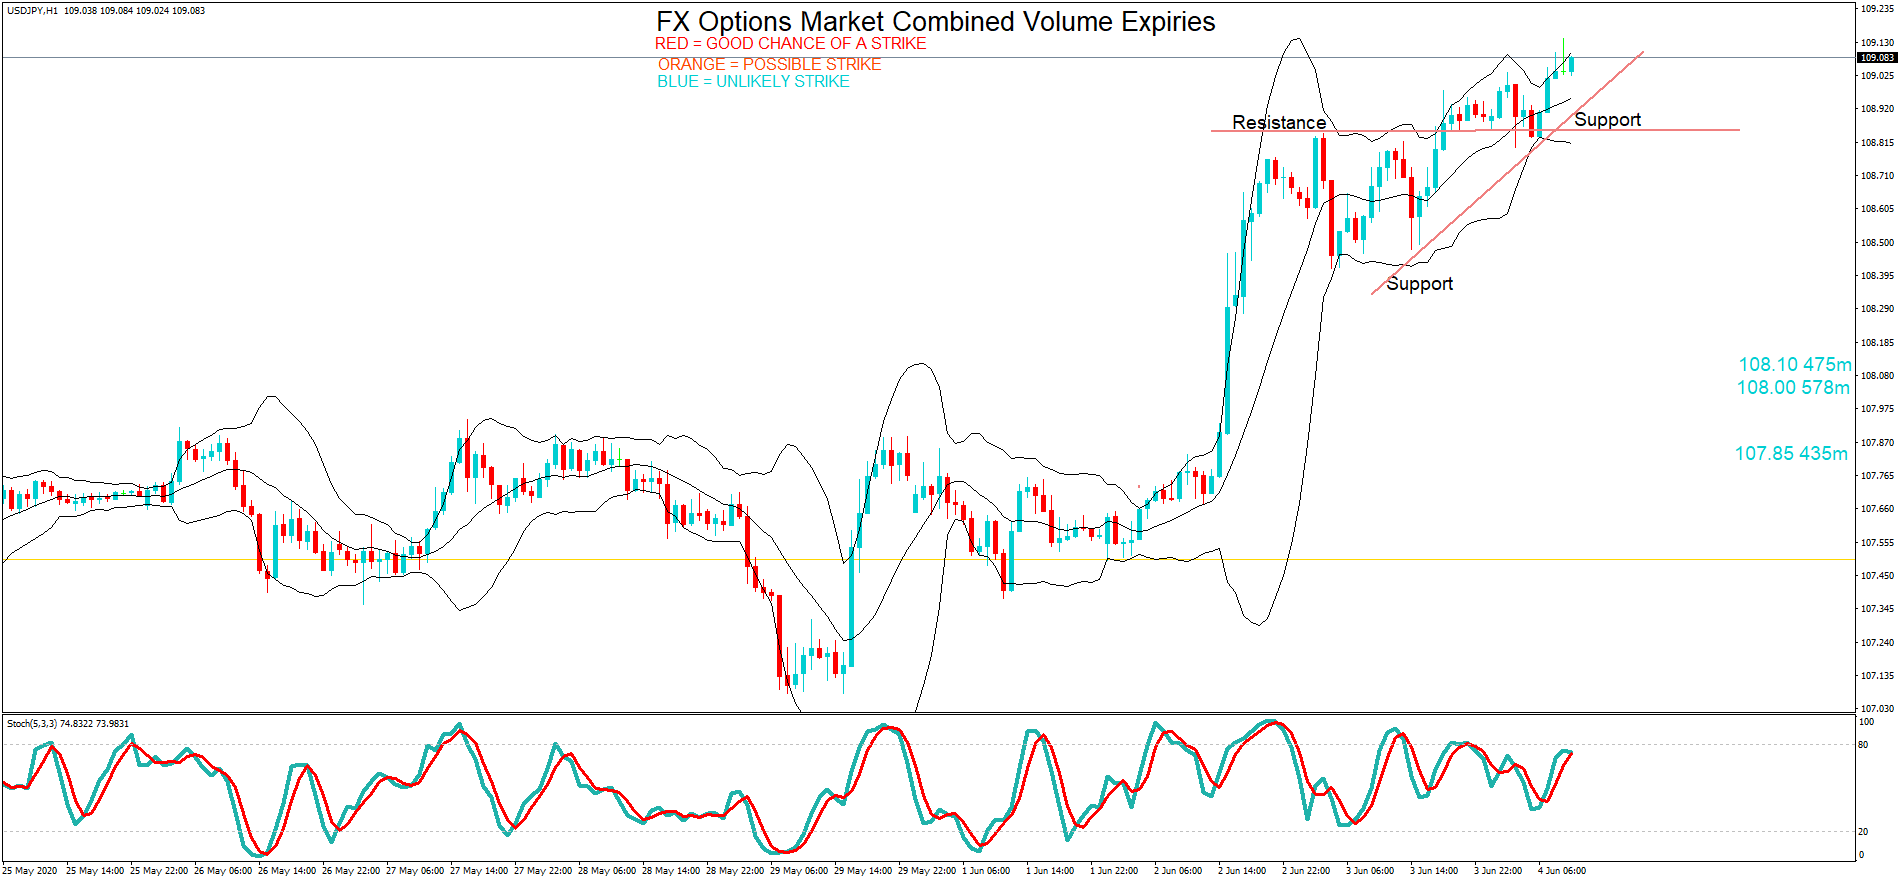
The USDJPY pair is approaching overbought on the one hour chart. Yesterday’s bearish price action which we brought you broke through the A B C wedge formation. Watch out for a push back to one of the support lines during the European and US sessions and where the 107.50 maturity will remain in play. US economic data release will affect the price action before the cut.

– NZD/USD: NZD amounts

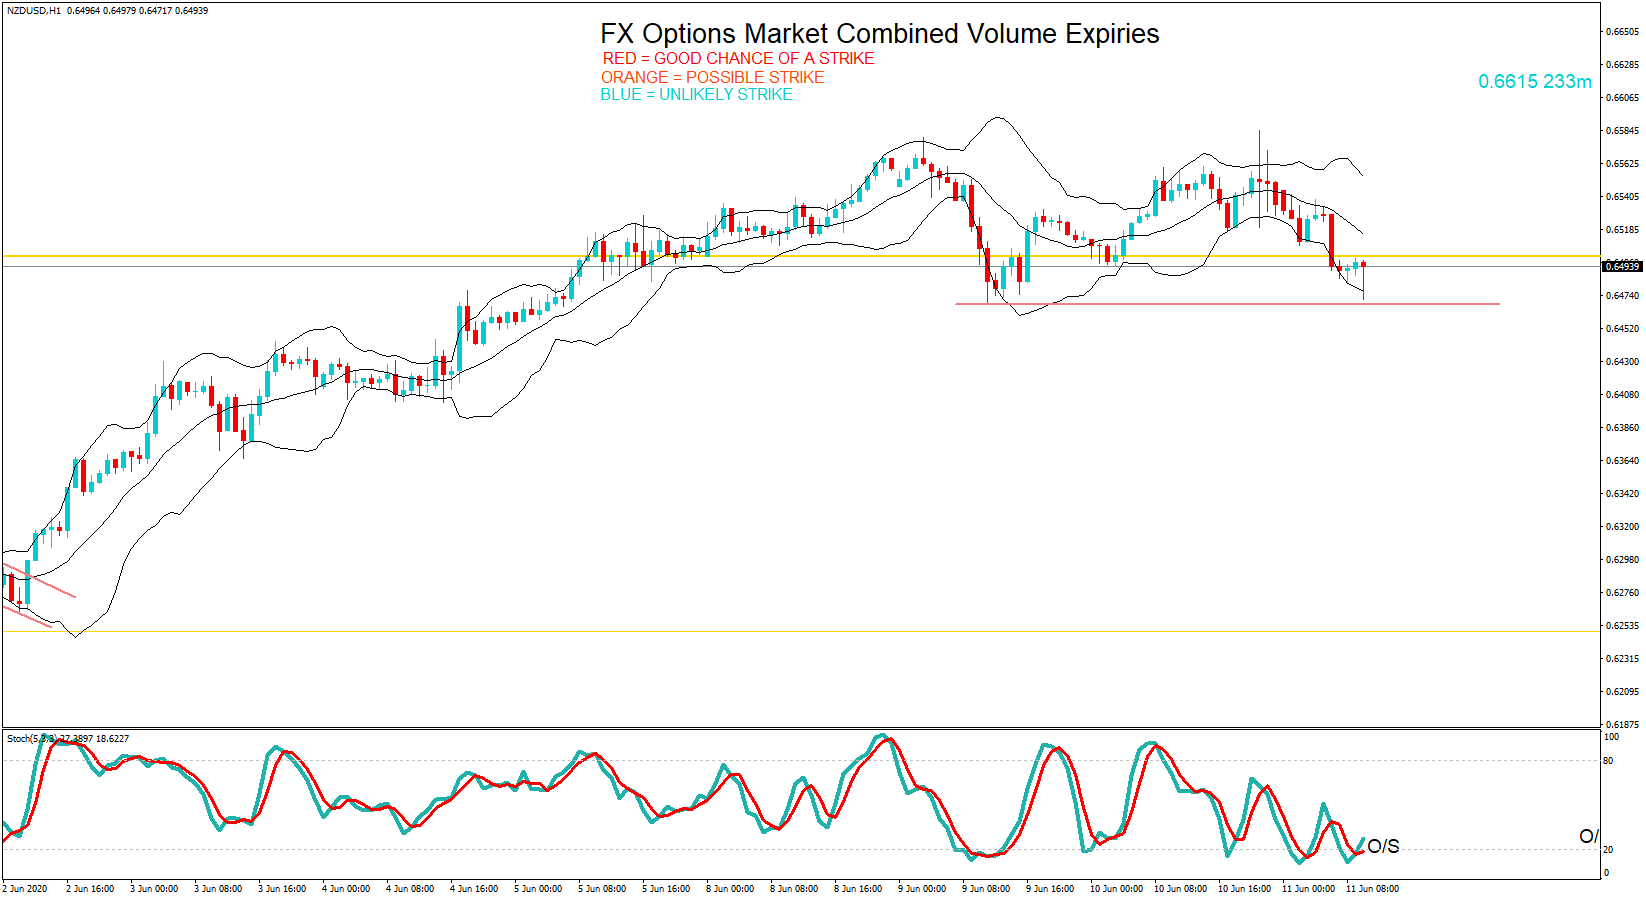
  • 0.6615 233m

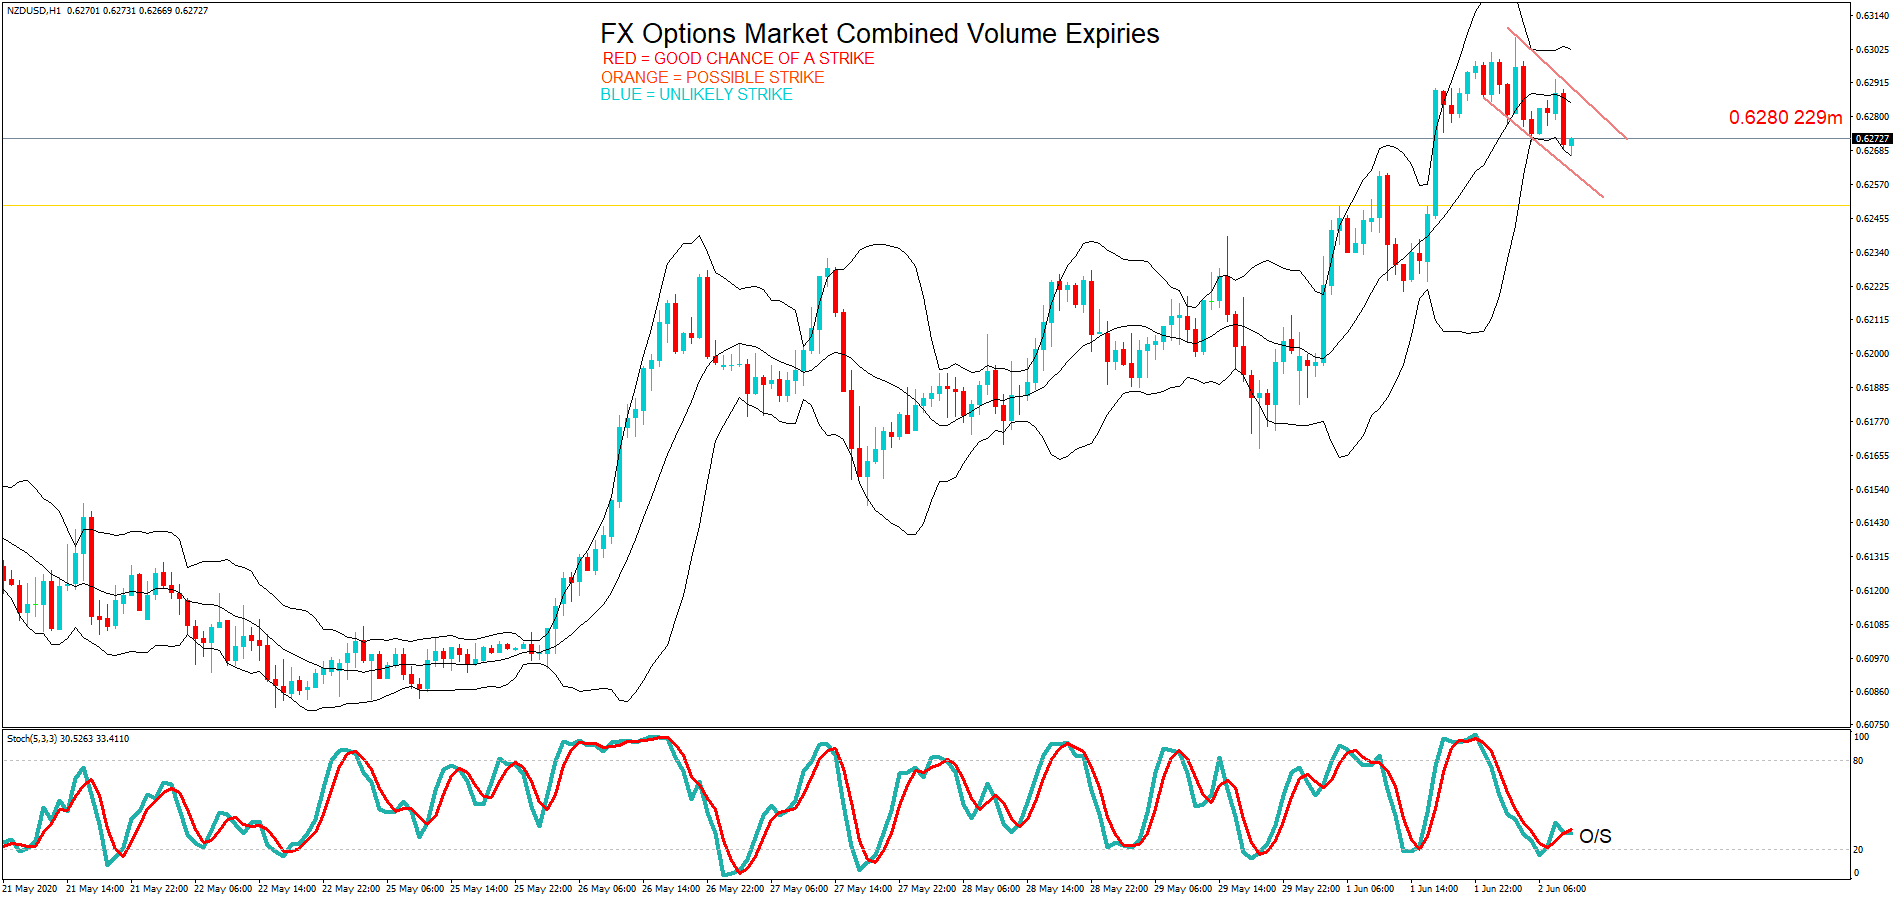
NZDUSD pair is trading off of a double bottom support line at 0.6468 and is oversold on the one hour chart It is likely to struggle to find the impetus to reach the maturity without a negative market reaction to the initial jobless claims fro the USA later today.

– EUR/GBP: EUR amounts

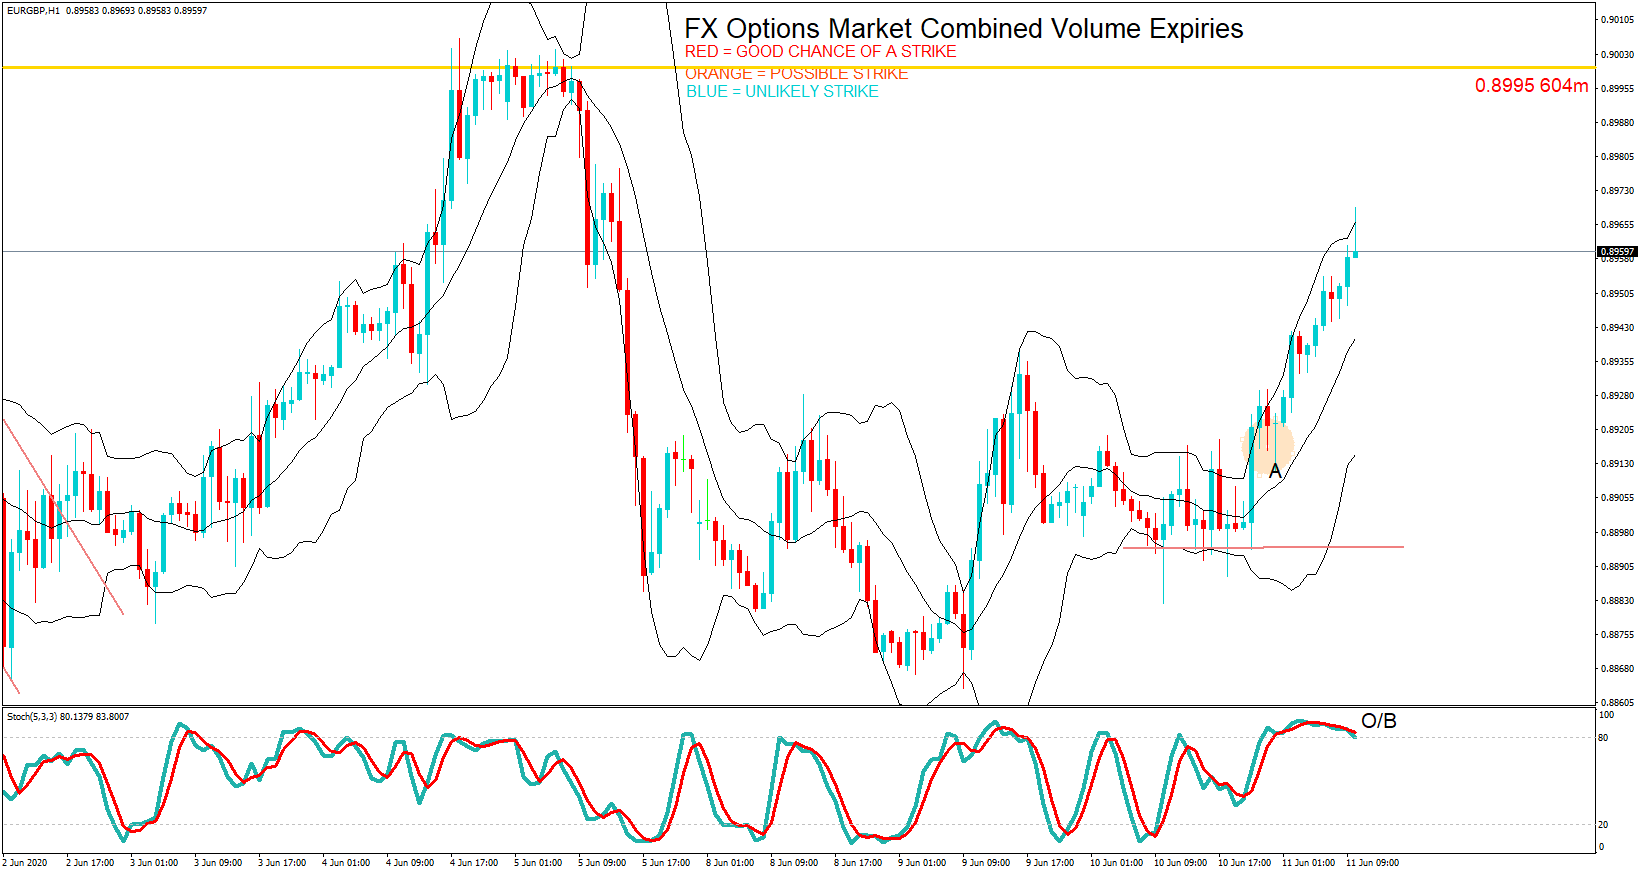
  • 0.8995 604m

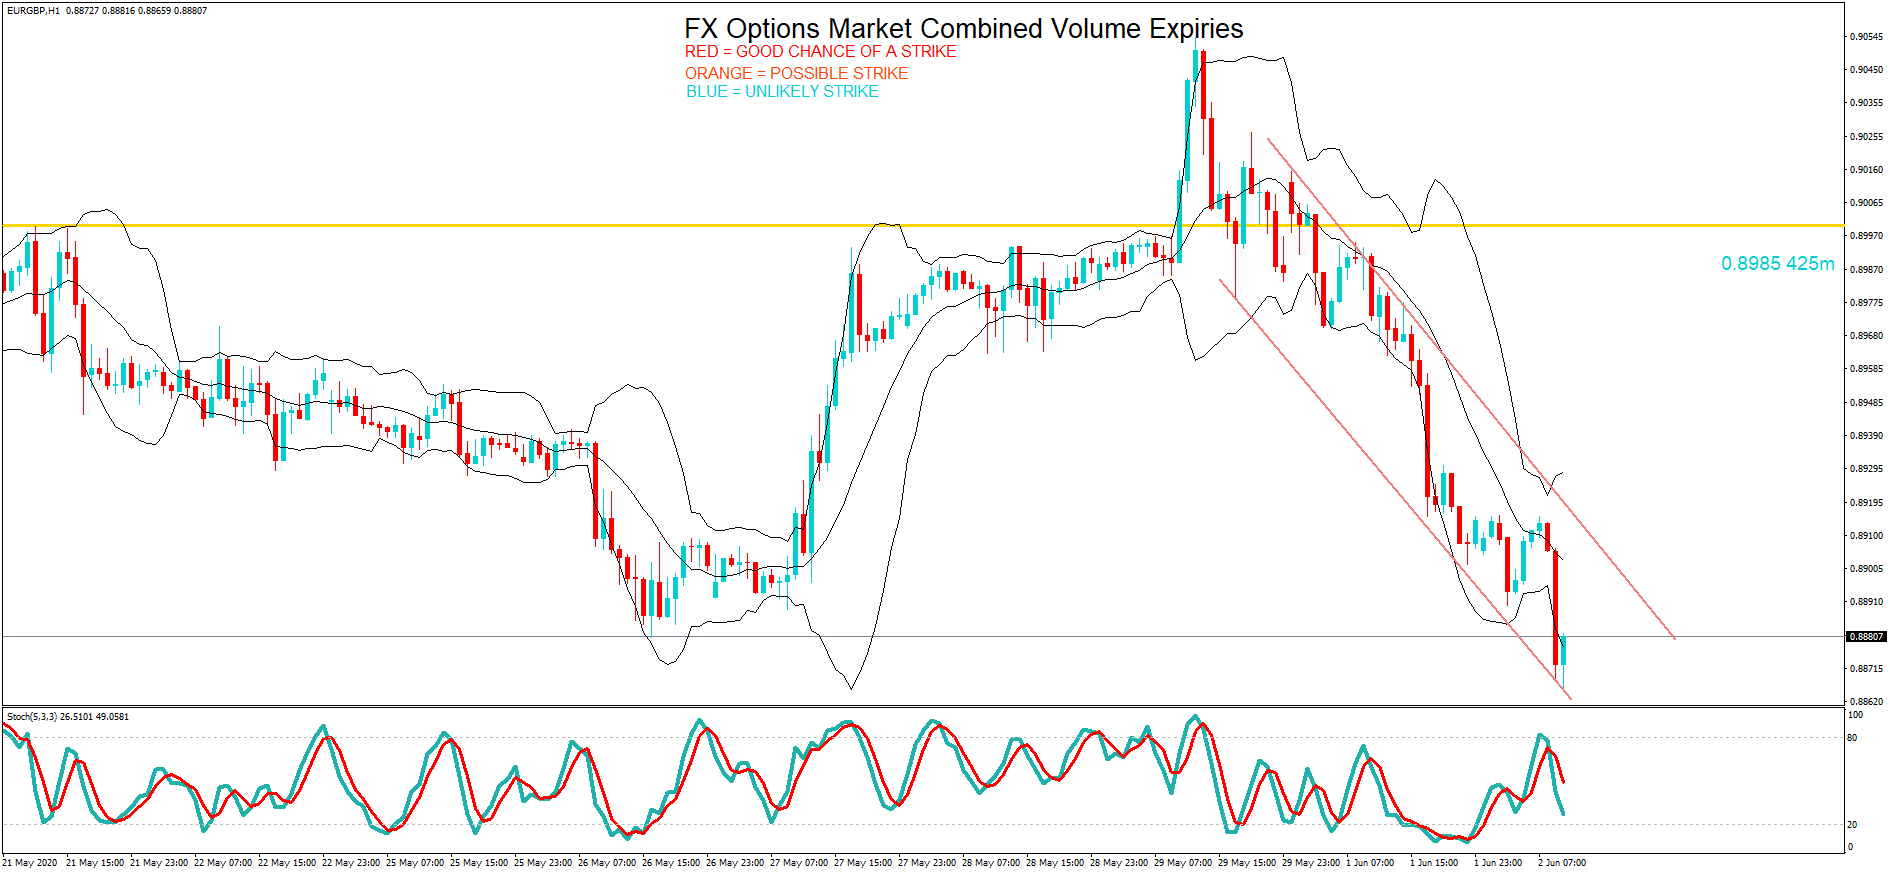
The EURGBP pair was overbought at 0.8916 (position A) on the one hour chart having found strong support at 0.8890 The O/B was ignored. The pair remains in a bull trend. Today’s maturity remains in play.

……………………………………………………………………………………………………………………..

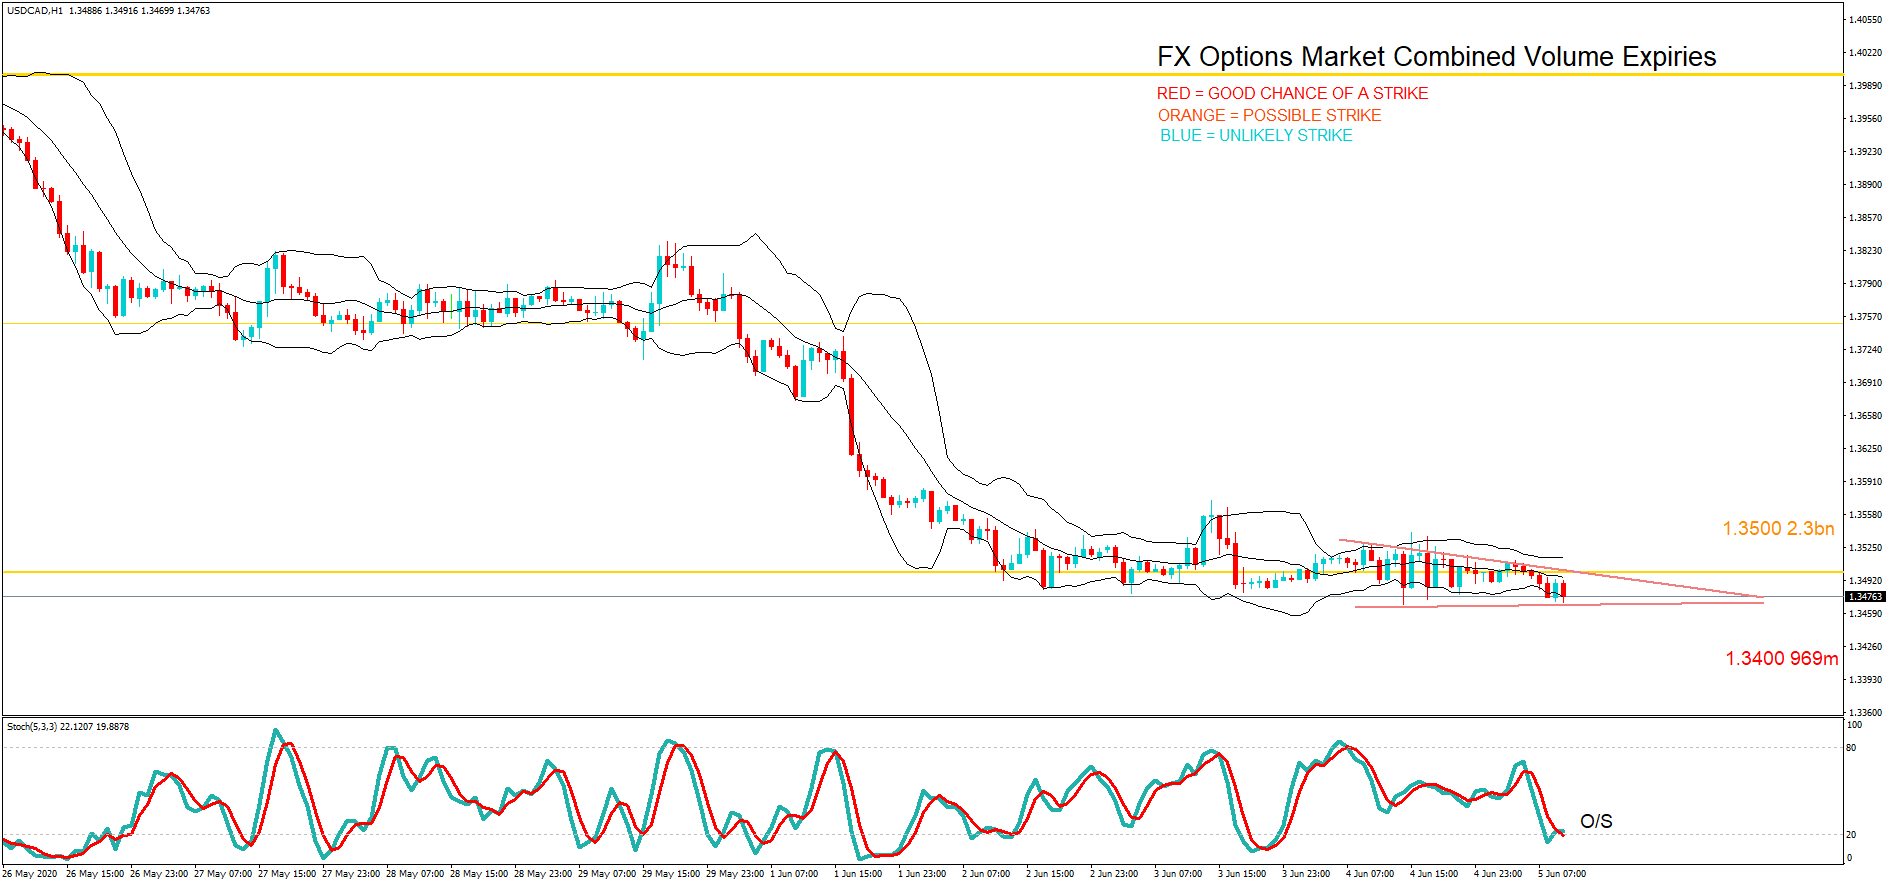
As you can see on the charts we have also plotted the expiration levels at the various exchange rate maturities and we have also labelled in red, orange and blue. Therefore, if you see option expiry exchange rates labelled in red these should be considered in-play, because we believe there is a greater chance of the expiry maturing at these levels based on technical analysis at the time of writing. There is still a lesser possibility of a strike if they are in orange and so these are ‘in-play’ too. However, if we have labelled them in blue, they should be considered ‘not in-play’ and therefore price action would be unlikely to reach these levels, which are often referred to as Strikes, at the time of the 10 AM New York cut.

Our technical analysis is based on exchange rates which may be several hours earlier in the day and may not reflect price action at the time of the maturities. Also, we have not factored in economic data releases or keynote speeches by policymakers, or potential market volatility leading up to the cut.

Although we have added some technical analysis we suggest you take the levels and plot them onto your own trading charts and incorporate the information into your own trading methodology in order to use the information to your advantage. Remember the higher the amount, the larger the gravitational pull towards the exchange rate maturity at 10:00 AM Eastern time.

If you want to learn how forex option expiries affect price action in the spot FX market see our educational article by clicking here: https://bit.ly/2VR2Nji

DISCLAIMER: Please note that this information is for educational purposes. Also, the maturities will look more or less likely to become a strike at 10 AM NY time due to exchange rate fluctuations resulting in a different perspective with regard to technical analysis, and also due to upcoming economic data releases for the associated pairs.

Categories
Forex Course

122. Harmonic Pattern Trading – Gartley Pattern

Introduction

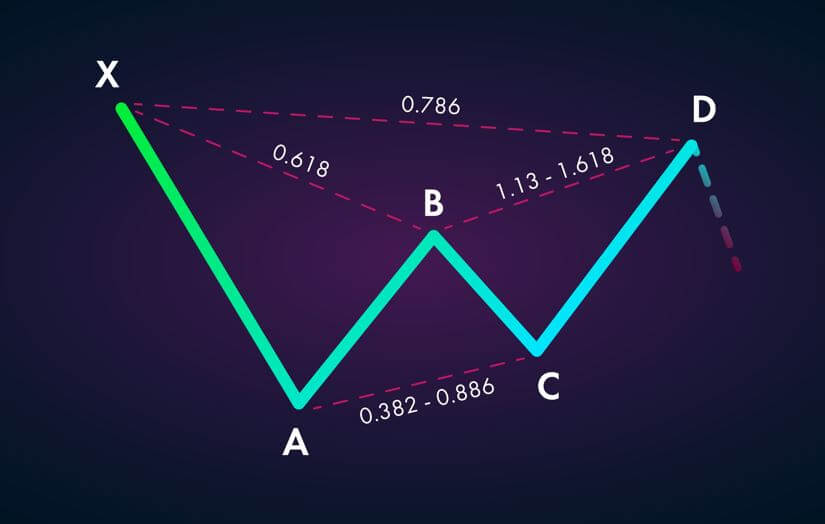
The Gartley is one of the most traded harmonic patterns in the market. Just like the AB=CD pattern that we discussed in the previous course lesson, the identification and confirmation of the Gartley pattern are based on the Fibonacci levels. Technical traders use this pattern to trade the retracement and continuation that occurs when the trend temporarily reverses before continuing to move in its original direction. This pattern is also referred to as a Gartley222 because the inventor of this pattern, H.M Gartley, first described this pattern on page number 222 in his famous book ‘Profits in The Stock Market.’

Moves Involved In The Formation Of Gartley Pattern 

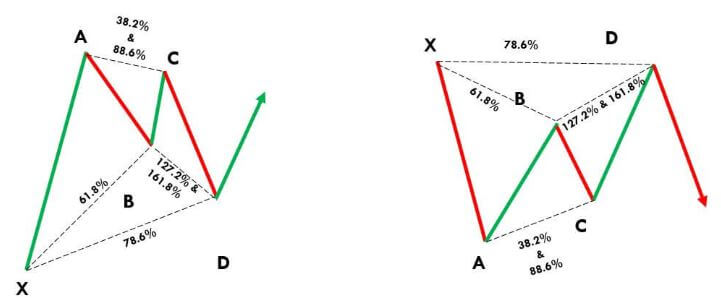
X-A – In the bullish version, the first leg forms when the price rises sharply from point X to point A.

A-B – The AB leg changes its direction and retraces to Fib level 61.8% of the XA leg.

B-C – In the BC leg, price action changes its direction and retraces from 38.2% to 88.6% of the distance that is covered by the AB leg.

C-D – This is the last leg of the pattern, and it reverses again to the downside. It must retrace to 78.6% of the XA leg.

Below is how the fully formed Bullish and Bearish Gartley Patterns look like:

Trading The Gartley Pattern

Bullish Gartley Pattern

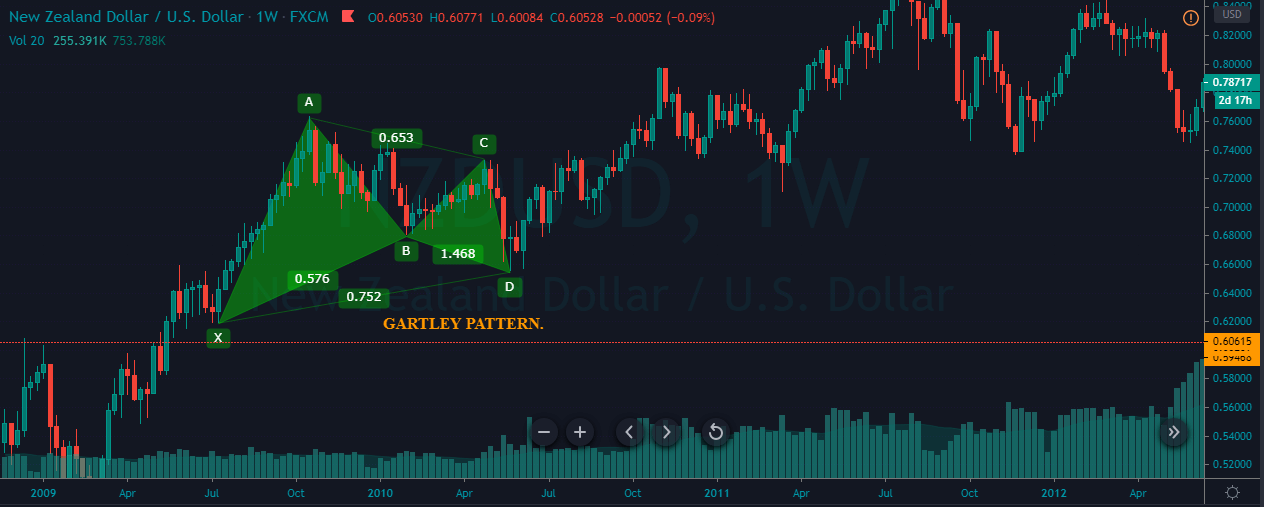
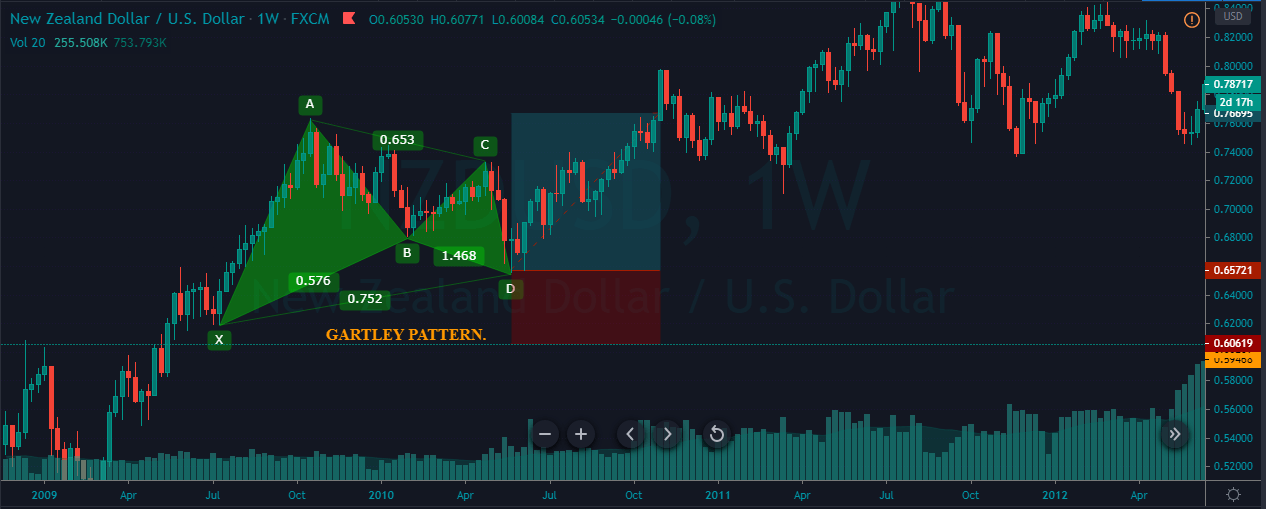
The chart below represents the formation of a bullish Gartley pattern on the NZD/USD weekly chart.

In the below chart, the four swing highs and swing lows bind together to form the bullish Gartly pattern. It is crucial to validate the fibs ratios on the price chart. The first XA leg was the bullish move, and the successive AB leg was a bearish move. We can see that the AB move was close to the 61.8% level of the AB leg.

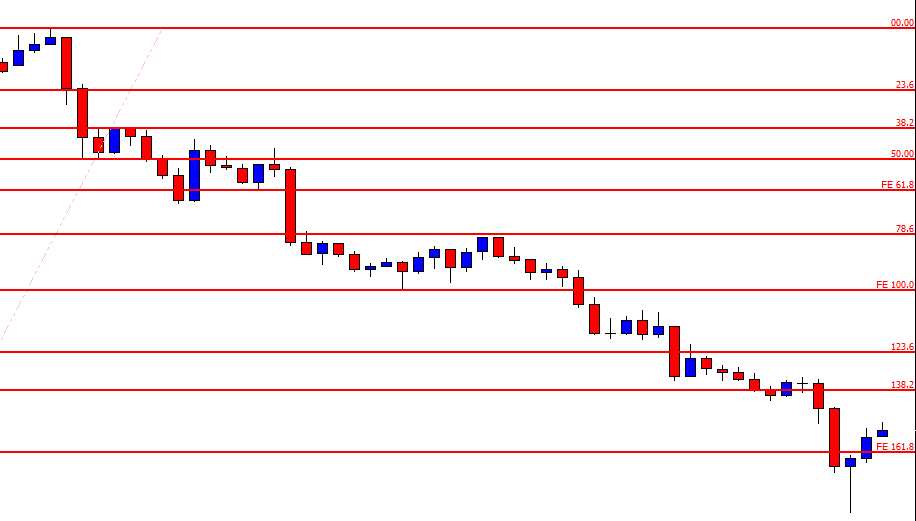
Furthermore, BC is a bullish move, and it is retracing close to the 88.6% fib level of the AB move. The last step was the CD leg, and if this one goes wrong, the whole pattern gets invalidated. However, the CD move was bearish, and it is close to the 161.8% fibs level of the BC leg. The trade activation was at point D, and we have placed the take profit order at Point A.

Bearish Gartley Pattern

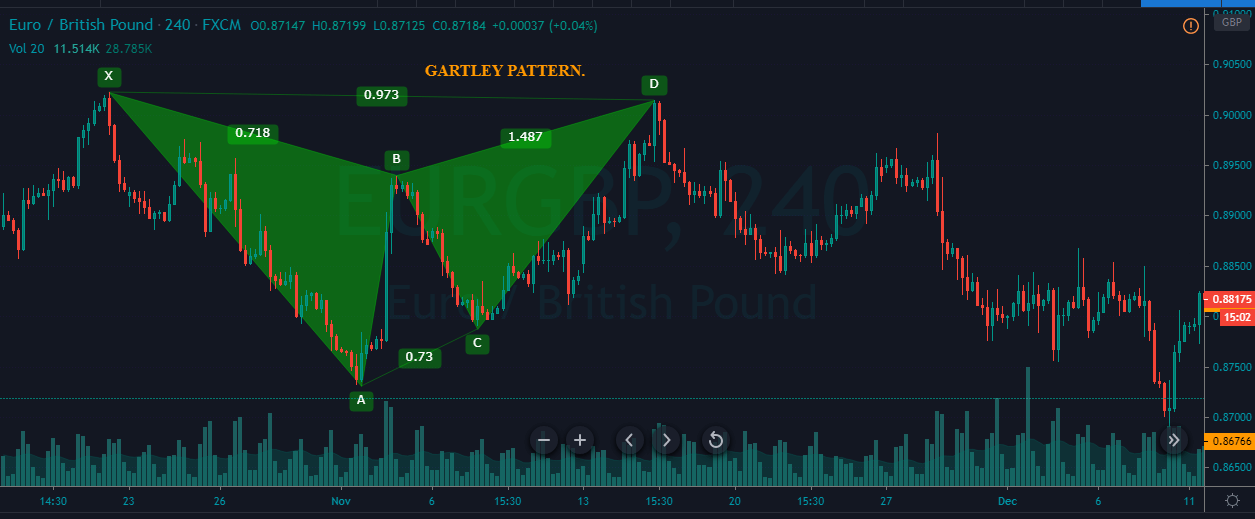
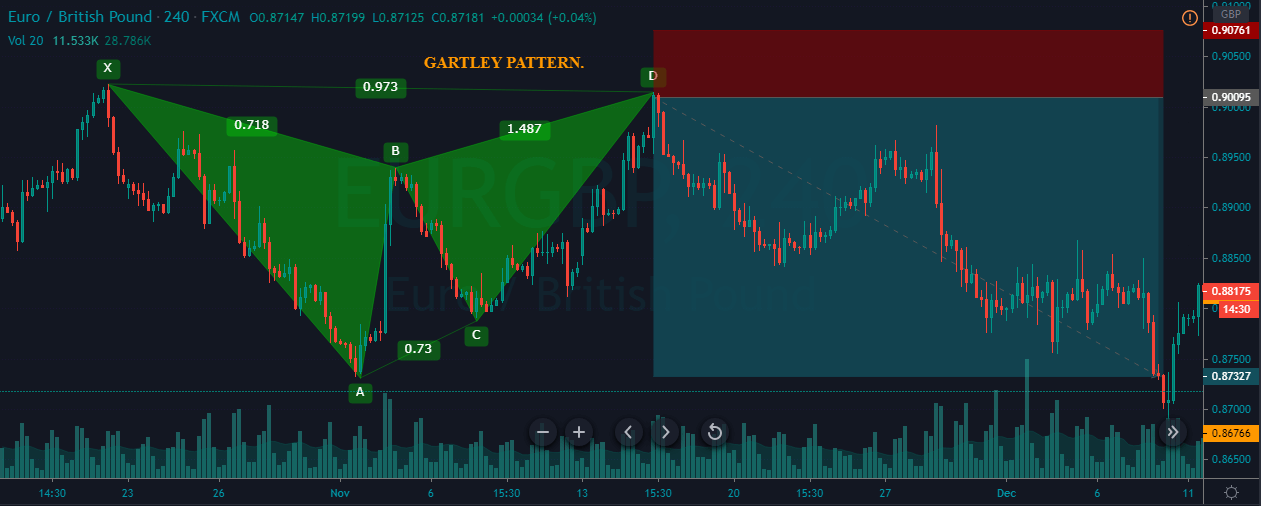
The price chart below represents the formation of a bearish Gartley pattern on the EUR/USD 240 Forex pair.

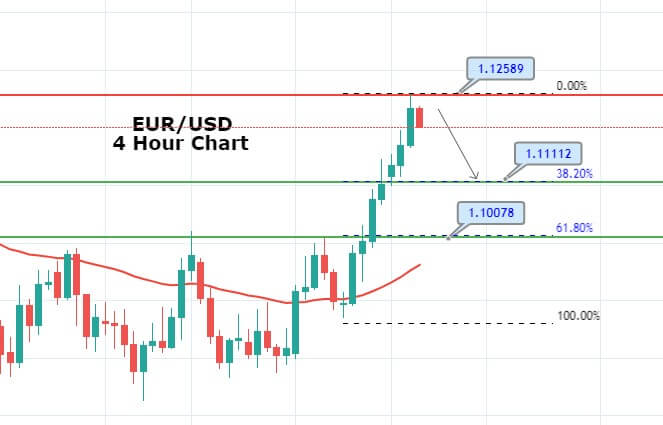
We can observe that the first leg of this pattern was XA, which is a bearish move. It is followed by the reverse in trend printing the AB leg, which is close to the 61.8% extension of the XA leg. The third leg, BC move, was bearish again, and it is close to the 88.6% fibs of the AB move. The last leg is the CD move, and this leg is 161.8% fibs ratios of the BC. The activation was at Point D, and the stop-loss is placed above point D. For take-profit, we have gone for the Point A. You can also partially book your profit at point C and exit your positions at point A.

Conclusion

The confirmation of the Gartley pattern must be done using the fib ratios alone. In the beginning, it can be difficult for you to spot this pattern on the price chart, but you will eventually get used to it. Hence, in the beginning, try to identify & trade this pattern on a demo account. Once you master all the rules involved while trading this pattern, you can go ahead and trade it on the live markets. Cheers!

[wp_quiz id=”76837″]
Categories
Forex Market Analysis

Daily F.X. Analysis, June 11 – Top Trade Setups In Forex – Brace for Eurogroup Meetings!

On the news front, the market will be focusing on the Eurogroup meeting, which is usually held in Brussels and attended by the Eurogroup president, Finance Ministers from euro area member states, the Commissioner for economic and monetary affairs, and the President of the European Central Bank. The agenda will be to discuss upcoming policies considering the economic slowdown driven by the coronavirus. Besides, the U.S. Unemployment Claims will also remain in the highlights today.

Economic Events to Watch Today


EUR/USD – Daily Analysis

The EUR/USD pair was closed at 1.13753 after placing a high of 1.14222 and a low of 1.13214. Overall the movement of the EUR/USD pair remained bullish throughout the day. The EUR/USD pair rose to its three months highest level on Wednesday after the Federal Reserve’s monetary policy decision. The currency pair crossed the level of 1.1400 on the back of broad-based U.S. dollar weakness that day.

The Fed left its interest rates unchanged at 0-0.25% on Wednesday and projected a contraction of 6.5% this year along with the unemployment reaching 9.3% for this year. Furthermore, the bank has shown its commitment to support the credit flow to household and business by increasing its Treasury security purchases.

Though negative interest rate was not expected from the Fed but taking the pledge to keep the interest rates at low near zero until market participants did not expect 2022, this moved the investors to sell the U.S. dollar, which in turn gave a push to EUR/USD pair.

Adding in the upward movement of EUR/USD pair on Wednesday was the poor than expected economic data from the U.S. At 17:30GMT, both CPI & Core CPI readings from the U.S. came in as -0.1% against the expected 0.0% during May and exerted pressure on the U.S. dollar. AT 23:00 GMT, the Federal Budget Balance showed a deficit of 398.8B against the expected deficit of 580.0B and weighed on the U.S. dollar.

The broad-based U.S. dollar weakness pushed EUR/USD pair above 1.1400 level on Wednesday. While the U.S. Dollar Index also fell to 3 months low against its rival currencies. U.S. stocks also turned negative and posted losses on Wednesday.

On the other hand, at 11:45 GMT, the French Industrial Production was dropped by -20.1%against the expected -10.0% during April and weakened Euro. Furthermore, On Wednesday, the European Commission said that Russia and China were running targeted influence operations and disinformation campaigns in the European Union and its neighborhood and also around the globe.

Daily Support and Resistance

  • R3 1.1522
  • R2 1.1473
  • R1 1.1422

Pivot Point 1.1372

  • S1 1.1321
  • S2 1.1271
  • S3 1.122

EUR/USD– Trading Tip

The EUR/USD continues to trade sideways in a narrow trading range of 1.1400 – 1.1348 level, and right now, it seems to test the lower boundary of this range. On the lower side, the next target level appears to be 1.1270. Currently, the pair is facing immediate support around 1.1340 level, and closing of candles above this level may lead the EUR/USD prices to further lower towards 1.1400. The 50 EMA is also suggesting a bullish bias for the EUR/USD pair as the pair has closed a Doji candle right above the EMA. On the higher side, a violation of 1.1400 resistance can lead to EUR/USD prices until 1.1465. Odds of bullish bias remains solid today.


GBP/USD – Daily Analysis

The GBP/USD pair was closed at 1.27457 after placing a high of 1.28130 and a low of 1.27060. Overall the movement of GBP/USD pair remained bullish throughout the day. The currency pair GBP/USD continued its bullish trend for the 10th consecutive day and maintained its bullish streak on Wednesday on the back of the latest monetary policy decision by Federal Reserve.

On Wednesday, the U.S. Fed announced its monetary policy decision in which it held its interest rates on the same level near zero and did not go for negative interest rates. However, the Fed also announced to hold the interest rates at the same level until the end of 2022. Federal Reserve also announced that over the coming months, it would increase the holdings of Treasury securities and agency residential and mortgage-backed securities at the current level to support the credit flow to households and businesses. This all was decided to sustain smooth market functioning and defend the U.S. economy.

Additionally, the Open market Desk will continue to offer large-scale overnight and term repurchase agreement operations. The Committee will keep a close eye on market conditions to adjust its plans as needed.

The DXY fell off from 96 levels and was down by 0.5% on Wednesday, the dovish statement from Fed weighed on the U.S. dollar and hence, GBP/USD pair reached near 3-months highest level.

On the other hand, Brexit trade negotiations did not go well between the U.K. and Brussels, and the U.K. wanted to reach an agreement with the E.U. this year. There are no chances of even any progress in trade talks with the deadline to seek an extension coming closer day by day.

According to the boss of the U.K.’s most influential business group, the CBI, U.K.’s economy was not ready to withstand the additional disruption of no-deal Brexit. The furlough scheme and grants will end at once, and then thousands of businesses and millions of jobs will likely hit the water. A CBI member, Carolyn Fairbairn, said that British firms do not have the resilience to cope with leaving the European Union without any deal after the losses of the coronavirus crisis.

On Wednesday, GBP/USD prices rose above the level of 1.27710 but dropped below it and continued moving in a confined range. The surge in prices was due to the broad-based U.S. dollar weakness after the Fed’s statement and economic data release. At 17:30, The CPI & Core CPI for May from the U.S. showed a decline of 0.1% against the expected 0.0% and weighed on the U.S. dollar. The weak dollar pushed GBP/USD pair on the higher level.

Daily Support and Resistance

  • R3 1.2912
  • R2 1.2863
  • R1 1.2804

Pivot Point 1.2755

  • S1 1.2696
  • S2 1.2647
  • S3 1.2588

GBP/USD– Trading Tip

The GBP/USD pair is trading with a bearish bias at 1.2650 level ever since it has violated the upward channel on the lower side. On the 4 hour timeframe, the Cable has closed a strong bearish engulfing candle, which suggests a dominance of sellers in the market as this can trigger selling until 1.2625 level. Immediate support can be found around 1.2625, while a breakout of this can trigger more selling until the next support level of 1.2582 level. Let’s look for selling trades below 1.2690 level today. 


USD/JPY – Daily Analysis

 The USD/JPY pair was closed at 107.123 after placing a high of 107.872 and a low of 106.987. Overall the movement of the USD/JPY pair remained bearish that day. AT 4:50 GMT, the Core Machinery Orders from Japan for April dropped to -12% against the expected -7.5% and weighed on Japanese Yen. The PPI for the year from Japan was declined by 2.7% against the expected decline of 2.4% and exerted pressure on JPY.

On the other hand, at 17:30 GMT, the CPI and the Core CPI during May from the United States was dropped to -0.1% from 0.0% of expectations and weighed on the U.S. dollar. The Federal Budget Balance for April was declined by 398.8B against the expected 580.8B.

The poor than expected CPI & Budget data from the United States on Wednesday weighed on the U.S. dollar, which dragged down the USD/JPY pair with itself. Furthermore, the dovish statement from the Federal Reserve will keep its interest rates on hold at a level near zero until the end of 2022. U.S. economy was not in good condition, and the projections made by the Fed about the economic contraction this year was 6.5% and of unemployment to be raised by 9.3.

Fed reduced its interest rates in March to near zero amid coronavirus crisis and said that until the economy was back on track Federal Reserve has pledged to maintain low rates. Fed has provided trillions of dollars to its financial system, Treasury purchases to support business, state, and local governments. It also started a new program to lend to small, medium-sized firms. Wall Street, major indices such as the S&P 500 and Dow Jones Industrial Average were negative that day, and the U.S. dollar index also fell to fresh three months low against major currencies.

Daily Support and Resistance    

  • R3 108.58
  • R2 108.23
  • R1 107.67

Pivot Point 107.33

  • S1 106.77
  • S2 106.43
  • S3 105.87

USD/JPY – Trading Tips

The USD/JPY is trading sharply bearish below 107.100 level, having violated the upward trendline at 107.600. Below this, the pair has a great potential to go for a 107.08 level, while a bearish breakout of 107.082 can dip further until 106.770. On the 4 hour chart, the MACD, and RSI, both are holding in the selling zone, demonstrating that there’s further room for selling in the USD/JPY pair. Let’s consider taking selling trades below 107.33 today. Good luck! 

Categories
Forex Signals

EURAUD Reveals Strength Signals

Description

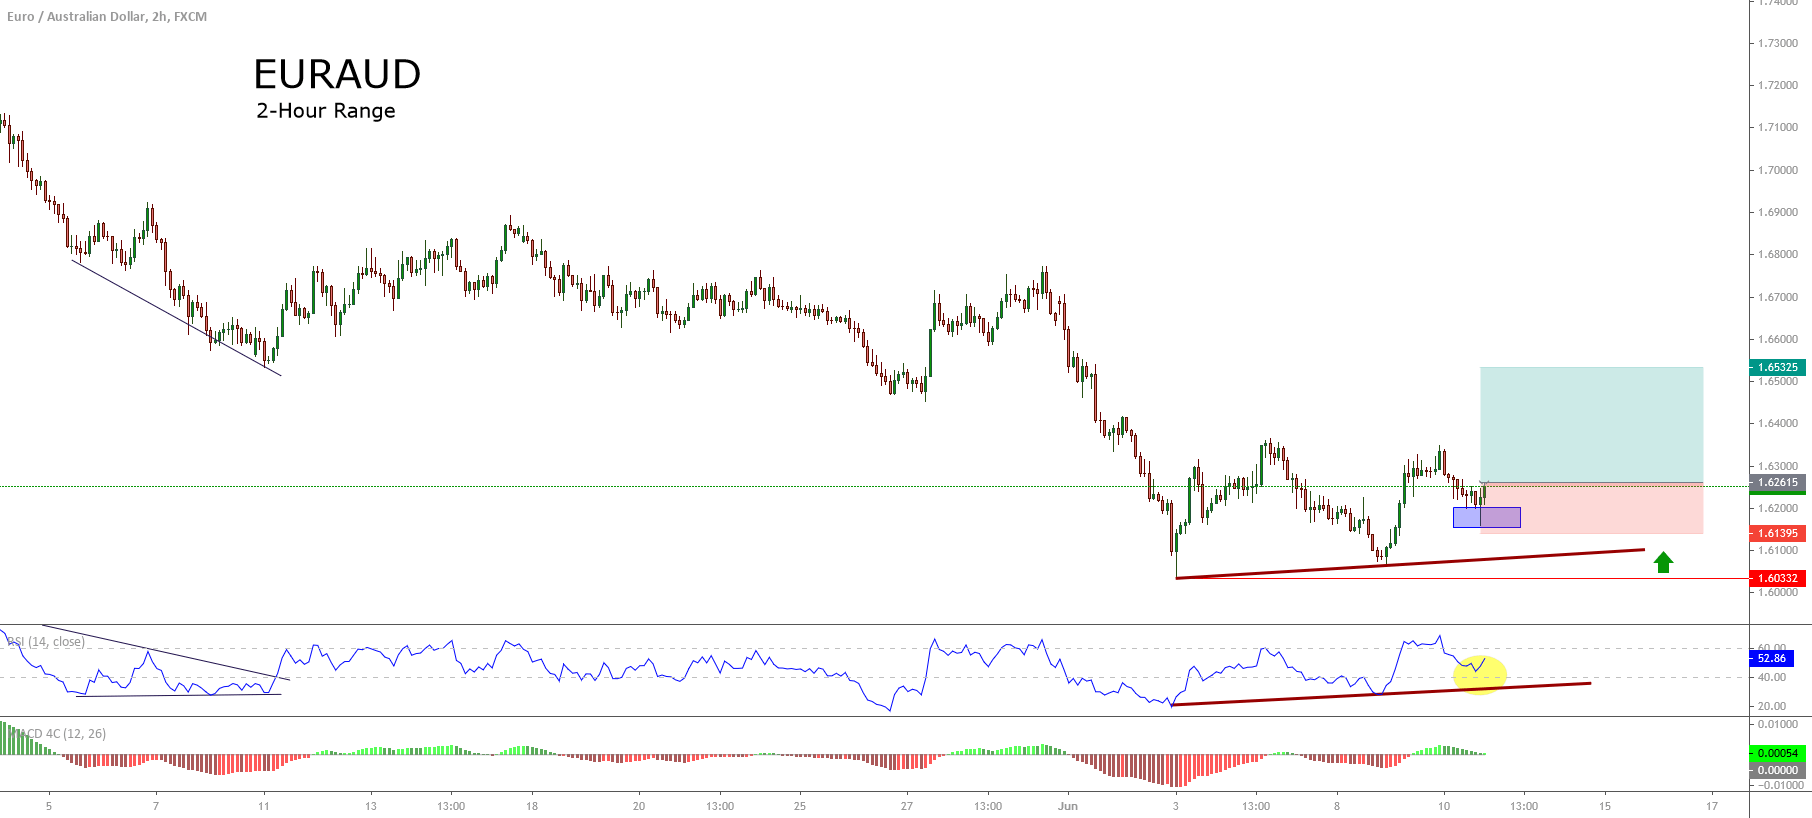
The EURAUD cross exposes in its 2-hour chart a short-term ascending move, developing a sequence of lower highs from the June 03rd low at 1.6033. 

During this trading week, we observe the last upward movement that EURAUD realized from the trading session corresponding to recent Monday 08th low at 1.6065 until Tuesday 09th high at 1.63495, which was elapsed in a small portion of time that the descending sequence from the previous week high at 1.63659. This context convinces us that institutional market participants could be interested in moving the price to the bull-side.

On the other hand, the bounce over level 40 observed in the SI oscillator leads us to conclude that the EURAUD cross is turning its bias from bearish to bullish.

Our outlook foresees a buy-side positioning from the current zone (1.6261) with a potential bullish target at 1.6532. This zone corresponds to the last pivot zone from where the EURAUD found support and then penetrated, creating a new lower low that carried down the price until the June 03rd low at 1.60332.

The invalidation level of our bullish scenario locates at 1.6139.

Chart

Trading Plan Summary

Categories
Forex Fundamental Analysis

‘Employed Persons’ – Impact Of This Fundamental Driver On The Forex Market

Introduction

The number of people who hold a legal job, or conversely, the percentage of unemployed people is a direct gauger for a country’s economic health. It is one of the most obvious and direct reflectors of a nation’s health. Common people often misinterpret the rate of employment or unemployment as we will see next, Due to which a good background understanding of what such numbers reflect is paramount for economic analysis.

What is Employment?

An individual who gets paid for a certain work he/she performs is said to be “Employed.” People work to earn a living and make ends meet at the most basic level and once these requirements are met people work to improve their standard of living through more work or better work or switching place of work etc.

There are a variety of modes through which an individual within a nation can find work. For example, an individual can be a freelancer or a regular employee in an organization or even run his or her own business and be called self-employed.

How is the Employed Persons’ Statistic calculated?

In this regard, The Bureau of Labor Statistics (BLS) has left no stone unturned. The range of data that is available with them regarding the employment situation is huge. BLS surveys and tracks monthly employment and unemployment situation within the country and classifies them based on geographical region, sex, race, industry, etc.

The technique employed by BLS is called the Current Population Survey (CPS). Since asking every individual in the country every month about his employment status and verifying those details is an impractical task Government employs CPS to survey the data.

CPS survey takes in about sixty thousand eligible households. The selected households, going to be surveyed, are representative of all geographical locations within the nation hence making it a miniature version of the country’s population. The authorities also take care of not repeating the same surveyed members in succession and make sure that no one household is survey consecutively more than four times.

Neither the surveyor nor the surveyed person does not directly ask or get to decide their employment status. The surveyors ask a specific set of questions which and the responses to these questions are decoded by computer algorithms to determine the status of the individual automatically. Once the data is collected and calculated, based on a wide variety of factors, like race, ethnicity, age, gender, and residing state, they are categorized.

Why is the Employment Situation important?

The Employment Situation report published by the Bureau of Labor Statistics in the United States goes as far back as the 1940s. Hence, there is good confidence in the data set due to its range and good accuracy in assessing and predicting economic activity within a nation.

The importance of employment rate, employment-to-population ratio, unemployment rate, or any other employment metric is understood when we understand the interaction of various economic factors on each other and how one coherently affects the other.

If the number of employed people within a country increases, it means the number of people who are getting paid is more, which means more money is in circulation in the economy;  This means that more people now have the purchasing power to procure produces and thereby increasing the overall consumption of goods and services within the nation. When the consumption is on the rise, it means the demand is on the rise, which makes the business flourish, which in turn can increase the need for more employment or give the industries a good push towards growth. Overall, either more people will be employed, and some of the currently employed sections of people may enjoy better pays over time due to flourishing business.

We understand here there is positive feedback within an economy where one section feedback into other sections of the society and growth compounds and macroeconomic metrics like Gross Domestic Products reflect these positively, giving further confidence to policymakers, investors, and foreign businesses.

Here we have seen above how such a simple statistic can imply such big macroeconomic conditions of a nation. No wonder why BLS has such a diverse set of employment survey statistics released every month, which receives such huge media attention. For instance, Every month, when the nonfarm payroll numbers also are released, it is closely watched by many analysts, people in business, investors, and traders all over to make critical decisions. Employment reports based on industrial sectors can also give investors a good idea of different sector’s performances and help them make informed investment decisions.

How can the Employed Persons’ Report be Used for Analysis?

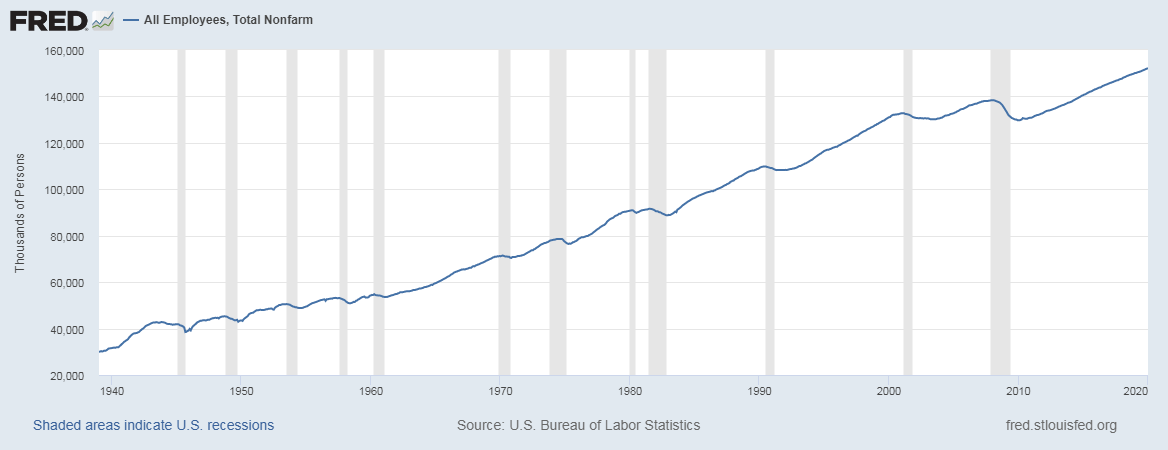
As useful as the Employment reports that are released every month, they are equally tricky to understand. For example, below is a snapshot of “All Employees, Total Nonfarm (PAYEMS) ” from the St. Louis Federal Reserve Economic Data (FRED)

When we see the above graph, one might think that the nation’s economy has been continuously growing, but that is not the case as the employment graph here is simply a function of population. Certainly, the population has increased from 1940 to 2020; hence the graph may seem increasing, but it is not solely because of improvements in the economic conditions of the country. We should also pay attention as some of the statistics of employment are not seasonally adjusted values meaning that during certain months of the year employment is on the low, and conversely, there seems to be an increase in unemployment like in January and February where seasonal jobs like construction are on a slowdown. Hence low numbers during these periods do not signal an economic contraction or slowdown in the economy.

Unemployment rate statistics are also used by Policymakers to assess causes of unemployment and take the necessary action to rectify the same. Investors use to assess the performance of certain industrial sectors before deciding to invest within a particular sector of a country. Many people use different categories of employment and unemployment statistic to analyze which sectors are facing slowdowns, layoffs, and which sectors have possible employment opportunities.

Apart from all these media, institutions, economic analysts all use these statistics in its diverse forms for their specific purposes.

Sources of Employment Reports

The U.S. Bureau of Labor Statistics is responsible for releasing this data, and that data can be found here – Employment | Unemployment

You can also find the data related to Employed Persons on the St. Louis Fed website.

Impact of the ‘Bank Lending Rate’ news release on the price charts

Just as how the unemployment rate plays a major role in fundamental analysis and determines the state, the economy, employment level is an equally important fundamental indicator. The employment level measures the number of people employed during the previous quarter. It gives the number of jobs created in an economy during a quarter. We understood in the previous section of the article that Job Creation is directly related to consumer spending. Therefore, it is a high impactful event. Even though most countries release unemployment data on a monthly, there are few countries that announce the number of Employed Persons in a quarter.

In today’s article will be analyzing the 4th quarter employment data of Switzerland, which was released in the month of February. A forecasted data of Employment level is not available as investors rely more on the unemployment rate for making investment decisions. The Employment level of Switzerland is released by the ‘Federal Statistical Office.’ A higher than previous reading is taken to be positive for the currency, while lower than previous reading is considered to be negative.

EUR/CHF | Before the announcement:

We shall start with the EUR/CHF currency pair where, in the above chart, we see that before the news announcement, the market has shown signs of reversal and is getting ready for a major event. Technically, the chart is in a perfect spot for taking a ‘short’ trade as this is a perfect reversal pattern. Therefore, aggressive traders with large risk appetite can enter the market with bigger stop loss since there can be a sudden surge in volatility after the news release. However, conservative traders should wait for the announcement and then take a suitable position.

EUR/CHF | After the announcement:

As we can see in the above chart, the price quickly goes up until its most recent high but immediately gets sold. The reason behind this increase in volatility to the upside is a lower number of employed persons in the 4th quarter compared to the previous quarter. Since the data was weak, traders sold Swiss Franc and bought Euro.

But later we notice that the candle leaves a big wick on the top and closes near its opening price. This means the data was not hugely worse, and since it was close to the previous quarter’s reading, there is a shift in volatility to the downside. This wick is a confirmation sign of the reversal, and now we can enter the market with a lower risk.

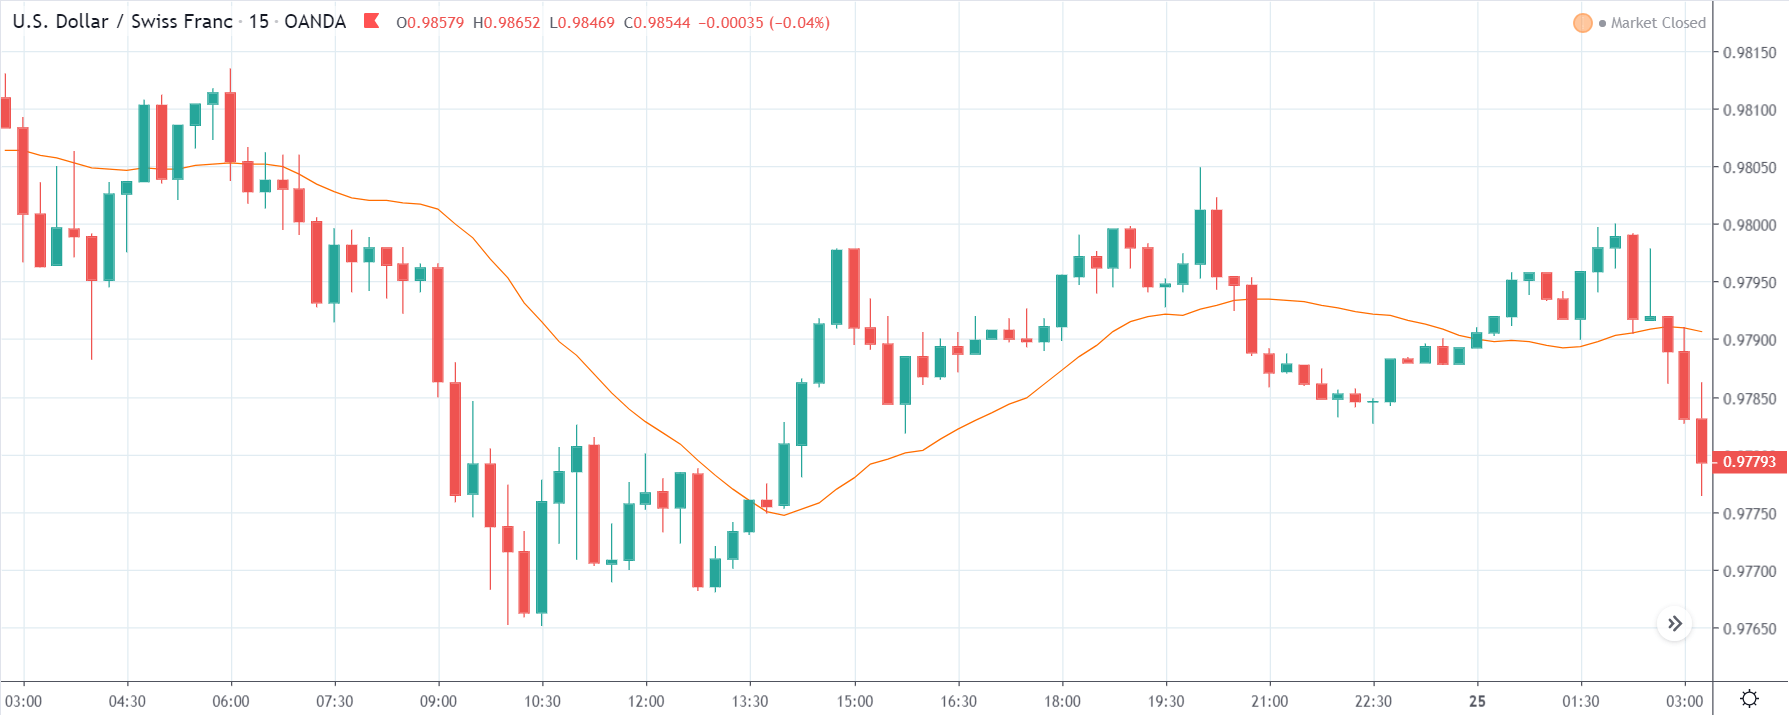
USD/CHF | Before the announcement:

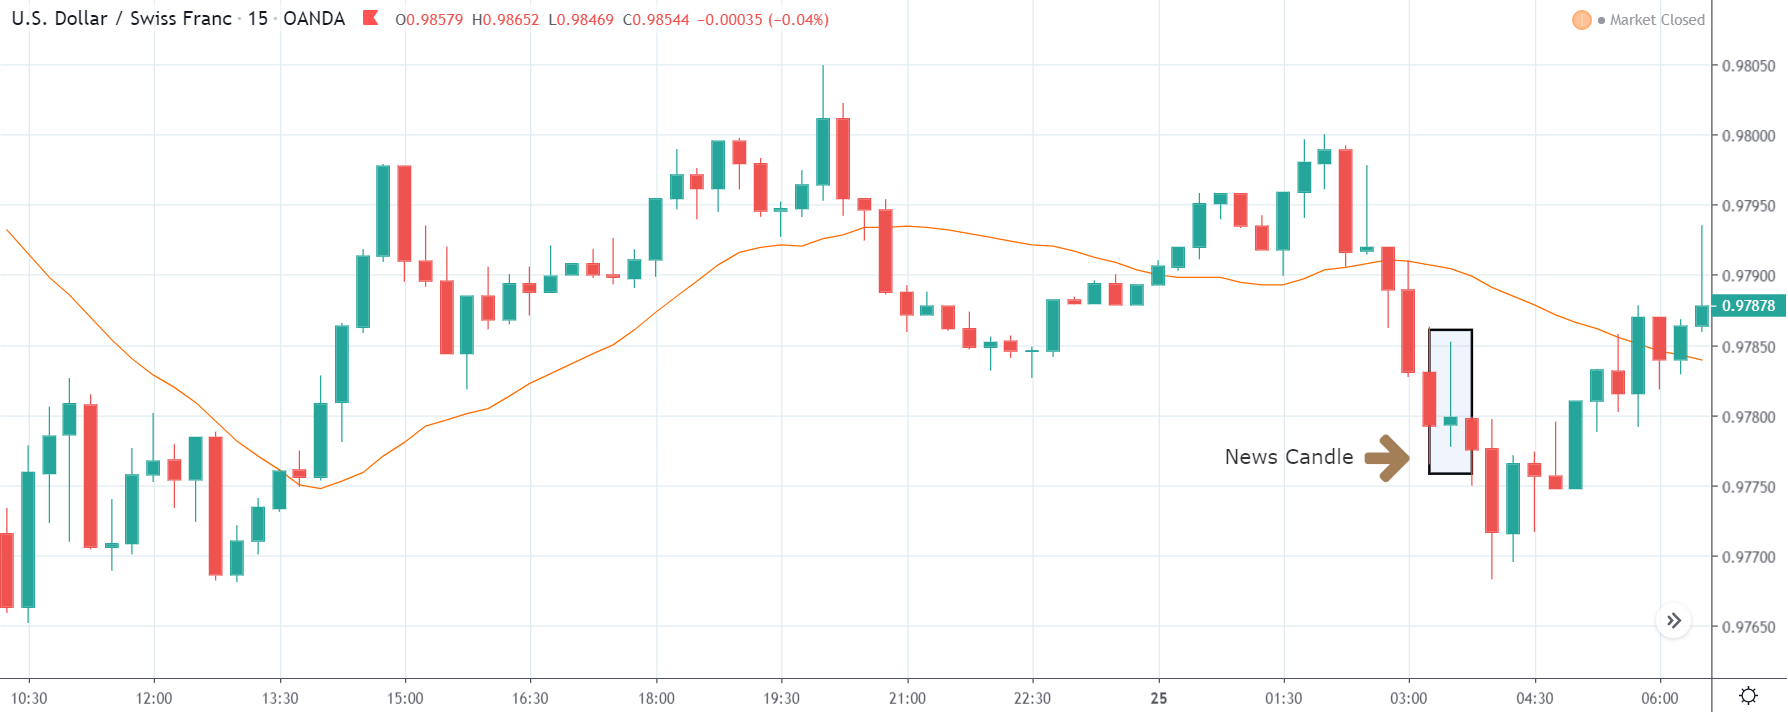
USD/CHF | After the announcement:

The above images represent the USD/CHF currency pair where before the news announcement, we see a ranging action of the market and presently approaching the support area. Since the market is already volatile here, a news release can essentially augment this volatility on either side. In such market situations, one should wait for the news release and then take a position based on the data. However, the ‘options’ market can offer an advantage of this volatility and hence can be traded by few.

After the news announcement, the currency moves similarly as in the above pair, where the volatility initially increases on the upside and later retraces back. An important thing we need to notice here is, we are very close to the support area, and hence going ‘short’ can be risky. This is how technical analysis can be useful.

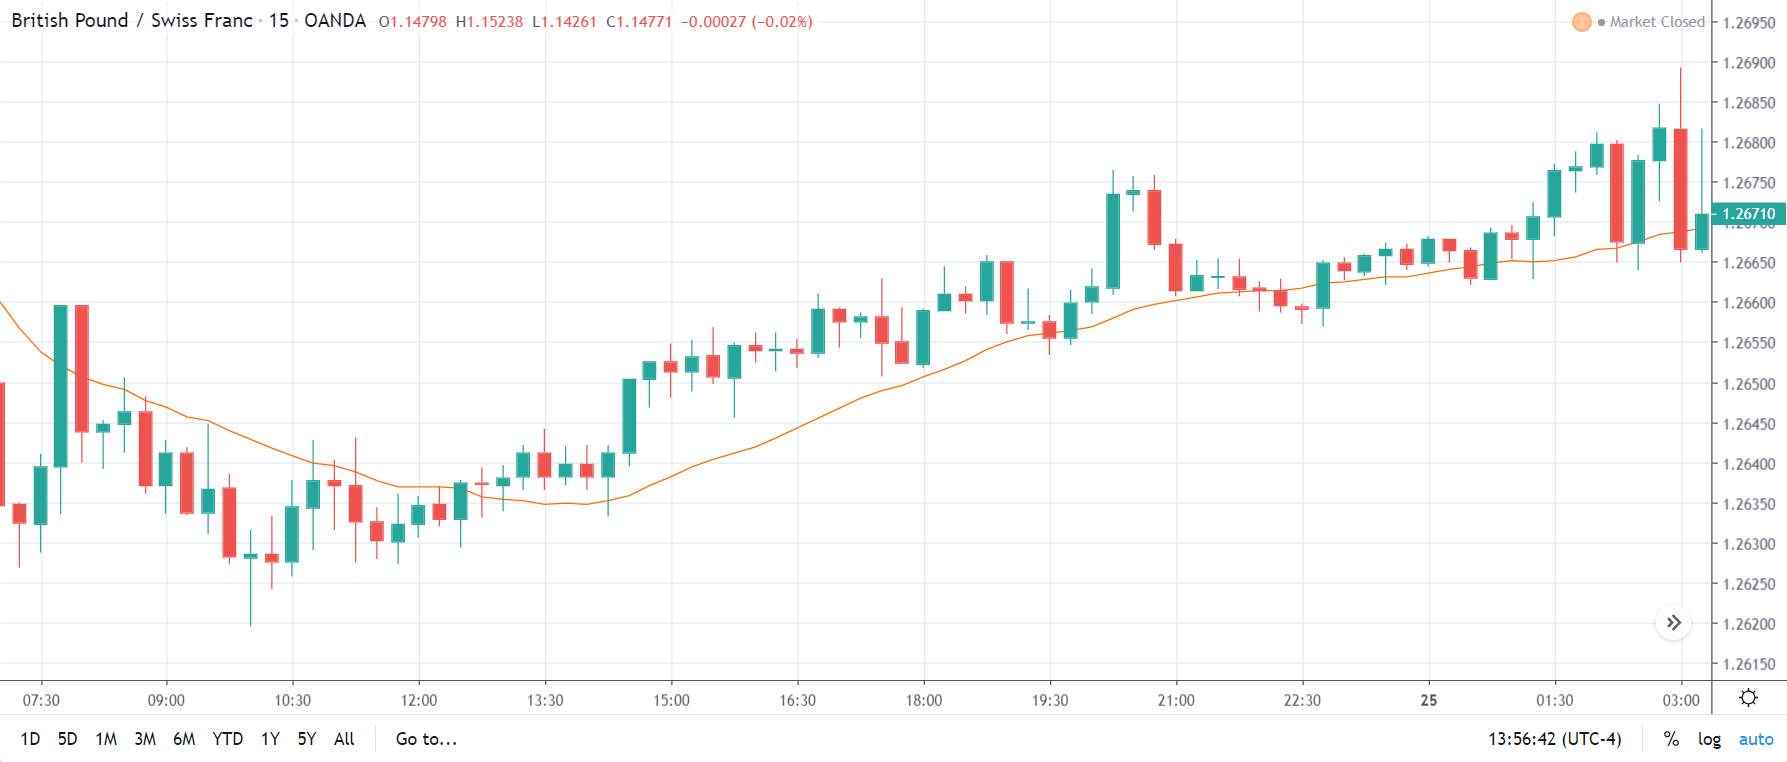
GBP/CHF | Before the announcement:

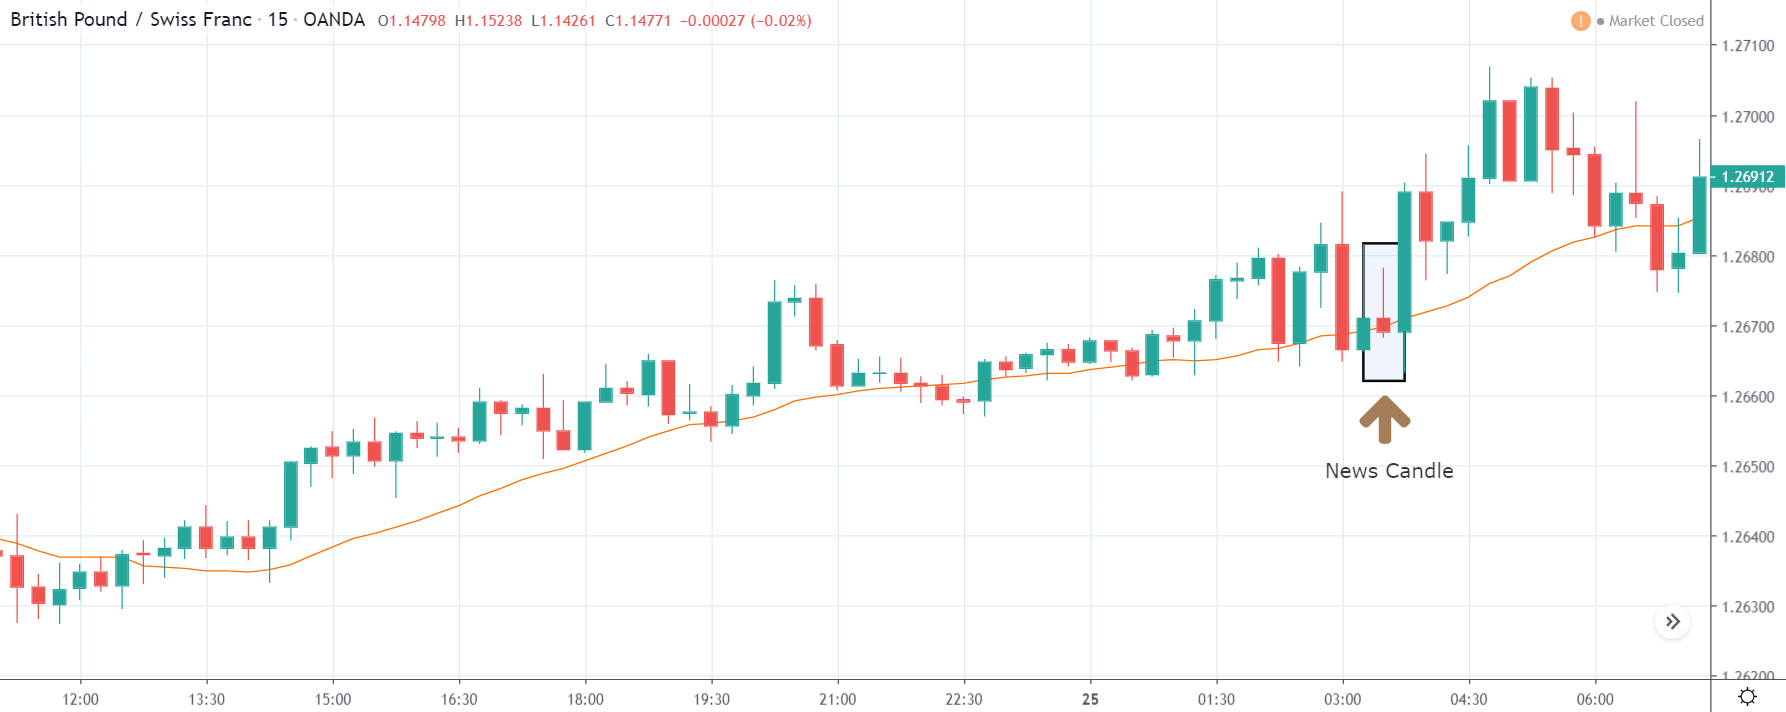
GBP/CHF | After the announcement:

Before the news announcement, we see that the GBP/CHF currency pair is in an uptrend pointing towards the weakness of Swiss Franc. This chart seems to be behaving opposite to that of EUR/CHF, where the uptrend is very strong with no sign of reversal. One of the reasons for this trending nature could be due to the strength in British Pound with little influence of Swiss Franc.

After the news announcement, we observe that the Employment data has the least impact on this pair, and the price fails to fall below and remains above the moving average. Since we don’t witness a drastic change in volatility, the only way to trade this pair is by waiting for an appropriate retracement and using technical indicators to join the trend.

That’s about ‘Employed Persons’ and its impact on the Forex market after its news release. If you have any questions, please let us know in the comments below. Good luck!

Categories
Forex Basic Strategies

Pro Scalping Technique By Combining Stochastic With Bollinger Bands

Introduction

Scalping is a trading strategy that helps traders to take advantage of minor price movements on lower timeframes. It is one of the quite popular ways of trading the Forex market. There are many successful scalpers who make a lot of money by scalping the minor price moves. To be a scalper, we must be emotionally intelligent and have the ability to make quick decisions.

Scalpers place anywhere from 0 to a few hundred trades in a single day. Ideally, smaller movements in price are easier to catch compared to the longer moves. Typically while day trading, if the win/loss ratio is less than 50 percent, traders still make money. On the other hand, in scalping, it is critical to win most of the trades. Otherwise, we will end up on the losing side.

Stochastic Oscillator

Stochastic is a wonderful indicator developed by George C. Lane in late 1950. This indicator doesn’t follow the price or volume like other popular indicators in the market.  Instead, it follows the speed and momentum of the changes that occur in price before the trend formation. Stochastic is a range bounded indicator, and it oscillates between the 0 and 100 levels.

Typically, a reading above 80-level is referred to as the overbought signal, and a reading below the 20-level indicates an oversold signal. The Stochastic indicator consists of two lines, where one reflects the actual value of the indicator for each session, and another reflects its three-day simple moving average. The intersection of these lines indicates the reversal in price action.

Bollinger Bands

Bollinger Bands is a technical indicator developed by John Bollinger in the 1980s. It is a leading indicator, and it consists of two bands and a centerline. Out of the two bands, one stays above the price action, and the other stays below. Both of these bands contract and expand depending on the market’s volatility. When price action hits the lower band, it indicates a buy trade, and when it hits the upper band, it indicates a sell trade.

The Strategy

The strategy we are going to discuss is one of the most basic but effective scalping strategies ever used in the market. The idea is to apply both indicators (Bollinger Band & Stochastic) on the price chart. When the price action hits the lower Bollinger band, and the Stochastic is at the oversold area, it is an indication for us to go long. Conversely, when the price action hits the upper Bollinger band and if the Stochastic is at the overbought area, we can go short.

In the chart below, we can see that our strategy has generated a few buy/sell signals in the EUR/AUD Forex pair. The price action was in an overall uptrend. When both of the indicators gave us the signal, we took both buy and sell entries accordingly. In the chart below, the buy trades have given us some good profits, but in the sell trades, the profit was comparatively less. Always remember that these things are quite common in scalping. If you are an aggressive scalper, trade both buy sell signals. But if you are a trader who prefers to scalp the market with the trend, follow the next strategy.

Scalping The Market By Following The Trend

Buy Example

The chart below represents an uptrend in the EUR/AUD Forex pair. As you can see, by following our strategy, this pair has given us three buy signals, and all the trades were quite healthy and have performed well in the market. If you scalp the market by following the trend, it is easy to make big gains. For scalping, it is required to put smaller stops. Hence, always go for 4 to 5 pip stop-loss and 10 to 15 pip target. You can also exit your positions when the price hits the upper Bollinger band.

Sell Example

The below 3-minute chart of the GBP/JPY forex pair represents a couple of sell trades. As you can see, all the sell trades in this pair performed very well. We can also observe that every time the price action prints a brand new lower low. We took all the five selling trades on a single trading day, an all of them hit the take-profit range. So if we scalp the market by following the trend, it will be quite easy to make some profits from the market. The red arrows on the Stochastic and Bollinger Band indicators represent the sell signals.

Scalping The Ranges

Just like the trends, it is easy to scalp the ranges as well. In fact, the ranges are even easier to scalp than the trend because the support and resistance lines of the range offer extra signals for us. For ranges, all you need to do is to hit the sell when price action hits the top of the range and hit buy when prices hit the range bottom. If you add the Bollinger Bands and Stochastic indicator, the signals generated by the market will be stronger.

The chart below indicates a couple of buy/sell signals in the GBP/JPY 3-minute Forex chart. As you can see, we have gone long when prices hit the bottom of the range, combined with our strategy. The same applies to the sell-side. We have gone short when the price action hits the top of the range while respecting our strategy rules.

Conclusion

Scalping trading involves entering a trade for a shorter period of time to take advantage of small price fluctuations. When you enter a trade, it is advisable to risk lesser money and place as many trades as you can. We must have control over our inner greed and aim for smaller targets. In the beginning, it will be difficult for you to scalp the market as the smaller timeframes move way faster. You need to train your eyes a bit to understand the lower timeframes properly. Always try to scalp with a bigger trading account because the trading commissions can quickly eat up the smaller accounts.

Categories
Forex Videos

Fundamental Analysis For Novices Markit Manufacturing PMI!


Fundamental Analysis For Novices Markit Manufacturing PMI

Welcome to the educational video on fundamental analysis, and this one is about, Markit manufacturing PMI.
The PMI element is the Purchasing Managers’ Index and is compiled by IHS Markit for over 40 major economies throughout the world. The information is updated month on month and released subject to an embargo at certain times, depending on the country.


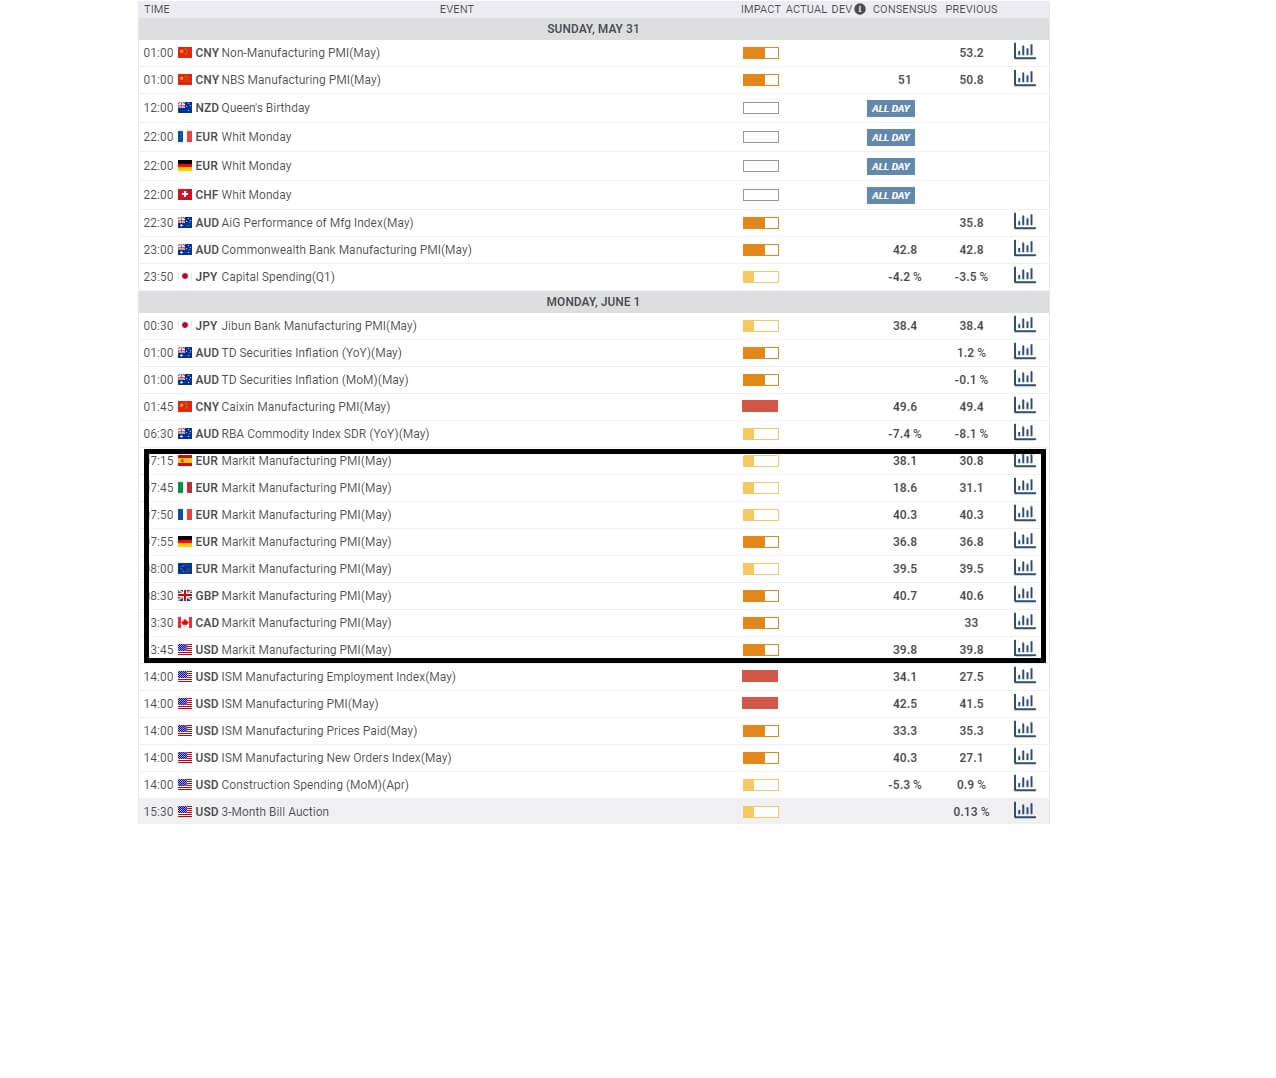
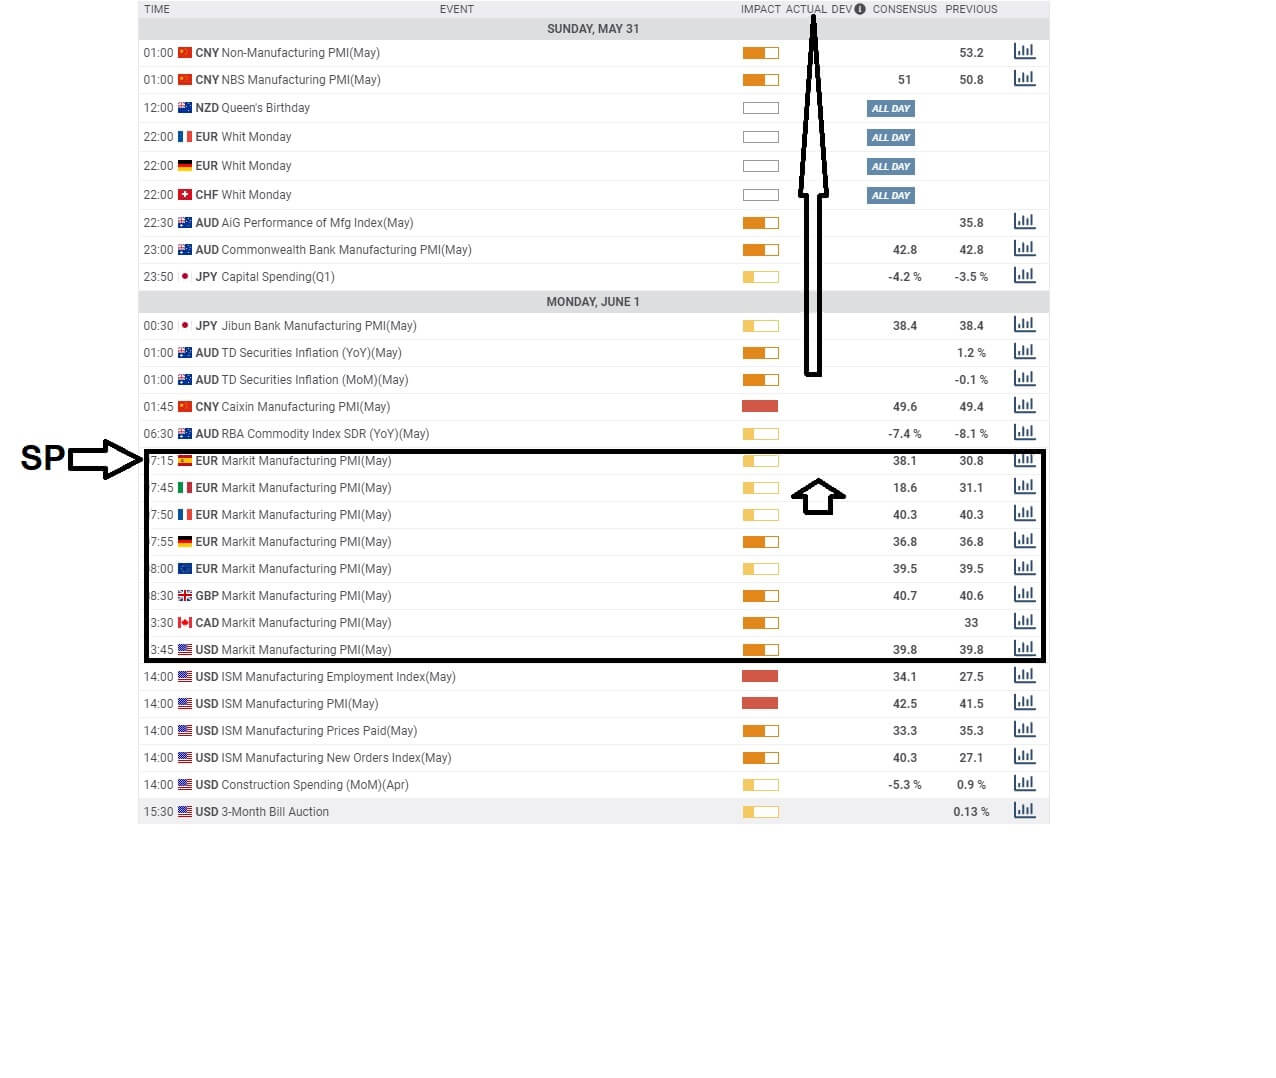
And so if you are keeping an eye on your economic calendar, you would expect to see something like this for Markit Manufacturing PMI’s.


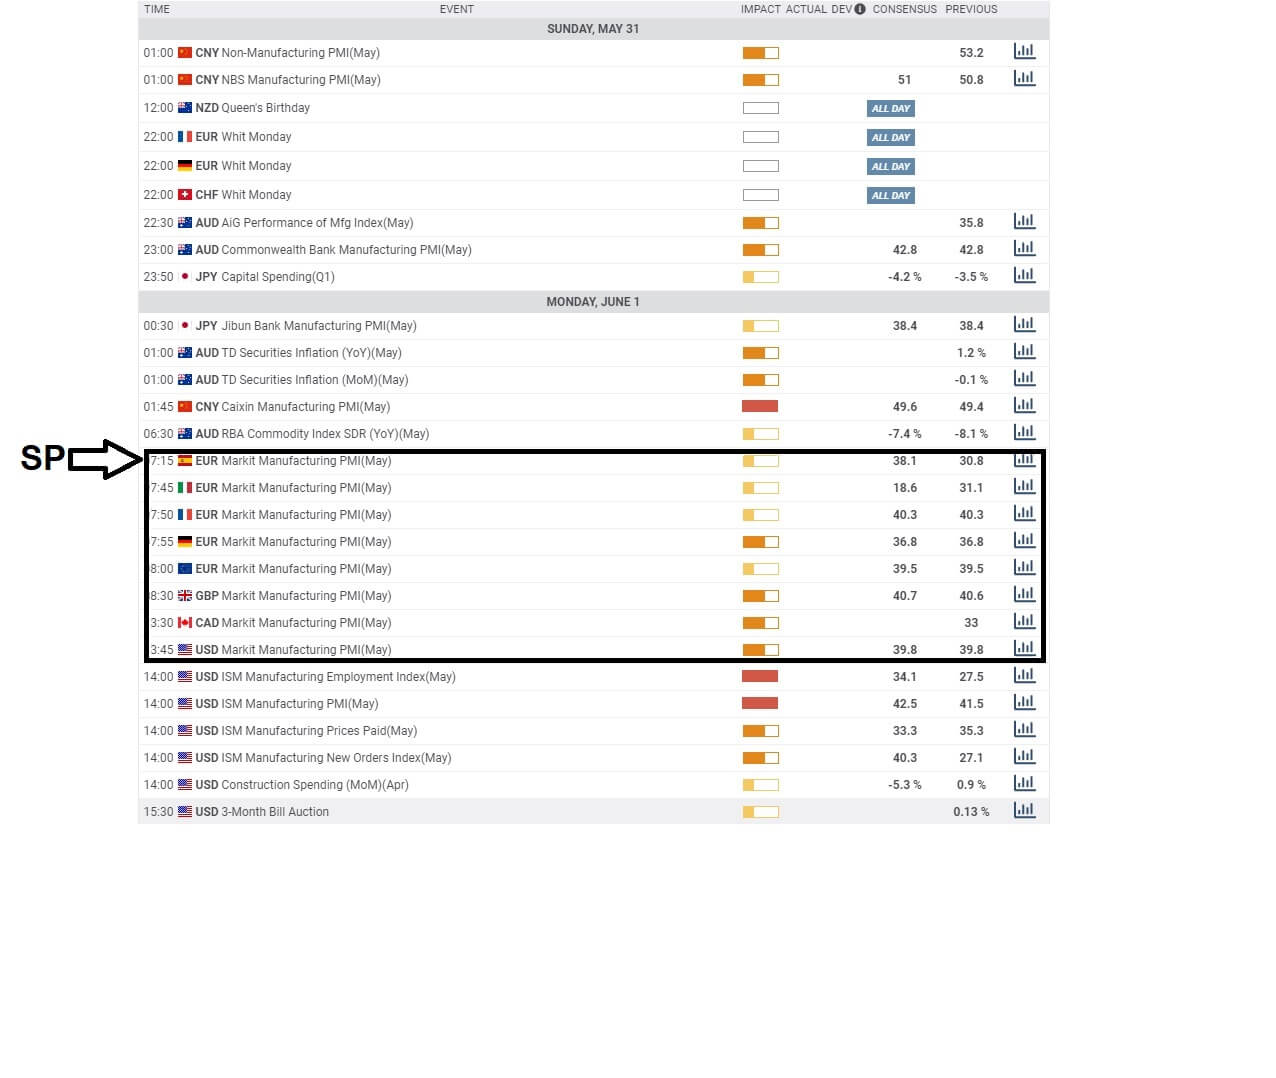
So the first one due on Monday, June 1st, is Spain.

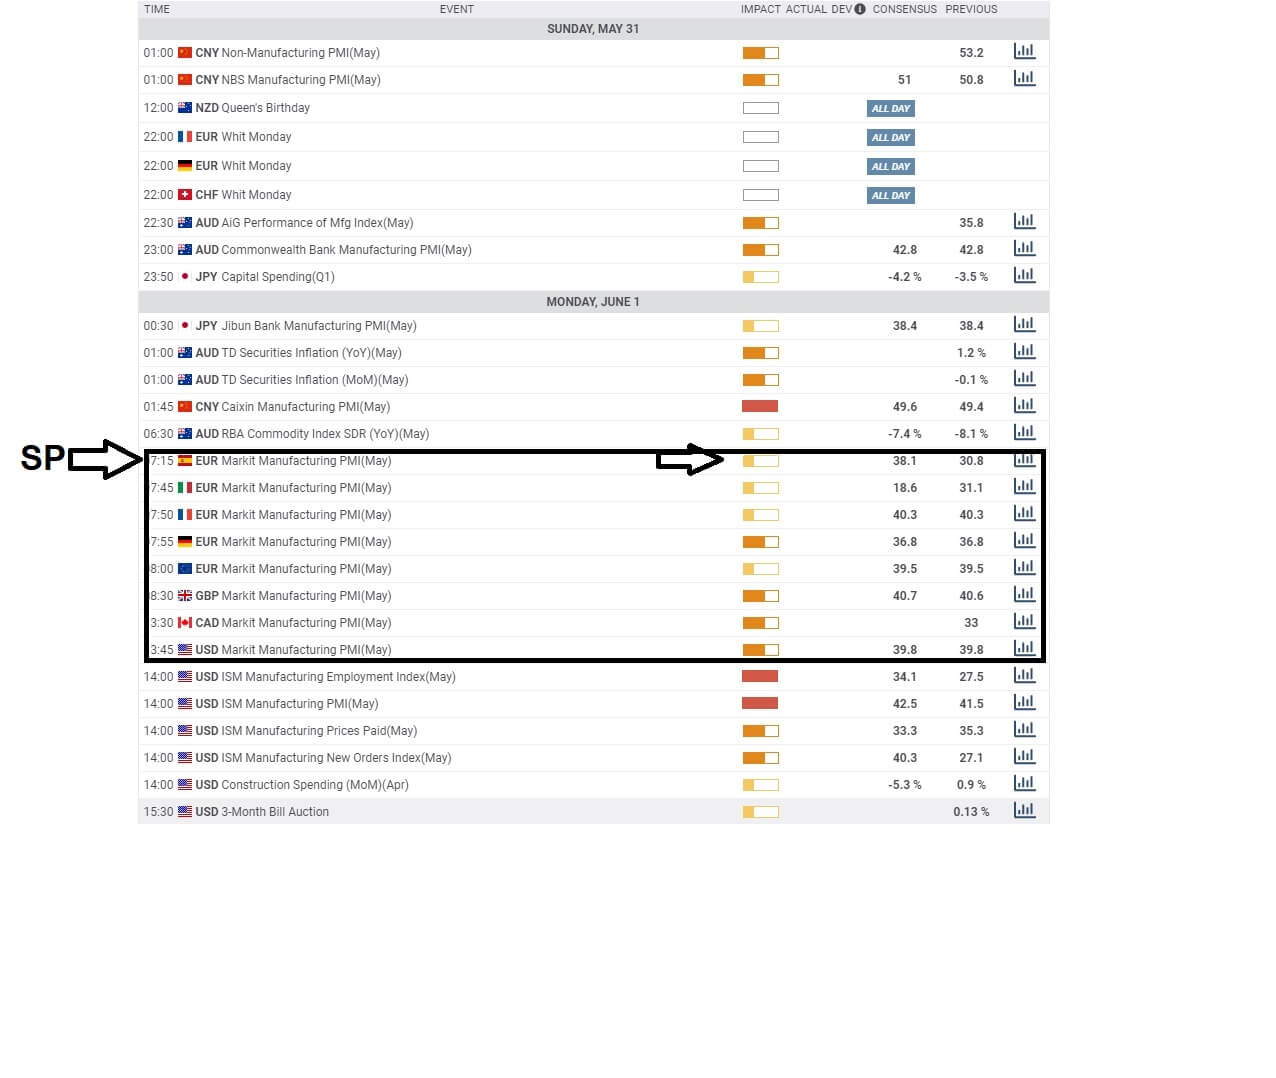
The bar on this type of calendar shows the impact the news release will have in the financial markets, pertaining to the economic conditions of the country and as a part of the Eurozone, where Spain shares the common currency.


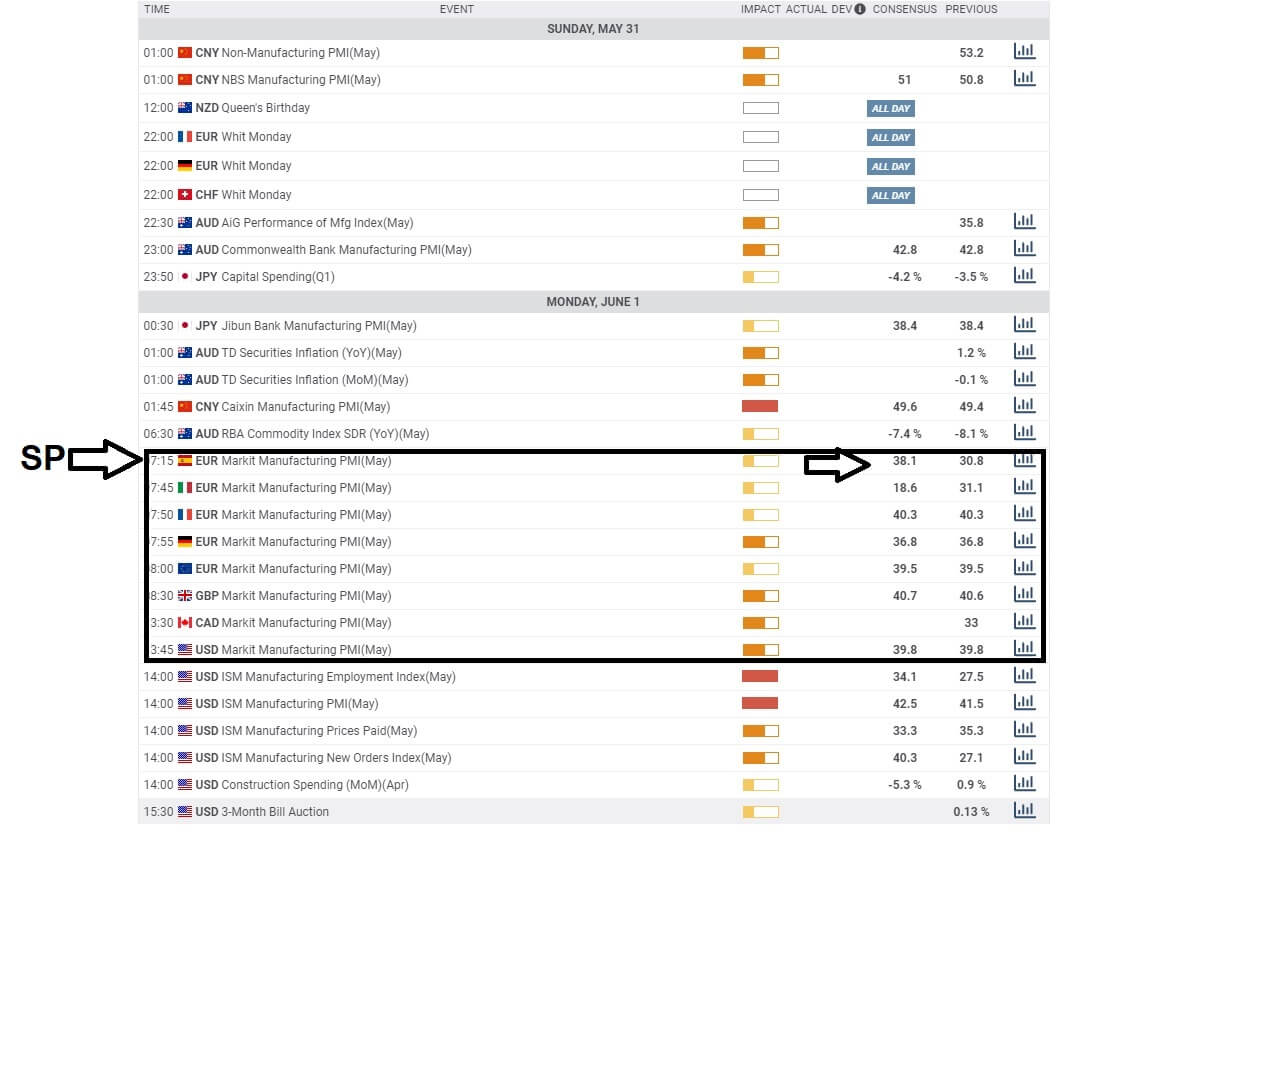
And then we have the previous month’s release, which was 30.8, the consensus by market analysts for this month’s figure, which is 38.1.


And when the figure is released at 7:15 a.m in Europe, the actual number will appear here.
The PMI, which stands for the purchasing managers index, is a snapshot of business conditions in the manufacturing sector for each country. Manufacturing is a huge component of a country’s gross domestic product, and therefore provides a picture of the overall economic conditions and financial health of a nation, in this case, Spain.

Generally speaking, a result above 50 signals bullish sentiment for the Euro, whereas a result below 50 is seen as bearish. Obviously, Spain is only one of 19 countries that use the Euro and one of 27 Eurozone member states, and because its economy is small in relation to some of the other country’s it has a lower impact.


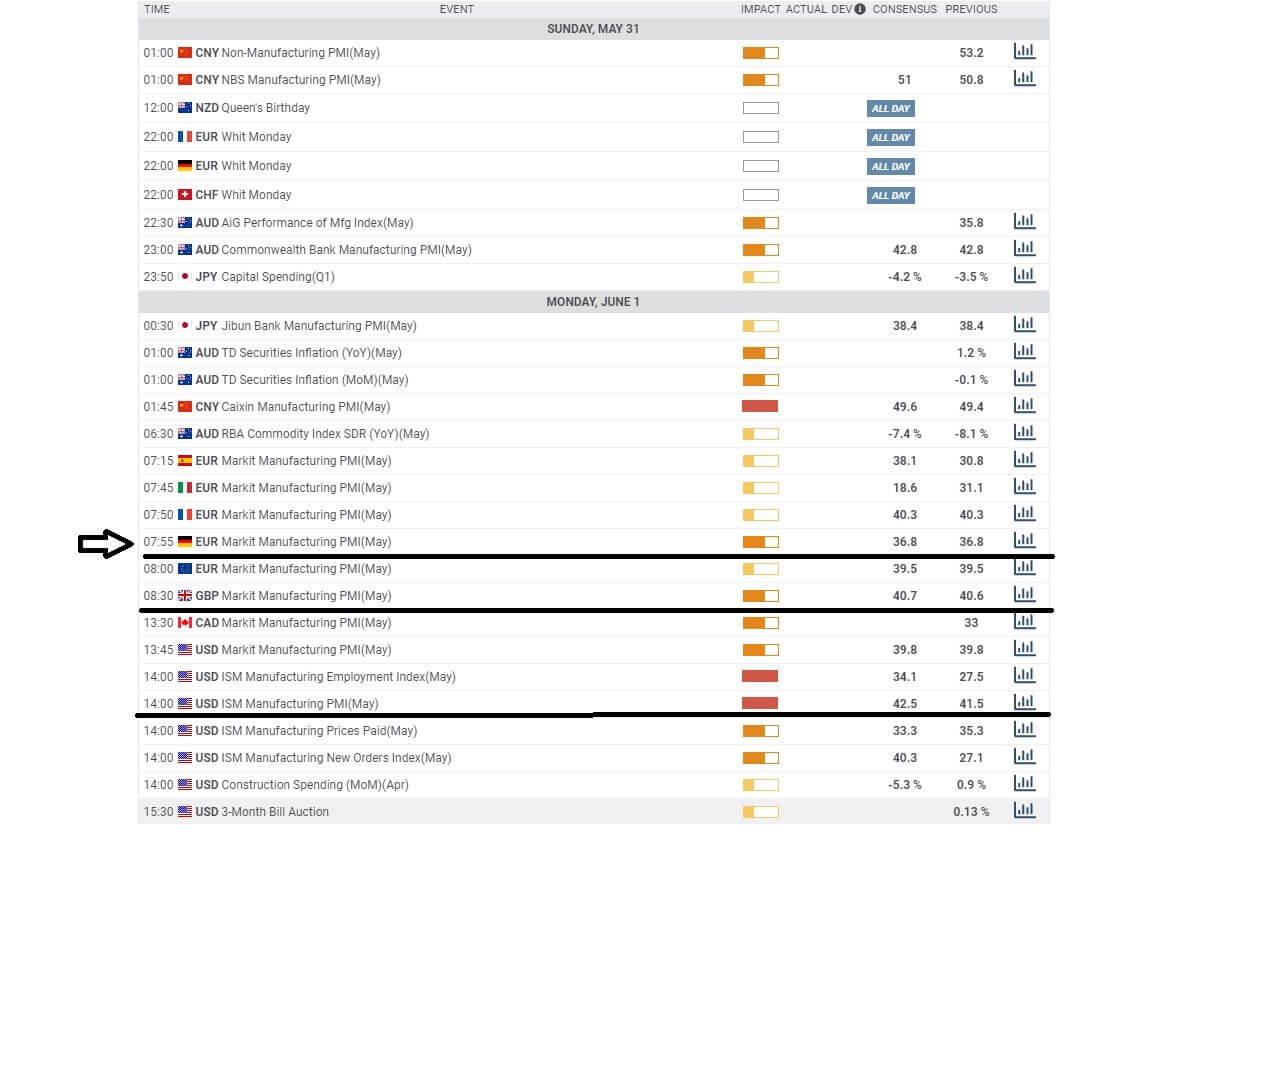
Here we can see that the impact bar is higher for Germany because it has a larger economy than Spain, and therefore its relevance is greater because Germany contributes more to the Eurozone coffers.


Similarly, the impact for Great Britain is of high importance.


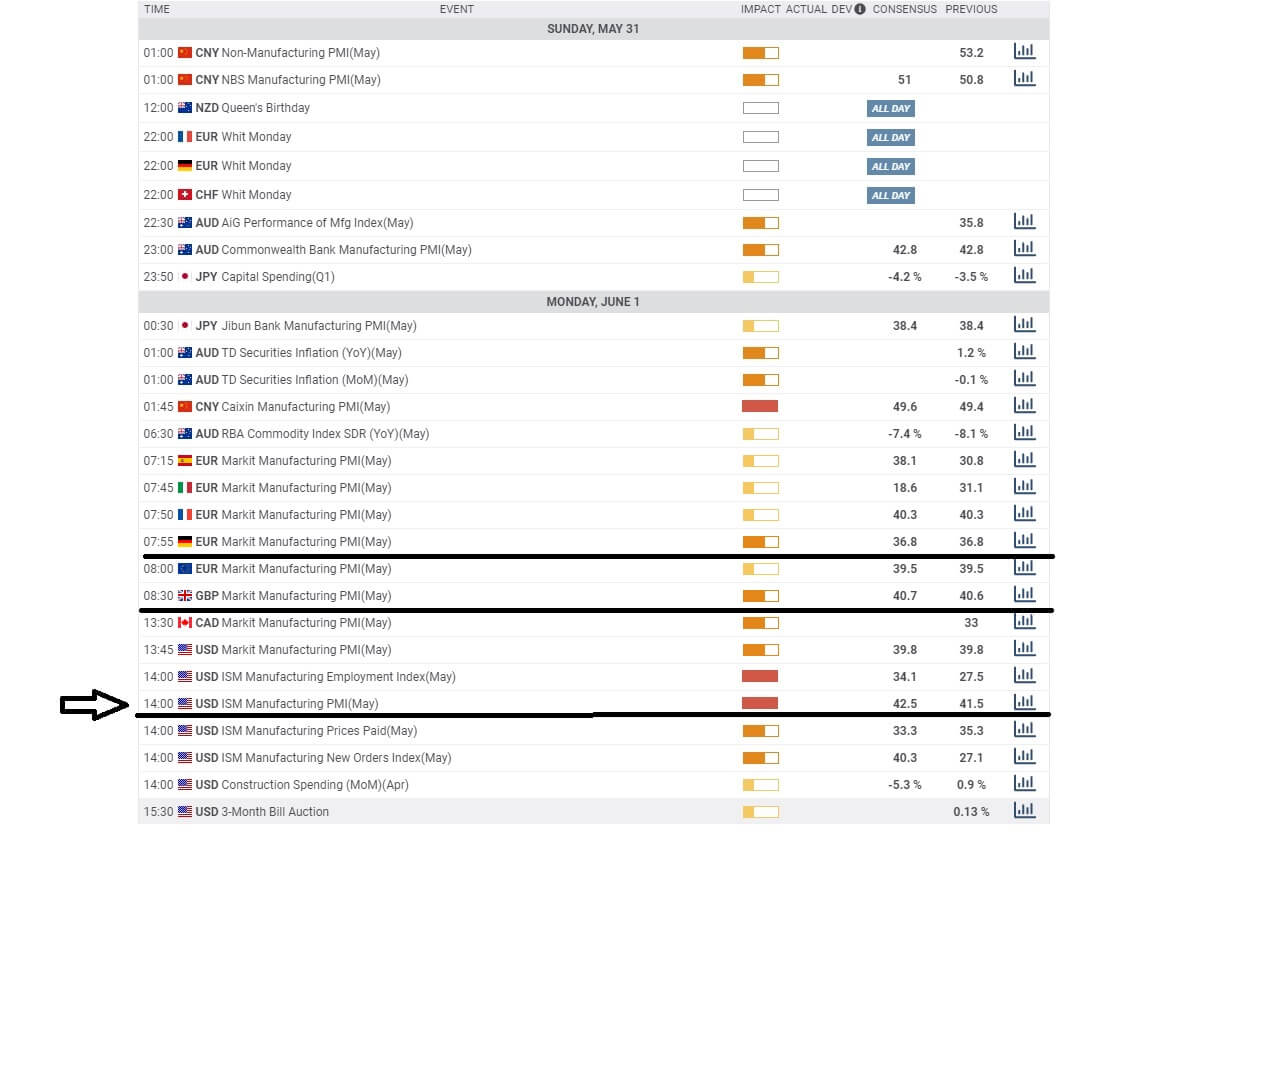
And when it comes to the United States, the PMI is very widely anticipated because it has a huge impact on the American economy and also because the US Dollar is the dominant currency in the world.
In the United States, this data is collated by a company called the Institute for Supply Management, or ISM and where they measure the manufacturing activity of more than 300 manufacturing firms across the USA, and where the monthly report, which is also referred to as the ISM Manufacturing Index, is announced on the first business day of each month, in line with most other countries, and where a reading below 50 suggests a contraction in manufacturing and where a number above 50 suggests expansion and where a reading of 50 means no change.

So how to trade the market manufacturing PMI and the ISM manufacturing index. Remember, we are looking for numbers above or below 50 and where above 50 is bullish and good for an economy, in which case you might expect to see a country’s currency exchange rate getting stronger. Conversely, numbers below 50 indicate a contraction in manufacturing for that country, and therefore this is a bearish number, and you might expect to see that country’s currency exchange rate move lower.

You will very likely find extreme volatility when the PMI numbers are released and are completely out of line with the market consensus. Markets do not like shocks, and when they occur, it creates market volatility.

Categories
Forex Price-Action Strategies

Do not Forget to Check the Daily Chart

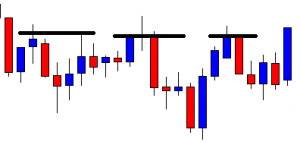
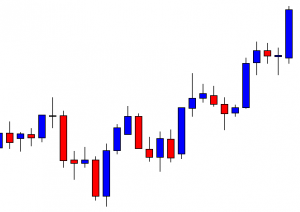
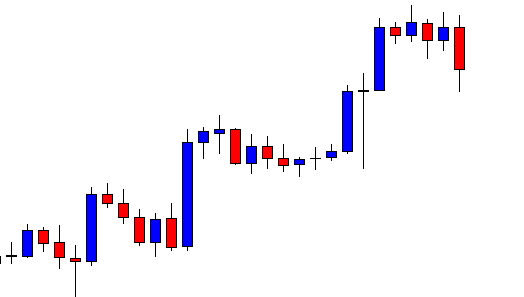
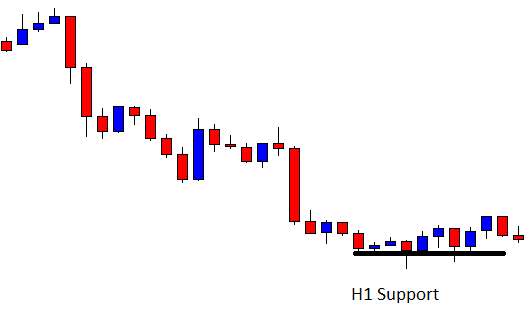
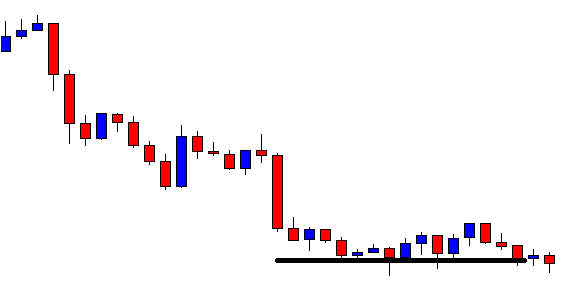
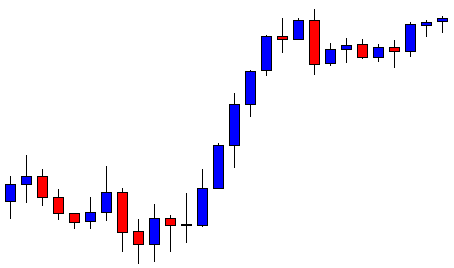
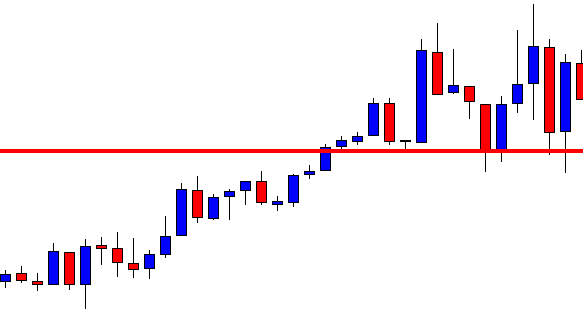
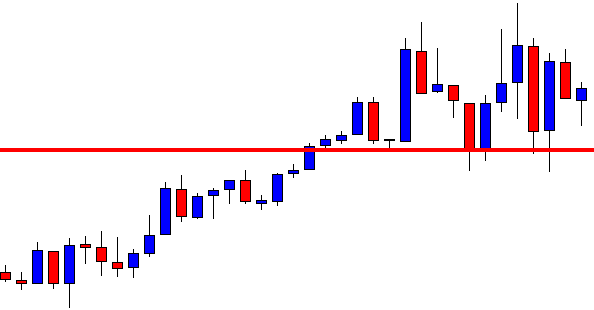
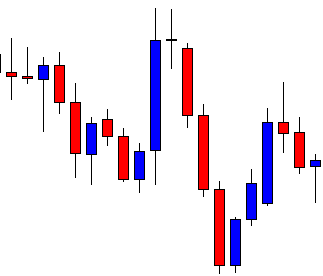
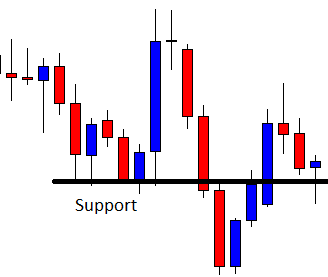
In today’s lesson, we demonstrate an example of an H4 chart and try to evaluate its price movement after breakouts. The chart shows that the price makes three breakouts altogether. The first two breakouts do not create that much momentum towards the breakout, but the last one does. We try to find out the reason behind it.

This is an H4 chart. The chart shows that the price makes a bullish move and consolidates. It seems that the price has found its support since it has already produced a bullish engulfing candle. The buyers may go long in the pair above consolidation resistance.

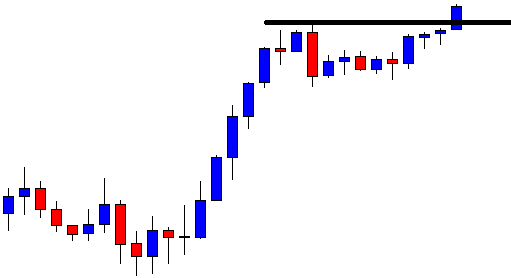
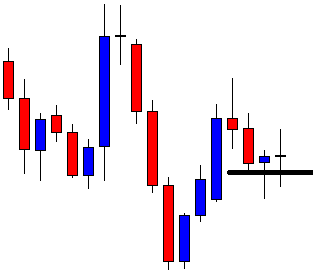
The chart shows that consolidation resistance is a strong level of resistance where the price gets rejection several times. Since it is an H4 chart, three times rejections, on the same level, means that it is a daily level of resistance. Thus, an H4 breakout may not create that much momentum all the time.

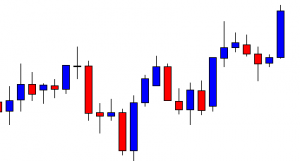
The chart shows that the price after making a breakout consolidates for a long time again. It is because of the daily resistance factor. The daily candle confirms the breakout. Thus, the price in the H4 chart consolidates. Look at the last candle. This comes out as a bullish candle breaching consolidation resistance. Let us find out what happens next.

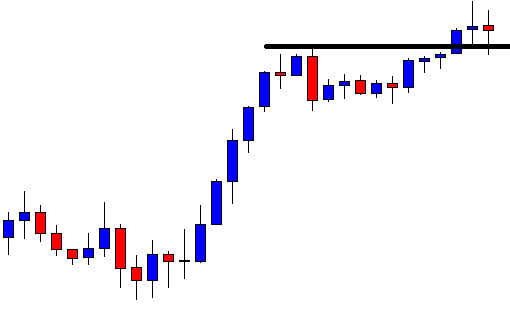
The last H4 bearish inside bar is the last candle of the day. It means the daily candle comes out as a bullish candle after the daily breakout, breakout confirmation, and daily reversal candle.

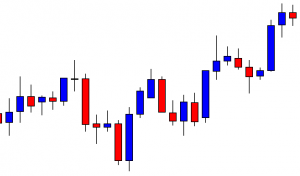
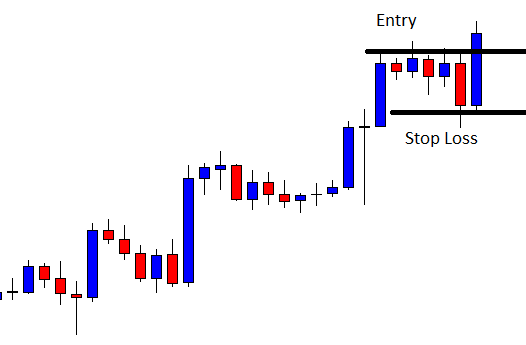
The price consolidates with one more candle to start the next trading day. A bullish reversal candle may push the price towards the North with good bullish momentum. Since the chart now belongs to the H4 traders as well.

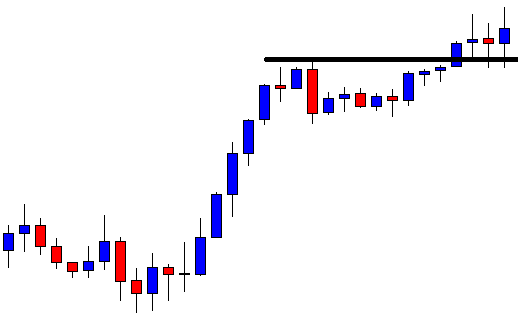
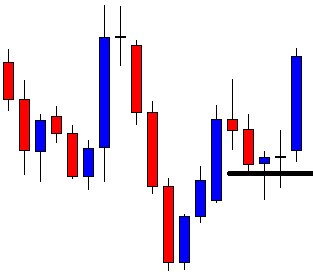
Here it is. The chart produces a bullish engulfing candle closing well above consolidation resistance. The length of consolidation is shallow. However, the bullish reversal candle looks to be a perfect signal candle.

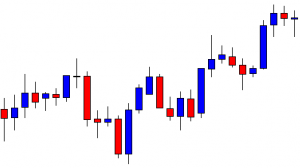
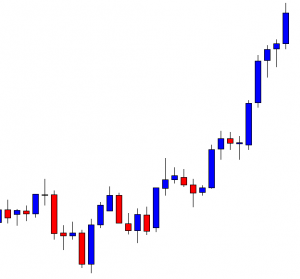
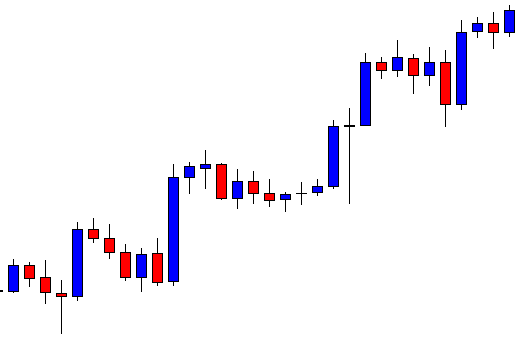
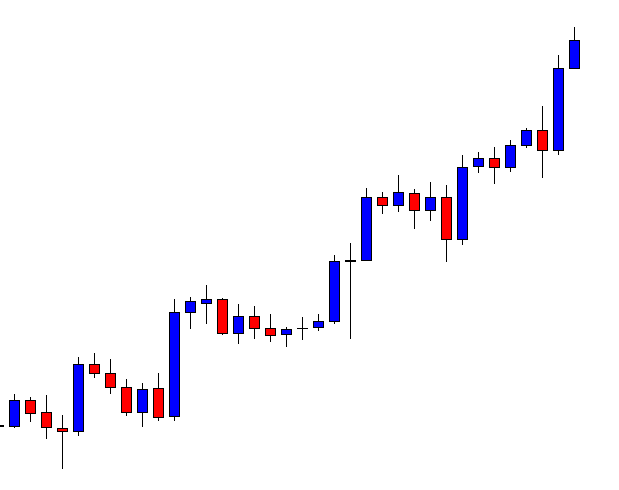
There she goes. The price heads towards the North with extreme bullish momentum. The last candle suggests that the price may continue its bullish journey. Let’s look at the last move. The price does not consolidate with enough depth, but it makes a strong bullish move. On the other hand, on the first two occasions, it consolidates well, but its breakout does not create good momentum. It is because, on the first two occasions, there is a daily resistance factor. The level of daily resistance makes the H4 traders wait for more. Once the price makes a breakout on the daily chart, it heads towards the breakout direction with good momentum. The H4 traders are to check the daily chart before taking entry. This is one more reason to check that one thoroughly.

Categories
Forex Market Analysis

Allianz Rejection to Signal a new Bearish Wave

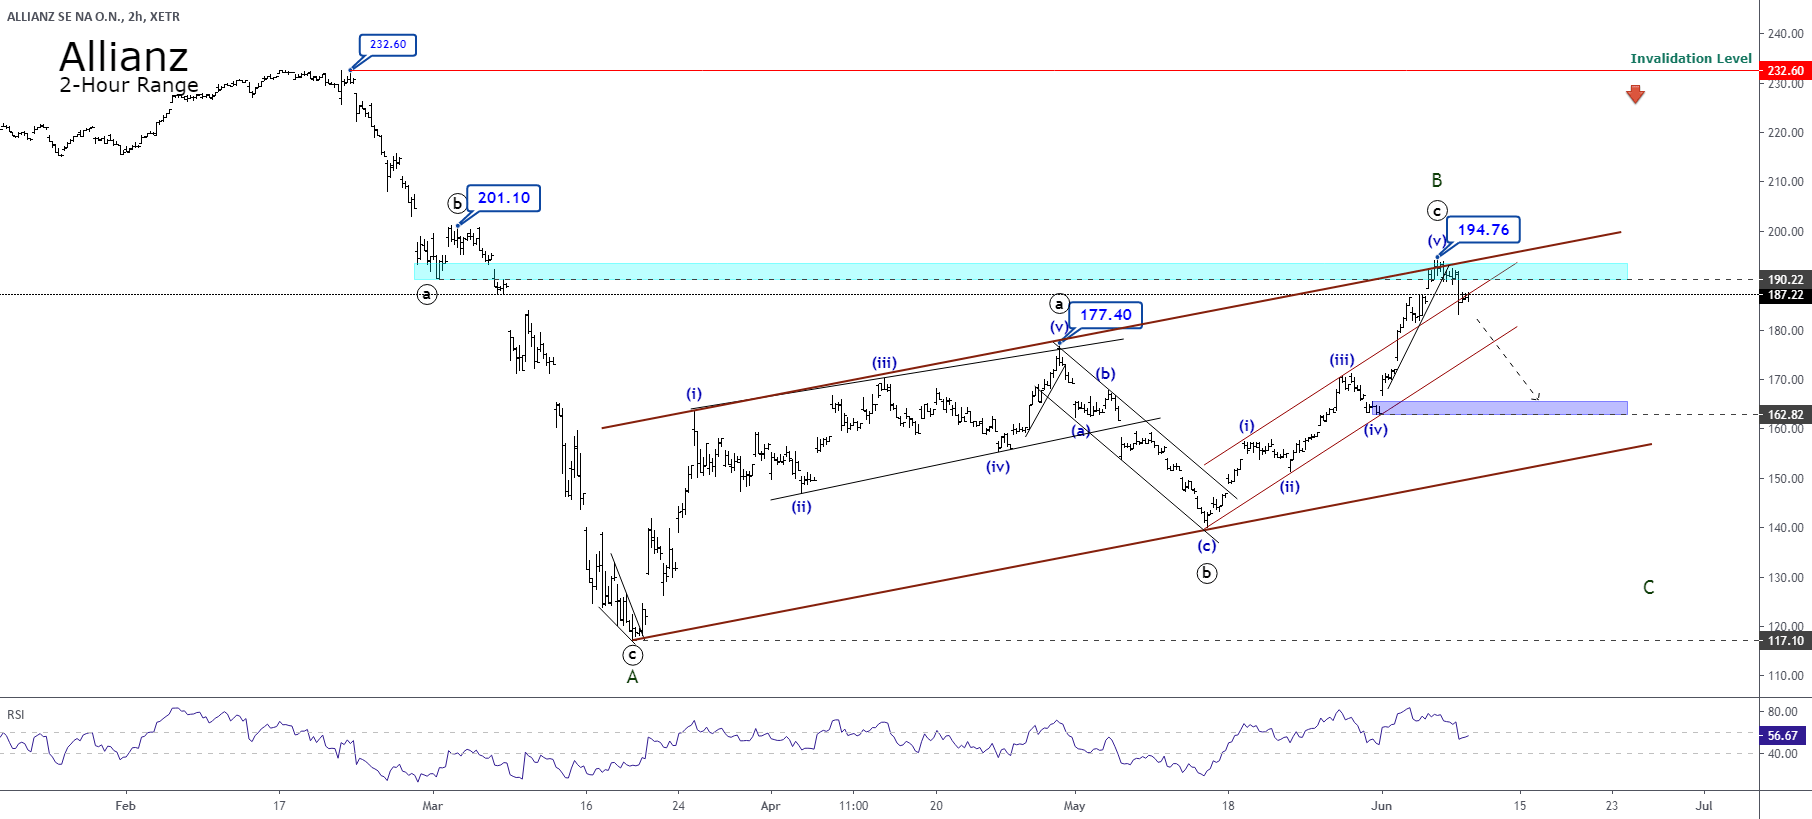
Allianz (XETRA:ALV), a German-based financial company, sinks near 3% in the current week after having completed a zigzag pattern (5-3-5) when the price reached the level of €194.76 per share.

ALV exposes in its 2-hour chart the rejection in the zone of the upper line of the ascending channel that converges with the pause zone of the first downward sequence started on February 21ts when the price topped at €232.60 per share.

In the previous chart, we observe that ALV completed its first bearish three-wave sequence corresponding to wave A of Minor degree labeled in green. In this first leg, we distinguish that Allianz, in its last move, developed a terminal Elliott wave pattern corresponding to an ending diagonal that was completed on March 19th when the stock price found fresh buyers at €117.10.

Once the price jumped in a three-wave sequence, ALV raised until €163.74 per share, completing the wave (i) of the Minuette degree labeled in blue. This movement reveals an overlapped structural series that corresponds to a leading diagonal.

According to the Elliott wave principle, a leading diagonal tend to appear in waves 1 or A. Its internal structure follows a subdivision as 3-3-3-3-3. In the figure, we observe that the leading diagonal pattern ended at €177.40 per share, where the price found fresh sellers and completed its wave ((a)) of Minute degree labeled in black.

The breakdown of the intraday trendline that advances with wave (v) of ((a)) validated the end of wave ((a)) and the start of a new movement corresponding to wave ((b)). This new corrective move carried down to ALV to find support at €139.78 per share on May 14th, where the German financial company found the incorporation of fresh buyers, who moved the market in an upward five-wave sequence corresponding to wave ((c)) of Minuette degree in blue.

The third movement corresponding to wave ((c)) of Minute degree, which belongs to the corrective structure of upper-degree, developed its rally in a five-wave sequence until the level €194.76. This move shows its fifth internal wave as an extended move.

Following the Elliot Wave Theory, we can observe that the retracement that Allianz is starting to develop could drag to the stock price until the zone of the beginning of wave (v) in blue, where the price should find support.

In conclusion, our preferred positioning remains on the bearish side until the zone that marks the beginning of wave (v) of the Minuette degree.

Categories
Forex Market Analysis

Daily F.X. Analysis, June 10 – Top Trade Setups In Forex – US CPI and FOMC In Play! 

It’s going to be a busy day from the trading viewpoint as the U.S. CPI and FOMC will be the main highlight of the day. FED isn’t expected to cut the rates, but the CPI figures are expected to improve a bit, just like labor market figures. The dollar can stay stronger on sentiments until the actual data comes out.

Economic Events to Watch Today


 EUR/USD – Daily Analysis

The EUR/US is trading with a bullish bias below 1.1366 level. The price action of the EUR/USD pair remained flat throughout the Asian session. The President of the ECB (European Central Bank), Christine Lagarde, said that the central bank’s measure to fight the coronavirus crisis was proportionate to the severe risks facing its mandate. Lagarde said during a hearing at the Committee on economic and monetary affairs of the European Parliament, which was conducted via video conference that the crisis-related measures were temporary, targeted, and proportionate.

Besides, the ECB announced an additional 600 billion euros in its pandemic emergency purchase program (PEPP) and scaled up its previous 750 billion Euro, to extend the program till mid-2021. According to Lagarde, ECB continuously monitors the proportionality of its instruments, and she said that the net effects to be gained by PEPP expansion were overwhelmingly positive. The need for expansion was to avoid any deeper recession and quickening the pathway towards normalization.

When asked about the German court ruling of the ECB’s massive public sector purchase program, she said she was confident that a solution could be found because it was addressed to the German federal government and the German Parliament. On the data front, at 11:00 GMT, the German Industrial Production showed a decline of 17.9% in April against the expectations of 16% and weighed on shared currency euro. AT 13:30 GMT, the Sentix Investor Confidence from the Eurozone for June decline to 24.8 from the expected reduction of 22.0 and weighed on Euro.

The depressed Euro after inferior to expected German Industrial Production dragged the pair EUR/USD with itself to the low of 1.12680.

Meanwhile, Lagarde’s Speech explaining the benefits of ECB’s latest expansion in PEPP provided strength to Euro, which pushed the EUR/USD pair higher. For now, the eyes will remain on the U.S. CPI and FOMC data while the FED isn’t expected to change its policy rate, but the CPI can be a main driver in the market.  

Daily Support and Resistance

  • R3 1.1516
  • R2 1.1441
  • R1 1.1391

Pivot Point 1.1316

  • S1 1.1267
  • S2 1.1191
  • S3 1.1142

EUR/USD– Trading Tip

On Wednesday, the EUR/USD is consolidating in a narrow trading range of 1.1370 – 1.1276 level, and right now, it seems to break out of this trading range. On the lower side, the next target level seems to be 1.1185. Currently, the pair is facing immediate support around 1.1274 level, and closing of candles below this level may lead the EUR/USD prices further lower towards 1.1185 level, which is extended by the 50 EMA level. On the higher side, resistance holds at 1.1315 level today. Odds of bearish bias remains solid today.


GBP/USD – Daily Analysis

The GBP/USD continues to extend its 8-day winning streak and soars to 1.2766, the highest since March 12, 2020, mainly due to the broad-based U.S. dollar strength triggered by the geopolitical tensions between the Korean neighbors. Currently, the GBP/USD is holding at 1.2769 and consolidates in a new trading range of 1.2702 – 1.2815. However, the Brexit concerns remain on the card while showing no progress, which ultimately exerted some downside pressure on the British Pound and contributed to the currency pair declines.

It should be noted that the British retailers reported a sharp drop in annual sales last month, but less bad than April due to some COVID-19 restrictions eased, and more customers started online shopping.

At the data front, the British retail consortium May total sales -5.9% YoY vs. April -19.1% pct YoY, second-biggest fall since records began in 1995. The British retail consortium May like-for-like sales +7.9% YoY vs. April +5.7% YoY, excluding temporarily closed stores and including online sales. In the meantime, the Barclaycard U.K. may consider consumer spending -26.7% YoY vs. April -36.5% YoY.

However, the reason for limiting further losses in the currency pair could be attributed to the report that the United Kingdom and Japan are set to discuss the post-Brexit trade deal on the day which could underpin the cable pair.

At the USD front, the broad-based U.S. dollar recovered its previous session losses and drawing bids at press time as investors awaiting the next moves from the U.S. Federal Reserve ahead of its policy meeting. The U.S. dollar gains were further bolstered by the risk-off market sentiment triggered by the growth in geopolitical stresses between the Korean neighbors. However, the U.S. dollar’s bullish bias turned out to be one of the key factors that kept a lid on profits in the GBP/USD currency pair. Whereas, the U.S. Dollar Index that tracks the greenback against a basket of other currencies increased by 0.10% to 96.707 by 12:53 AM ET (5:53 AM GMT).

The U.S. 10-year Treasury yields fell 4-basis points (bps) to 0.844% while the stocks in Asia and the U.S. stock futures reported modest losses. The lack of significant data/events will urge the Cable traders to look for further details on risk catalysts for a fresh impetus. The UK-Japan trade talks and the US-China tension could offer hints and can help the greenback to gains further bullish traction.

Daily Support and Resistance

  • R3 1.2926
  • R2 1.2841
  • R1 1.2787

Pivot Point 1.2702

  • S1 1.2647
  • S2 1.2563
  • S3 1.2508

GBP/USD– Trading Tip

The bullish bias in the GBP/USD continues to dominate the market, and it’s leading the GBP/USD prices higher towards 1.2760 while the next resistance holds around 1.2816 level. Continuation of an upward trend can lead Sterling towards 1.2866 level while the support holds around 1.2707 level today. Below this, the prices can drop to 1.2638 level. On the 4 hour timeframe, the Cable has formed an upward channel that may keep the Sterling bullish today. Let’s look for buying over 1.2702 level today. 


USD/JPY – Daily Analysis

 The USD/JPY is trading dramatically bearish, falling from 107.900 level to 107.300. The USD/JPY remained strongly bearish throughout the Asian session, and it posted a steeper loss on Tuesday, followed by Mondays’ bearish trend amid the broad-based U.S. dollar weakness and improved Japanese economic outlook.

On the data front, at 4:50 GMT, the Bank Lending for the year from Japan increased to 4.8% in May from 2.9% in April. The Final GDP for the quarter decreased by 0.6% against the expected decline of 0.5% and weighed on Yen. 

At 4:52 GMT, the Current Account Balance for April came short of expectations of 0.33T as 0.25T and weighed on Japanese Yen. The Final GDP Price Index for the year came in line with the expectations if 0.9%. At 10:02 GMT, the Economy Watchers Sentiment, however, came in favor of Japanese Yen as 15.5 against the expected 12.6.

The preliminary reading of Japan’s Q1 GDP moved from -0.9% to -0.6% and came in better, which indicated the readiness of Japanese policymakers with extra stimulus if needed to fight against the pandemic.

Moreover, the better outlook of Japan’s current economic condition supported the Japanese Yen on Monday and weighed on the USD/JPY pair.

On the other hand, despite upbeat economic data from the U.S., the greenback lost its demand due to the drop in risk barometer that day. The rush of traders’ return from riskier assets weighed on the U.S. dollar and made it weak. 

Daily Support and Resistance    

  • R3 109.26
  • R2 108.91
  • R1 108.33
  • Pivot Point 107.97
  • S1 107.39
  • S2 107.03
  • S3 106.45

USD/JPY – Trading Tips

The USD/JPY is trading sharply bearish at 107.300 level, having violated the upward trendline at 107.600. Below this, the pair has a great potential to go for a 107.08 level, while a bearish breakout of 107.082 level can dip further until 106.770 level. On the 4 hour chart, the MACD, and RSI, both are holding in the selling zone, demonstrating that there’s further room for selling in the USD/JPY pair. Let’s consider taking selling trades below 107.97 today. Good luck! 

Categories
Forex Options

FX Options Market Combined Volume Expiries for 10th June 2020

Thank you for visiting the Forex Academy FX Options market combined volume expiries section. Each day, where available, we will bring you notable maturities in FX Options of amounts of $100 million-plus, and where these large combined maturities at specified currency exchange rates often have a magnetic effect on price action, especially in the hours leading to their maturities, which happens daily at 10.00 AM Eastern time. This is because the big institutional players hedge their positions accordingly. Each option expiry should be considered ‘in-play’ with a good chance of a strike if labelled in red, still in play and a possible strike if labelled in orange and ‘out of play’ and an unlikely strike if labelled in blue, with regard to the likelihood of price action meeting the strike price at maturity.

…………………………………………………………………………………………………………………..

FX option expiries for June 10 NY cut at 10:00 Eastern Time, via DTCC, can be found below.

– EUR/USD: EUR amounts

  • 1.1300 1.0b
  • 1.1390 714m

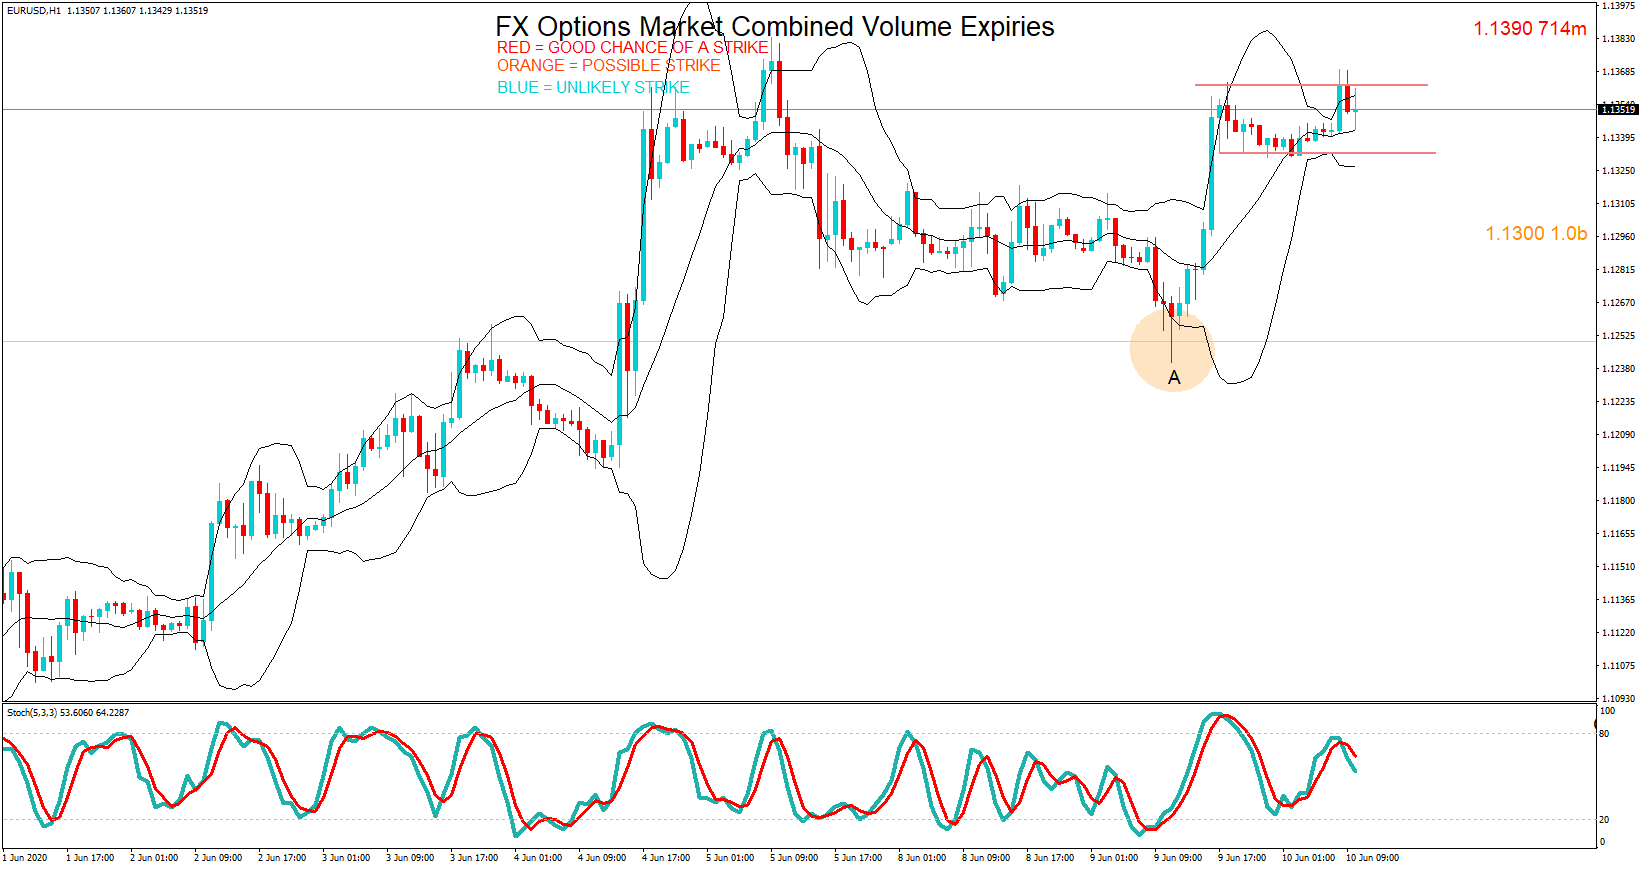
The EURUSD pair is in a consolidation period having strongly rejected a move below 1.1250 (position A) during yesterdays European and US session. Currently overbought on our one hour chart, but price is currently looking to test the resistance line at 1.1362. The 1.1390 maturity looks more likely, and especially if a candlestick can be formed above the 1.1362 level, which would confirm the resistance becoming a support line. US data and Eurozone policymaker speeches before the cut may affect price action.

– USD/JPY: USD amounts         

  • 106.90 530m  
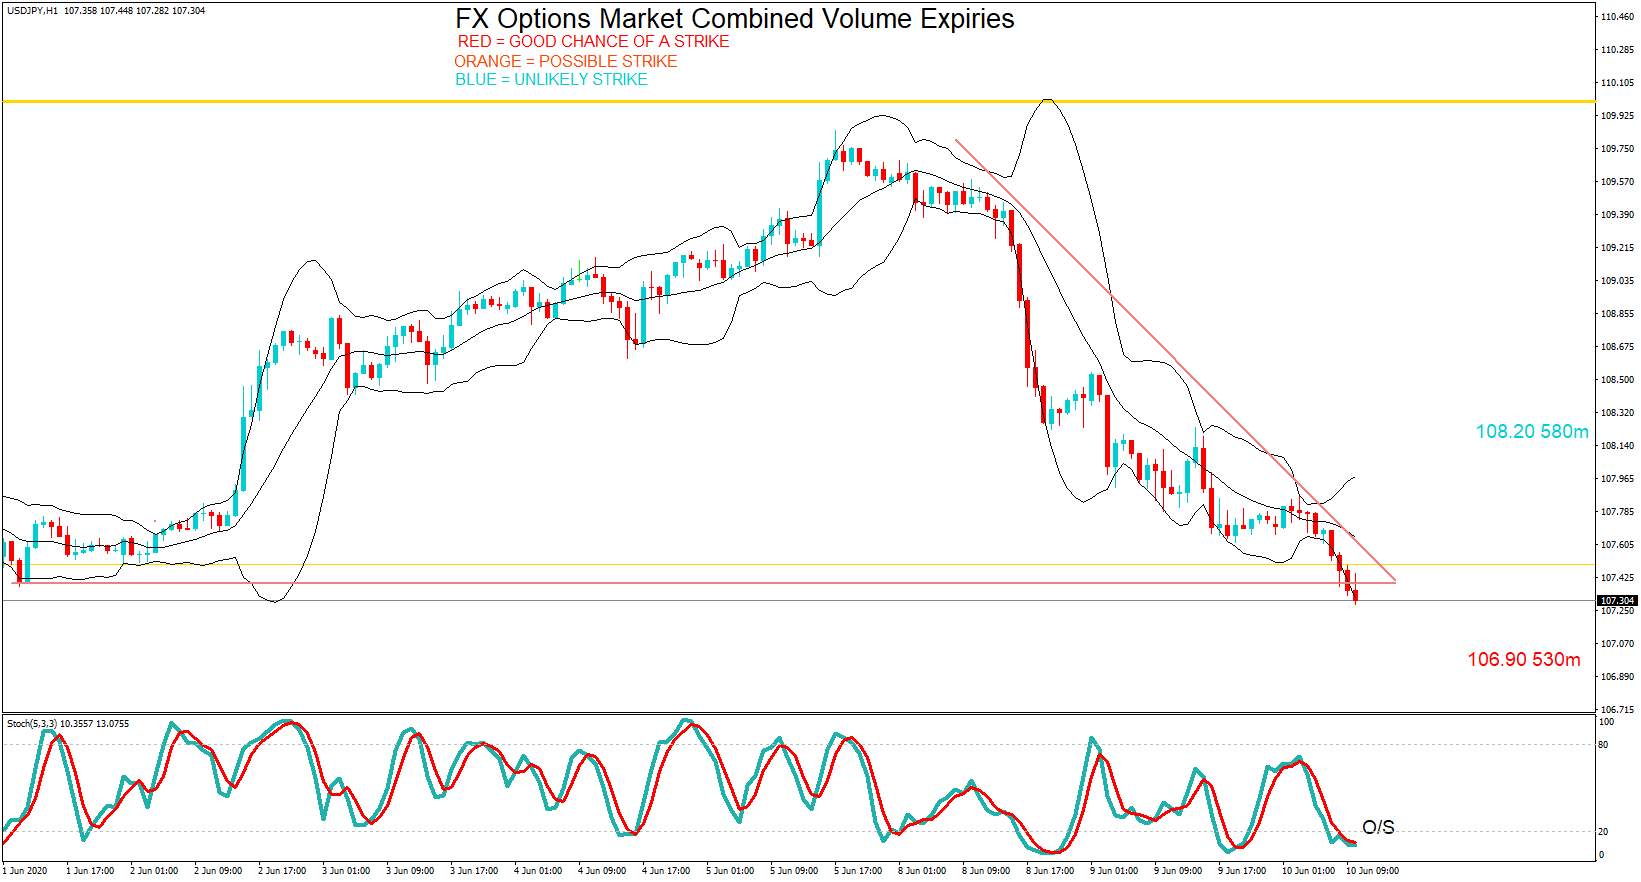
  • 108.20 580m

The USDJPY pair is maintaining a bear trend with pullbacks, but is oversold on our one hour chart and price action is currently fading. 107.00 will act as a strong support barrier. Meanwhile, key support levels at 107.50 and 107.40 have both been breached and the bears remain in control.

– AUD/USD: AUD amounts

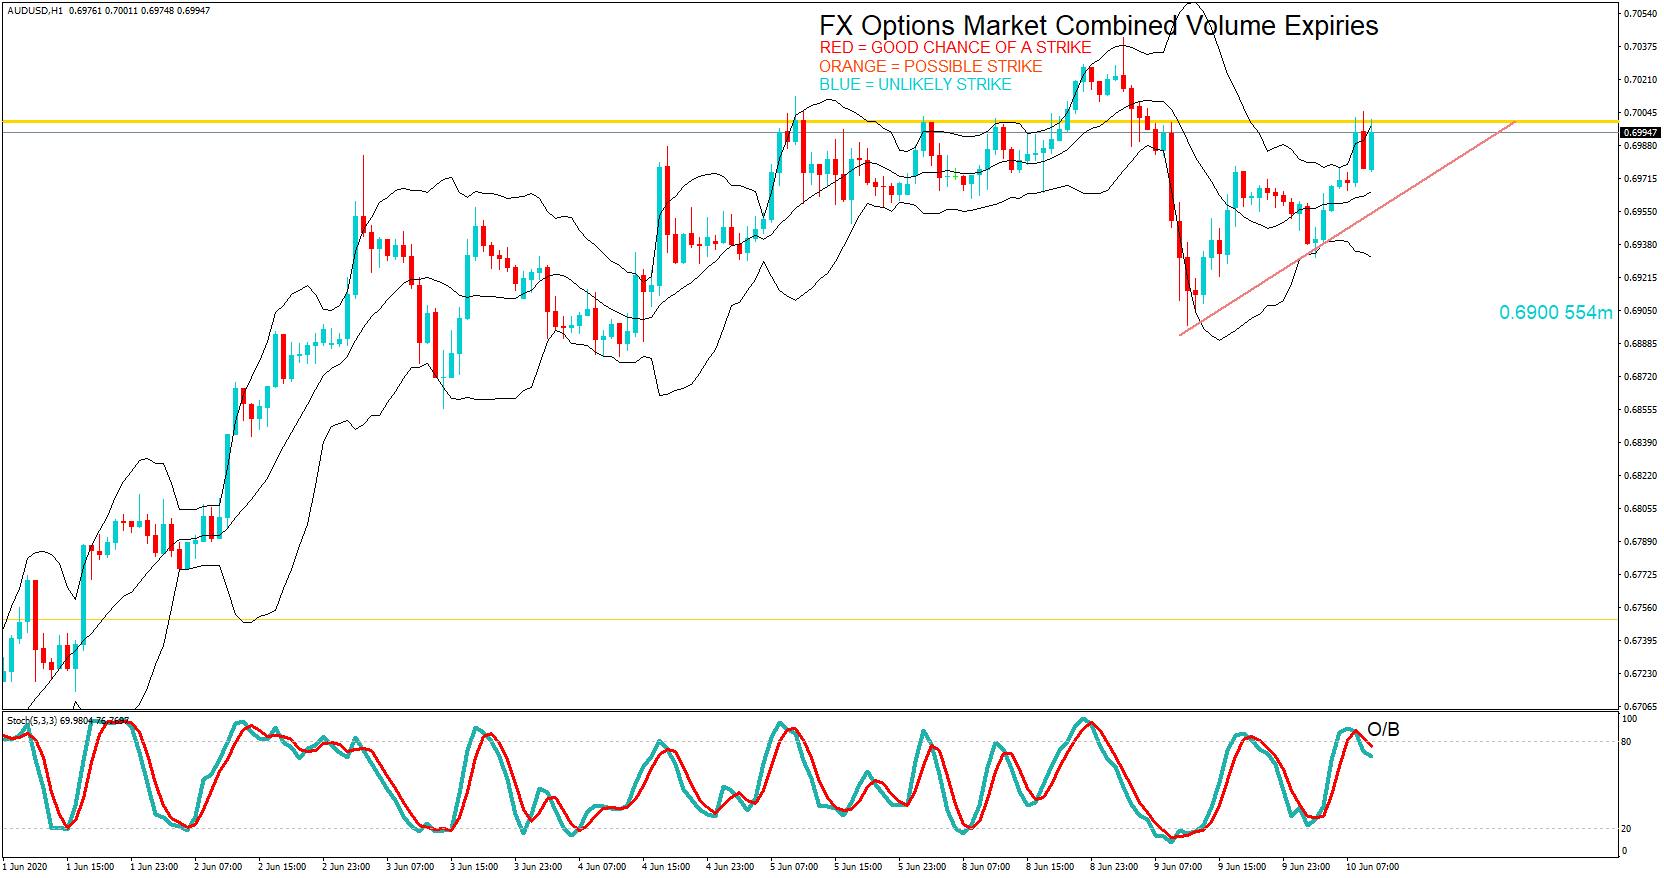
  • 0.6900 554m

The AUDUSD pair is in a wedge formation with the 0.7000 level acting as an area of resistance. If a candlestick can be formed above this key level, it will act to move the pair to the previous high at 0.7042 and beyond. The maturity at 0.69 looks to be out of play.

……………………………………………………………………………………………………………….

As you can see on the charts we have also plotted the expiration levels at the various exchange rate maturities and we have also labelled in red, orange and blue. Therefore, if you see option expiry exchange rates labelled in red these should be considered in-play, because we believe there is a greater chance of the expiry maturing at these levels based on technical analysis at the time of writing. There is still a lesser possibility of a strike if they are in orange and so these are ‘in-play’ too. However, if we have labelled them in blue, they should be considered ‘not in-play’ and therefore price action would be unlikely to reach these levels, which are often referred to as Strikes, at the time of the 10 AM New York cut.

Our technical analysis is based on exchange rates which may be several hours earlier in the day and may not reflect price action at the time of the maturities. Also, we have not factored in economic data releases or keynote speeches by policymakers, or potential market volatility leading up to the cut.

Although we have added some technical analysis we suggest you take the levels and plot them onto your own trading charts and incorporate the information into your own trading methodology in order to use the information to your advantage. Remember the higher the amount, the larger the gravitational pull towards the exchange rate maturity at 10:00 AM Eastern time.

If you want to learn how forex option expiries affect price action in the spot FX market see our educational article by clicking here: https://bit.ly/2VR2Nji

DISCLAIMER: Please note that this information is for educational purposes. Also, the maturities will look more or less likely to become a strike at 10 AM NY time due to exchange rate fluctuations resulting in a different perspective with regard to technical analysis, and also due to upcoming economic data releases for the associated pairs.

Categories
Forex Assets

Analyzing The ‘ADA/USD’ Crypto-Fiat Asset Class

Introduction

Cardano is a decentralized platform allowing programmable transfers of value securely in a scalable fashion. It is the first blockchain created out from a scientific philosophy. It is also the first research-driven cryptocurrency that is built on the Haskell programming language.

Cardano is traded with the ticker ADA. It has a market capitalization of $2.2 billion. It can be bought, sold, and exchanged in several cryptocurrency exchanges. Apart from USD, it can be traded against other cryptos such as BTC, ETH, USDT, etc.

Understanding ADA/USD

The price of ADA/USD depicts the value of the US Dollar equivalent to one Cardano. It is quoted as 1 ADA per X USD. For example, if the market price of ADA/USD is 0.086112, then each ADA will be worth 0.086112 US dollars.

ADA/USD specifications

Forex brokers allow trading of only a few popular cryptocurrencies like Bitcoin, Ethereum, Ripple, etc. The other cryptos must be traded via cryptocurrency exchanges. And the working of these exchanges is different from that of forex brokers. As a major difference, cryptos are not traded in lots, in cryptocurrency exchanges.

Spread

Spread is the difference between the buying and selling price of the cryptocurrency. Crypto exchanges match these prices between induvial traders. Thus, there is no fixed spread. Also, typically, the spread is negligible in trading cryptos.

Fee

There are different fees charged by cryptocurrency exchanges for trading any coin. The various forms of fees include

  • Execution fee (Taker or Maker)
  • 30-day trading volume fee
  • Margin opening fee, if applicable

Note that the taker or maker fee will be considered for opening as well as closing the trade, and will depend on the value being traded.

Example

  • Short 10,000 ADA/USD at $0.085800
  • 30-day volume fee is $0
  • Order is executed as Taker

Total cost of the order = 10000 x $0.085800 = $858

Assuming the taker fee to be 0.26%, the opening fee will be – $858 x 0.26% = $2.23

Assuming the trade is opened with leverage, and the margin opening fee is 0.02%, the fee is calculated as – $858 x 0.02% = $0.17

If the order is closed at $0.095800, the total cost of closing will be 10,000 x $0.095800 = $958. And the fee for the same obtained is – $958 x 0.26% = $2.5

Thus, the total fee for the opening, maintaining and closing the trade would be equal to – $2.24 + $0.17 + $2.5 = $4.91

Trading Range in ADA/USD

The trading range represents the number of units moved in the pair in a specified time frame. For example, if 10,000 ADA/USD is traded and the average unit movement in the 1H time frame is 0.000778, then it means the pair will yield 10,000 x 0.000778 = $7.78.

Note: the above values are for trading 10,000 units of ADA/USD. If X units are traded, then the ATR values will be,

(Above ATR value / 10,000) x X units

Procedure to assess ATR values

  1. Add the ATR indicator to your chart.
  2. Set the period to 1
  3. Add a 200-period SMA to this indicator.
  4. Shrink the chart so you can assess a large time period
  5. Select your desired timeframe
  6. Measure the floor level and set this value as the min
  7. Measure the level of the 200-period SMA and set this as the average
  8. Measure the peak levels and set this as Max.

ADA/USD Cost as a Percent of the Trading Range

The following tables depict the variations in total cost in terms of percentage based on the change in volatility and time frame.

Taker Execution Model

Opening = $2.23 | Margin fee = $0.17 | Closing = $2.5

Total fee = Opening + Margin fee + Closing = $2.24 + $0.17 + $2.5 = $4.91

Maker Execution Model

Opening = $1.37* | Margin fee = $0.17 | Closing = $1.53*

Total fee = Opening + Margin fee + Closing = $1.37 + $0.17 + $1.53 = $3.07

*Assuming maker fee to be 0.16% the trade value.

Trading the ADA/USD

Cardano stands 10th in CoinMarketCap in terms of market capitalization. Thus, making it a tradable pair in the crypto market. Almost all forex brokers do not ADA enabled for trading, so it must be traded through cryptocurrency exchanges. The fee structure here is quite different from forex brokers. However, the overall fee is more or less the same.

Comprehending the above tables, the magnitude of the percentage depicts how expensive/cheap a trade will be relative to the time frame and profit/loss. Let us understand this with an example.

The average values in 4H and 1D are 26.65% and 9.73%, respectively. The percentage in the 4H time frame is greater than the percentage in the 1D time frame. This means that the total cost for both is the same ($4.91), but relative to the generated profit, it is higher in the 4H time frame. A detailed reason for this can be given from the trading range table.

In the trading range table, the corresponding values are $11.52 and $31.55. This can be interpreted as, an average of $11.52 will be generated in trading the 4H time frame, and $31.55 when trading the 1D time frame. The fee in both cases is the same. Thus, we infer that the fee that is paid to generate $31.55, the same fee is deducted for generating $11.52. And hence, this is exactly what the higher percentage value depicts.

Reading through the row, the percentage values for a time frame is highest in the minimum column and least in the maximum column. So, if you’re are able to deal with higher volatility, it is ideal to trade when the volatility is around the average or maximum values. And if you cannot deal with the high volatility, you may trade the higher time frames to reduce the relative costs.

Categories
Forex Daily Topic Forex Fundamental Analysis

Everything About ‘Exports’ & The Impact Of Its News Release On The Forex Market

Introduction

Exports make one half of a country’s International Trade Balance. In today’s modern economy, with many countries pursuing their economic growth through the main focus on their exports, we must understand Export and its implications on the domestic as well as the global economy. The big words that are thrown around in the media like “Currency Wars,” “Trade Wars,” etc. all revolve around the exports among countries. A thorough understanding of the International Trade and Balance of Payments of countries can help us gauge economic growth on a macroeconomic level very well.

What is Exports?

The sale of locally produced goods to foreign countries is called Exports. Goods and Services produced in one country only when sold to other countries it is called an Export. Countries generally export goods and services that they have a competitive advantage over other countries. For example, Germans export Cars, America export Capital Goods, China export electronic goods, Jamaica exports Coffee, etc.

The advent of Globalization led to an increase in international trade opening doors for domestic industries to tap into the global market. The journey has not been smooth, during the Great Depression, and the following World War II slowed down international trade where many countries closed off their doors to foreign goods as part of protectionist strategies.

Before the 1970s, countries were following an import substitution strategy for growth where countries believed in self-sustenance by producing their goods and services without relying on foreign countries. After the 1970s, the countries began to realize the failure of import substitution and started opting for Export-led growth strategy, and that has been the case to date.

In general, a trade surplus, i.e., a country’s exports, exceeds its imports, is good for the economy. Although, it may not always be necessary as countries may import more than their current exports to build future and long term projects that will assist them in their economic prospects in the long run. In today’s world, China, the United States, Germany, Japan, and the Netherlands are the biggest exporters in the world in terms of revenue.

How can the Exports numbers be used for analysis?

Exports are crucial for today’s modern economies because of the many-fold that it brings with it to the exporting country. The following are the benefits and impacts of exports on the economy:

Broader Market – Companies always want to sell more and increase their profits. By exposing them to a broader range of audience gives them a much better chance of making profits than with a limited audience. By tapping into foreign markets, the domestic companies have to evolve to meet the local demands of other nations and learn how to mix what they sell and what is required by the world well. All this makes the companies grow more robust and overall increases their size and revenue a lot faster than what they would have achieved through operating domestically.

Wealth – Exports increase demand and, consequently, profits. It ultimately leads to employment, increases in wages, and ultimately raises the standard of living. Governments actively promote and encourage exports by reducing tariffs and use protectionist strategies like import barriers to protect their domestic business.

Foreign Reserves – As the trade happens between two countries with different currency regimes, where the payment can be in the domestic or foreign currency, this increases the Central Bank’s currency reserves. With sufficient currency reserves, the Government can manipulate exchange rates to control inflation and deflation by increasing or decreasing currency volume in the global market whenever needed.  During times of substantial exports, countries intentionally peg their currency value lower to make their products appear cheaper and increase the returns on their exports. China has been accused of this low pegging their currency in their favor. Subsequently, other countries have retaliated by lowering their currencies as well. It is what is being called “Currency Wars.”

Trade Surplus – It is always better to be owed money than to owe money as an individual. The same, in general, applies to countries that want to be net creditors to the world than net debitors. Increasing trade deficits can pile up the country’s debt, which can multiply over the years and can be very difficult to overcome. A healthy level of exports, in general, brings more money into the country and keeps the economy going at a steady and healthy growth rate.

Impact on Currency

Today’s global currency markets are free-floating and self-adjusting. Any sudden surge in exports will be followed by a rise in the currency value to compensate for the increased demand on the global market for its currency. A decline in exports will be followed by decreased demand for the currency, and accordingly, the currency depreciates.

Although the market forces are self-adjusting, frequent Government interventions to speed up the correction process to keep the output of the business constant is common.

Economic Reports

Exports form part of a country’s Trade Balance, which is reported under the Current Account Section of the International Balance of Payments Report of the country. The Balance of Payments reports is released quarterly and annually for most countries. The Trade Balance reports are published every month, which consists of Exports and Imports figures.

For the United States, the Bureau of Economic Analysis publishes the monthly Trade Balance reports on their website in the 1st week of every month for the previous month.

Sources of Exports

Impact of the ‘Exports’ news release on the price charts

In the previous section of the article, we understood the importance of Exports in an economy and saw how it contributes to the growth of the country. Exports are nothing but goods and services that are sent to the rest of the world, including merchandise, transportation, tourism, communication, and financial services. A nation that has positive net exports experiences a trade surplus, while a negative net exports mean the nation has a trade deficit. Net exports may also be called the balance of trade. Economists believe that having a consistent trade deficit harms a nation’s economy, creating pressure on the nation’s currency and forcing lowering of interest rates.

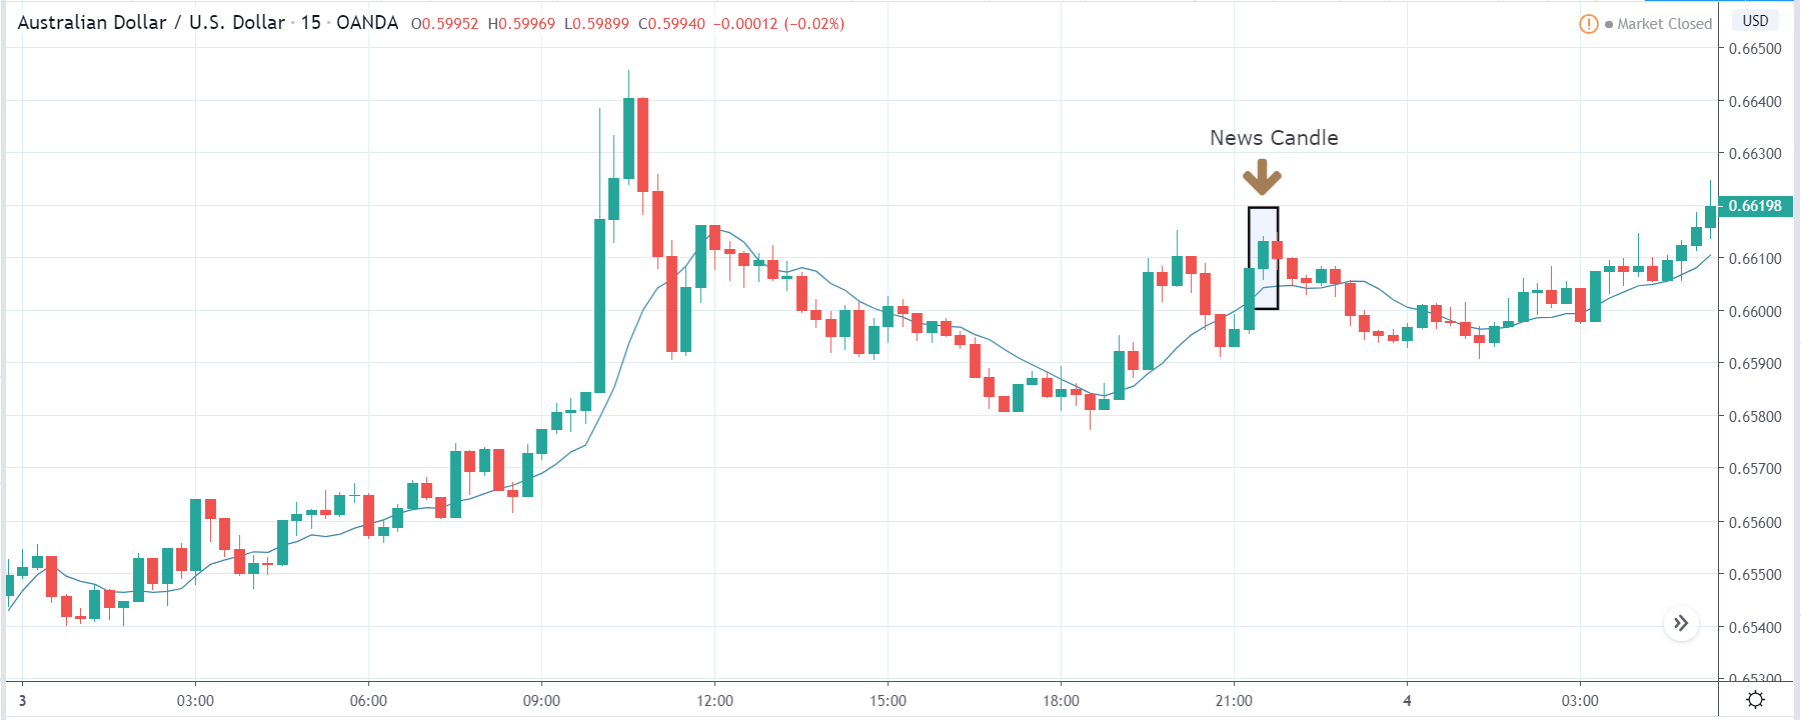
In today’s lesson, we shall analyze the impact of Exports data on different currencies pairs and observe the change in volatility due to the news release. A higher than expected number should be taken as positive for the currency, while a lower than expected number as negative. The below image shows the total Exports of Australia during the month of March and April. It is evident that there was an increase in Exports in the current month by 20%. Let us look at the reaction of the market to this data.

AUD/USD | Before the announcement:

We shall begin with the AUD/USD currency pair to witness the impact of Exports on the Australian dollar. The above image shows the state of the chart before the news announcement, where we see that the market is in a downtrend, and recently the price has displayed a reversal pattern indicating a possible reversal to the upside. Based on the Exports data, we will look to position ourselves in the currency.

AUD/USD | After the announcement:

After the news announcement, the market moves higher and volatility increases to the upside. The sudden rise in the price is a result of the extremely positive Exports data where there was a rise in the value by 20% compared to the previous month. This brought cheer in the market, making traders to ‘buy’ Australian dollars and thus, strengthening the currency. One can go ‘long’ in the market after the news release with a stop loss below the recent ‘low.’

AUD/NZD | Before the announcement:

AUD/NZD | After the announcement:

The above images are that of AUD/NZD currency pair, where we see that the market is in a downtrend that began just a few hours ago, and recently the price has shown sharp reversal from its recent ‘low.’ Technically this is an ideal reversal pattern that signals a reversal of the trend. One can take a risk-free ‘long’ position if the news announcement does not change the dynamics of the chart.

After the news announcement, the price sharply rises and closes, forming a strong bullish candle. As the Exports were exceedingly high, traders bought Australian dollars and increased the volatility to the upside. This could be a confirmation sign of the trend reversal, where we can expect the market to move much higher.

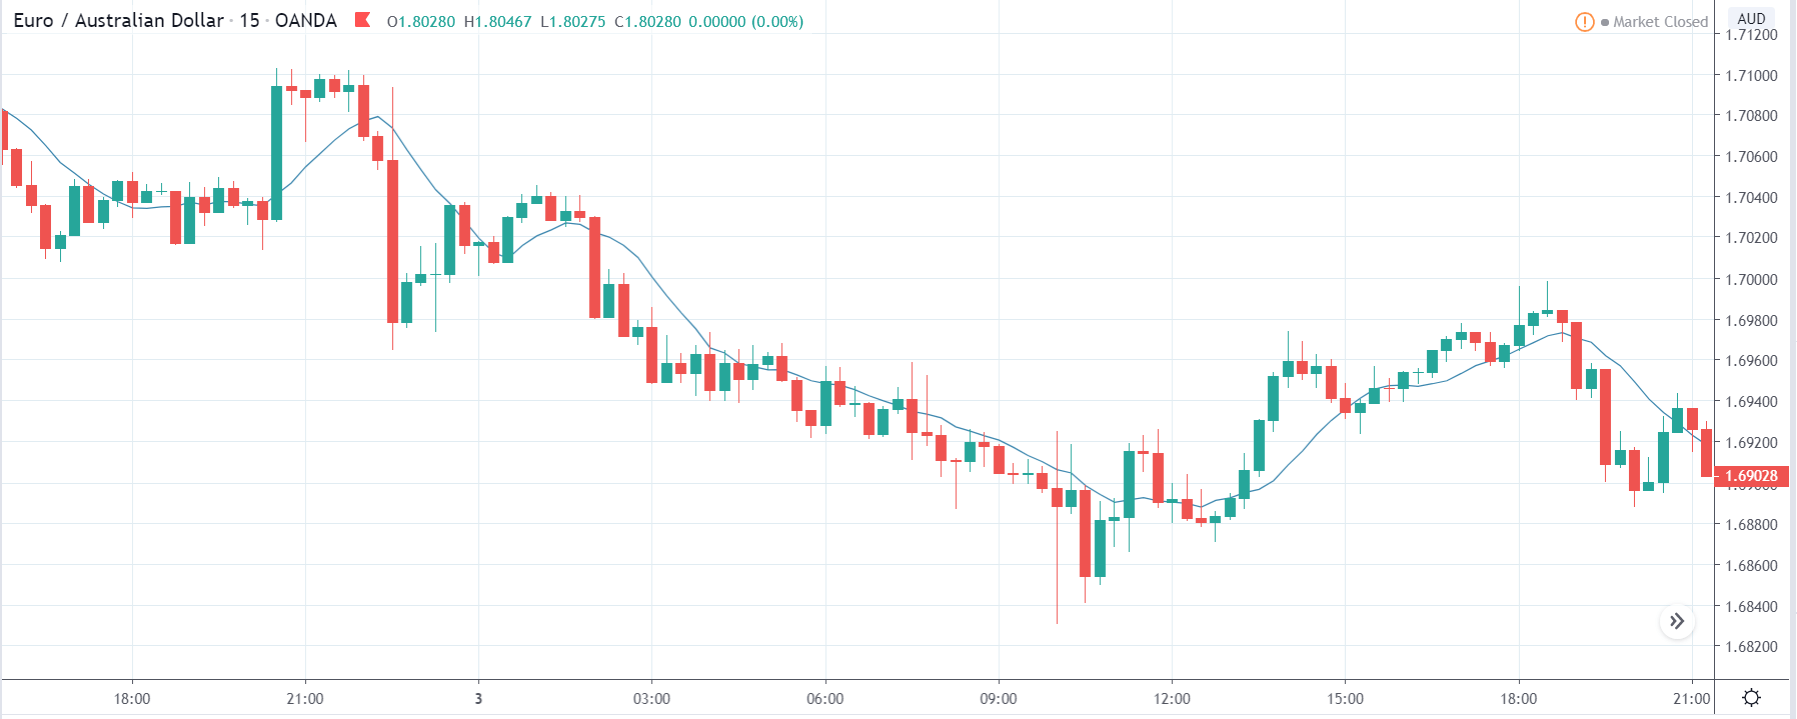
EUR/AUD | Before the announcement:

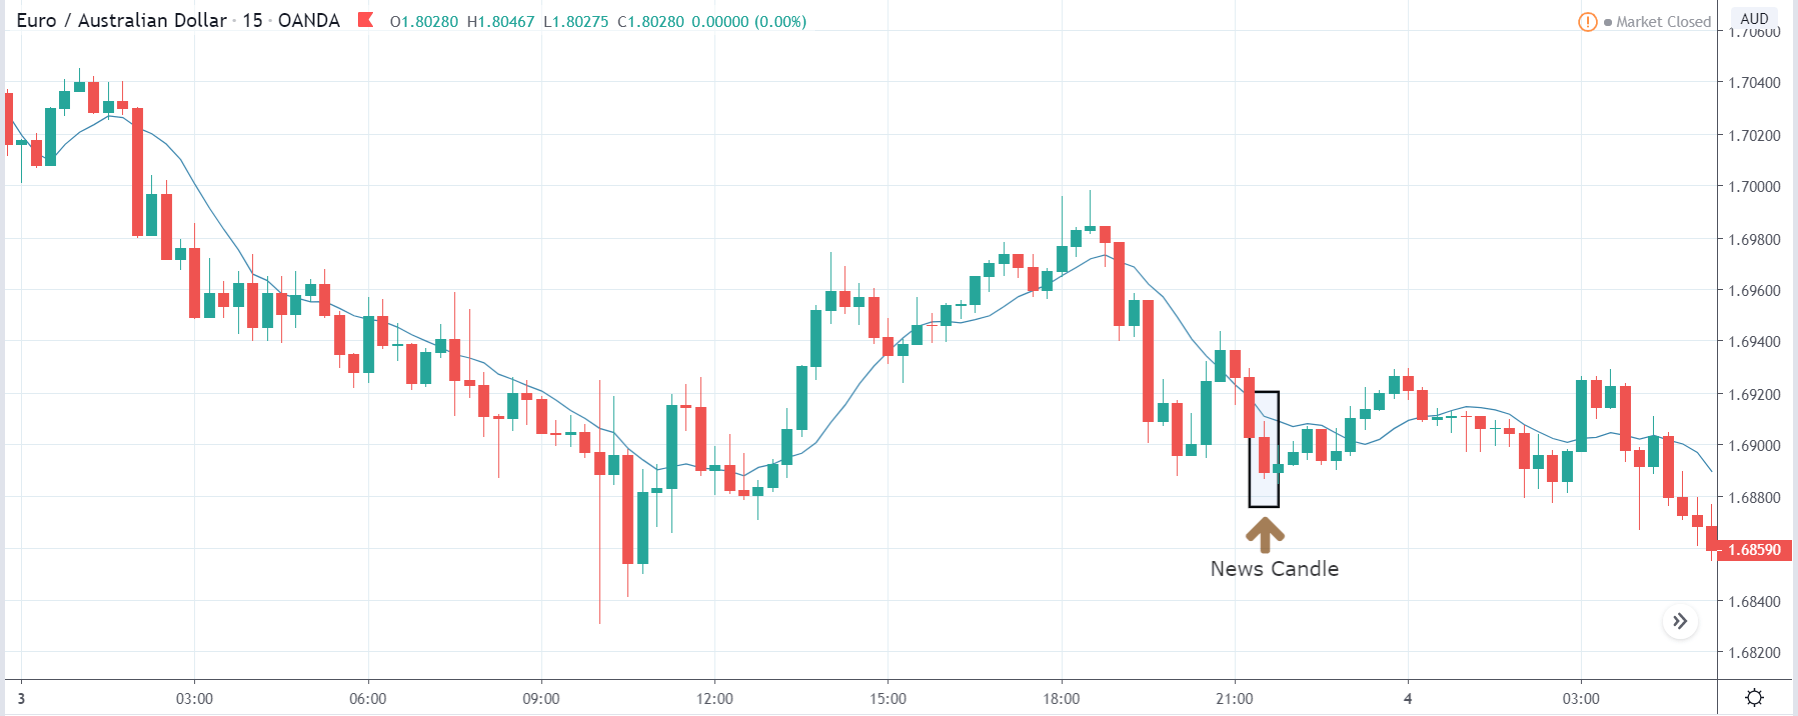
EUR/AUD | After the announcement:

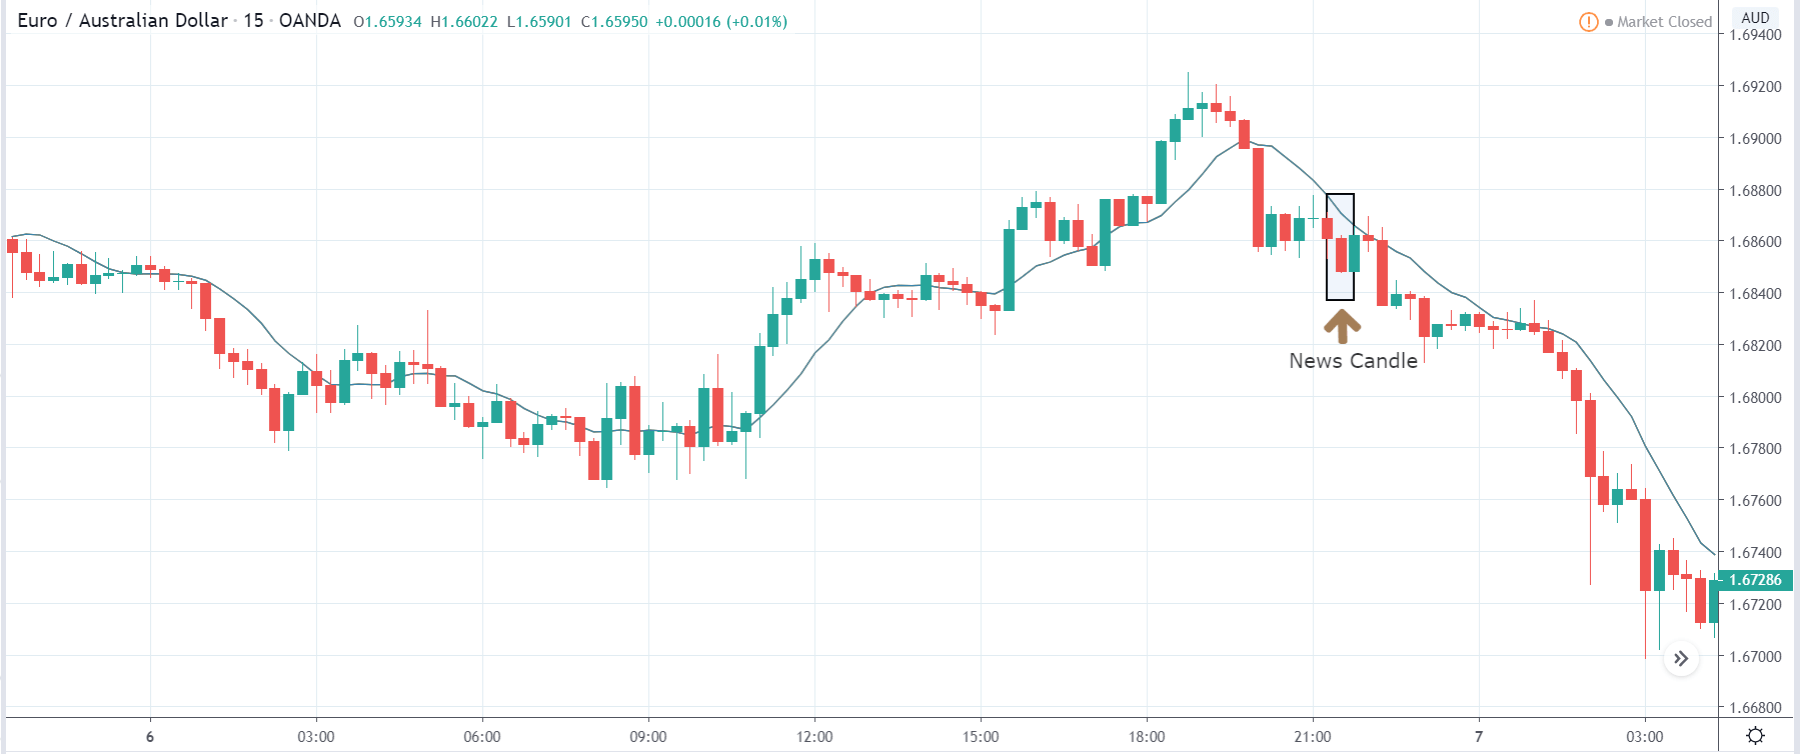
The above images represent the EUR/AUD currency pair, where the first image shows the state of the chart before the news announcement. From the chart, it is clear that the overall trend of the market is up, but recently the price has shown a strong reversal pattern to the downside. Looking at the price action, we will prefer taking a ‘sell’ trade depending on the impact of the news release.

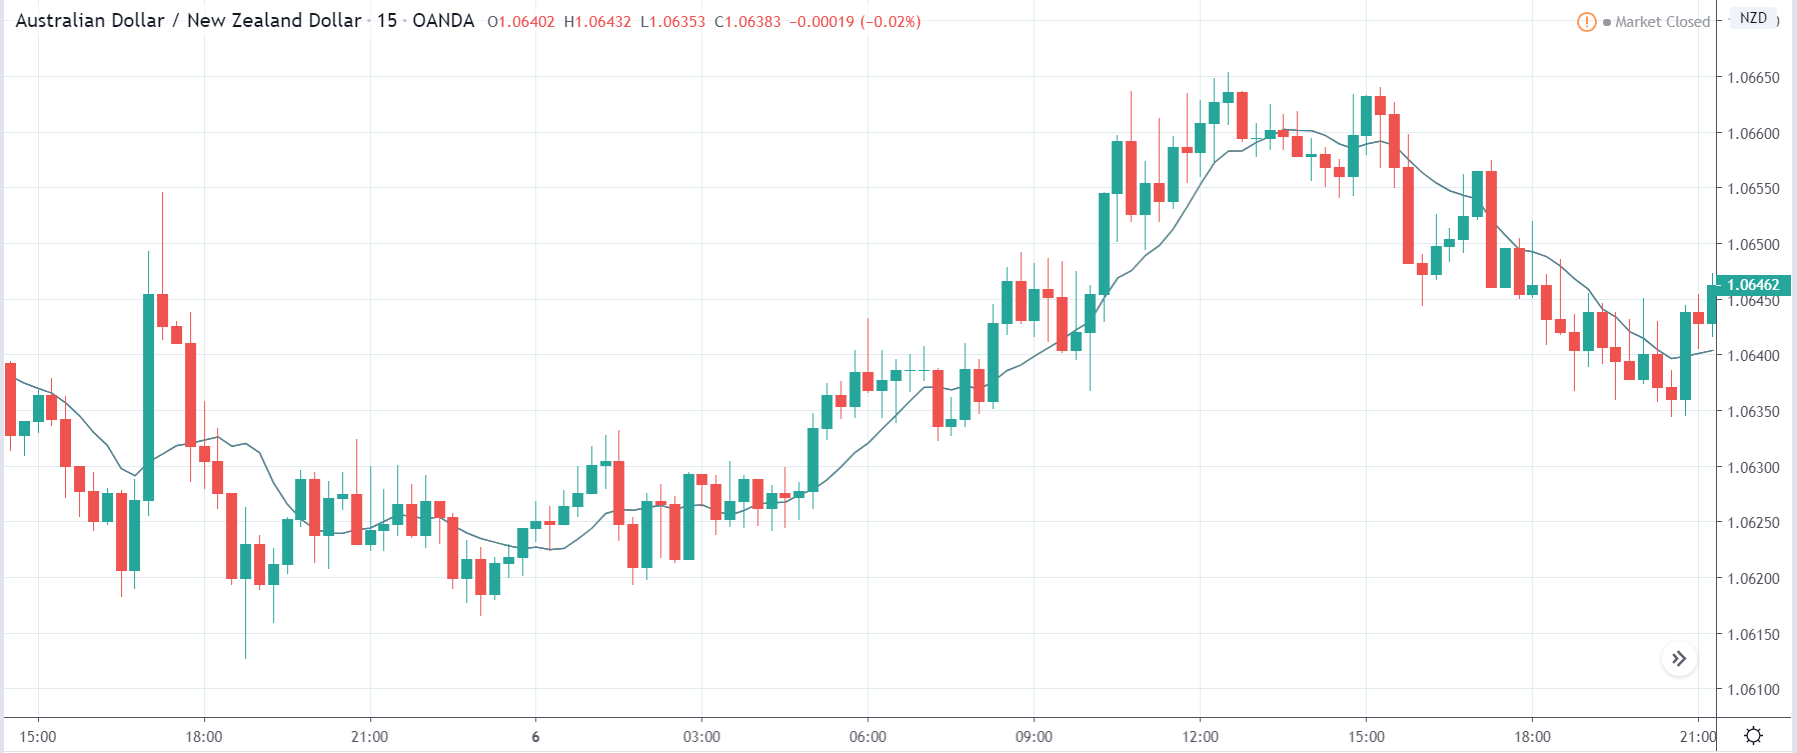
After the news announcement, the price falls lower, with an increase in volatility to the downside. The bearish ‘news candle’ is a consequence of the upbeat Exports data, which came out to be exceptionally well for the economy. Since the Australian dollar is on the right-hand side of the pair, traders sold the currency pair in order to strengthen the Australian dollar. This is a perfect ‘sell’ for all.

That’s about ‘Exports’ and its impact on the Forex market after its news release. If you have any questions, please let us know in the comments below. Good luck!

Categories
Forex Market Analysis

Daily F.X. Analysis, June 9 – Top Trade Setups In Forex – European GDP in Highlights! 

On the news front, the Eurozone is due to release series of high impact events that may drive movements in the Euro related currency pairs. The events like trade balance, GDP, and final employment change will be in the highlights.

Economic Events to Watch Today


EUR/USD – Daily Analysis

The EUR/US prices were closed at 1.12937 after placing a high of 1.3196 and a low of 1.12680. Overall the movement of the EUR/USD pair remained flat throughout the day.

On Monday, the President of the European Central Bank, Christine Lagarde, said that the central bank’s measure to fight the coronavirus crisis was proportionate to the severe risks facing its mandate.

Lagarde said during a hearing at the Committee on economic and monetary affairs of the European Parliament, which was conducted via video conference, that the crisis-related measures were temporary, targeted, and proportionate.

On Thursday in its monetary policy decision, ECB announced an additional 600 billion euros in its pandemic emergency purchase program (PEPP) and scaled up its previous 750 billion Euro, to extend the program till mid-2021.

According to Lagarde, ECB continuously monitors the proportionality of its instruments, and she said that the net effects to be gained by PEPP expansion were overwhelmingly positive. The need for expansion was to avoid any deeper recession and quickening the pathway towards normalization.

When asked about the German court ruling of the ECB’s massive public sector purchase program, she said she was confident that a solution could be found because it was addressed to the German federal government and the German Parliament.

On the data front, at 11:00 GMT, the German Industrial Production showed a decline of 17.9% in April against the expectations of 16% and weighed on shared currency euro. AT 13:30 GMT, the Sentix Investor Confidence from the Eurozone for June decline to 24.8 from the expected reduction of 22.0 and weighed on Euro.

The depressed Euro after inferior to expected German Industrial Production dragged the pair EUR/USD with itself to the low of 1.12680.

Meanwhile, Lagarde’s Speech explaining the benefits of ECB’s latest expansion in PEPP provided strength to Euro, which pushed the EUR/USD pair higher.

Lagarde’s Speech and economic data from Eurozone moved in the opposite direction, and hence, the pair EUR/USD remained flat throughout the day as it closed at the same level it was started with. No data was to be released from the American side, so the pair followed Euro’s directions.

Daily Support and Resistance

  • R3 1.1357
  • R2 1.1338
  • R1 1.1327

Pivot Point 1.1308

  • S1 1.1296
  • S2 1.1278
  • S3 1.1266

EUR/USD– Trading Tip

The EUR/USD is consolidating in a narrow trading range of 1.1370 – 1.1276 level, and right now, it seems to break out of this trading range. On the lower side, the next target level seems to be 1.1185. Currently, the pair is facing immediate support around 1.1274 level, and closing of candles below this level may lead the EUR/USD prices further lower towards 1.1185 level, which is extended by the 50 EMA level. On the higher side, resistance holds at 1.1315 level today. Odds of bearish bias remains solid today.


GBP/USD – Daily Analysis

The GBP/USD pair was closed at 1.27235 after placing a high of 1.27358 and a low of 1.26278. Overall the movement of GBP/USD remained bullish throughout the day. The broad-based U.S. dollar selling bias after the positive tone around greenback followed by Friday’s job report vanished pushed the pair GBP/USD higher on Monday. The currency pair GBP/USD raised for the 8th consecutive day on Monday and continued its bullish rally.

The weakness of the U.S. dollar was attributed to weak U.S. yields. The U.S. dollar index (DXY) turned negative on the day and fell back to below 97.00 level. The U.S. stock was high on the back of increased risk appetite.

On the other hand, the E.U. chief negotiator, Michel Barnier, was supposed to present a compromise proposal on access to British waters during the latest round of talks, but at the last minute, he was blocked to present the proposal by its member states with large fishing communities.

E.U. now expects the talks to drag into October, but the U.K. has ruled it out and said that it was unacceptable. E.U. wanted to intensify and accelerate its work to make progress with the negotiations, and the U.K. need to prepare its businesses for a new trading environment.

On the fishing issue, the E.U. wants the U.K. to follow the structures of standard fisheries policy (CFP) from the end of 2020. But British fishing communities claim that the policy left the U.K. with far too few fish to catch, so they want to be an independent coastal state from the end of 2020. On the data front, there was no macroeconomic data to be released from both sides so, the pair continued following its previous day’s trend and posted gains on the back of the risk-on market sentiment.

Daily Support and Resistance

  • R3 1.28
  • R2 1.2765
  • R1 1.2742

Pivot Point 1.2707

  • S1 1.2684
  • S2 1.2649
  • S3 1.2627

GBP/USD– Trading Tip

The GBP/USD’s overall trend is bullish as the pair continues to reach 1.2690 levels, having violated the triple top level on the 4-hour timeframe. The pair is retracing a bit; perhaps, investors are doing some profit-taking before taking any additional buying position in Sterling. Bullish trend continuation leads to GBP/USD prices towards the next resistance level of 1.2760 level. Above this, the next resistance holds around 1.2795 level. Conversely, the support is likely to be found around 1.2665 and 1.2601 level today. Let’s look for selling below 1.2707 and buying above this level today. 


USD/JPY – Daily Analysis

 The USD/JPY pair was closed at 108.426 after placing a high of 109.691 and a low of 108.232. Overall the movement of the USD/JPY pair remained strongly bearish throughout the day. The pair USD/JPY posted a steeper loss on Monday amid the broad-based U.S. dollar weakness and improved Japanese economic outlook. The pair dropped on Monday after posting gains for the previous four consecutive days.

On the data front, at 4:50 GMT, the Bank Lending for the year from Japan increased to 4.8% in May from 2.9% in April. The Final GDP for the quarter decreased by 0.6% against the expected decline of 0.5% and weighed on Yen. At 4:52 GMT, the Current Account Balance for April came short of expectations of 0.33T as 0.25T and weighed on Japanese Yen. The Final GDP Price Index for the year came in line with the expectations if 0.9%. At 10:02 GMT, the Economy Watchers Sentiment, however, came in favor of Japanese Yen as 15.5 against the expected 12.6.

The preliminary reading of Japan’s Q1 GDP moved from -0.9% to -0.6% and came in better, which indicated the readiness of Japanese policymakers with extra stimulus if needed to fight against the pandemic.

Moreover, the better outlook of Japan’s current economic condition supported the Japanese Yen on Monday and weighed on the USD/JPY pair.

On the other hand, despite upbeat economic data from the U.S., the greenback lost its demand due to the drop in risk barometer that day. The rush of traders’ return from riskier assets weighed on the U.S. dollar and made it weak. 

Daily Support and Resistance    

  • R3 110.81
  • R2 110.25
  • R1 109.34

Pivot Point 108.79

  • S1 107.88
  • S2 107.33
  • S3 106.42

USD/JPY – Trading Tips

The USD/JPY fell dramatically to violate the narrow trading range of 109.800 – 109.255, and now it’s trading somewhere around 107.900. On the 4 hour timeframe, the USD/JPY is likely to find support at 107.900, and below this, the upward trendline may extend support around 107.600 level. The Japanese currency pair has already crossed below 50 EMA, favoring selling bias in the pair today. Let’s consider taking selling trades below 108.50 today. Good luck! 

Categories
Forex Options

FX Options Market Combined Volume Expiries for 9th June 2020

Thank you for visiting the Forex Academy FX Options market combined volume expiries section. Each day, where available, we will bring you notable maturities in FX Options of amounts of $100 million-plus, and where these large combined maturities at specified currency exchange rates often have a magnetic effect on price action, especially in the hours leading to their maturities, which happens daily at 10.00 AM Eastern time. This is because the big institutional players hedge their positions accordingly. Each option expiry should be considered ‘in-play’ with a good chance of a strike if labelled in red, still in play and a possible strike if labelled in orange and ‘out of play’ and an unlikely strike if labelled in blue, with regard to the likelihood of price action meeting the strike price at maturity.

…………………………………………………………………………………………………………………..

FX option expiries for June 9 NY cut at 10:00 Eastern Time, via DTCC, can be found below.

– EUR/USD: EUR amounts

  • 1.1300 802m

The EURUSD pair is in a sideways consolidation channel and oversold on our one hour chart. However, the support line is currently being tested and it looks like the bull traders are about to throw the towel in on the 1.1300 key level where our option maturity is today. Important Eurozone data including unemployment and GDP will be an acid test for the Euro and is due out soon.

– USD/JPY: USD amounts         

  • 107.85 390m

USDJPY has found support at the level of the option maturity. However, the bear move was strong. Expect more downward pressure. The option expiry remains in-play.

……………………………………………………………………………………………………………………..

As you can see on the charts we have also plotted the expiration levels at the various exchange rate maturities and we have also labelled in red, orange and blue. Therefore, if you see option expiry exchange rates labelled in red these should be considered in-play, because we believe there is a greater chance of the expiry maturing at these levels based on technical analysis at the time of writing. There is still a lesser possibility of a strike if they are in orange and so these are ‘in-play’ too. However, if we have labelled them in blue, they should be considered ‘not in-play’ and therefore price action would be unlikely to reach these levels, which are often referred to as Strikes, at the time of the 10 AM New York cut.

Our technical analysis is based on exchange rates which may be several hours earlier in the day and may not reflect price action at the time of the maturities. Also, we have not factored in economic data releases or keynote speeches by policymakers, or potential market volatility leading up to the cut.

Although we have added some technical analysis we suggest you take the levels and plot them onto your own trading charts and incorporate the information into your own trading methodology in order to use the information to your advantage.

Remember the higher the amount, the larger the gravitational pull towards the exchange rate maturity at 10:00 AM Eastern time.

If you want to learn how forex option expiries affect price action in the spot FX market see our educational article by clicking here: https://bit.ly/2VR2Nji

DISCLAIMER: Please note that this information is for educational purposes. Also, the maturities will look more or less likely to become a strike at 10 AM NY time due to exchange rate fluctuations resulting in a different perspective with regard to technical analysis, and also due to upcoming economic data releases for the associated pairs.

Categories
Forex Price Action

Some to Take and Some to Skip

In today’s lesson, we are going to demonstrate an example of an H4 chart, which seems to be offering several entries. However, a trader has to be very calculative before taking an entry. Some entries are there to be taken, and some are there not to be taken. We would try to find out why we shall skip taking some entries. Let us get started.

This is an H4 chart. The chart shows that the price makes a strong bullish move and consolidates for a long time. The last candle comes out as a bullish candle breaching consolidation resistance. It usually a scenario of taking a long entry. Before taking an entry, we must calculate whether the price consolidates for more than a day or not. Over here, the price consolidates more than a day. It means the level of resistance becomes daily resistance. The breakout is not for the H4-daily combination traders to trigger a long entry.

The chart shows that the price heads towards the North. The buyers may wait for the price to consolidate and get a bullish reversal candle to go long in the pair. They must keep their eyes on the pair.

The chart produces a bearish inside bar. It may consolidate more and make a deeper consolidation. This is what the buyers are to hope for. Let us find out what the price does here.

The chart shows that the price consolidates for five candles altogether. The last bullish candle is the last H4 candle of that day. It means if the chart produces the next candle as a bullish engulfing candle, the buyers will have an opportunity to go long in the pair. Otherwise, they are to wait longer.

The last candle comes out as a bullish engulfing candle breaching consolidation resistance. The buyers may trigger a long entry right after the last candle closes by setting stop loss below consolidation support and by setting take profit with 1R.

The price consolidates again and produces a bullish engulfing candle. It seems the bull is going to dominate in the pair for a long time since it finds another level of support. When price trends like that, traders add more positions, and the price keeps trending relatively for a longer time.

Here it is. The price hits the target of 1R. They buyers grab some green pips. Yes, they wait for the price to hit the target. Some traders may take a partial profit out of it and let the rest of the trade run to grab more pips.

In this lesson, we have demonstrated that traders may take the second entry and skip the first one because of the daily resistance factor. Traders must calculate these things before taking entry.

Categories
Forex Fundamental Analysis

The Importance Of ‘Government Revenue’ As An Economic Indicator

Introduction

Government Revenue is one half of the Government Budget that will shape the economic growth for the fiscal year. It is closely watched statistic by traders and investors to analyze the policy maker’s behavioral trends, actions, and corresponding economic consequences for the current fiscal year.

What is Government Revenue?

Government revenue is the money received from tax receipts and other non-tax sources by a government that allows the Government to maintain the economy, finance its functions, and undertake government expenditures. The Federal Government receives income through a variety of sources which are as follows:

Taxes

Taxes are the most important source of Government revenue, with various forms of tax income coming to the Government. The personal individual income tax makes a significant part of the tax revenue of the Government. Other forms of tax like business or corporate tax, consumption tax, value-added land tax, tax on city maintenance and constructions, enterprise income tax, resource tax, etc. are other forms in which the Government collects taxes. Taxes are a compulsory payment from the consumers and businesses of the economy without any quid pro quo (i.e., getting nothing in return for tax payments from the Government).

Rates or Rental Incomes

These refer to local taxations. The rates are usually proportional to the rentable value of a business or domestic properties. It can take the form of Government-owned lands and buildings leased out for businesses or organizations.

Fees

These are the income the Government receives for its services. These could include services like public schools, insurance, etc.

License Fees

These are the payments received for authorizing permission or privilege. For example, issuing a building permit, or driving license, etc.

Public Sector Surplus

Revenue generated through sales of goods and services like water connection, electricity, postal services, etc.

Fines and Penalties

This is not intended to generate revenue but to make the public adhere to the law. Examples would include parking tickets or speeding tickets.

Gifts

These are the donations received from non-government members of the country and form a small portion of the Government’s revenue. These are usually received to help the Government during wars or emergencies.

Borrowing

This is the least preferred way to raise capital. The Government can borrow from investors in the form of bonds to finance its operations, and this method, although prevalent, is not preferable.

Below is a snapshot of the Federal Government’s Revenue from various sources:
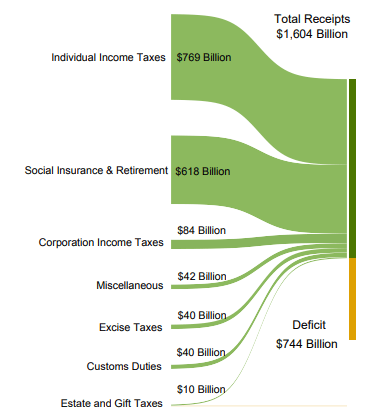
(Picture Source – Fiscal Treasury)

How can the Government Revenues numbers be used for analysis?

The amount the Government receives in revenues determines how much it can spend. The revenue generated is directly correlated to the GDP. The GDP is directly influenced by how much the Government spends on the economy to spur growth. Both are linked in a feedback loop. By effectively drafting out the Federal Policy for a fiscal year, the Government can increase or decrease their tax revenues.

When the Government increases tax revenues, it may receive more than its fiscal expenditures, but that would burden the consumers and business. When taxes are increased, it leaves less money for people to spend, and people prefer to save than invest. It slows down the economy, and correspondingly a deflationary environment begins to start, and the economy risks going into a stagnation or worse a recession. During these times, the GDP will fall, and correspondingly the next fiscal year’s revenue would decline.

When the Government cuts back on taxes levied, the revenue decreases for the Government, but consumers and businesses would have more disposable income on their hand, which would encourage spending and thus stimulating the economy. It would keep the GDP growth positive and maintain a reasonable inflation rate. Consequently, this leaves little room for Government expenditures. When the expenditure is low, the stimulus is low, which results in a slowdown in the economic activity in the next business cycle.

Hence, Government Revenue and Government Expenditure both are two levers that have to be carefully adjusted to achieve an optimal balance for the healthy functioning of the economy. Too much spending with little revenue results in deficits that piles up debt burden in the long run. Too much revenue with little spending slows down the economy.

In recent times, most of the developed economies’ Governments have been failing to maintain steady growth without low tax and increased spending that has resulted in substantial deficits for the Government. Hence, monitoring Government revenue and its corresponding expenditures in the fiscal policy has become essential for traders and investors in the recent times, as the deficits increase Sovereign Credit Risk (defaulting on debt), or threaten the economy into a recession.

Impact on Currency

In an ideal situation, where a Government has zero debt and has a balanced budget (taxes and spending equal) would contribute to a steady and stable economy. An increase in tax revenues would indicate high GDP prints indicating a growing economy.

But in the real world, most of the Governments are debt-ridden, and an increase in tax revenues means the burden on the citizens and businesses,  which deflates the economy as it takes money out of the economy the currency appreciates and vice versa. Hence, Government revenue is a proportional indicator where decreased revenue deflates the economy and currency appreciate in the short-run (for the fiscal year) and vice versa.

More importantly, Government Revenue is half of the equation, what the Government spends on is the second half. It is, therefore, beneficial to keep both figures in consideration to assess economic growth in the near term.

Economic Reports

For the United States, the Treasury Department releases monthly and annual reports on its official website. The treasury statements detailing the Fiscal Policy containing Government revenue and expenditures are released at 2:00 PM on the 8th business day every month. The World Bank also maintains the annual Government Revenue and Spending data on its official website, which is easily accessible.

Sources of Government Revenues

United States Monthly Fiscal Policy statements can be found below.

Monthly Treasury Statement – United StatesGovernment Revenue as a percent of GDP

We can find Government Revenues for the OECD countries below.

Government Revenues – OECDWorld Bank – Government Revenue data

We can find the monthly Government Revenue statistics of world countries here –

Trading Economics – Government Revenues

Impact of the ‘Government Revenues’ news release on the price charts

After getting a clear understanding of the Government Revenue economic indicator, we will now extend our discussion and find the impact it makes on various currency pairs. The revenue of a government is used for multiple reasons, that directly or indirectly facilitates the growth of the country. Revenue is basically the amount of money that is brought into the Government’s kitty through various activities.

These revenues are received from taxation, fees, fines, inter-government grants or transfers, security sales, resource rights, as well as any other sales that are made. However, investors believe that the data does not have a major impact on the currency and is not of great value when it comes to fundamental analysis.

Today, we will be analyzing the impact of Government Revenue data of Brazil on the Brazilian Real. We can see in the snapshot below that the Brazilian Government received less revenue in the month of March compared to its previous month. A higher than expected reading should be taken as positive for the currency while a lower than expected reading is taken as negative. Let us find out the reaction of the market.

Note: The Brazilian Real is an illiquid currency, and hence there will be lesser price movement on charts.

USD/BRL | Before the announcement:

We shall start with the USD/BRL currency pair to examine the change in volatility due to the announcement. The above image shows the characteristics of the chart before the news announcement, where we see that the market is in a strong uptrend with gap ups every subsequent day. This means the Brazilian Real is extremely weak, and there is no price retracement until now. Technically, we will be looking to buy this currency pair after the price retraces to a key ‘support’ or ‘demand’ level.

USD/BRL | After the announcement:
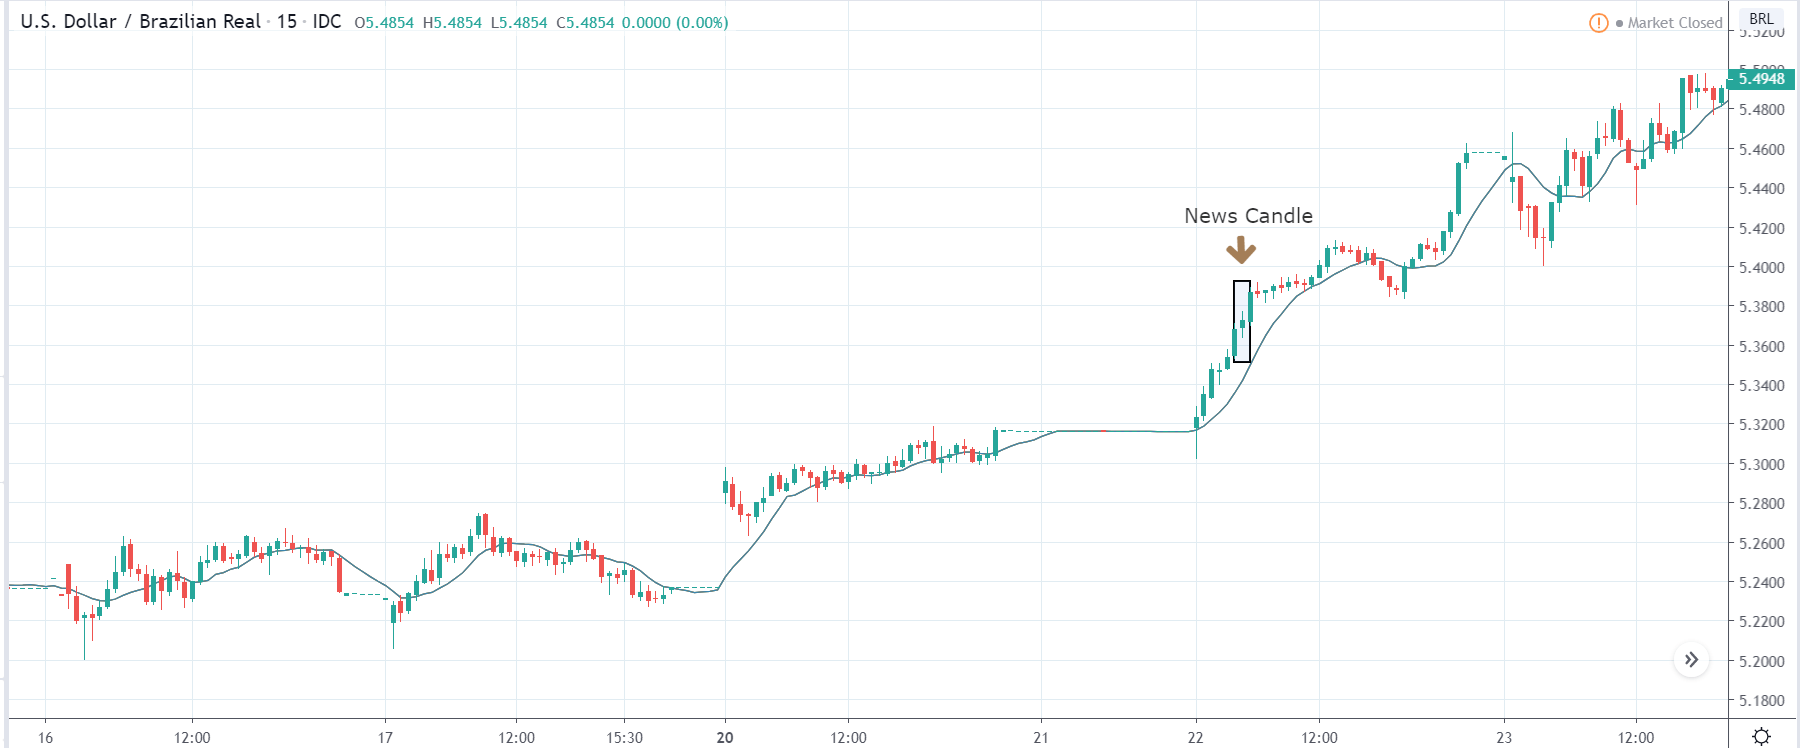
After the news announcement, the market moves higher and volatility expands on the upside. The Brazilian Real weakened further as a result of weak Government Revenues data where there was a reduction in net revenues for the current month. Traders bought U.S. dollars after the news release, which took the price much higher. The bullish ‘news candle’ is an indication of the continuation of the trend, but still, we need to wait for a retracement to enter the market.

EUR/BRL | Before the announcement:
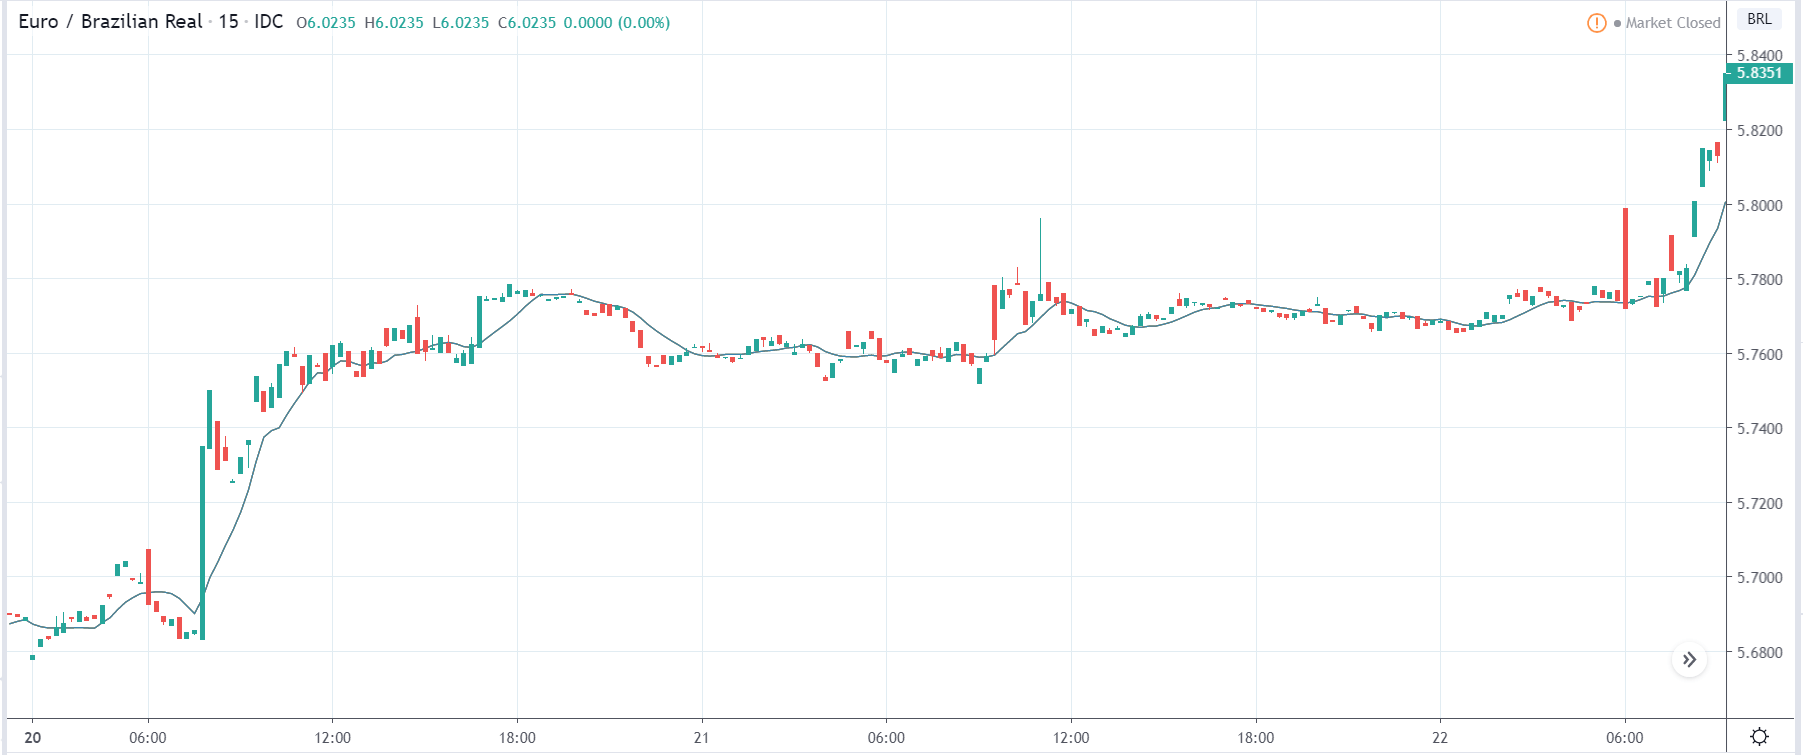
EUR/BRL | After the announcement:
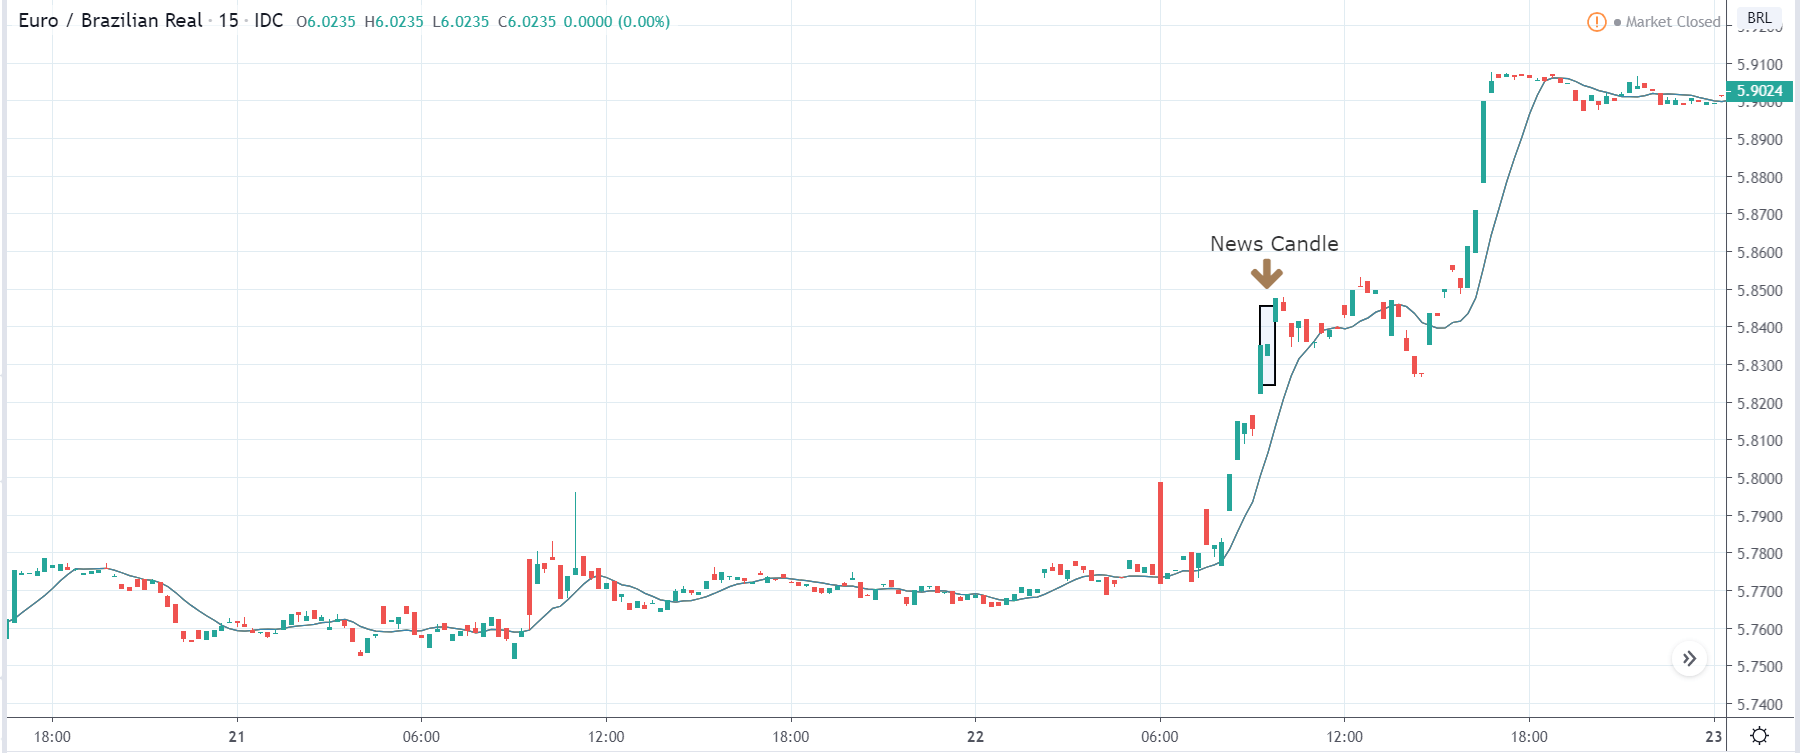
The above images represent the EUR/BRL currency pair that shows the state of the chart before and after the announcement. In the first image, it is clear that the market is again in a strong uptrend, and the price has recently broken out of the ‘range.’ Since the market is violently moving up, we should wait for the price to pull back near a ‘support’ area so that we can join the trend. We should never be chasing the market.

After the news announcement, the market reacts positively to the news data, and the price closes as a bullish candle. The increase in the volatility to the upside is a consequence of the poor Government Revenue data, where the Government collected lesser revenue in that month. The news release has a fair amount of impact on the pair that essentially weakened the currency further.

BRL/JPY | Before the announcement:

BRL/JPY | After the announcement:
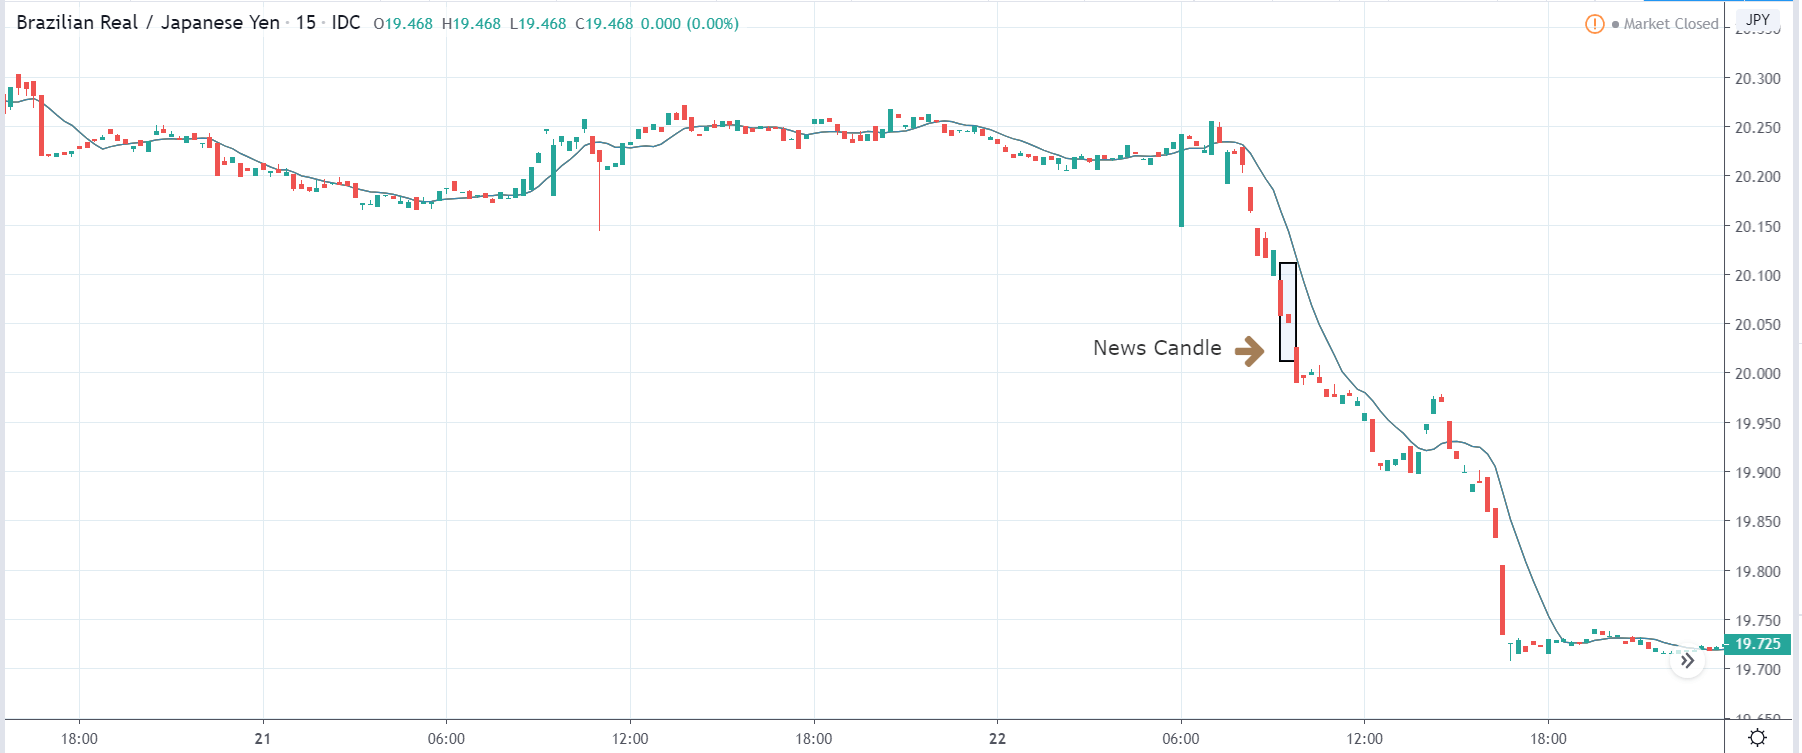
The above images are that of the BRL/JPY currency pair, where we see that the market is a strong downtrend before the news announcement and is currently at its lowest point. Since the Brazilian Real is on the left-hand side of the pair, a down-trending market signifies a great amount of weakness in the currency. We need to wait for the price retracement to a ‘resistance’ area so we can take a ‘short’ trade.

After the news announcement, the volatility expands on the downside, and the market moves further down. The ‘news candle’ closes with signs of bearishness, and later too, the price continues to move lower. This was the impact of the news on this pair. We should wait for the price to retrace to join the downtrend.

That’s about ‘Government Revenues’ and its impact on the Forex market after its news release. If you have any questions, please let us know in the comments below. Good luck!

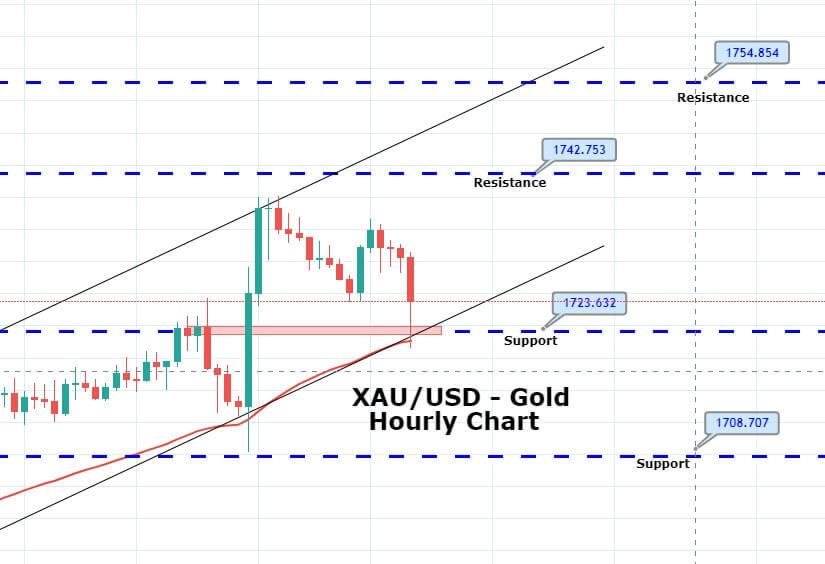
Categories
Forex Market Analysis

Daily F.X. Analysis, June 8 – Top Trade Setups In Forex – Dollar Strengthens Over NFP! 

On the news front, the eyes will remain on the German Industrial Production m/m and ECB President Lagarde Speaks. Both of these may have an impact on the Euro related currency pairs.

Economic Events to Watch Today


EUR/USD – Daily Analysis

The EUR/USD pair was closed at 1.12911 after placing a high of 1.13835 and a low of 1.12781. Overall the movement of EUR/USD remained bearish throughout the day. The EUR/USD pair rose to 1.13835 near 13-weeks highest level but failed to remain there and broke its nine days bullish streak and fell on Friday amid U.S. dollar strength across the board after the release of US Non-Farm Employment Change.

The pair EUR/USD was on bullish track after the announcement of an additional 600 billion euros in the emergency package from the European Central Bank on Thursday. The package was announced to cover up the losses faced after the coronavirus induced lockdowns across the globe and its impact on the global economy.

The additional 600 billion euros by ECB in its pandemic emergency purchase program (PEPP) made the total size of aid provided after the coronavirus crisis to 1.35 trillion euros. ECB also said that the updated forecast about GDP showed a contraction of 8.7% this year, and the inflation expectations were to rise by 0.3% this year and 0.8% in next year. EUR/USD moved in an upward direction after the ECB’s PEPP announcement and continued to follow the trend in early sessions on Friday and rose above 13-weeks higher level.

However, after the release of US Non-Farm Employment Change, the pair EUR/USD started to move in the opposite direction at the ending day of the week. At 17:30 GMT, the Non-Farm Employment Change from the United States showed that 2.509M people were hired in May against 7.750M of job loss expectations. A stronger than expected job report from the U.S. gave strength to the U.S. dollar across the board and weighed on EUR/SD pair.

Adding in the strength on the U.S. dollar was the Unemployment Rate, which came in as 13.3% against the expectations of 19.4% and further dragged down the pair EUR/USD pair.

On the other hand, from the Europe side, at 11:00 GMT, the German Factory Orders for April were also released which showed that factory orders were reduced by 25.8% in April against the expected drop of 20% and weighed on Euro which ultimately dragged the pair in a downward trend.

Daily Support and Resistance

  • R3 1.1357
  • R2 1.1338
  • R1 1.1327

Pivot Point 1.1308

  • S1 1.1296
  • S2 1.1278
  • S3 1.1266

EUR/USD– Trading Tip

The EUR/USD is also following a bearish trend on the back of a stronger dollar. Currently, the pair is facing immediate support around 1.1284 level, and closing of candles below this level may lead the EUR/USD prices further lower towards 1.1244 level, the support, which is extended by the 50 EMA level. On the higher side, resistance holds at 1.1315 level today. Odds of bearish bias remains solid today.


GBP/USD – Daily Analysis

The GBP/USD was closed at 1.26689 after placing a high of 1.26901 and a low of 1.25828. Overall the movement of GBP/USD pair remained bullish throughout the day. The pound rose for 7th consecutive day on Friday amid the rising hopes for a deal between E.U. & U.K. but lost some of its daily gains after the release of U.S. on-Farm Employment Change.

Matt Hancock, the Cabinet Minister of the U.K., said that a trade deal with the E.U. was still possible on very reasonable demands. In the latest rounds, both sides admitted that a little progress was made, and they were very hopeful that no-deal outcomes to the talks could be avoided.

The U.K. & E.U. differences have remained under four key points of fisheries: competition rules, governance, and police cooperation. UK PM Boris Johnson and President of European Commission, Ursula von der Leyen, are expected to meet later this month.

The U.K. has only until the end of June to apply for the extension of the transition period, but Johnson has ruled it out. However, the hopes that U.K. & E.U. will reach a deal after the described little progress in talks from both sides increased, and hence, the pair GBP/USD found traction in the market.

Whereas, the investors think that chances for no-deal Brexit were more than ever because the coronavirus pandemic will lead to one of the worst recessions in modern history, and investors think that hardcore Brexiteers will use the recession as a perfect distraction to get to a no-deal Brexit done.

On the data front, at 12:30 GMT, the Halifax Housing Price Index for May from the United Kingdom was declined by 0.2% against the expected decline of 0.7% and supported British Pound which ultimately pushed the GBP/USD pair on bullish track on Friday and added in the pair gains.

Meanwhile, the U.S. dollar strength after the release of US Non-Farm Employment Change exerted pressure on the rising prices of GBP/USD pair on Friday and made it lose some of its daily gains.

Daily Support and Resistance

  • R3 1.28
  • R2 1.2765
  • R1 1.2742

Pivot Point 1.2707

  • S1 1.2684
  • S2 1.2649
  • S3 1.2627

GBP/USD– Trading Tip

On Monday, the technical side of the GBP/USD seems bullish as the pair continues to reach 1.2690 levels, having violated the triple top level on the 4-hour timeframe. The GBP/USD pair has formed an upward regression trend channel, and it’s driving further buying trend in the Cable. Bullish Continuation of a bullish trend can lead to GBP/USD prices towards the next resistance level of 1.2760 level. Above this, the next resistance holds around 1.2795 level. Conversely, the support is likely to be found around 1.2665 and 1.2601 level today. Let’s look for selling below 1.2707 and buying above this level today


USD/JPY – Daily Analysis

The USD/JPY was closed at 109.573 after placing a high of 109.848 and a low of 109.042. Overall the movement of USD/JPY remained bullish throughout the day. The USD/JPY pair surged for the fourth consecutive day on Friday and gained some strong follow-through traction after the release of surprisingly stronger than expected U.S. monthly jobs data. The headline data of Friday, NFP, showed that 2.509M jobs were added in May, whereas the forecast was about 8M job loss.

Adding in the optimism was the unemployment rate, which beat the market expectations and was reported as 13.7% against 19.4% of expectations. Better than expected, data from the U.S. economy raised the bars for recent optimism over the sharp V-shaped recovery for global economic recovery. This increased the already stronger risk appetite In the market and hence, the USD/JPY pair gained for the 4th consecutive day on Friday.

At 4:30 GMT, the Household Spending for the year from Japan was declined by 11.1% against the expected decline of 12.8% and supported the Japanese Yen. At 10:00 GMT, the Leading Indicators from Japan remained flat with the expectations of 76.2%.

From the American side, the Average Hourly Earnings in May was declined by 1.0%, whereas it was expected to rise by 1.0%. The US Non-Farm Employment Change showed that 2.509M people were hired back in May, which were expected to show job loss of 7.750M people. The Unemployment Rate in April fell short of 19.4% expectations and came in as 13.3% and supported the U.S. dollar.

Daily Support and Resistance    

  • R3 109.79
  • R2 109.74
  • R1 109.67

Pivot Point 109.62

  • S1 109.56
  • S2 109.5
  • S3 109.44

USD/JPY – Trading Tips

The USD/JPY is consolidating in a narrow trading range of 109.800 – 109.255. The stronger than expected NFP figures drove buying in the USD/JPY pair on Friday, but now the traders seem to capture retracement in the market. A bearish breakout of 109.280 level can drive selling until the next support level of 109, which marks 38.2% Fibonacci retracement. The 50 EMA and MACD both are supporting the buying trend in the USD/JPY pair, and it can lead the USD/JPY prices further higher today. On the higher side, the resistance holds around 109.850. Let’s wait for a breakout of 109.800 – 109.255 to determine further trends in the USD/JPY pair. All the best for today! 


Categories
Forex Elliott Wave

Advanced Applications in Wave Analysis – Part 4 of 4

Introduction

In the previous educational article, we presented the contracting triangles and the restricting group. In this last part of our four-part series, we’ll show the non-restrictive contracting triangles and the expanding triangles with its variations. 

Non-Restrictive Triangles

This sub-group of triangles is characterized by locates in any other part of the wave cycle, not exclusively in waves 4 or B. The knowledge of this type of triangles could be useful to the wave analyst in the study of complex corrective patterns. This type of triangles tends to be produced at the end of complex corrections. Frequently, non-restrictive triangles tend to be more simple to identify than restrictive triangles.

  • Wave A. This segment tends to be the most volatile in terms of price at the time of the triangle. According to the alternation principle, if wave A is violent and takes a small portion of its completion, wave B will be slower and complex than wave A.
  • Wave E. In this scenario, the last segment of a non-restrictive contracting triangle, tends to develop a non-restrictive triangle. In other words, wave E could make a triangle inside a triangle of the upper degree. From the different types of non-restrictive triangles, the horizontal triangle tends to be the most common in the real market. The following list exposes the parts where the non-restrictive triangle.
    • Wave E in a horizontal triangle.
    • Last movement of a complex correction as a double or triple corrective pattern.
    • The fifth wave of an impulsive terminal structure.
    • The wave X of a complex correction.

Expanding Triangles

The expanding triangle tends to cheat the wave analyst more than the contracting triangle. This situation occurs because when the price moves in a volatile session, it tends to create a false breakout and quickly resuming its original trend.

The main characteristics of an expanding triangle are:

  • Wave A or wave B will be the shortest wave of the triangle.
  • Wave E tends to develop an explosive movement, higher in terms of price and time than the other waves.
  • In the same way that in contracting triangles, a contracting triangle can produce in wave E, in an expanding triangle, it can construct an expanding triangle.
  • The next movement of the triangle, which could correspond to wave C or 5, should not retrace the advance of wave E entirely.
  • The expanding triangle usually does not follow any Fibonacci relationship.
  • Expanding triangles normally occurs after a powerful movement such as an extended wave or an extended wave C. 

Restrictive Expanding Triangles

The restrictive expanding triangle tends to be placed in waves 4 and B. If the expanding triangle locates in wave B, the triangle belongs to a flat pattern. The rules applied to this group of expanding triangles are as follows:

  1. Waves A and E will be related through a 161.8%, being the wave E the largest segment.
  2. Wave A or B must be the shortest segment of the triangle.
  3. Only wave B or D can fail to try to surpass the previous wave.

Horizontal Expanding Triangle. The characteristics of this pattern are as follows:

  1. Wave A is the shortest segment of the triangle.
  2. Each leg after wave A will be larger than the previous segment.
  3. Wave E should be the most volatile, complex, and longer terms of time than the other waves.
  4. Wave E tends to be 161.8% of wave A.

Irregular Expanding Triangle. This variation of the expanding triangle is the most common to find in the real market. The main characteristic of this variation is that every time that wave B try to surpass to wave A fails in its advance. Wave E and A are show a 161.8% relationship, being wave E the longest segment.

Continuous Expanding Triangle. This type of restrictive expanding triangle is the second most common pattern to find in the real market. The continuous triangle characterizes by failing when this tries to surpass the end of wave C. If wave D fails, the pattern could show a slight bullish or bearish bias. Finally, waves A and E will be related in a 261.8%, being wave E the longest segment.

Non-Restrictive Expanding Triangles

The non-restrictive expanding triangle pattern follows the same conditions as restrictive expanding triangles. Its main characteristics are as follows:

  • Usually, they don’t have any Fibonacci relationship in their internal segments. The only relationship could be found on waves A and E, where wave E length could be 261.8% of wave A length.
  • The apex of the expanding triangle occurs before the triangle. If the apex occurs between 20% and the start of the expanding triangle, the formation should be non-restrictive.

Conclusions

In this educational article, corresponding to the last part of our four-part series covering the triangle pattern, we presented in the first section, the Non-Restrictive Contracting triangle. This group of contracting triangles tends to appear at the end of complex corrections, or the end of an impulsive terminal structure.

The second section corresponds to the expanding triangles, which are characterized by tricking the different market participants, who tend to think that the market has reversed and, after its last volatile movement corresponding to wave E, they discovered that the market in fact is resuming its previous trend.

Suggested Readings

  • Neely, G.; Mastering Elliott Wave: Presenting the Neely Method; Windsor Books; 2nd Edition (1990).


Categories
Forex Basic Strategies Forex Daily Topic

How ‘External Debt’ Presents A More Clear Picture Of A Nation’s Economy

Introduction

External Debt, unlike regular Government Debt, is typically more objective oriented and is indicative of future development plans for which the loan was taken. In this sense, understanding the source and size of External Debt can help us deduce the upcoming economic developmental changes occurring in the borrowing nation and corresponding benefits that could be derived by the lending party, be it a foreign Government or Banks.

What is External Debt?

It is the part of a country’s Debt that was borrowed from a source outside the country. External Debts are usually taken from Foreign Governments, Banks, or International Financial Institutions. The External Debt must be paid back in the currency in which the loan was initially taken and usually corresponds to the currency of the Foreign Government’s local currency. It puts a de facto obligation on the borrower to either hold those currency reserves or generate revenue through exports to that specific country.

External Debt is sometimes also referred to as Foreign Debt and can be procured by institutions also apart from the Government. Typically External Debt is taken in the form of a tied loan, which means the loan taken must be utilized or spent back into the nation financing the Debt.

For example, if country A takes an External Debt from country B for developing a corn syrup factory, then it may purchase the raw materials required for construction and raw input like corn from the lender itself. It ensures that the lender benefits to a greater extent apart from the interest revenue on the lent money. Hence, in general, the External Debt, specifically tied loans, are transacted for specific purposes that are defined and agreed upon by both lending and borrowing countries.

How can the External Debt numbers be used for analysis?

External Debt takes precedence over Internal or Domestic Debts as agencies like the International Monetary Fund monitor the External Debts, and also, the World Bank publishes a quarterly report on External Debt.

Any default on External Debt can have ripple effects on the credibility of the nation. Internal Debts may be managed, but once Debt is External, it is public information, and defaulting affects the credit rating, and the country is said to be in a Sovereign Default.

When a country is either unable or refuses to pay the Debt back, then lenders will withhold future releases of assets that are essential for the borrowing country. When a country defaults on Debt, the liquidity of the Government and the nation is questioned. It leads to investors and speculators quickly lose confidence in the Government’s ability to manage the economy effectively and withdraw their investments, bringing the nation to a standstill. In the currency market, such situations lead to currency depreciations very quickly.

Once Debt levels cross a certain threshold (generally, it is 77-80% of the GDP) where default risk increases, it becomes a vicious cycle. The knock-on effects of Debt servicing to decreased spending to slowing the economy all result in a recession or a societal collapse in extreme cases.

Impact on Currency

Government Debt is usually taken to finance public spending and build future projects that can help boost the economy. External Debt, when taken, is inflationary for the economy internally and leads to currency depreciation as it floods the market with the domestic currency through its spending. Hence, optimal utilization of the Debt so that it pays off, in the long run, is essential. When a country takes on Foreign Debt and spends its currency depreciates in the short-run for the duration of spending and vice-versa.

Although, the size of the External Debt compared to the economy’s size and its revenue should also be taken into account as the size of the Debt is relative. Underdeveloped economies Debt Sizes are not comparable on a one-to-one basis with those of the developed economies. External Debt is also one of the parts of the total Government Debt and hence, is not a macro indicator when compared to the likes of Total Government Debt and Total Government Debt to GDP ratio in general.

Hence, External Debt is a low impact lagging indicator as it does not account for the complete economic picture. The reasons for taking on External Debt by organizations or Governments, in general, would have been announced months ahead through which economists and investors can make decisions accordingly. Also, the changes that the Government intends to bring through the Debt can be traced through other macroeconomic indicators better than External Debt as an indicator in isolation.

Economic Reports

The World Bank maintains the aggregate External Debt data for various countries on their official website and publishes quarterly reports.

For the United States, the Treasury Department publishes the Gross External Debt reports on its official website. It releases its reports at 4 PM in Washington D.C. on the last business day of March, June, and September, and at 1 PM on the last business day of December for the corresponding quarters.

Sources of External Debt

Below are some of the most credible sources for ‘External Debt.’

Impact of the ‘External Debt’ news release on the price charts 

In the previous section of the article, we understood the External Debt fundamental indicator, which essentially represents the amount a country (both public and private sector) owe to other countries. They involve outstanding loans to foreign private banks, international organizations like the IMF, and interest payments to other institutions. Growing levels of Debt reduce GDP because the monetary payments flow out of the country. It will discourage foreign and private investment because of the concerns that the Debt is becoming unsustainable. Therefore, a country’s External Debt should be at a very nominal level.

In today’s lesson, we will illustrate the impact of External Debt on various currency pairs and examine the change in volatility due to the news announcement. For that, we have collected the data of Sweden, where the below image shows External Debt of the country during the 4th quarter. The data shows a marginal increase in Debt compared to the previous quarter, which means it may not severely affect the currency. Let us find out the reaction of the market to this data.

USD/SEK | Before the announcement:

Firstly, we will look at the USD/SEK currency pair and analyze the impact of External Debt on the price. In the above image, we see that the price was in a downtrend, and recently the market has reversed to the upside, which could be a possible reversal. If the price breaks previous resistance, we can confidently say that the market has reversed to the upside. Looking at the impact of the news release, we will position ourselves accordingly.

USD/SEK | After the announcement:

After the news announcement, the price slightly goes higher and closes exactly at the resistance area. The price after the close of ‘news candle’ is at a very crucial level. Later, we see that the volatility continues to expand on the upside, signaling a change of the trend. As the External Debt data was slightly on the weaker side, traders bought the currency pair by selling Swedish Koruna. However, the price continues to move higher after the news release resulting in further weakening of the currency.

EUR/SEK | Before the announcement:

EUR/SEK | After the announcement:

The above images represent the EUR/CZK currency pair, where we see that market was in a downtrend, and now it has pulled back from the ‘low.’ This is an ideal place for taking a ‘short’ trade, but since the volatility is exceedingly less, we should be careful before entering the market. Low volatile pairs are not desirable for trading purposes as they carry additional costs such as high Slippage, above normal Spreads, and difficulty in order execution.

For these reasons, pairs like EUR/CZK should be avoided. After the news announcement, there is hardly any impact on the currency where the price remains at the same level during and after the announcement. Thus, we don’t witness any volatility in the market, and the External Debt data did not bring any change in the price of the currency.

AUD/SEK | Before the announcement:

AUD/SEK | After the announcement:

The above images are that of the AUD/CZK currency pair, where we see that the market is in a downtrend before the announcement, and recently the price has moved above the moving average, which could be a sign of reversal. Without having many assumptions, it is wise to wait for the news release, and depending on the impact of External debt news, we will take a suitable position.

After the news announcement, the price moves higher, reacting negatively to the External Debt data, which was slightly lower than last time. The volatility increases to the upside as traders go ‘short’ in Swedish Koruna. The price exactly bounces off from the moving average, indicating a possible reversal of the trend.

That’s about ‘External Debt’ and its impact on the Forex market after its news release. If you have any questions, please let us know in the comments below. Good luck!

Categories
Forex Price Action

Significance of Having the Belief in Your Analysis

In today’s lesson, we are going to demonstrate an example of H1-15 combination trading. The price trends from the level of 61.8%. Usually, when the price trends from the level of 61.8%, it does not take that long to make a breakout. However, in this example, we will demonstrate that it may sometimes take longer than our expectations. Let us get started.

The chart shows that the price makes a strong bullish move towards the North. The last candle comes out a bearish inside bar. It indicates that the price may make a bearish correction. The buyers are to wait for the price to produce a bullish reversal candle followed by a bullish 15M breakout at the highest high of the wave to go long in the pair. This is the plan of the game. Let us find out how it goes.

The next candle comes out as a bearish candle as well. The last bearish candle has a long lower shadow. It indicates that the chart may produce a bullish reversal candle anytime soon. The buyers are to wait here with patience.

As expected, the chart produces a bullish reversal candle. The candle comes out as a bullish engulfing candle. The H1-15M combination traders are to flip over to the 15M chart and wait for a bullish 15 candle breaching the wave’s highest high to trigger a long entry.

You may have noticed that the price has been within the level of resistance for several candles. It means the buyers are to keep their eyes on this pair for a long time. Look at the last candle. After so many hours of waiting, the 15M chart produces a bullish candle that closes above the level of resistance. The buyers may trigger a long entry right after the last candle closes. Let us flip over to the H1 chart with Fibo levels on and find out what happens here.

The Fibo level shows that the price trends from the level of 61.8%. This is one of the levels, which usually produces good momentum. In this example, it produces a good bullish momentum after the breakout, but it takes a long time to make the breakout. The H1-15 combination traders’ patience is tested here. The buyers who wait and keep the belief that it may end up producing the signal make money out of this setup in the end. It is not easy, but this is what trading is all about. Having a belief in analysis helps a trader be a better trader.

Categories
Forex Videos

Forex Fundamentals! How Unemployment Rate Affects The Market!

How Unemployment Rate Affects the FOREX Market


Though many have heard of the unemployment rate, only a few actually know how it all works and why it’s important for forex and currency traders to know all about it. The unemployment rate is incredibly important, as it reveals the current state of a nation’s economy.

What Is the Unemployment Rate?

The unemployment rate represents the percentage of people without a job in a given country’s workforce. The people accounted for here are still willing as well as able to work at a job, even though they are unable to find employment.
The unemployment rate a lagging indicator when it comes to the economy, meaning that it changes after the economic state of a given country has already changed. However, the unemployment rate doesn’t have to be a lagging indicator when translated to the FOREX markets. News and reports of a change in the unemployment rate could cause market volatility as it indicates the state of the economy.

Unemployment Rates and the Forex Market

The unemployment rate of a country shouldn’t be ignored by the traders. There are two common examples of how the unemployment rate can be looked at and what it means for the currency prices.

Rate is higher than predicted

If the unemployment rate comes out to be higher than the predictions, the government will have to stimulate the depressed economy by creating new jobs. Let’s use the US as an example. In this case, the Federal Reserve will have to lower the federal funds rate. If this fails in stimulating the economy, then the Federal Government will have to employ fiscal policy measures, such as hiring people for public works projects or stimulating demand with unemployment benefits.
When the unemployment rate rises, it negatively impacts the USD, most likely triggering a bearish turn.

Rate is lower than predicted

When the unemployment rate is lower than expected, the economy will encounter more workers that earn income as well as more consumption expenditure. This could lead to inflation, causing interest rates to rise. A drop in the unemployment rate is a positive occurrence for both the economy and the FOREX market, as the currency will most likely increase in value.

Categories
Forex Market Analysis

Daily F.X. Analysis, June 5 – Top Trade Setups In Forex – Eyes on U.S. Non-farm Payroll! 

On the news front, it’s likely to be a busy day with most of the focus staying on the European Central Bank’s monetary policy meeting. ECB’s Main Refinancing Rate holds at 0%, and So far, the ECB isn’t expected to change it. However, we need to closely monitor the Press conference as the hawkish or dovish remarks from President Christine Lagarde can drive price action in the EUR/USD pair today. Besides, the dollar may stay supported ahead of the NFP figures coming out on Friday.

Economic Events to Watch Today


EUR/USD – Daily Analysis

The EUR/USD currency pair continues to draw bids and hit above the new three-month high of 1.1370 marks as the investors continue to cheer the bigger-than-expected coronavirus emergency purchase program (PEPP) announced by the European Central Bank (ECB) on Thursday to boost the economic recovery. The ECB expanded PEPP by EUR600 billion. On the other hand, the broad-based U.S. dollar modest strength turned out to be one of the key factors that kept a lid on any additional gains in the pair, at least for now. The EUR/USD is trading at 1.1368 and consolidates in the range between the 1.1325 – 1.1377. However, the traders seem cautious to place any strong position ahead of the German Factory Orders.

At the data front, the German Factory Orders are scheduled to release at 06:00 GMT, which is expected to drop by 19.7% month-on-month in April, having fallen 15.6 in March. On an annualized basis, the industrial orders dropped by 7.4% in April. 

Despite the predictions of a sharper drop in the Factory Orders, the shared currency continues to draw bids, backed by the hopes of coronavirus emergency purchase program announced by the European Central Bank (ECB).

On the other hand, the IHS Markit’s German Purchasing Managers’ Index (PMI) for manufacturing was revised downwards to 36.6 in May from the preliminary figures of 36.8, even after it improving slightly from April’s 34.5. The Germany manufacturing sector continued to weaken last month, possibly due to the weakening demand triggered by the coronavirus pandemic. Manufacturing production was already down 7-8% from a peak in late 2017 even before the onset of the pandemic, and now that figure looks to be in the region of 25-30%,” IHS Markit reported.

The decline in the German Factory Orders by the big margin could push the EUR/USD currency pair lower below 1.1300. As well as, if the U.S. dollar takes bids on the worsening market mood, the currency pair extend further declines towards 1.1243 (5-DMA). For now, the traders are waiting for the U.S. NFP data tp drive market movement. 

Daily Support and Resistance

  • R3 1.157
  • R2 1.1466
  • R1 1.1402

Pivot Point 1.1298

  • S1 1.1233
  • S2 1.113
  • S3 1.1065

EUR/USD– Trading Tip

The EUR/USD continues to trade bullish around 1.1360, heading towards the next resistance level of 1.1450 level. The European Central Bank policy decision drove a recent jump in Euro, and now the U.S. NFP will be taking over the game during the U.S. session. So, we can expect EUR/USD to face a strong hurdle around 1.1450 level along with support level around 1.1247. The 50 EMA is suggesting bullish bias along with the MACD indicator, which is holding and forming histograms over the 0 level. Let’s look for buying positions above 1.1298 level today and selling below 1.1458. 


GBP/USD – Daily Analysis

The GBP/USD pair was closed at 1.25957 after placing a high of1.26331 and a low of 1.25005. Overall the movement of GBP/USD pair remained bullish throughout the day. The GBP/USD pair rose for the 6th consecutive day on Thursday and peaked since April 30 after posting 0.5% losses on that day. The GBP/USD pair first dropped and lost ground in early trading session but managed to find support and ended its day with a bullish bias.

The selling bias in GBP was due to a lack of progress in the current round of Brexit negotiations on the future relationship. The 4th round of talks will end on Friday, and more chances for no-deal persists in the market as hopes for mutual concessions on fisheries and trade came and went throughout the talks.

However, the U.K. risk of falling to world trade organizations rule instead of having a deal with E.U. has been increased as BoE issued notice to be prepared for the worst-case scenario I,e no-deal Brexit. These fears amongst investors related t no-deal Brexit also kept the British Pound under pressure on Thursday and caused the early drop of GBP/USD pair.

Another factor involving in the downward movement of GBP/USD pair in the early trading session was the poor than expected Construction PMI from the U.K., which dropped to 28.9 in May from 29.5 of expectations and weighed on GBP.  

But in later sessions after the release of American economic data, the pair started to rise again and started following its previous day’s trend. At 17:30 GMT, the Unemployment Claims for last week were reported as 1.88M from the U.S. against the expected jobless claims as 1.82M and weighed on the U.S. dollar. The Revised Nonfarm Productivity for the quarter dropped to -0.9% against the forecasted -2.5% and weighed on the U.S. dollar. 

At 19:30 GMT, the Trade Balance also showed a deficit of 49.4B against the expected deficit of 41.5B in April and weighed on the U.S. dollar.

The weakness of the U.S. dollar on Thursday gave a push to GBP/USD, and it started to move in an upward trend again. On the other hand, racial tensions in the U.S. were calmed a bit after the three additional police officers involved in the murder of George Floyd were filed with charges. However, the unrest was primarily ignored by the market participants despite its potential impact on the U.S. elections.

Daily Support and Resistance

  • R3 1.2787
  • R2 1.271
  • R1 1.2652

Pivot Point 1.2576

  • S1 1.2518
  • S2 1.2442
  • S3 1.2384

GBP/USD– Trading Tip

On Friday, the GBP/USD continues trading bullish to reach at 1.2650 levels, having violated the triple top level on the 4-hour timeframe. The GBP/USD pair has formed an upward regression trend channel, which is supporting further buying in the Cable. 

Continuation of a bullish trend can lead to GBP/USD prices towards the next resistance level of 1.2690 level. Above this, the next resistance holds around 1.2765 level. Conversely, the support is likely to be found around 1.2605 and 1.2550 level today. Let’s look for buying over 1.2605 level ahead of NFP data today. 


USD/JPY – Daily Analysis

The USD/JPY pair was closed at 108.899 after placing a high of 108.980 and a low of 108.420. Overall the movement of the USD/JPY pair remained bullish throughout the day. The USD/JPY pair extended its previous day’s gains and rose above 108.900 level pacing a high since April 9 on the back of increased risk appetite. The risk-on market sentiment weighed on safe-haven Japanese Yen and pushed the USD/JPY pair above multi week’s highest level.

The U.S. dollar index slipped to its three-month low level due to increased global risk sentiment after the hopes for faster recovery increased due to easing lockdown restrictions. The DXY fell to 97.19 low from 97.63 on the day. Despite the drop in the U.S. Dollar Index, the pair USD/JPY managed to post gains on the back of the strong U.S. equity market.

On the other hand, China’s headlines stopped buying U.S. farm goods and were proven false after the reports suggested that Chinese state-owned firms bought U.S. soybean cargo this week. This raised the optimism that US-China worries would become less. It was also supported by the comments from U.S. Senator Grassley, who said that the US-China trade deal was on track.

Meanwhile, at 17:15 GMT, the US ADP Non-Farm Employment Change for May showed a decline in the number of jobless people to 2.76M from the forecasted 9.0M and helped the U.S. dollar to gain traction. At 18:45 GMT, the Final Services PMI from the U.S. came in line with the expectations of 37.5. At 19:00 GMT, the ISM Non-Manufacturing PMI showed a surge to 45.4 from the expected 44.2 for May and supported the U.S. dollar. The Factory orders in April were declined by 13% against the expected decline of 13.7%. Let’s brace for the U.S. Nonfarm payroll data today. 

Daily Support and Resistance    

  • R3 109.93
  • R2 109.56
  • R1 109.35

Pivot Point 108.98

  • S1 108.76
  • S2 108.4
  • S3 108.18

USD/JPY – Trading Tips

On Friday, the USD/JPY bullish bias continues to drive buying to lead the pair towards 109.350 level. The USD/JPY pair is now breaking above 109.280 level, and above this, the next target is likely to be found around 110. The 50 EMA and MACD both are supporting the buying trend in the USD/JPY pair, and it can lead the USD/JPY prices further higher today. On the lower side, the support holds around 108.640, but the recent bullish engulfing candle and upward price action in the safe haven pair can drive further buying in the USD/JPY pair. Let’s look for buying over 109 levels today. All the best for today! 


Categories
Forex Options

FX Options Market Combined Volume Expiries for 5th June 2020

Thank you for visiting the Forex Academy FX Options market combined volume expiries section. Each day, where available, we will bring you notable maturities in FX Options of amounts of $100 million-plus, and where these large combined maturities at specified currency exchange rates often have a magnetic effect on price action, especially in the hours leading to their maturities, which happens daily at 10.00 AM Eastern time. This is because the big institutional players hedge their positions accordingly. Each option expiry should be considered ‘in-play’ with a good chance of a strike if labelled in red, still in play and a possible strike if labelled in orange and ‘out of play’ and an unlikely strike if labelled in blue, with regard to the likelihood of price action meeting the strike price at maturity.

…………………………………………………………………………………………………………………..

FX option expiries for June 5 NY cut at 10:00 Eastern Time, via DTCC, can be found below.

– EUR/USD: EUR amounts

  • 1.1235 900m
  • 1.1250 892m
  • 1.1300 600m

The EURUSD pair is overbought on the one hour chart but we are in uncharted waters up at this multi-month high of 1.1370 at the time of writing. Potential for a pullback/consolidation phase as the market takes stock of these new levels and general weakness in the US Dollar. Yesterday’s saw a flat refusal to pull under the 1.1200 key round number for the pair. The next big test will be US Non-Farm payrolls and associated data release before the New York Cut at 10 AM. Eastern time. Until then the 1.1300 maturity is in play.


– USD/JPY: USD amounts         

  • 108.80 1.0bn

USDJPY is in a bull trend which remains true of yesterday’s analysis where we suggested the price action had more upside to run. Price action is subdued and the one hour chart is overbought. US data out later applies just as much here also. The maturity at 108.80 looks unlikely but is only 46 pips away from the current price action. Watch for a break under the lower trend line to confirm downside and a break in the trend to the maturity.


– USD/CAD: USD amounts

  • 1.3400 969m
  • 1.3500 2.3bn

USDCAD is in a descending wedge formation with pressure building to the downside. The narrow trading range of late tells us the market is unsure of directional bias. Overall US dollar weakness is the main driving factor in the strength of the Loonie. Again, US and Canadian employment data due out before the New York cut will define the next trend in price action. The 1.3400 maturity looks the most likely candidate in current conditions.

……………………………………………………………………………………………………………………..

As you can see on the charts we have also plotted the expiration levels at the various exchange rate maturities and we have also labelled in red, orange and blue. Therefore, if you see option expiry exchange rates labelled in red these should be considered in-play, because we believe there is a greater chance of the expiry maturing at these levels based on technical analysis at the time of writing. There is still a lesser possibility of a strike if they are in orange and so these are ‘in-play’ too. However, if we have labelled them in blue, they should be considered ‘not in-play’ and therefore price action would be unlikely to reach these levels, which are often referred to as Strikes, at the time of the 10 AM New York cut.

Our technical analysis is based on exchange rates which may be several hours earlier in the day and may not reflect price action at the time of the maturities. Also, we have not factored in economic data releases or keynote speeches by policymakers, or potential market volatility leading up to the cut.

Although we have added some technical analysis we suggest you take the levels and plot them onto your own trading charts and incorporate the information into your own trading methodology in order to use the information to your advantage.

Remember the higher the amount, the larger the gravitational pull towards the exchange rate maturity at 10:00 AM Eastern time.

If you want to learn how forex option expiries affect price action in the spot FX market see our educational article by clicking here: https://bit.ly/2VR2Nji

DISCLAIMER: Please note that this information is for educational purposes. Also, the maturities will look more or less likely to become a strike at 10 AM NY time due to exchange rate fluctuations resulting in a different perspective with regard to technical analysis, and also due to upcoming economic data releases for the associated pairs.

Categories
Forex Signals

EURCAD Piercing Pattern and Breakout

EURCAD has been moving in a slightly descending channel, here shown as a linear regression channel.  The last iteration of the Price drove it from the top of it to near the bottom. There, it made a double bottom figure and headed up again. After being rejected by the central regression line (dotted line), the Price retraced slightly, then, four hours ago, The Price made a piercing candlestick followed by a large candlestick that went above the last high.

A trade can be made with the entry at 1.5191, a stop below the recent low (1.5110), and a profit target neat the last high of 1.5374. for a reward/risk ration of over 2.

The technical factors ate in favor of the trade. The price moves above the +1 sigma line of the Bollinger bands, and the bands are heading up. Also, the Stochastic oscillator has triggered a buy signal near the oversold level.

The Setup

Buy Entry: 1.5191

Stop-loss:1.5110 or lower

Take-profit: 1.5374

Reward/Risk: 2

Dollar risk: $575 on one lot. $57.5 on a mini lot, and $5.75 on a micro lot

Dollar reward: $1,150 on a lot.

It is recommended not to go above 1 percent of your balance in a single position. Thus, traders should not take more than two micro lots for every $1000 in their trading account.

Categories
Forex Signals

USD/CAD Choppy Session Continues – Brace for Breakout! 

The USD/CAD was closed at 1.34942 after placing a high of 1.35722 and a low of 1.34798. Overall the movement of USD/CAD remained bearish throughout the day. The USD/CAD pair posted losses for the 3rd consecutive day on Wednesday amid the weakness on the US dollar due to risk-on market sentiment. The reopening of economies has boosted the expectations of faster economic recovery and provide confidence to the investors that central banks and governments were there to underpin the global economy.

The US Dollar Index, which measures the value of the US dollar against the basket of six currencies, fell to its lowest since mid-March at 97.19, which ultimately dragged the USD/CAD pair with itself.

Meanwhile, the Bank of Canada held its interest rates at 0.25%, which BoC said is as low as it will go. According to Bank, the Canadian economy appeared to have avoided the worst-case scenario of the COVID-19 pandemic.

The Bank also started a number of debt & bond-buying programs in order to make sure that there will be enough cash in the system. Bank announced on Wednesday that it was still buying government bonds to make sure banks have enough money to lend to creditworthy borrowers. Bank also stated that the measures taken to reduce the coronavirus crisis’s effect on improving market conditions were having their intended effect. The Bank said that it was ready to adjust these programs if the market conditions suggest so.

According to the Bank, the effect of coronavirus has likely peaked, and the expectations of second-quarter contraction could be 10-20% rather than the predictions made beforehand. On the US front, despite upbeat market data, the US dollar remained under pressure due to increased risk-on sentiment, which added in the downfall of the USD/CAD pair on Wednesday. On the crude oil front, the WTI Crude prices surged above $38 level and supported commodity-linked currency Loonie. 


The negative figure of crude oil inventories from the United States as -2.1M rose Crude oil prices and helped Loonie to find traction in the market. The strong Loonie dragged the pair USD/CAD further, and hence pair dropped for the 3rd consecutive day. However, the upbeat economic data from the United States about the ADP Non-Farm Employment Change and ISM Non-Manufacturing PMI gave strength to the US dollar and kept a lid on additional losses of pair USD/CAD.

Daily Technical Levels

Support Resistance

1.3457 1.3552

1.3420 1.3610

1.3362 1.3647

Pivot point: 1.3515

On the technical side, the USD/CAD is trading sideways within a narrow trading range of 1.3550 – 1.3485. Breakout of this range will drive further trends in the USD/CAD pair. The bearish breakout of 1.3485 support level can open up further room for selling until the next support area of the area of 1.3395. The bullish breakout of 1.3550 level can lead the USD/CAD prices to be higher until 1.3625 and 1.3700 level, which marks 38.2% and 61.8% Fibonacci retracement levels. Let’s keep an eye on 1.3485 level to stay bullish or bearish below this level today. Good luck! 

Categories
Forex Videos

Forex – Predicting Interest Rate Changes For Maximising Profit!

Predicting Interest Rate Changes to Improve FOREX Profits

One of the biggest factors influencing the foreign exchange market is interest rate changes that are made by some of the eight global central banks.
These changes are acting as indirect responses to other economic indicators, and they can potentially move the market sharply and immediately. As surprise rate changes almost always have a great impact on traders, understanding how to react to or even predict these volatile moves can lead to higher profits.

How Rates Are Calculated

Each central bank’s board of directors has control over the monetary policy of its country. This includes control over the short-term interest rate at which banks borrow from one another. Central banks often hike rates in order to curb their inflation, while they cut rates to encourage lending as well as to inject money into the economy.

Typically, the Central bank will decide what to do by examining the most relevant economic indicators; such as:

The Consumer Price Index
Consumer spending
Employment levels
Housing market
Subprime market

Predicting Central Bank interest Rates

A trader can estimate the rate change range by examining these indicators themselves. Typically, as the aforementioned indicators improve, the rates will need to be raised or (if the change is small) to stay at the same level. On the other hand, any significant drops in these indicators should be a sign of a possible rate cut to encourage borrowing.

Major announcements are another way central bank leaders can let people know how the rates will change. Whenever a board of directors from any central bank is scheduled to talk publicly, the news on how the particular Central bank views the current economic position will be revealed.

Traders can also estimate rates by averaging forecasts made by financial institutions, though this estimate would be second-hand and, therefore, less reliable.

Surprise Rate Changes

No matter how calculated a trader is, Central banks can, without any prior notice, deliver a surprise rate change. However, this may not be such a bad thing as the effect on the market is sharp, immediate, and most notably:

PREDICTABLE.
If there is a rate hike, the currency will almost always appreciate. Traders should act quickly and buy the currency as soon as possible. On the other hand, interest rate cuts indicate a currency going down in price, and traders should sell or short. Trading trend reversals is also a viable strategy, as the market will most likely overextend while performing a sudden and intense move.

Categories
Forex Videos

Gold VS Fiat currencies – What You Should Be Doing!


Gold vs. Fiat currencies – What to do?

Gold markets have rallied quite a bit during the trading session on Friday. The rally was most likely caused by people that want to preserve their holdings since they find the situation around the world concerning. On top of that, central banks are running their printing presses at full tilt, bringing even more uncertainty to the market. Ultimately, everything suggests that we should see fiat currencies slowly get devalued.
The gold market, on the other hand, is the natural place to go looking to protect your holdings from value drops.

Looking at the chart, even though gold looks quite bullish, the resistance between the $1740 level and the $1760 level might pose a problem. If gold can break above this area, then the market is most likely going towards the $1800 level without many stops. Ultimately, the $1800 level itself is significant resistance, so breaking above it and establishing support would mean much for the future of gold. With all of the various concerns all around the world when it comes to global trade, the pandemic as well as constant fiat printing, it is hard to imagine a scenario where gold doesn’t rise over the long term against the US dollar.

The fiat currency market will have to seek equilibrium and find what the right price is for all the pairs as countries dealt with the global problems differently. This, in turn, affected their economies and currencies differently. Fundamental analysis should be at the forefront of FOREX analysis at the moment.

Categories
Forex Basic Strategies

Best Way of Trading The ‘Rectangle Chart Pattern’

Introduction

The ‘Rectangle’ is a classical technical analysis pattern described by horizontal lines showing support and resistance levels on the price chart. This pattern resembles the concept of buying at A significant support level and selling at a predominant resistance level. The price can stay between the Rectangle pattern for a long time, or the pattern can be very small.

The appearance of this pattern implies that the supply and demand of the currency pair are in balance for an extended period. The price action finds resistance at the top of a rectangle and support at the bottom of a rectangle. The pattern can easily be recognized and confirmed after the formation of two highs and two lows. These highs and lows form two parallel lines above and below the price action. These lines act as a strong support and resistance levels to the price action.

Keep in mind that this pattern doesn’t have a bullish or bearish bias. It is a neutral pattern that shows both parties are holding an equal amount of power. Using this pattern, we can trade with the trend, or it can be used to trade the counter trend and reversals also. In short, the Rectangle chart pattern is both continuous and reversal as well. However, technical experts believe that using the Rectangle as a continuation pattern has higher odds of performing.

Trading The Rectangle Chart Pattern

Example 1

The Rectangle pattern can be easily found on the price charts, and it mostly appears on all the trading timeframes. The below chart indicates the formation of the Rectangle chart pattern on the AUD/NZD daily chart.

As discussed, there is no such thing as a bullish or bearish Rectangle pattern. When we find this pattern on any timeframe, all we need to do is to trade with the trend. We can also trade the Rectangle pattern, just like how we trade ranges.

The image below represents the same Rectangle chart pattern that is shown in the above figure but on the 240 Minutes timeframe. The orange box represents a couple of buy and sell opportunities, but we have decided only to trade this pattern with the trend. The green arrows represent our buying entry in the pair.

The below chart represents our entry and exit in the AUD/NZD Forex pair. The green arrow represents our entry in this pair, and the stop-loss is placed just below the orange box that represents the formation of this pattern. The placement of stop-loss depends on you. If you are an aggressive trader, place the stop-loss just below the entry, and the conservative traders must go for more profound stop-loss.

The take-profit placement is an art as we can exit our positions in many correct ways. You can make use of technical indicators to close the positions. When the trend loses its momentum, use the support, resistance area to close your positions. In the above example, we can see the reversed deeply as soon as we exited our position. This is because that is the place where the significant resistance line is.

Example 2.1

On the daily chart of the AUD/NZD, the below image represents the formation of two rectangle chart patterns in a downtrend.

The below image is the same rectangle pattern (1st) that is shown in the above chart but on a lower timeframe, which is 240 Minutes chart. Most of the time, we will find the Rectangle patterns in a trending market only. Also, this pattern represents the pullback phase of an ongoing trend. Another thing that a Rectangle pattern implies is that both of the parties hold equal power during the pullback phase. That is the reason for this pattern to form in the first place.

So be careful while trading this pattern because, in the consolidation phase, markets often throws a couple of spikes on the price chart. The safest way of trading this pattern is when the price action approaches at the upper area of the Rectangle. In the below chart, the Red arrow represents our selling trade in this pair.

The below chart represents our entry, exit, and risk management in this pair. The entry was at the top of the box. If you compare the stop-loss with take-profit, it clearly shows that we have opted for a smaller stop-loss, it was because the upper line of Rectangle acts as a primary resistance line. If the price action breaks the resistance line, the pattern by default gets invalid, and there is no need to hold our position. Around our take profit area, the price action started struggling, which indicates the power. Hence we decided to close our position.

Example 2.2

The below AUD/NZD Forex chart represents the formation of a Rectangle chart pattern on the 240 minutes chart. The pattern that you see below has appeared right after the previous trade that is discussed above. At times we will see these patterns consecutively, especially in a strong trending market. It is strongly recommended to go with the flow and trade them with confidence. The chart below shows that the price action spends some time in the rectangle box, and when it hits the bottom of the Rectangle, we activated our selling trade in this pair.

The chart below represents the entry, exit, and take-profit in this pair. As we can see, the entry was at the bottom of the Rectangle, and the stop-loss placement was above the Rectangle. For take-profit, we have waited for the sellers’ momentum to die out to close our trade.

Conclusion

For a Rectangle pattern to be valid, the price must have gone through at least two tops and two bottoms on the price chart. Always make sure to hold your trade till the market loses its momentum. You can also look for the formation of any candlestick patterns to exit the trades. If you activate your trade at the top of the Rectangle, make sure to place the stop-loss just above the Rectangle pattern. If the activation was after the breakout, place the stop-loss in the middle of the Rectangle range.

We hope you understood the trading of the Rectangle chart pattern. In case of any queries, let us know in the comments below. Cheers.

Categories
Forex Price Action

H1-15M Combination Strategy: Entry upon Consolidation and Fibo Targets

In today’s lesson, we are going to demonstrate an example of the H1 -15M combination trading strategy offering entry upon consolidation. We are going to integrate Fibonacci levels to see how far the price moves. This would give us an idea of how effective Fibonacci levels are to determine the stop loss and take profit level. Let us get started.

The H1 chart shows that the price makes a strong bearish move and finds its support. The black marked level is the level of H1 support here. The price moves towards the North with two candles and may have found its resistance. One of the candles comes out as a bearish engulfing candle. Traders are to wait for an H1 breakout followed by a 15M bearish reversal candle to go short in the pair. Let us see what happens here.

The chart produces one more bearish candle followed by a doji candle. It means the price consolidates in this chart. The next candle closes just below the level of support. Ideally, this is not a perfect breakout candle. However, the price consolidates and produces an H1 bearish reversal candle (the last candle). This is a signal that the price may get bearish and head towards the South. Let us flip over to the 15M chart.

The 15M chart shows that the last candle comes out as a bullish candle. Do not forget that H1 candle closes with a bearish body. Thus, a 15M bearish reversal candle (preferably engulfing candle) will push the price towards the South.

Look at the last 15M candle. It comes out as a bearish engulfing candle closing well below the last candle. This means the price may head towards the South with good bearish momentum. Let us proceed to the next chart with Fibonacci levels to find out how far the price heads to.

The price trends from the 78.6% level and reaches 161.8%. Usually, the 78.6% Fibo level drives the price towards the level of 138.2% with good momentum. It often reaches up to the level of 161.8% because of momentum. However, we may set our target at 138.2% if it trends from 78.6%. Another point you may have noticed is that we draw Fibonacci levels by using the lowest low, not the H1 support. These are two different things.

If the H1 chart makes a straight breakout, we may wait for a 15M reversal candle to take entry. If it consolidates and produces an H1 reversal candle, we may trigger entry if 15M chart produces a strong reversal candle closing well below the wave’s lowest low. Do some backtesting; you will see many charts where the price makes a move like this. Stay tuned. We will reveal more examples of this.


Categories
Forex Market Analysis

EUR/USD All Set for Bearish Correction – Quick Update on Signal! 

The single currency Euro continues to show a slight bearish bias despite the release of better than expected Eurozone’s Retail Sales data. The pair is now trading at 1.1210, and it has the potential to drop further until 1.1112 level.  

As per new reports that the U.S. stopped Chinese flights into the U.S. active from June 16 in response to the recent move from China, which stopped American carriers from re-entering the dragon nation. While the U.S. Dollar Index that tracks the greenback against a basket of other currencies gained 0.21% to 97.465 by 12:12 AM ET (5:12 AM GMT).

Despite the new selling bias, the EUR/USD currency pair remained above the 1.1200 level due to the hopes of the ECB additional stimulus to support the economy. Germany’s stimulus agreement turned out to be one of the key factors that kept a lid on any further losses in the pair. Later today, the eyes will be on the ECB policy decision, which can drive a movement in the EUR/USD pair. 


The EUR/USD took a bearish turn against the U.S. dollar to complete 61.8% Fibonacci retracement at 1.1215 level today. This level is extending solid support to the EUR/USD, and violation of this level can extend the EUR/USD pair until 1.1190 level. While above 1.1212 level, the EUR/USD can bounce off until 1.2305 level. 

Entry Price – Sell 1.12105    

Stop Loss – 1.12505    

Take Profit – 1.11705    

Risk to Reward – 1.00

Profit & Loss Per Standard Lot = -$400/ +$400

Profit & Loss Per Micro Lot = -$40/ +$40

Categories
Forex Market Analysis

Daily F.X. Analysis, June 4 – Top Trade Setups In Forex – Eyes on ECB Policy Meeting! 

On the news front, it’s likely to be a busy day with most of the focus staying on the European Central Bank’s monetary policy meeting. ECB’s Main Refinancing Rate holds at 0%, and So far, the ECB isn’t expected to change it. However, we need to closely monitor the Press conference as the hawkish or dovish remarks from President Christine Lagarde can drive price action in the EUR/USD pair today. Besides, the dollar may stay supported ahead of the NFP figures coming out on Friday.

Economic Events to Watch Today


EUR/USD – Daily Analysis

The EUR/USD pair was closed at 1.12334 after placing a high of 1.12577 and a low of 1.11665. Overall the movement of the EUR/USD pair remained bullish throughout the day. The EUR/USD pair extended its previous bullish rally for 8thconsecutive day on Wednesday and surged to its highest level since March 12 at 1.12500 level. The risk-on market sentiment continued to weigh the U.S. dollar and pushed the EUR/USD pair on an upward trend.

The U.S. Dollar Index was calm during the European trading hours at 97.50, but after the release of economic data, Index lost its traction and was dragged down. At 12:15 GMT, the Spanish Services PMI for May surged to 27.9 against the expected 24.7. At 12:45 GMT, the Italian Services PMI also exceeded the expectations of 26.2 and came in as 28.9. At 12:50 GMT, the French Services PMI for May increased to 31.1 against the expected 29.4. At 12:55 GMT, the German Final Services PMI also surged to 32.6 from 31.4 of expectations. At 13:00 GMT, the Final Services PMI for the whole Eurozone exceeded the expectations of 28.7 and came in as 30.5 to make Euro stronger against the U.S. dollar.

At 12:55 GMT, the German Unemployment Change showed that 238K people lost their jobs in April against the expectation of 188K. At 13:00 GMT, the Italian Monthly Unemployment Rate decreased to 6.3% from the expected 9.2% and supported Euro. At 14:00 GMT, the PPI for the month of April from the whole bloc was declined by 2.0% against the forecasted decline by 1.8% and weighed on Euro. However, the whole bloc’s unemployment rate was recorded as 7.3% against the expected 8.2% in April and supported Euro.

Better than expected Services PMI and Unemployment data from the whole bloc and its countries gave a push to Euro prices against the U.S. dollar and moved EUR/USD pair in an upward trend on Wednesday.

Daily Support and Resistance

  • R3 1.1362
  • R2 1.131
  • R1 1.1272

Pivot Point 1.1219

  • S1 1.1181
  • S2 1.1128
  • S3 1.109

EUR/USD– Trading Tip

The single currency Euro also took a bearish turn against the U.S. dollar to complete 61.8% Fibonacci retracement at 1.1215 level today. This level is extending solid support to the EUR/USD, and violation of this level can extend the EUR/USD pair until 1.1190 level. While above 1.1212 level, the EUR/USD can bounce off until 1.2305 level. Let’s wait for the ECB rate decision to determine further trends in the EUR/USD. 


GBP/USD – Daily Analysis

The GBP/USD pair was closed at 1.25749 after placing a high of 1.26148 and a low of 1.25448. Overall the movement of GBP/USD pair remained bullish throughout the day. Sterling rose to its five-week highest level on Wednesday, and the pair GBP/USD continued to post gains for the 5th consecutive day on the back of the risk-on market sentiment. U.S. dollar was under heavy pressure amid risk appetite despite U.S. unrest and good economic data. The recent reopening of economies from across the globe boosted investors’ confidence in global economic recovery in the second half of the year, which was also backed by the recent economic data which has already has started to show the signs of betterment.

Markets moved towards riskier assets, including GBP and hence, the pair GBP.USD gained traction in the market. At 13:30 GMT, the Final Services PMI from Great Britain surged to 29.0 from the expected 27.9 and supported Sterling. The ADP Non-Farm Employment Change reported a job loss of 2.76M against the expected job loss of 9.0M. At 19:00 GMT< the ISM Services PMI from the U.S. also increased to 45.4 from 44.2 expected.

However, the gains in GBP/USD pair remained under pressure due to looming Brexit risks after the Bank of England warned the city to prepare for no-deal Brexit. The final round of talks between the E.U. & U.K. has been started, but the chances to secure a deal are highly unlikely.

The governor of Bank of England, Andrew Bailey, told the British biggest lenders to bolster their preparations for a no-deal Brexit. He said that it was Bank of England’s duty to prepare the U.K.’s financial system for all risks that it might face. And to do so, the warning to be ready for the worst-case scenario was issued. This warning by BoE kept a lid on any additional gains in GBP/USD pair on Wednesday.


Daily Support and Resistance

  • R3 1.2684
  • R2 1.265
  • R1 1.2612

Pivot Point 1.2578

  • S1 1.254
  • S2 1.2506
  • S3 1.2468

GBP/USD– Trading Tip

The GBP/USD was trading with a bullish bias to reach at 1.2600 levels, testing the triple top level on the 4-hour timeframe. The bullish channel has driven a bearish correction in the pair, and on the 4-hour chart, the GBP/USD seems to have more potential for selling until the next support area of 1.2475 level. The MACD has also crossed below 0, which demonstrates initiation of a selling bias, and it may lead the Cable lower to 1.2479 level. Consider taking selling trades over below 1.2600 today.


USD/JPY – Daily Analysis

The USD/JPY pair was closed at 108.899 after placing a high of 108.980 and a low of 108.420. Overall the movement of the USD/JPY pair remained bullish throughout the day. The USD/JPY pair extended its previous day’s gains and rose above 108.900 level pacing a high since April 9 on the back of increased risk appetite. The risk-on market sentiment weighed on safe-haven Japanese Yen and pushed the USD/JPY pair above multi week’s highest level.

The U.S. dollar index slipped to its three months low level due to increased global risk sentiment after the hopes for faster recovery increased due to easing of lockdown restrictions. The DXY fell to 97.19 low from 97.63 on the day. Despite the drop of the U.S. Dollar Index, the pair USD/JPY managed to post gains on the back of strong U.S. equity market.

On the other hand, the headlines of China stopped buying U.S. farm goods and were proven false after the reports suggested that Chinese state-owned firms bought U.S. soybean cargo this week. This raised the optimism that US-China worries would become less. It was also supported by the comments from U.S. Senator Grassley, who said that the US-China trade deal was on track.

Meanwhile, at 17:15 GMT, the US ADP Non-Farm Employment Change for May showed a decline in the number of jobless people to 2.76M from the forecasted 9.0M and helped the U.S. dollar to gain traction. At 18:45 GMT, the Final Services PMI from the U.S. came in line with the expectations of 37.5. At 19:00 GMT, the ISM Non-Manufacturing PMI showed a surge to 45.4 from the expected 44.2 for May and supported the U.S. dollar. The Factory orders in April were declined by 13% against the expected decline of 13.7%.

Daily Support and Resistance    

  • R3 109.71
  • R2 109.35
  • R1 109.12

Pivot Point 108.77

  • S1 108.54
  • S2 108.19
  • S3 107.96

USD/JPY – Trading Tips

The USD/JPY bullish bias violated the series of resistance levels to lead the USD/JPY currency pair towards 108.770 level. The closings of bullish engulfing and three white soldiers candlestick patterns are likely to drive further buying until 109.125 level today. On the 4 hour timeframe, the USD/JPY pair has crossed over 50 EMA and has closed a few candles above resistance become support area of 108.350, which is supporting bullish bias among traders. The USD/JPY pair may find support at 108.350 and resistance at 109.125 level while the breakout of this range will determine the next trend in the pair. Today let’s consider buying over 108.35. All the best for today! 


Categories
Forex Options

FX Options Market Combined Volume Expiries for 4th June 2020

Thank you for visiting the Forex Academy FX Options market combined volume expiries section. Each day, where available, we will bring you notable maturities in FX Options of amounts of $100 million-plus, and where these large combined maturities at specified currency exchange rates often have a magnetic effect on price action, especially in the hours leading to their maturities, which happens daily at 10.00 AM Eastern time. This is because the big institutional players hedge their positions accordingly. Each option expiry should be considered ‘in-play’ with a good chance of a strike if labelled in red, still in play and a possible strike if labelled in orange and ‘out of play’ and an unlikely strike if labelled in blue, with regard to the likelihood of price action meeting the strike price at maturity.

…………………………………………………………………………………………………………………..

FX option expiries for June 4 NY cut at 10:00 Eastern Time, via DTCC, can be found below.

– EUR/USD: EUR amounts

  • 1.1205 727m
  • 1.1215 603m
  • 1.1245 617m

The EURUSD pair is off of its highs and in a downward channel but oversold on the one hour chart. A slew of data out later including ECB interest rate decision and initial jobless claims in the US could see market volatility. Current maturities are in play, but the data release may well push these into the shade as the day progresses and data is taken on board post-release.

– USD/JPY: USD amounts         

  • 107.85 435m
  • 108.00 578m
  • 108.10 475m

The USDJPY pair is in an upward channel where a previous key area of resistance has become an area of support. The option expiries are out of play. Expect more upside.

……………………………………………………………………………………………………………………..

As you can see on the charts we have also plotted the expiration levels at the various exchange rate maturities and we have also labelled in red, orange and blue. Therefore, if you see option expiry exchange rates labelled in red these should be considered in-play, because we believe there is a greater chance of the expiry maturing at these levels based on technical analysis at the time of writing. There is still a lesser possibility of a strike if they are in orange and so these are ‘in-play’ too. However, if we have labelled them in blue, they should be considered ‘not in-play’ and therefore price action would be unlikely to reach these levels, which are often referred to as Strikes, at the time of the 10 AM New York cut.

Our technical analysis is based on exchange rates which may be several hours earlier in the day and may not reflect price action at the time of the maturities. Also, we have not factored in economic data releases or keynote speeches by policymakers, or potential market volatility leading up to the cut.

Although we have added some technical analysis we suggest you take the levels and plot them onto your own trading charts and incorporate the information into your own trading methodology in order to use the information to your advantage.

Remember the higher the amount, the larger the gravitational pull towards the exchange rate maturity at 10:00 AM Eastern time.

If you want to learn how forex option expiries affect price action in the spot FX market see our educational article by clicking here: https://bit.ly/2VR2Nji

DISCLAIMER: Please note that this information is for educational purposes. Also, the maturities will look more or less likely to become a strike at 10 AM NY time due to exchange rate fluctuations resulting in a different perspective with regard to technical analysis, and also due to upcoming economic data releases for the associated pairs.

Categories
Forex Elliott Wave

Advanced Applications in Wave Analysis – Part 3 of 4

Introduction

The triangle pattern is the third basic model of the corrective structures defined by R.N. Elliott. The triangle contains five internal segments and tends to appear in waves 4 and B. 

Glenn Neely, in his work “Mastering Elliott Wave,” expands the definitions of contracting and expanding triangle introduced by Elliott proposing two subcategories identified as non-restricting and restricting. 

In this educational article, corresponding to the third of four parts, we’ll present the triangle pattern variations and its implications in the wave analysis. In particular, we’ll discuss the contracting triangle pattern and its restrictive subcategory.

Contracting Triangles

This type of triangle is the most frequently identified in the real market. In this group, there are two types of triangles, restrictive and non-restrictive contracting triangles.

Restrictive Contracting Triangle

All contracting triangles have a similar shape in its construction. The main characteristic is that wave E ends before the apex of the triangle. The apex tends to occur in a range of 20% to 40% of the total triangle time extension. 

Concerning the thrust, in restrictive contracting triangles, it is limited by the most extended segment of the triangle (25% approx.) This type of triangles corresponds to the formations described by Elliott in his Treatise. Moreover, these patterns tend to appear in waves 4 and B.

  • Horizontal Contracting Triangle. Each segment must measure at least 38.2% of the previous segment, except for wave E. Wave B can’t be more than 261.8% of A, wave C can’t extend more than 161.8% of B. Wave D must be shorter than wave C, and wave E must be shorter than wave D.
    1. Wave A. This wave will not necessarily be the largest in terms of the price of the triangle. Likewise, it will not be the shortest wave of the pattern.
    2. Wave B. In this case, if wave B is shorter than wave A, then the rest will be shorter. If the wave is longer than wave A, there are a few possibilities that wave C will be longer than wave B, and the triangle formation corresponds to a contracting triangle. If wave C is longer than wave B, then the structure corresponds to an expanding triangle
    3. Wave C. Under a few circumstances, wave C could get longer than wave B. If this scenario occurs, then the base-line should be traced connecting waves C and E.
    4. Wave D. This wave must be shorter than wave C, although it could last longer than wave C.
    5. Wave E. This one must be the shortest wave of the triangle pattern.
  • Irregular Contracting Triangle. This variation is characterized by wave B being the most extended of the structure.
    1. Wave A. In this case, wave A will tend to be shorter in terms of time than wave B. The extension of wave B should be longer than 161.8 of wave A. Wave A could be any corrective pattern except for a triple zigzag or an extended flat.
    2. Wave B. This wave should be the largest wave of the entire formation, extending until 161.8% of wave A, but never beyond 261.8%. Wave B tends to be a zigzag or a double zigzag.
    3. Wave C. This wave will be shorter than wave B and should retrace at least 38.2% of wave B. Wave C could be a zigzag, flat, or an extended flat.
    4. Wave D. This wave will be shorter than wave C and should retrace at least 38.3% of wave C. Wave D could be any corrective pattern that alternates with wave C.
    5. Wave E. This wave will be the shortest wave of the triangle pattern in terms of price. Generally, wave E will tend to be a triangle pattern.
  • Continuous Contracting Triangle. This pattern is detected through the advance of waves B and D. Wave B will be larger than wave A, and simultaneously, wave D will be larger than wave C. The thrust of this pattern would be at least 161.8% respect to the largest segment of the triangle.
    1. Wave A. This wave should not be lower than 38.2% of wave B. Wave A could be a flat or a zigzag, but never a triangle or a double or triple zigzag. Most of the time, wave A will be a flat pattern.
    2. Wave B. This wave must be the largest segment of the complete formation. Its formation could correspond to a zigzag, double zigzag, or rarely a triple zigzag.
    3. Wave C. This segment must be shorter than wave B, and can’t be more complex than wave B.
    4. Wave D. This segment must be larger than wave C in terms of price and could be any type of corrective pattern except a triple zigzag.
    5. Wave E. This segment must be the shortest wave of the triangle. If the continuous triangle moves in wave B, this wave will frequently end at 61.8% or 38.2% of the entire movement.

Conclusions

In this educational article, corresponding to the third part of the four-part series, we presented the contracting triangle pattern under the restrictive subcategory.

The contracting triangle tends to be the most common corrective pattern in waves 4 and B. As said by R.N. Elliott in his Treatise, the knowledge of the corrective formations and its implications provides to wave analyst an advantage of the potential next move of the market.

In the next article, we’ll end this four-part present the non-restrictive contracting triangles and the expanding triangles.

Suggested Readings

  • Neely, G.; Mastering Elliott Wave: Presenting the Neely Method; Windsor Books; 2nd Edition (1990).


Categories
Forex Market Analysis

Daily F.X. Analysis, June 3 – Top Trade Setups In Forex – Brace for Advance NFP Figures! 

On Wednesday, the market is likely to exhibit sharp price actions in the wake of series of high impact economic events such as Final Services PMI, G7 Meeting, ADP Non-farm payroll, and Canadian monetary policy meetings. Most of the price action is expected to be driven by Advance Non-farm payroll figures, which are expected to perform slightly better than the previous month. It can drive buying in the U.S. dollar.

Economic Events to Watch Today


EUR/USD – Daily Analysis

The EUR/USD pair was closed at 1.11687 after placing a high of 1.11958 and a low of 1.11149. Overall the movement of the EUR/USD pair remained bullish throughout the day. The EUR/USD pair extended its bullish rally for the 7th straight day on Tuesday due to risk-on market sentiment and made the risk-sensitive Euro to outperform the U.S. dollar. The pair rose to its highest since mid-march near 1.1196.

At 11:45 GMT, the Budget Balance from the French government was issued, which showed a deficit of 92.1B. AT 12:00 GMT, the Spanish Unemployment Change was decreased to 26.6K from the expected 230.3K and supported Euro, which ultimately raised EUR/USD prices on Tuesday.

The U.S. dollar weakened against its rivals, and the U.S. Dollar Index dropped to its lowest level in12 weeks at 97.43. The weakened U.S. dollar also gave support to EUR/USD gains on Tuesday.

On Wednesday, for Euro traders, the unemployment data will be looked upon for fresh impetus. While on Thursday, the European Central Bank will announce its monetary policy decision, which will be under close watch by the investors. 

It is widely expected that ECB would extend the PEPP program to a total of 1 Trillion euros. If that happens, it would further add in the EUR/USD gains. Furthermore, on Tuesday, the European Commission started a process that could lead to reforms of drug manufacturing pharmaceuticals to limit shortages of vaccines and antibiotics and the availability of medicine more easily.

The move came in after the E.U. faced many difficulties in fighting the COVID-19 pandemic related to the healthcare shortcomings due to dependency of the bloc on foreign supplies of essential drugs and chemicals from India and China.

According to the European Commission, there was a need to build a holistic patient-centered pharmaceutical Strategy that could cover the whole life cycle of pharmaceutical products i,e from its scientific discovery to authorization and patients access.

Daily Support and Resistance

  • R3 1.129
  • R2 1.1243
  • R1 1.1208

Pivot Point 1.1161

  • S1 1.1125
  • S2 1.1079
  • S3 1.1043

EUR/USD– Trading Tip

The bullish bias of the EUR/USD pair continues to drive an upward trend in the market, as it leads to EUR/USD prices to 1.1204. The pair is likely to find immediate support around 1.1150 level, while resistance holds around 1.1236 level. The overall trend is bullish, but we can expect a slight retracement until 1.1180 level before seeing additional buying.


GBP/USD – Daily Analysis

The GBP/USD was closed at 1.25514 after placing a high of 1.25758 and a low of 1.24782. Overall the movement of GBP/USD remained bullish throughout the day. The GBP/USD pair continued its bullish track and rose for the 4th consecutive day on Tuesday and crossed a level of 1.25700 on the back of broad-based U.S. dollar weakness. Another factor in the upward rally of GBP/USD, along with the U.S. dollar weakness, was Pound’s strength due to renewed optimism in Brexit developments.

According to Brussels sources reported in The Times, U.K. was expected to signal compromises on fisheries and some trade rules if the E.U. agreed to back down from its demand for regulatory alignment and fishing access.

After this statement came into the market, the demand for British Pound increased, which raised the bars for GBP/USD pair across the board. However, the rally was on its way to posting remarkable gains but was dragged down after U.K.’s Prime Minister dismissed the report for compromising on key sticking points that have paused the progress in the post-Brexit deal.

The U.K. rather expressed its desire to take control over access to its waters and fish after the transition period ends. U.K. showed disagreement to stick with the E.U.’s Common Fisheries Policy in which fishing quotas for E.U. member states are fixed.

The official spokesman of Prime Minister Boris Johnson said that the reports suggesting that the U.K. was ready to compromise on fishing and its waters were only “wishful thinking by E.U.” The remarks added to the growing concerns over the lack of progress on negotiations. The final round of detailed negotiations took effect from today, and results will be under close observation by British Pound traders. It should be noted that if both parties failed to secure a deal or agree on a point, it would demand an extension in the transition period. But Johnson has promised not to extend this period, which will lead to no-deal Brexit.

Boris Johnson has suggested the country would accept a no-deal Brexit if London and Brussels failed to agree on new trade rules by December 31.

On the economic data front, at 11; 00 GMT, the Nationwide HPI dropped to -1.7% against the expected drop by-1.0%. 

At 13:30 GMT, the Mortgage Approvals from the U.K. came in as 16K against the expected 34K and weighed on Pound. The Net Lending to Individuals came in negative as -6.9B against the expected 1.7B. A sharp fall in U.K. Mortgage approvals in April and House price suffering kept a lid on additional gains of GBP/USD.

Daily Support and Resistance

  • R3 1.2691
  • R2 1.2634
  • R1 1.2592

Pivot Point 1.2535

  • S1 1.2493
  • S2 1.2436
  • S3 1.2395

GBP/USD– Trading Tip

The GBP/USD continues trading bullish as it has violated the double top resistance area around 1.2545 level, and now it’s testing the upward channel, which extends resistance around 1.2603. Bullish crossover of 1.2603 level is now likely to extend the buying trend until 1.2690. While the support level stays at 1.2550 today. On the 4-hour timeframe, the 50 EMA is suggesting bullish bias, and now the MACD is suggesting buying trend in the GBP/USD pair as the histograms are forming above zero levels. Consider taking buying trades over 1.2605 and selling below the same level today.


USD/JPY – Daily Analysis

The USD/JPY pair was closed at 108.675 after placing a high of 108.770 and a low of 107.512. Overall the movement of USD/JPY remained bullish throughout the day. The pair USD/JPY moved beyond 108.00 level and extended its gains to the fresh seven weeks high of 108.77. The increased risk appetite caused the upbeat movement of USD/JPY after the easing of lockdown measures from across the globe, which raised optimism about the quick economic recovery.

Despite the broad-based U.S. dollar weakness, the pair USD/JPY took its pace on the upside due to underpinned demand for safe-haven Japanese Yen in the risk-on market sentiment. On the other hand, the U.S. Dollar Index, which measures the value of the U.S. dollar against the basket of six currencies, fell 0.30% around 97.5 level on Tuesday.

President Donald Trump vowed to use military action against the increasing protests near the White House, which raised fears for even more disruptive economy of the United States. The protests were against the killing of an unarmed black man George Floyd in police custody two weeks ago. Other than that, China halted the purchases of U.S. Soybeans and pork on Tuesday against U.S. decision to revoke the special status of Hong Kong, which increased the ongoing tensions between the world’s two largest economies. China’s move could also lead towards the cancellation of phase one trade deal, which both parties signed in January.

On the data front, there was no economic report released by the United States on Tuesday, which left the pair at the mercy of market risk sentiment, which eventually drove the pair to 7 weeks’ highest level.

However, on Japan front, at 4:50 GMT, the Monetary Base for the year from Japan was increased to 3.9% from the forecasted 2.6% and supported the Japanese Yen. Traders will be waiting for the U.S. response against the move by China to halting the purchases of U.S. agricultural goods.

Daily Support and Resistance    

  • R3 108.33
  • R2 108.1
  • R1 107.84

Pivot Point 107.61

  • S1 107.36
  • S2 107.12
  • S3 106.87

USD/JPY – Trading Tips

The USD/JPY bullish bias violated the series of resistance levels to lead the USD/JPY currency pair towards 108.770 level. The closings of bullish engulfing and three white soldiers candlestick patterns are likely to drive further buying until 109.125 level today. On the 4 hour timeframe, the USD/JPY pair has crossed over 50 EMA and has closed a few candles above resistance become support area of 108.350, which is supporting bullish bias among traders. The USD/JPY pair may find support at 108.350 and resistance at 109.125 level while the breakout of this range will determine the next trend in the pair. Today let’s consider buying over 108.35. All the best for today! 


Categories
Forex Price Action

The Daily-H4 Combination Trading: Do Not Only Look for Reversal Candle

The daily–H4 combination traders are to wait for the daily chart to produce a reversal candle first to look for entry. Once the chart produces a daily reversal candle, traders are to flip over to the H4 chart; wait for consolidation and an H4 reversal candle to trigger an entry. We must not forget that if the daily chart is trending, the daily-H4 combination trading strategy may offer entry as well. In today’s lesson, we are going to demonstrate an example of that.

This is a daily chart. The pair produced a bullish engulfing candle and three more bullish candles followed. The daily-H4 combination traders are to keep their eyes on the pair right after it produces that bullish engulfing candle. Let us assume on the fourth day, we flip over to the H4 chart as well.

This is how that H4 chart looks. The chart shows that after making a bullish move, the price starts having consolidation. The last candle comes out as a bearish pin bar. It seems the chart may take time to produce a bullish reversal candle to offer a long entry. Then again, we never know. It may be just around the corner.

The char produces a good-looking bullish engulfing candle closing well above consolidation resistance. The buyers may trigger a long entry right after the last candle closes by setting stop loss below consolidation support and by setting take profit with 1R. Let us move to the next chart to see how the trade goes.

The price consolidates again. After producing such a good-looking signal candle, it seems a bit unusual. The last candle has a bearish body but it has a long lower shadow. Be patient and see what the price does next.

Look at the last candle. It comes out as a bullish engulfing candle. This is a strong sign that the price may head towards the North now. As far as the last candle is concerned, the price may not take too long to hit the target.

As expected, the price heads towards the North with good bullish momentum. It produces only one bearish candle before hits the target. As it seems, a bearish inside bar followed by a bullish engulfing candle may push the price towards the North further. Anyway, the buyers have achieved their 1R here with ease.

The message we get from today’s lesson is that if the daily chart is trending, we may keep an eye on the H4 chart to take entries with the trend as well. If it produces a reversal candle, we may look for entries too. However, we must not look for short entries if the last daily candle is bullish and vice versa.

Categories
Forex Options

FX Options Market Combined Volume Expiries for 3rd June 2020

Thank you for visiting the Forex Academy FX Options market combined volume expiries section. Each day, where available, we will bring you notable maturities in FX Options of amounts of $100 million-plus, and where these large combined maturities at specified currency exchange rates often have a magnetic effect on price action, especially in the hours leading to their maturities, which happens daily at 10.00 AM Eastern time. This is because the big institutional players hedge their positions accordingly. Each option expiry should be considered ‘in-play’ with a good chance of a strike if labelled in red, still in play and a possible strike if labelled in orange and ‘out of play’ and an unlikely strike if labelled in blue, with regard to the likelihood of price action meeting the strike price at maturity.

…………………………………………………………………………………………………………………..

FX option expiries for June 3 NY cut at 10:00 Eastern Time, via DTCC, can be found below.

– EUR/USD: EUR amounts

  • 1.1100 667m
  • 1.1135 701m
  • 1.1175 805m
  • 1.1180 567m
  • 1.1210 770m
  • 1.1215 582m
  • 1.1220 597m


EURUSD pair is overbought on our one hour chart but remains well bid. There are several option maturities just above the key 1.12 level and with Eurozone and US data due over the next few hours expect a pullback before the 10 AM New York cut.

– GBP/USD: GBP amounts        

  • 1.2560 603m 


GBPUSD is approaching an area of resistance just above the key 1.26 level and the maturity at 1.2560 is large in size at £603M. UK and US data out before the cut. Expect a reversal in the current bullish price action.

– USD/JPY: USD amounts         

  • 108.06 446m
  • 108.50 445m
  • 108.70 355m


USDJPY is in a consolidation phase after the bull push during yesterday’s European session. US data out may well influence the next breakout from the current price range. The 2 red options at 108.70 and 108.50 will likely act as a magnet until then.

……………………………………………………………………………………………………………………..

As you can see on the charts we have also plotted the expiration levels at the various exchange rate maturities and we have also labelled in red, orange and blue. Therefore, if you see option expiry exchange rates labelled in red these should be considered in-play, because we believe there is a greater chance of the expiry maturing at these levels based on technical analysis at the time of writing. There is still a lesser possibility of a strike if they are in orange and so these are ‘in-play’ too. However, if we have labelled them in blue, they should be considered ‘not in-play’ and therefore price action would be unlikely to reach these levels, which are often referred to as Strikes, at the time of the 10 AM New York cut.

Our technical analysis is based on exchange rates which may be several hours earlier in the day and may not reflect price action at the time of the maturities. Also, we have not factored in economic data releases or keynote speeches by policymakers, or potential market volatility leading up to the cut.

Although we have added some technical analysis we suggest you take the levels and plot them onto your own trading charts and incorporate the information into your own trading methodology in order to use the information to your advantage.

Remember the higher the amount, the larger the gravitational pull towards the exchange rate maturity at 10:00 AM Eastern time.

If you want to learn how forex option expiries affect price action in the spot FX market see our educational article by clicking here: https://bit.ly/2VR2Nji

DISCLAIMER: Please note that this information is for educational purposes. Also, the maturities will look more or less likely to become a strike at 10 AM NY time due to exchange rate fluctuations resulting in a different perspective with regard to technical analysis, and also due to upcoming economic data releases for the associated pairs.

Categories
Forex Options

Expiry Options Weekly Review! How Forex Academy Is Helping Traders Profit!

FX Options Market Combined Volume Expiries. A weekly retrospective review

Hello everybody and thank you for joining us for the daily FX Options Market Combined
Volume Expiries review for the trading week ending on Friday 29th May 2020. Each week we will bring you a video taking a look back at the previous week’s FX option expiries and how they may have attributed to price action leading up to the maturities which happen at 10 a.m. Eastern Time, USA.

If it is your first time with us, the FX currency options market runs in tandem with the spot FX market, but where traders typically place Call and Put trades on the future value of a currency exchange rate and these futures contracts typically run from 1 day to weeks, or even months.


Each morning, from the FA website, our analyst, Kevin O’Sullivan, will bring you details of the notable FX Options Market Combined Volume Expiries, where they have an accumulative value of a minimum of $100M + and where quite often these institutional size expiries can act as a magnet for price action in the Spot FX arena leading up to the New York 10 a.m. cut, as the big institutional players hedge their positions accordingly.

Kevin also plots the expiration levels on to the relevant charts at the various expiry exchange rates and colour codes them in red, which would have a high degree of being reached, or orange which is still possible and where these are said to be in-play. He also labels other maturities in blue and where he deems it unlikely price action will be reached by 10 a.m. New York, and thus they should be considered ‘out of play.’ Kevin also adds some technical analysis to try and establish the likelihood of the option maturities being reached that day. These are known as strikes.
Please bear in mind that Kevin will not have factored in upcoming economic data releases, or policymaker speeches and that technical analysis may change in the hours leading up to the cut.
So let’s look at a few of last week’s option maturities to see if they affected price action.


So on Monday 25th, there were two maturities for the EURUSD pair with a red one at 1.0895 for €559M. And we can see that the technical analysis as provided by Kevin was, and I quote what he put on the website at around 8 a.m.: The EURUSD pair is in a bear channel but is oversold on our one hour chart. We should expect subdued price action due to a lack of market data out today and the fact that it is a public holiday in the UK and the USA. The option maturity at 1.0895 is currently in close proximity to the exchange rate, and we may see a pull-back to the level later in the session. However, at the moment, the bears are in control.


Now let’s turn to the one hour chart at 10 a.m. New York time. The pair was an official

Strike at 1.0895.
The second maturity was labelled in blue and was considered to be out of play.


On Tuesday 26th May, we brought you a couple of options expiries for EURUSD at 1.0900 and 1.0945, and this is the original price action and technical analysis chart where the pair had been trading at 1.0915 at the time Kevin wrote the analysis.


Now let’s take a look at the price action at the time of the New York cut. Price action continued as per the technical analysis throughout the European trading session and ended up at 1.0979, which was just 33 pips above the maturity of 1.0945. Options traders who bought a premium Put option for this expiry level would have been in the money.
Retail forex traders who had bought the pair during the European sessions based on Kevin’s analysis would have been in profit by over 63 pips.


On Wednesday 27th, there were two option maturities for the EURUSD pair. At the time of the cut, the FX exchange rate was 1.0986. This was just four pips away from the huge €1 B option at 1.0990


And here is the original analysis from Kevin at just after 8 a.m. BST. Pretty much spot on to what happened at the time of the cut.


There were three option expiries for USDJPY on Wednesday, and price action at around 8 a.m. suggested consolidation with a continuation to the downside. However, the 107.86 maturity was too much of a pull. The FX pair was at 107.83 at 10 a.m. New York time. That was just a few pips either way for the two maturities Kevin marked in orange.


We have a similar story with the AUDUSD pair on Wednesday, which had a large maturity at 0.6600 and where the FX exchange rate hit 0.652, which was just 17 pips shy of the maturity.


Of the notable option expiries for Thursday 28, we brought you one for USDJPY, where there was an expiry at 107.75, which was just one pip away from the exchange rate at the cut or 107.74. Remember, other brokers may be a pip out either side, in case this was as good as a strike.
We also had an expiry for the EURUSD pair at 1.0990 and 1.1020, and where the exchange rate at the cut was 1.1031. just 11 pips away from the latter.


On Friday 29th, we had an option at 107.50 for the USDJPY pair, which Kevin labeled in red, the maturity was just a couple of pips higher at the cut.


Several option expiries for the GBPUSD pair, but only one labeled in red at 1.2355 again, at the cut the exchange rate was just five pips short.

And the AUDUSD pair had a red maturity at 0.6650, and at the new york cut, the price was just 15 pips short.

Please remember, Kevin’s technical analysis is based on exchange rates, which may be several hours earlier in the day and may not reflect price action at the time of the maturities.
We suggest you get into the habit of visiting the FA website each morning just after 8 a.m. BST and take the levels and plot them onto your own trading charts and incorporate the information into your own trading methodology in order to use the information to your advantage.
Remember, the higher the amount, the larger the gravitational pull towards the exchange rate maturity at 10:00 a.m. Eastern time.
For a detailed explanation of FX options and how they affect price action in the spot forex market, please follow the link to our educational video.

Categories
Forex Price Action

The H1-15M Combination Trading: Waiting for an H1 Reversal Candle Ensures Better Reward

The H1 reversal candle plays a significant part in the H1-15M chart combination trading. If the traders wait to get an H1 reversal candle, by using candle’s lower low/higher high, they get a better risk-reward. In a bearish market, a trader needs to wait for an H1 bearish reversal candle after the breakout. In a bullish market, he needs to do the opposite. In today’s lesson, we are going to demonstrate an example of a bullish market where the H1-15M chart combination offers an entry upon producing an H1 bullish reversal candle. Let us get started.

This is an H1 chart. The chart shows that the price heads towards the North with good bullish momentum. The price, then upon finding its resistance, has been in a bearish correction. It consolidates around a level and heads towards the North. The buyers are to keep their eyes on the chart with a hope that it may make a bullish breakout.

The chart shows that the last candle makes a bullish breakout closing well above the last highest high. The buyers are to wait for the chart to produce an H1 bullish reversal candle followed by a 15M bullish candle to trigger a long entry. Let us keep watching the chart to get that H1 bullish reversal candle.

The chart shows that it produces two doji candles. It means the price has been in bearish correction at the minor charts. An H1 bullish reversal candle at the breakout level would be the ‘getting ready’ signal to go long in the pair.

Look at the last candle. The last candle comes out as a bullish candle forming at the breakout level. The buyers are waiting for the chart to produce such a candle. They may flip over to the 15M chart now. Let us flip over to the 15M chart.

The last candle comes out as a bearish inside bar. Since the H1 candle closes as a bullish candle, so a 15M bullish candle is the signal to trigger a long entry. Let us proceed to the next chart.

Here it is. The chart produces a bullish Pin Bar. The buyers may trigger a long entry right after the last candle closes. Traders may set their stop loss below the H1 bullish reversal candle’s lowest low, which is below the red-marked level. To set take profit, they may use Fibonacci levels. If the price trends from 61.8%, it usually goes up to the level of 161.8%. Let us find out how this one goes.

Yes, the price heads towards the level of 161.8% with good bullish momentum. If we flip over to the 15M chart right after the breakout, we would take entry by setting stop loss below 00.00%. By waiting for an H1 reversal candle, we may set the stop loss below 38.2%. This ensures a better risk-reward. On the other hand, if we always wait to get an H1 reversal candle after the breakout, we may not get it all the time. Thus, we end up being offered less number of entries in the H1-15M chart combination trading.


Categories
Forex Daily Topic Forex Fundamental Analysis

Importance Of ‘Government Spending’ & It’s Relative News Impact On The Forex Market

Introduction

Government Spending is an essential determinant of the economy’s growth. The portion of GDP that is allocated to Government Spending can primarily set the pace of economic growth. Increased Government Spending has been a critical lever to stimulate the economy during times of recession.

Government Spending numbers also determine whether the Government is elected by people next time or not. Hence, Government Spending numbers also can help or hurt the Government in elections. Thus, this can be considered a critical macroeconomic indicator for economists, analysts to predict upcoming trends.

What is Government Spending?

The Government Consumption Expenditures and Gross Investment are together, forming what is called Government Spending in general. Both of these are the final expenditures accounted for by the governing sector. Government Consumption Expenditures contains Spending by the governing body to produce and provide goods and services to the public. Expenditures would typically include National Defense and Public School Educations, etc.

Gross Investments includes the Spending by Government for fixed assets that directly benefit the general public. Investments can consist of road construction, public transports, or procuring military equipment. Hence, overall Government Spending refers to the money spent on the acquisition of goods and services such as education, health, social protection, and defense. When the Government procures products and services for current use to directly benefit an individual or collective requirements of the community, it is called Government final consumption spending. When the same is done for future use, it is classified as Government investment.

Government Spending assists businesses and people economically in many ways. Unemployment compensation, Child Nutrition, Student Loans, retirement and disability programs, etc. all are facilitated out of Government’s revenue. During the time of recession or economic contractions, the Government increases its Spending and decreasing tax rates to stimulate the economy and vice-versa.

There are four primary sources for Government Spending:

  • Tax Receipts
  • Indirect Taxes
  • Money borrowing from citizens (ex: government bonds)
  • Money borrowing from foreign (ex: Loans from World Bank)

How can the Government Spending numbers be used for analysis?

The main factors that affect Government Spending are:

Mandatory Programs: In the United States, necessary programs like Social Security, Medicaid, and Medicare make up about two-thirds of federal expenses. As more baby-boomers reach retirement age, the increase in all the above costs puts weight on Government that affects its spending capability. These kinds of payments where there is no exchange of goods and services in return are classified as Transfer Payments Spending.

National Debt and Interest bills: The United States currently has a record-high debt level of 22 trillion US dollars, which, when taken as a percentage of GDP, exceeds a hundred percent. What this means is that the National Debt is greater than the revenue it generates. Even if the entire GDP were allocated to service debt hypothetically, it would still not suffice. Such skyrocketed debt levels have put the country in between a rock and a hard place. The United States must keep the interest rates low to be able to continue paying its interests to avoid the risk of default.

Defaulting on the debt could be catastrophic for the nation and can lead to economic collapse. Increased deficit spending (Spending beyond budget) to stimulate the economy during times of recessions and bearing expenses of war and international contingency operations all have piled on the debt burden further.

Discretionary Spending: For the above two categories, the Government has no choice but to spend, but Discretionary Spending is for everything else. The Government decides how much money is to allocate to programs. Cutting back majorly on these can hurt the governing bodies in the next elections. Increased Discretionary Spendings can help in the short-run, but in the long run, all these will catch up, and consequences can be severe.

GDP: The revenue itself is an essential factor; decreased GDP rates can create deflationary situations that the Government tries to avoid in all conditions. Increased productivity and stimulations that result in higher prints in GDP can help service debts and still have enough resources to spend on economic activities freely. Increased taxes can help build up revenue for the Government but can lead to losing elections as the public might vote them out for imposing higher taxes. The Governments have increasingly relied on deficit spending to boost economic growth as indicative of the below graph.

Impact on Currency

By relative comparison with previous years, what policymakers have decided to spend on can determine many local level and national level economic impacts. Cutting back on certain sections can lead to slowdowns in that sector and vice-versa. Investors and Economists use this to predict economic trends.

In general, a relative increase in Government Spending is good for the economy. This indicator is typically expressed as a percentage of GDP, signifying how many portions of the total revenue Government has prioritized over debt servicing to stimulate growth. Government Spending for a given business cycle will decide the economy’s inflationary or deflationary conditions. When the economy is growing at a faster pace than the targeted rate, the Government can cut back on Spending and service their debts, or increase taxes to stabilize and vice-versa.

In this sense, Government Spending is a proportional indicator, the more, the better for the economy. It is a lagging indicator, as it is usually reactionary to situations in the marketplace and not an initiative effort. Government Spending is a lever used generally to fix an issue that already has happened (hyperinflation or deflation), hence has a lower impact on the long-term market volatility in the world of trading markets, although there may be some panic trading due to press releases.

Economic Reports

The Bureau of Economic Analysis releases quarterly reports on Government Receipts and Expenditures, which contains the Spending on different sectors, on their official website.

The Organisation for Economic Co-operation and Development also releases quarterly estimates of the associated countries on their official websites under the category of General Government Spending in two varieties: Government Spending per Capita and Government Spending as a percentage of its GDP.

Sources of Government Spending

The United States Bureau of Economic Analysis reports are available here:

The General Government Spending details are available for OECD countries on their official website here

Quarterly Government Spending reports of the United States Government can be found here categorically.

Below is a comparative index for countries – Government Spending as a percentage of GDP. Government Spending as a percentage of GDP – Trading Economics

Impact of the ‘Government Spending’ news release on the price charts

We understood in the previous section of the article that Government Spending refers to the money spent by the public sector for purchasing goods and providing essential services such as education, healthcare, social protection, and security. The two major categories of Spending include Current Spending and Capital Spending.

Government Spending ensures that the country is having basic facilities such as roads, bridges, hospitals, schools, and other allowances such as unemployment and disability benefits. Hence public sector spending plays a crucial part in the economic growth of a country. If Government Spending of a country is high, it also attracts foreign investment and other capital flows. Thus, the greater the Government spends, the greater will be the growth of the currency.

Today we will be discussing the impact of the news release on various currency pairs and examine the change in volatility before and after the release. For this, we have collected the latest Government Spending data of Australia, where the below image shows the quarter-on-quarter numbers of the same. The latest figures show an increase in Government Spending for the December quarter compared to the previous quarter.

AUD/USD | Before the announcement:

The first currency pair we will be discussing is the AUD/USD pair, where, in the above image, we see that the market is on the verge of continuing its uptrend after an appropriate retracement. At this point, if the Government Spending comes out to be positive for the Australian economy, we can expect the price to rise at least the recent ‘high.’ But if it were to be negative, we can expect a short-term reversal in the market.

AUD/USD | After the announcement:

Looking at the chart above, we can say that the market reacted positively to the news announcement and the price closed as a bullish candle. The bullishness in currency is due to the encouraging Government Spending data, which showed an increase in expenditure from the previous quarter. The upbeat data created cheer among traders, which made them go ‘long’ in the currency pair and buy more Australian dollars. One can ‘buy’ the currency pair after the news release after seeing that the data was better than last time.

EUR/AUD | Before the announcement:

EUR/AUD | After the announcement:

The above images represent the EUR/AUD currency pair, and as we can see, the overall trend and here too market seems to be continuing its downtrend after an appropriate retracement. Since the Australian dollar is on the right-hand side, a downtrend shows strength in the currency. Aggressive traders can take go ‘short’ in the currency pair before the news announcement as the trend shows an increase in the Government Spending from quarter-on-quarter. Remember that the stop loss should be kept higher than the recent ‘high’ due to increased volatility during the announcement.

After the numbers are released, volatility increases on the downside, and the price closes as a bearish candle, indicating selling pressure in the market. This is due to better than expected Government Spending data, which was higher than last time, and thus the market suddenly goes lower. One can go ‘short’ in the currency pair after analyzing the outcome of the data, with a stop loss above the recent ‘high.’

AUD/USD | Before the announcement:

AUD/USD | After the announcement:

Lastly, we find out the impact of the news on AUD/JPY currency pair, where we, in the first image we see that the market is range-bound and just before the announcement the price is at the ‘resistance’ of the range. This means we could expect sellers to become active at this point. However, the reaction depends on the Government Spending data, which can cause spikes on either side of the market. A ‘buy’ is also not recommended as the market is not in an uptrend.

After the news is announced, we witness a similar impact where the price goes higher and closes as a bullish candle. The positive news outcome and an increase in volatility to the upside is the ideal trade setup for going ‘long’ in the market. Thus, one can buy the currency pair with a stop loss below the support and a higher ‘take-profit.’

That’s about ‘Government Spending’ and its impact on the Forex market after its news release. If you have any questions, please let us know in the comments below. Good luck!

Categories
Forex Market Analysis

Daily F.X. Analysis, June 2 – Top Trade Setups In Forex – Risk Sentiment Remains Mixed!
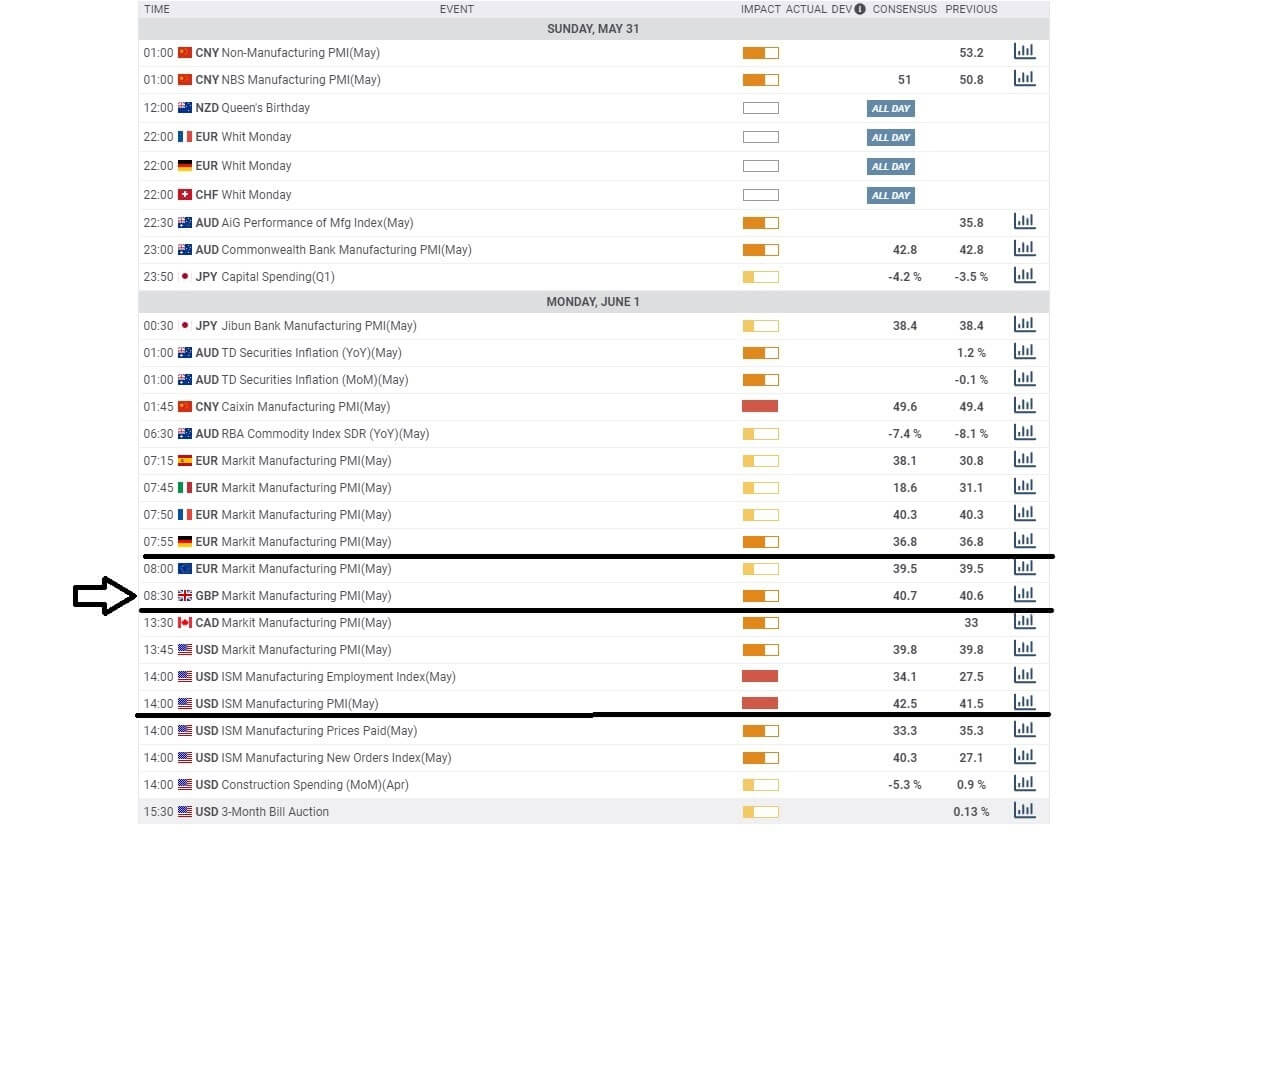
The U.S. dollar after this lost demand in the market and Wall Street’s main indexes started to move in positive territory. The U.S. Dollar Index dropped below 98, which further pushed the rising prices of EUR/USD pair on Monday.

On the news side, the economic calendar isn’t likely to have any high impact on economic events. Therefore, the market will wait for ADP figures tomorrow and NFP figures by the end of the week.

Economic Events to Watch Today


EUR/USD – Daily Analysis

The EUR/USD pair was closed at 1.11337 after placing a high of 1.11539 and a low of 1.11003. Overall the movement of the EUR/USD pair remained bullish throughout the day. On Monday, the EUR/USD pair rose for the 6th consecutive day, extended its previous day gains, and moved above 1.11500 level, which was highest since March 17.

Most major European markets were closed due to Whit Monday, which limited the trading activity for a large part of the day. Data from the United States showed that ISM Manufacturing PMI in May came in worse than expectations and weighed on the U.S. dollar. The ISM Manufacturing PMI was expected to rise by 43.6pints, but instead, it came as 43.1.

The U.S. dollar after this lost demand in the market and Wall Street’s main indexes started to move in positive territory. The U.S. Dollar Index dropped below 98, which further pushed the rising prices of EUR/USD pair on Monday.

The European Commission has approved Latvia’s support program to support tourism operators worth 800,000 euros. The tourism operators cover travelers’ repatriation costs in the context of the coronavirus outbreak. The Latvia support program was approved on March 19 and was amended on April 3 and May 8.

Furthermore, the European Commission also launched a dialogue initiative with the financial sector. The first roundtable meeting between the European Commission and the European financial sector, including business and consumer representatives, has launched. This meeting was conducted to find out the best practices to support E.U. citizens & businesses.

At the data front, at 12:15 GMT, the Spanish Manufacturing PMI came in line with the expectations of 38.3. The Italian Manufacturing PMI at 12:45 GMT exceeded the expectations of 35.5 and came in as 45.4.

Daily Support and Resistance

  • R3 1.122
  • R2 1.1187
  • R1 1.1161

Pivot Point 1.1128

  • S1 1.1101
  • S2 1.1069
  • S3 1.1042

EUR/USD– Trading Tip

The bullish bias of the EUR/USD continues to prevail in the market as the EUR/USD is heading north towards the next target level of 1.1150 level. A bullish breakout of 1.1150 level may lead the pair towards 1.1220 level today while support holds around 1.1080 level. Bullish bias seems dominant today. Consider taking buying trades over 1.1140 level to target 1.1199. 


GBP/USD – Daily Analysis

The GBP/USD was closed at 1.24884 after placing a high of 1.25064 and a low of 1.23236. Overall the movement of GBP/USD pair remained bullish throughout the day. The British Pound rose to near one month high against the U.S. dollar on Monday, ahead of Brexit talks, which are scheduled on Tuesday. Market participants are cautious and fear that the U.K. and E.U. might fail to make progress on upcoming trade talks. Sterling rose above 1.2500 level, which is its highest since May 5.

The chances for any real progress in negotiations between the E.U. and U.K. are very low, and that is why GBP/USD was raised on Monday on the back of increased risk sentiment. Time for agreeing to extend the transition period by June 30 deadline is running out when the U.K. had already denied extending the transition period, the risk for no-deal Brexit increased and made investors cautious.

Market participants are buying Sterling with hope for failure in the next round of talks and catching big moves on Tuesday, and this large buying on Monday gave a push to GBP/USD pair. No-deal Brexit would further harm the already disturbed economy of Great Britain due to the coronavirus crisis, and it would make the recovery even more difficult.

Some market participants think that the increased economic growth concerns have made Britain’s bargaining power a little less, and they are waiting to place any big move. 

On the data front, at 13:30 GMT, The Final Manufacturing PMI from Britain in the month of May came in line with the expectations of 40.7. The U.S. dollar was weak across the board due to the poor-than-expected ISM Manufacturing PMI release, which came in short of expected 43.5 as 43.1 and weighed on the U.S. dollar. The weak U.S. dollar further added in the upward trend of GBP/USD on Monday.

Daily Support and Resistance

  • R3 1.2744
  • R2 1.2626
  • R1 1.256

Pivot Point 1.2441

  • S1 1.2375
  • S2 1.2256
  • S3 1.219

GBP/USD– Trading Tip

The GBP/USD continues trading bullish as it has violated the double top resistance area around 1.2545 level. Bullish crossover of this level is now likely to extend the buying trend until 1.2600, but on the way, the upward channel’s upward trendline is expected to provide resistance around 1.2560, while the support level stays at 1.2480 today. On the 4-hour timeframe, the 50 EMA is suggesting bullish bias, and now the MACD is suggesting buying trend in the GBP/USD pair as the histograms are forming above zero levels. Consider taking buying trades over 1.2510 and selling below the same level today.


USD/JPY – Daily Analysis

The USD/JPY was closed at 107.587 after placing a high of 107.855 and a low of 107.376. Overall the movement of USD/JPY remained bearish throughout the day. The pair USD/JPY started its week on the back foot as the U.S. dollar faced pressure due to increased protests across the U.S. The U.S. Dollar Index extended its losses and moved below the handle of 98.

Thousands of protesters came out to the streets of cities around the U.S. despite curfew orders on Monday. The protests were against the killing of George Floyd, a black man in police custody. Angry protests continued nationwide a week after George Floyd’s death. Reports of looting, destruction, and firing came in from across the cities. On Monday, police used tear gas to clear a path for Donald Trump to visit a damaged church. Thousands of arrests have been made, and five deaths and millions of dollars in property damage were reported, which made investors sell the U.S. dollar, and hence, the U.S. dollar became weak across the board.

On the US-China front, the news conference of Donald Trump failed to entertain the hopes of new sanctions on China on Friday. Trump refrained from imposing new sanctions on China against the new security law on Hong Kong rather than announced to halt the U.S. relationship with WHO.

The threats of revoking phase-one trade deal, which was signed in January, are increasing day by day with the increasing tensions between China & the United States.

On the data front, at 4:50 GMT, the Capital Spending for the quarter from Japan was increased by 4.3% against the declined forecast of 5.1% and gave strength to JPY. At 5:30 GMT, the Final Manufacturing PMI for May came in line with the expectations of 38.4 from Japan. The stronger than expected data from Japan gave strength to the Japanese Yen and added in the downward pressure of the USD/JPY pair.

At 18:45 GMT, the Final Manufacturing PMI for May came in line with the expectations of 39.8. At 19:00 GMT, the closely watched ISM Manufacturing PMI fell short of expected 43.5 and released as 43.1 and weighed on the U.S. dollar.

The Construction Spending for the month fell less than expected -6.5% as -2.9% and supported the U.S. dollar. The ISM Manufacturing Prices rose to 40.8against the 40.0 of expectations and supported the U.S. dollar.

The closely watched and long-awaited ISM Manufacturing PMI fell short of expectations and weighed on the U.S. dollar resulted in a downward trend of USD/JPY at the starting day of the week.

Daily Support and Resistance    

  • R3 108.33
  • R2 108.1
  • R1 107.84

Pivot Point 107.61

  • S1 107.36
  • S2 107.12
  • S3 106.87

USD/JPY – Trading Tips

On Tuesday, the USD/JPY pair continues to trade sideways, maintaining the same trading range of 107.950 – 107.400. On the 4 hour timeframe, the USD/JPY pair has crossed below 50 EMA and has also formed a bearish engulfing candle supporting bullish bias among traders. The USD/JPY pair may find support at 107.425 and resistance at 107.900 level while the breakout of this range will determine the next trend in the pair. Today let’s consider buying over 107.400 and resistance around 107.900. All the best for today! 
 

Categories
Forex Options

FX Options Market Combined Volume Expiries for 2nd June 2020

Thank you for visiting the Forex Academy FX Options market combined volume expiries section. Each day, where available, we will bring you notable maturities in FX Options of amounts of $100 million-plus, and where these large combined maturities at specified currency exchange rates often have a magnetic effect on price action, especially in the hours leading to their maturities, which happens daily at 10.00 AM Eastern time. This is because the big institutional players hedge their positions accordingly. Each option expiry should be considered ‘in-play’ with a good chance of a strike if labelled in red, still in play and a possible strike if labelled in orange and ‘out of play’ and an unlikely strike if labelled in blue, with regard to the likelihood of price action meeting the strike price at maturity.

…………………………………………………………………………………………………………………..

FX option expiries for June 2 NY cut at 10:00 Eastern Time, via DTCC, can be found below.

– EUR/USD: EUR amounts

  • 1.1010 1.0bn
  • 1.1100 1.1bn


EURUSD price action is muted and caught in a wedge shape. The break out from here will add impetus for the next trend. The 1.1100 maturity is in play.

– NZD/USD: NZD amounts

  • 0.6280 229m

NZDUSD the recent bull run has stalled and the pair is in a bear channel on our one hour chart. The 0.6280 maturity remains in play as the pair is showing signs of being oversold.


– EUR/GBP: EUR amounts

  • 0.8985 425m


EURGBP pair is in a bear trend with the Pound showing strength across the board. The maturity is out of play.

……………………………………………………………………………………………………………………..

As you can see on the charts we have also plotted the expiration levels at the various exchange rate maturities and we have also labelled in red, orange and blue. Therefore, if you see option expiry exchange rates labelled in red these should be considered in-play, because we believe there is a greater chance of the expiry maturing at these levels based on technical analysis at the time of writing. There is still a lesser possibility of a strike if they are in orange and so these are ‘in-play’ too. However, if we have labelled them in blue, they should be considered ‘not in-play’ and therefore price action would be unlikely to reach these levels, which are often referred to as Strikes, at the time of the 10 AM New York cut.

Our technical analysis is based on exchange rates which may be several hours earlier in the day and may not reflect price action at the time of the maturities. Also, we have not factored in economic data releases or keynote speeches by policymakers, or potential market volatility leading up to the cut.

Although we have added some technical analysis we suggest you take the levels and plot them onto your own trading charts and incorporate the information into your own trading methodology in order to use the information to your advantage.

Remember the higher the amount, the larger the gravitational pull towards the exchange rate maturity at 10:00 AM Eastern time.

If you want to learn how forex option expiries affect price action in the spot FX market see our educational article by clicking here: https://bit.ly/2VR2Nji

DISCLAIMER: Please note that this information is for educational purposes. Also, the maturities will look more or less likely to become a strike at 10 AM NY time due to exchange rate fluctuations resulting in a different perspective with regard to technical analysis, and also due to upcoming economic data releases for the associated pairs.

Categories
Forex Assets

AUD/HRK – Analyzing The Costs Involved While Trading This Exotic Pair

Introduction

The abbreviation of AUD/HRK is Australian Dollar, paired with the Croatian Kuna. Here AUD is the official currency of Australia and is also the fifth most traded currency in the Foreign Exchange market. In contrast, HRK stands for the Kuna, and it is the official currency of Croatia. The Croatian National Bank issues this currency.

Understanding AUD/HRK

In the Forex market, to determine the relative value of one currency, we need another currency to compare. Here, when we buy a currency, which is known as the base currency and simultaneously sell the quote currency. The market value of AUD/HRK helps us to understand the strength of HRK against the AUD. So if the exchange rate for the pair AUD/HRK is 4.5571, it means to buy 1 AUD, we need 4.5571 HRK.

Spread

A spread is defined as the difference between the purchasing & selling price of a Forex pair. In simple words, it is the difference between the bid price and the ask price of an asset. Below is the spread charges for ECN and STP brokers for AUD/HRK pair.

ECN: 40 pips | STP: 43 pips

Fees

A Fee is the charges that we traders pay to the broker for executing a trade. Fees to a much depend on the type of broker(STP/ECN) we use.

Slippage

When we want to execute a trade at a particular market rate, but instead, the trade gets executed at a different rate, and that is because of the slippage. Slippage occurs when we counter a volatile market, and when we execute a large order at the same time.

Trading Range in AUD/HRK

The trading range here will determine the amount of money we will win or lose in a given amount of time. In the below table, we have the representation of the minimum, average, and maximum pip movement in a currency pair. Here we will use the ATR indicator that indicates the price movement in a currency pair. We will evaluate it merely by using it with 200-period SMA.

Procedure to assess Pip Ranges

  1. Add the ATR indicator to your chart
  2. Set the period to 1
  3. Add a 200-period SMA to this indicator
  4. Shrink the chart so you can assess a significant period
  5. Select your desired timeframe
  6. Measure the floor level and set this value as the min
  7. Measure the level of the 200-period SMA and set this as the average
  8. Measure the peak levels and set this as Max.

AUD/HRK Cost as a Percent of the Trading Range

The cost of trade depends on the broker type and varies based on the volatility of the market. The overall cost of trade includes spread, fees, and sometimes slippage if the volatility is more. To decrease the cost of the trade, we can use limit orders instead of market execution.

ECN Model Account

Spread = 40 | Slippage = 3 |Trading fee = 5

Total cost = Slippage + Spread + Trading Fee = 3 + 40 + 5 = 48

STP Model Account

Spread = 43| Slippage = 3 | Trading fee = 0

Total cost = Slippage + Spread + Trading Fee = 3 + 43 + 0 = 46

Trading the AUD/HRK

AUD/HRK is an exotic currency pair. As we can see, the average pip movement in 1hr is 133, which implies higher volatility. The higher the volatility, the higher is the risk and lower is the cost of the trade and vice versa. Taking an example, we can see from the trading range that when the pip movement is lower, the charge is high, and when the pip movement is high, the charge is low.

To reduce our costs of trade, we may place trades using limit orders instead of market orders. In the below table, we will see the representation of the cost percentages when limit orders are used. As we can see, the cost of slippage is zero. In doing so, the slippage will not be included in the calculation of the total costs. And this will help us in reducing the trading cost by a considerable margin. An example of the same is given below.

ECN Model Account (Using Limit Orders)

Spread = 40 | Slippage = 0 |Trading fee = 5

Total cost = Slippage + Spread + Trading Fee = 0 + 40 + 5 = 45

Categories
Forex Videos

Using CPI Data To Increase Your Win Ratio In Forex

Fundamental Analysis For Novices Consumer Price Index (CPI)

Consumer Price Index (CPI) measures the changes in the price of goods and services
purchased by consumers.
Each month the data is released into the financial market by the various economic and not for profit organizations. In Germany, for example, the information is provided by the Federal Statistical Office, Germany.
So what is the Consumer Price Index, which is also referred to as CPI?


This is what you would expect to see on your calendar. The section highlighted is for the Germany CPI figure. The data is the average price measurement change for all goods and services which were bought by households in any given country, in this case, Germany, for consumption purposes.
CPI is considered to be very important because it is the main indicator to measure inflation and fluctuations in buying trends. The higher the unit measurement reading, the more it is considered positive (or Bullish) for the Euro, and if the unit measurement is a low reading, it is considered negative (or bearish).


Here we can see that the data has been added after the embargo release.


We simply follow the corresponding data to the event log at the top of the page, and we can see the actual released number, in this case, 0.6%, and do the same across the data field to see what the previous release was and also what the market expected. When the released data falls out of line with market expectations, you might find extra volatility kicking in to the Euro currency as traders adjust their trading books accordingly.


In the case of the Eurozone of which Germany is a member state, the information is also added to the Eurozone CPI in which is called the Harmonized Index for Consumer Price Index, or HICP.

This information is collated by the Statistics Office of the European Union and is released at the same time as one of the member states’ data but after all member states have reported.
The cumulative effect or the HIPC is then used by the governing council of the Eurozone area to define and assess overall price stability as a whole. When trading this data, look for inconsistencies in the consensus and the actual figure. An unexpected lower number would be seen as bad for the Euro while the opposite applies for a higher than expected number.

Categories
Forex Daily Topic Forex Price Action

The Levels You Need to Pay Extra Attention

Support and Resistance are the two key factors of Forex trading. The good thing is in most cases time these levels can be guessed well earlier. By drawing support/resistance levels where the price reacts earlier,   we can spot those levels. This helps a trader set his stop loss, take profit and make a trading decision. In today’s lesson, we are going to demonstrate an example of how the previous levels where the price reacts earlier play a significant part as far as support/resistance is concerned.

Look at the chart carefully. The price makes a strong bearish move and makes an upside correction. The chart produces a spinning top followed by a bearish engulfing candle. If we consider the existent trend and candlestick pattern, it is a short signal. The question is whether it really is a short signal or not. Look at the next chart.

At the correction, one of the candles breaches through a level. This level was a level of support earlier. After being bearish, the level should work as a level of resistance. It does not. The price breaches through the level. In fact, it may work as a level of support again. If it produces a bullish reversal candle, the buyers are going to take control here.

The level seems to hold the price as a level of support. It produces two a bullish pin bar and a doji candle. If it produces a bullish engulfing candle here, the price may get bullish and head towards the North.

The chart produces a bullish engulfing candle closing well above the wave’s highest high. Let us calculate whether the buyers should go long here or not. The price makes a bullish move breaching a significant level. The price makes a bearish correction and the breakout level works as a level of support. As far as price action trading is concerned, traders may trigger a long entry right after the last candle closes.

As expected, the price heads towards the North with good bullish momentum. It gets the buyers 1R already. The last candle comes out as a bearish inside bar. The price may reverse now. However, there is still a 40% possibility that the price continues its bullish move. Let us assume that the buyers close the trade and cash in some profit.

If we consider the whole scenario, the market seems bearish in naked eyes. When we draw the significant level, it gives us a clearer picture of the breakout and correction. We, then realize that the market is actually bullish. A long entry at the pullback gets the buyers some green pips. This is what Support and Resistance (significant levels) do.

Categories
Forex Psychology

Do Not Let Your Losing Trade Chase You

Trading depends a lot on a trader’s mindset. It does not matter theoretically how strong a trader is. If he does not know how to deal with trading pressure accordingly, he will never be a successful trader. One of the biggest issues in trading is encountering losing trades. It diverts the traders’ mindset, which makes him make more mistakes and lose money in the end. We mostly choose winning trade setup in our trading lessons. However, we sometimes chose a trade setup that encounters a loss as a part of our trading psychology lesson. In today’s lesson, we are going to demonstrate a losing trade.

This is a daily chart. The price heads towards the North upon producing a C point. Look at the last candle. It comes out as a bearish engulfing candle producing right at the level, where the price had a rejection earlier. The H4-daily combination traders may flip over to the H4 chart to go short in the pair.

This is the H4 chart. The chart shows that the price heads towards the North with good bearish momentum. The sellers are to wait for the price to consolidate and produce a bearish engulfing candle to go short in the pair.

The chart produces a bullish inside bar. It seems that the chart may produce a short signal for the sellers soon. The H4-daily combination sellers must keep their eyes on the chart.

The last candle comes out as a bearish engulfing candle closing well below consolidation support. The sellers may trigger a short entry right after the candle closes. This looks like an A+ trade setup. It seems that the sellers do not have to wait too long to earn their profit.

Things do not go according to the sellers’ expectations. The chart produces a spinning top followed by a bullish engulfing candle. Some sellers may want to close their entry with some losses here. Let us assume that we let our trade run. Then, here comes the last candle. It looks good for the sellers again.

The chart produces a bullish engulfing candle again. This must be annoying for the sellers. Let us assume that we keep holding the position with the hope that it goes towards the South and hits Take Profit.

It does not. It hits Stop Loss instead. An A+ entry ends up being a losing trade. If you keep thinking about a losing trade (with your proven strategy) and do not look to find out new entry, it means a losing trade chases you much more than it should. You really have to find out a way to avoid it.

Categories
Forex Price Action

The H4-Daily Combination Strategy: Do not Get Carried Away

In today’s lesson, we are going to demonstrate an example of an H4-daily chart combination trading. The lesson has an important message to remember for the H4-Daily combination traders. Let us get started.

The chart shows that the price produces a double top and heads towards the South with good bearish momentum. The daily candle closes as a bearish Marubozu candle having no lower shadow at all. The next trading day starts with a Spinning Top. It seems that the H4 chart starts having consolidation. The last H4 candle comes out as a bullish engulfing candle. This looks good for the sellers that the price is having consolidation after making a good bearish move. However, the H4-Daily combination traders must not forget one thing that the signal is to be produced within the next two candles. Otherwise, it becomes daily support.

The fifth H4 candle of the day comes out as a bearish engulfing candle. The candle closes well below consolidation support. The sellers may trigger a short entry right after the last candle closes by setting stop-loss above consolidation resistance and by setting take profit with 1R.

The next candle comes out as a bullish inside bar after triggering the entry. The sellers would love to get a long bearish candle here. However, a bullish inside bar suggests that the bear still holds the key. Let us proceed to the next chart.

The next candle comes out as a bearish engulfing candle. This looks extremely good for the sellers now. The price finds another resistance. This attracts sellers to add more short positions. Anyway, the H4-Daily combination traders are to wait for the price to hit their 1R take profit.

The price takes two more candles to hit the target. I would say that the price hits the target at a moderate pace here. Anyway, the H4-Daily combination strategy offers entry, and the trade setup works well for the sellers.

The message this lesson has is that we must not get carried away with bullish or bearish move followed by consolidation. The H4 chart is to produce a trade signal within the next day. If it does not, that chart does not belong to the H4-Daily combination trading strategy.  If it does, then the H4-Daily combination traders may trigger an entry.

Categories
Forex Market Analysis

Daily F.X. Analysis, June 01 – Top Trade Setups In Forex – ISM Manufacturing PMI In Highlights

On Monday, the fundamentals side is likely to drive no major movement during the European session. Still, the U.S. session may offer some price action on the release of ISM manufacturing PMI figures today.

Economic Events to Watch Today


EUR/USD – Daily Analysis

The EUR/USD pair was closed at 1.11032 after placing a high of 1.11450 and a low of 1.10676. Overall the movement of the EUR/USD pair remained bullish throughout the day. The EUR/USD continued its previous trend and finally crossed above 1.11 level on Friday and rose for the 5th consecutive day this week. The pair showed the longest run since late March at the end of this week on the back of Euro’s strength.

At 11:00 GMT, the German Import Prices for April were released as -1.8% against the -1.5% forecasted and weighed on Euro. The German Retail Sales dropped less than expected 12% as5.3% in April and supported single currency Euro. At 11:45 GMT, the French Consumer Spending for April was declined by 20.2% against the forecasted 14.5% and weighed on Euro. The French Prelim CPI for May dropped by0.05 from the expected drop of 0.1% and weighed on Euro.

However, the French Prelim GDP for the quarter dropped less than the expectations of 5.8% decline and came in as 5.3% and supported shared currency Euro. At 13:00GMT, the M3 Money Supply for the whole bloc surged to 8.3% from the forecasted 8.1% and supported Euro.

The Private Loans from the whole bloc for the year dropped to 3.0%from the forecasted 3.5%. At 14:00 GMT, the CPI Flash estimate for the year for the whole Eurozone came in line with the expectations of 0.1%.  

However, the Core CLPI Flash estimate of the whole bloc for the year increased to 0.9% from the expected 08% and supported Euro. The Italian CPI for May came in line with the expectations of -0.1%.

Better than expected GDP and CPI data from Eurozone gave strength to the Euro against the U.S. dollar and supported the upward trend of EUR/USD pair on Friday.

On the other hand, the United States’ economic data was gloomy and weighed on the U.S. dollar, which added in the upward movement of EUR/USD pair. At 17:30 GMT, the Core PCE Price Index for April was dropped more than the expected -0.3% as -0.4% and weighed on the U.S. dollar. Personal Spending also declined more than expectations of 12.6% decline as 13.6% in April and weighed on the U.S. dollar. The Goods Trade Balance for April showed a deficit of 69.7B against the forecasted deficit of 64.8B and weighed on the U.S. dollar. The Prelim Wholesale Inventories for April surged to 0.4% from the expected -0.5% and added in U.S. dollar weakness.

The Chicago PMI at 18:45 GMT came in as 32.3 points against 40.1 of expectations and weighed the U.S. dollar. The Revised Consumer Sentiment from the University of Michigan for May dropped to 72.3 from the expected 73.7 and weighed on the U.S. dollar. The Revised Inflation Expectations from the University of Michigan for May were reported as 3.2% from the previous 3.0%.


Daily Support and Resistance

  • R3 1.1158
  • R2 1.1141
  • R1 1.1129

Pivot Point 1.1113

  • S1 1.1101
  • S2 1.1085
  • S3 1.1073

EUR/USD– Trading Tip

The bullish bias of the EUR/USD continues to prevail in the market as the EUR/USD is heading north towards the next target level of 1.1150 level. A bullish breakout of 1.1150 level may lead the pair towards 1.1220 level today while support holds around 1.1080 level. Bullish bias seems dominant today. Consider taking buying trades over 1.1140 level to target 1.1199. 


GBP/USD – Daily Analysis

The GBP/USD pair was closed at 1.23459 after placing a high of1.23940 and a low of 1.22902. Overall the movement of GBP/USD pair remained bullish throughout the day. The pair GBP/USD reached above its two-week high level on Friday near 1.2400 level but could not stay there and dropped back to 1.2300 level. The drop in sterling was caused by the awaiting speech of U.S. President Donald Trump.

Sterling started its day on firm tone and extended its previous day’s gains on the back of broad-based U.S. dollar weakness due to poor than expected U.S. economic data release. The decline in U.S. Treasury bond yields also added to the fault of the U.S. dollar. The Chicago PMI for May dropped to 32.3 from the expected 40.1 and weighed on the U.S. dollar. The Revised Consumer Sentiment from the University of Michigan for May also dropped to 72.3 against the expected 73.7 and added negative pressure on USD.

Other than economic data, the comments from Fed Chair Jerome Powell also exerted pressure on the U.S. dollar. Powell said that the U.S. economy had crossed many red lines that had never crossed before. He also stated that the Fed was launching Main Street Lending Program, which had not used since the Great Depression. After these comments, the GBP/USD pair started to move upward.

Investors became cautious before U.S. President Donald Trump’s speech on Friday and started selling Sterling, who made the pair lose its early daily gains. However, after his speech, the pair continued its bullish trend and ended its day with a bullish candle. The heat between China and the United States was enhanced after the strong response from U.S. President Donald Trump over the new security bill in Hong Kong by China, which was highly awaited as Trump had announced it before earlier this week.

Daily Support and Resistance

  • R3 1.2388
  • R2 1.2371
  • R1 1.2358

Pivot Point 1.2341

  • S1 1.2328
  • S2 1.2311
  • S3 1.2298

GBP/USD– Trading Tip

The GBP/USD continues trading bullish as it has violated the double top resistance area around 1.2364 level. Bullish crossover of this level is now likely to extend the buying trend until 1.2458, but on the way, the upward channel’s upward trendline is likely to provide resistance around 1.2410, while the support level stays at 1.2370 today. 

On the 4-hour timeframe, the 50 EMA is suggesting bullish bias, and now the MACD is suggesting buying trend in the GBP/USD pair as the histograms are forming above zero levels. Consider taking buying trades over 1.2370 and selling below the same level today.


USD/JPY – Daily Analysis

The USD/JPY was closed at 107.767 after placing a high of 107.894 and a low of 107.077. Overall the movement of USD/JPY remained bullish throughout the day. At 4:30 GMT, the Tokyo Core CPI for the year came in as 0.2% against -0.2% and supported the Japanese Yen. The Unemployment Rate from Japan also decreased in April to2.6% from the expectations of 2.7% and supported Yen.

However, the Prelim Industrial Production for April dropped by 9.1% against the expected drop of 5.5% and weighed on Yen at 4:50 GMT. The Retail Sales for the year from Japan also dropped by 13.7% against the expected drop of 11.2% and weighed on Yen. At 10:00 GMT, the Housing Starts for the year dropped by 12.9% against the drop of 12% expected and weighed on Yen. At 10:02 GMT, the Consumer Confidence for April increased to 24.0 from the expected 213 and supported Yen.

The increased confidence in Japan’s economy and better than expected CPI and Unemployment Rate supported Yen and made it stronger against the U.S. dollar, which dragged the USD/JPY currency pair in earlier Asian trading session on Friday.

 The pair dropped to its two weeks lowest level on Friday at 107.077 on the back of increased demand for safe-haven Yen amid escalating tensions between the U.S. and China. On Friday, the President of the United States, Donald Trump announced to revoke its relationship with WHO due to its mishandling of coronavirus pandemic. The U.S. had warned the WHO to be independent of China, change its reforms, and give it 30 days to do so. However, when on Friday, 30 days ended, and no response came back from WHO, the U.S. declared to end its relationship with it.

Trump said that the U.S.’s funds to transfer to WHO will be given to more deserving other nations where urgent help will be required. The decision came in after China issued and passed a new security bill on Hong Kong, and the U.S. said that it would retaliate.

Categories
Forex Options

FX Options Market Combined Volume Expiries for 1st June 2020

Thank you for visiting the Forex Academy FX Options market combined volume expiries section. Each day, where available, we will bring you notable maturities in FX Options of amounts of $100 million-plus, and where these large combined maturities at specified currency exchange rates often have a magnetic effect on price action, especially in the hours leading to their maturities, which happens daily at 10.00 AM Eastern time. This is because the big institutional players hedge their positions accordingly. Each option expiry should be considered ‘in-play’ with a good chance of a strike if labelled in red, still in play and a possible strike if labelled in orange and ‘out of play’ and an unlikely strike if labelled in blue, with regard to the likelihood of price action meeting the strike price at maturity.

…………………………………………………………………………………………………………………..

FX option expiries for June 1 NY cut at 10:00 Eastern Time, via DTCC, can be found below.

– EUR/USD: EUR amounts

  • 1.1000 3.8bn
  • 1.1100 1.7bn
  • 1.1250 2.5bn


EURUSD pair is overbought on the one hour chart and showing signs of running out of steam to the upside with a double top formation and with Markit PMI’s and US data out before the New York cut. The 1.1100 maturity is very much in play. The 1.1000 maturity should not be discounted due to its massive size.

– GBP/USD: GBP amounts        

  • 1.2210 428m
  • 1.2220 471m

GBPUSD pair is approaching an area of resistance but moving in an upward channel. The 2 maturities look to be out of play. UK and US data out later.

– USD/JPY: USD amounts         

  • 107.40 525m
  • 107.80 820m
  • 108.05 881m
  • 108.10 450m
  • 108.25 375m
  • 108.30 680m


USDJPY pair is in a bear channel but oversold on our one hour chart. The 107.40 maturity looks to be the most likely candidate for a strike. Look out for US PMI data later.

……………………………………………………………………………………………………………………..

As you can see on the charts we have also plotted the expiration levels at the various exchange rate maturities and we have also labelled in red, orange and blue. Therefore, if you see option expiry exchange rates labelled in red these should be considered in-play, because we believe there is a greater chance of the expiry maturing at these levels based on technical analysis at the time of writing. There is still a lesser possibility of a strike if they are in orange and so these are ‘in-play’ too. However, if we have labelled them in blue, they should be considered ‘not in-play’ and therefore price action would be unlikely to reach these levels, which are often referred to as Strikes, at the time of the 10 AM New York cut.

Our technical analysis is based on exchange rates which may be several hours earlier in the day and may not reflect price action at the time of the maturities. Also, we have not factored in economic data releases or keynote speeches by policymakers, or potential market volatility leading up to the cut.

Although we have added some technical analysis we suggest you take the levels and plot them onto your own trading charts and incorporate the information into your own trading methodology in order to use the information to your advantage.

Remember the higher the amount, the larger the gravitational pull towards the exchange rate maturity at 10:00 AM Eastern time.

If you want to learn how forex option expiries affect price action in the spot FX market see our educational article by clicking here: https://bit.ly/2VR2Nji

DISCLAIMER: Please note that this information is for educational purposes. Also, the maturities will look more or less likely to become a strike at 10 AM NY time due to exchange rate fluctuations resulting in a different perspective with regard to technical analysis, and also due to upcoming economic data releases for the associated pairs.