On the news front, the economic calendar remains busy on Friday. Today’s releases may trigger some price action in the Euro and U.S. related pairs, especially on the release of German GDP, Eurozone Flash GDP, and U.S. core retail sales figures, which are due to come out during European and U.S. session respectively.
Economic Events to Watch Today
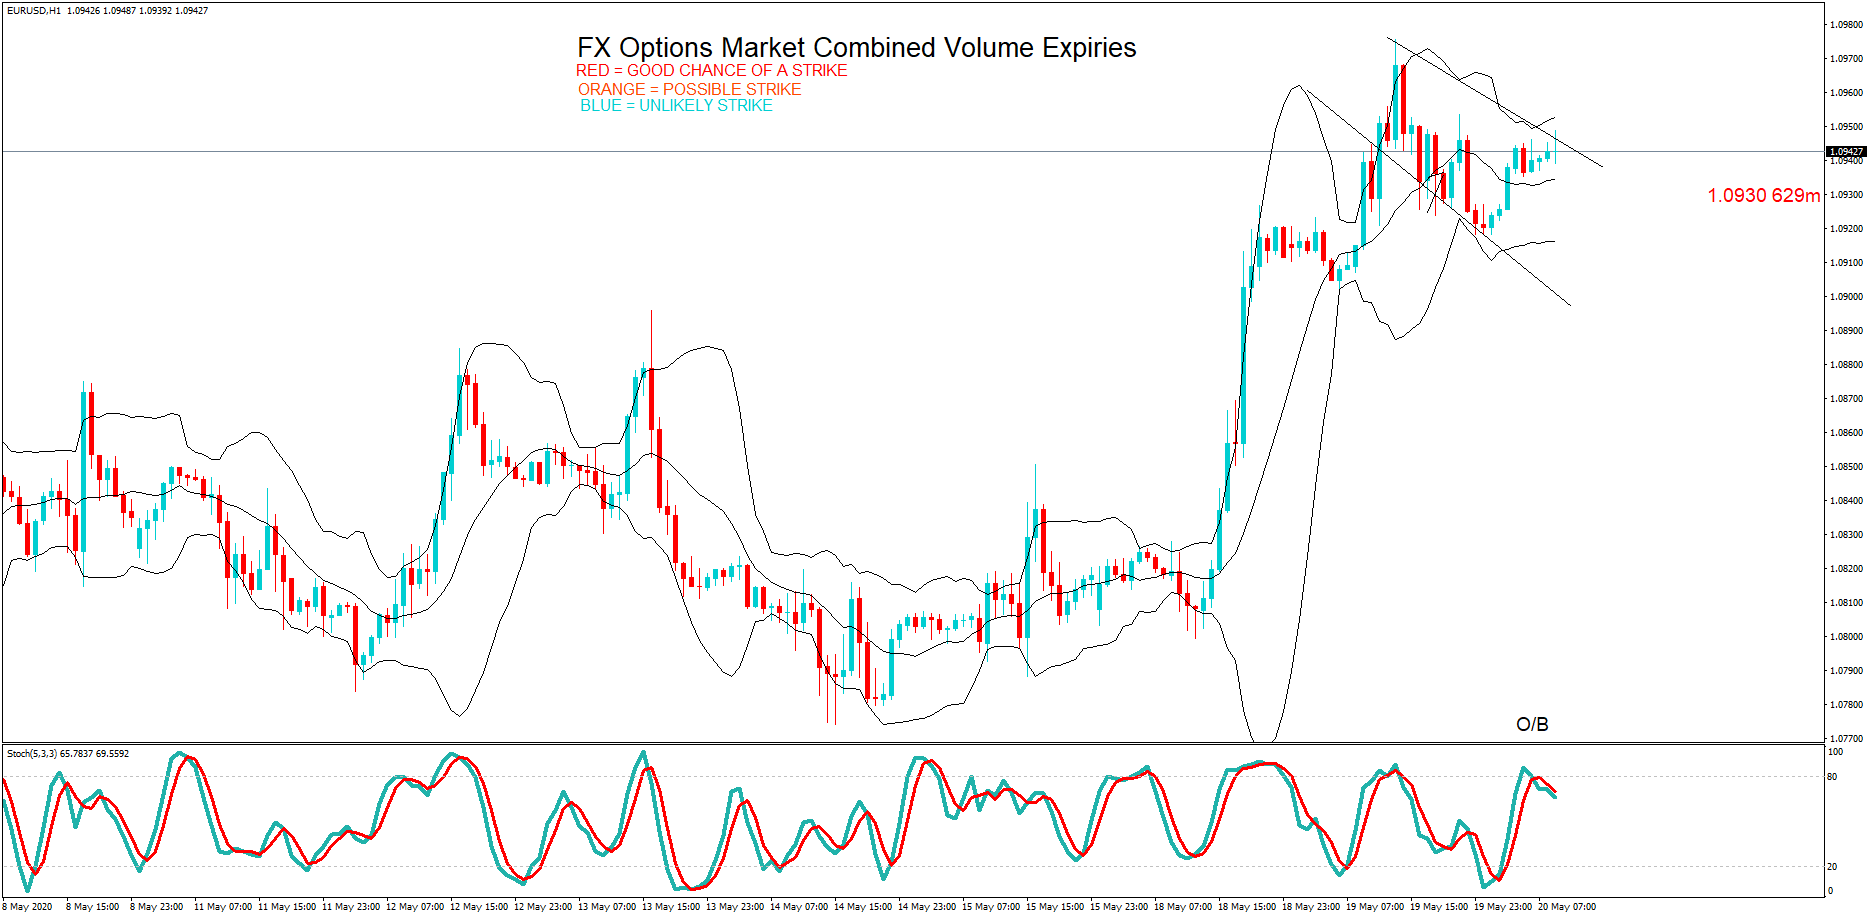
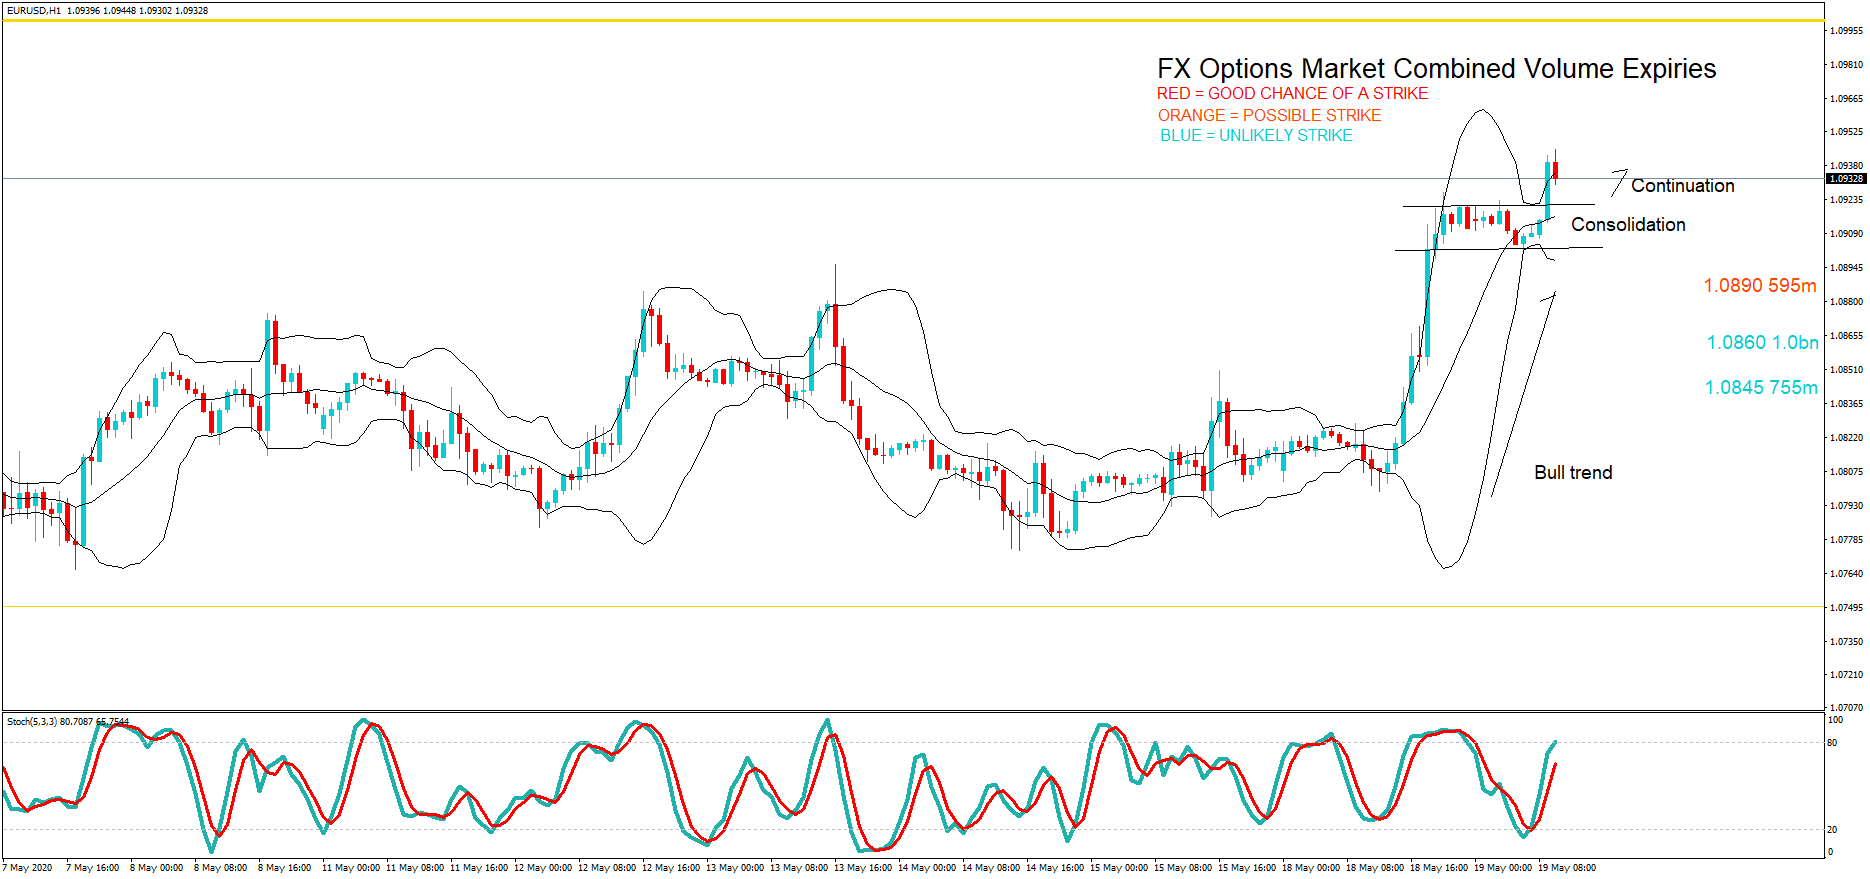
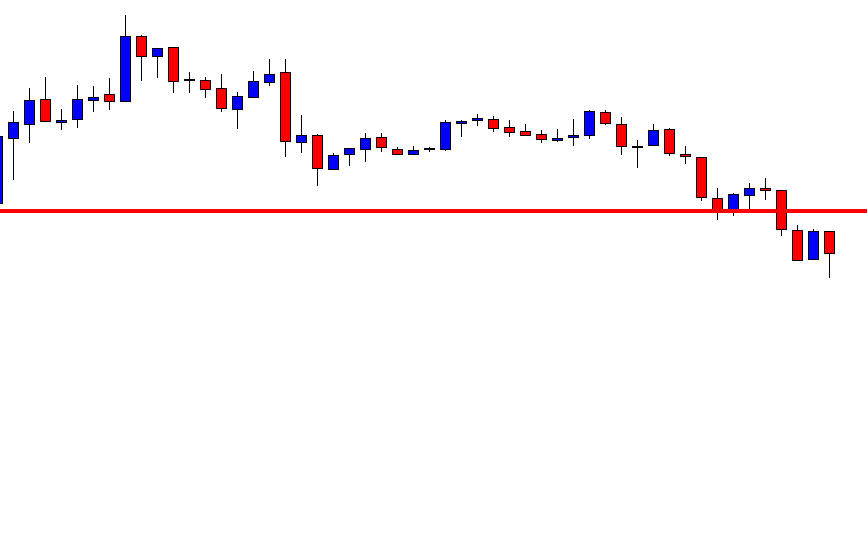
EUR/USD – Daily Analysis
During the early Asain trading session, the EUR/USD currency pair flashing green, but remains trading in the confined range around above the 1.0800 level ahead of Germany’s preliminary gross domestic product (GDP) for the first quarter. The broad-based U.S. dollar modest weakness helping the currency pair to stay positive and kept a lid on any additional losses, at least for now. For example, the currency pair is looking directionless as the S&P 500 is sidelined, and the Asian stocks are adding in a mixed performance.
The EUR/USD is trading at 1.0806 and consolidates in the range between the 1.0798 – 1.0809. However, the traders are keenly awaiting Germany’s preliminary gross domestic product ahead of a strong position.
At the data front, Germany’s preliminary gross domestic product (GDP) for the first quarter, which is scheduled to publish at 06:00 GMT, is anticipated to show the old continent’s biggest economy declined by 2.2%, having increased by 0.4% in the final 3-months of 2019. It should be noted that the GDP prints of -2.2% or lower would be considered the worst reading since the ist-quarter of 2009.
Germany had declared a secure national lockdown on March 22, which meant the economic activity came to a stop only in the last 8 or 9 of the 1st-quarter. In contrast, Germany is dependent on the dragon nation, which had already faced a sharp recession in the activity in the first two months of the year, mainly due to the coronavirus pandemic.
Therefore, there are many chances that Germany reporting a bigger-than-expected recession in the first quarter will not be rejected. As we already mentioned, the economists are expecting a 2.2% decrease, as per Germany’s DIW economic institute, the economy expected declined by 2% in the first quarter. Alternatively, the DIW expects a 10% decline in the GDP in the second quarter.
Moving on, the EUR/USD currency pair may not pay any significant attention if the GDP prints in line with estimates as the market already priced in the worst condition of significant economies during the March and more so in April caused by coronavirus outbreak.
The currency pair could be able to take bids only if prints would be a surprise beat on expectations, but the gains would be temporary or short-lived if the risk sentiment turns heavy. Looking forward, market participants now look forward to Germany’s preliminary gross domestic product (GDP) for the first quarter, which is scheduled to publish at 06:00 GMT. The trade/virus updates could also entertain market traders.
Daily Support and Resistance
- S1 1.0673
- S2 1.0758
- S3 1.079
- Pivot Point 1.0843
- R1 1.0874
- R2 1.0928
- R3 1.1013
EUR/USD– Trading Tip
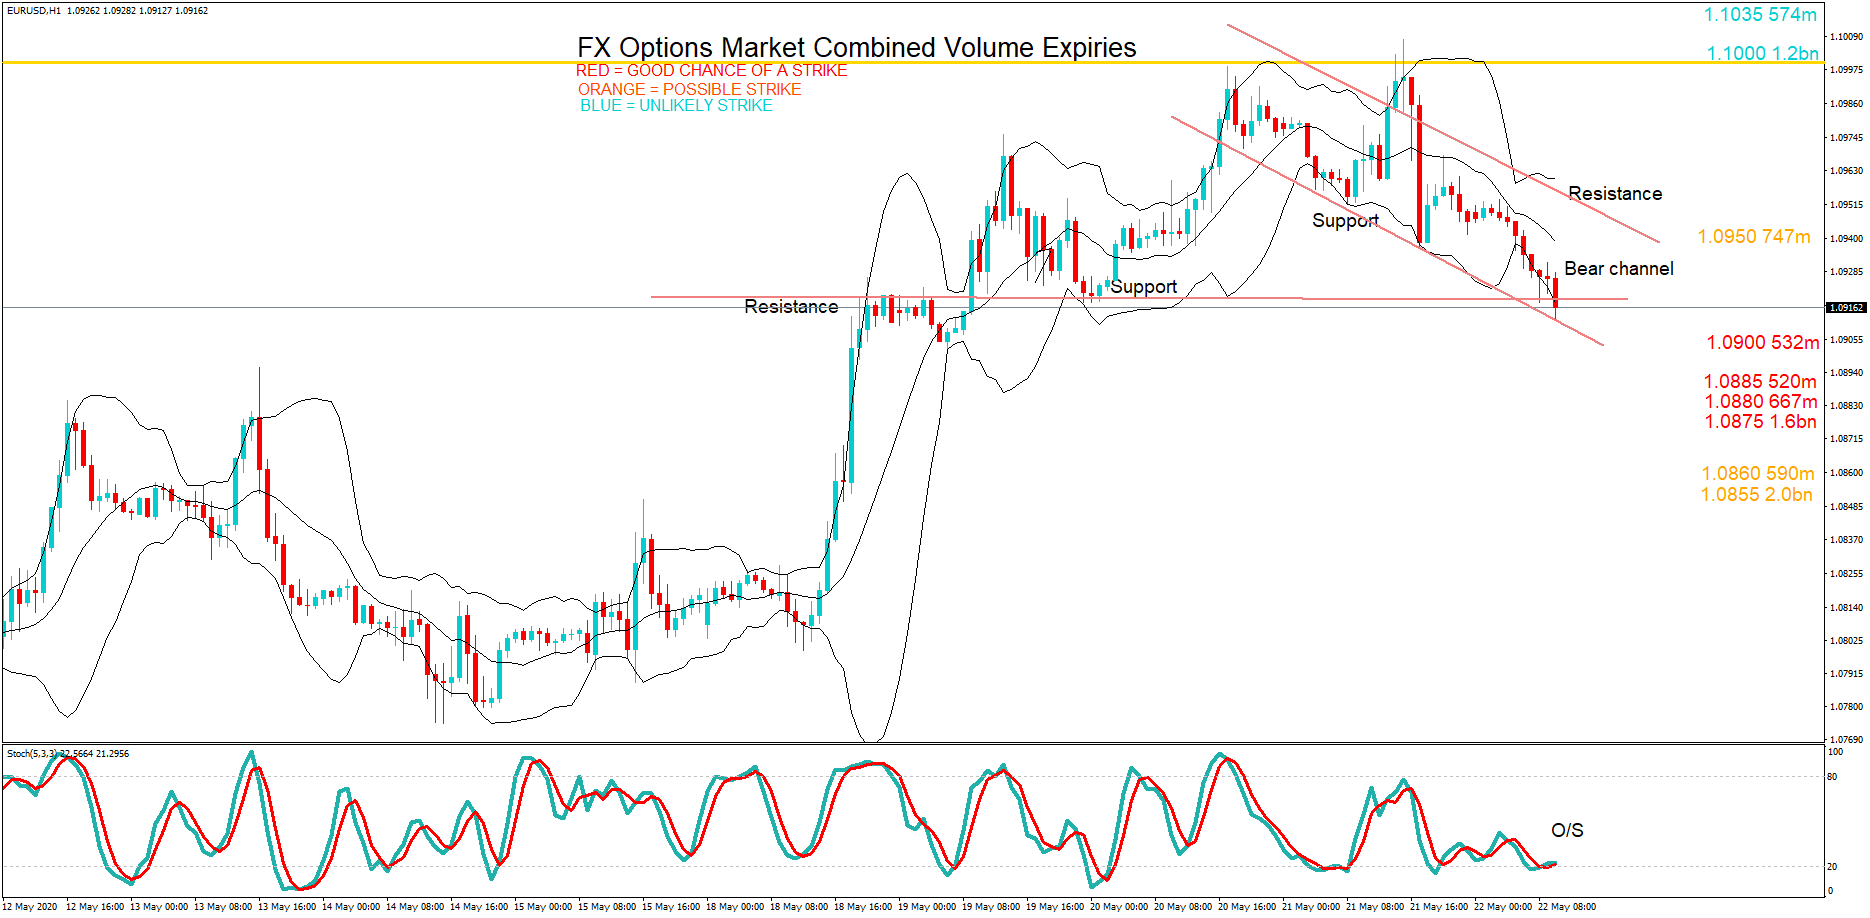
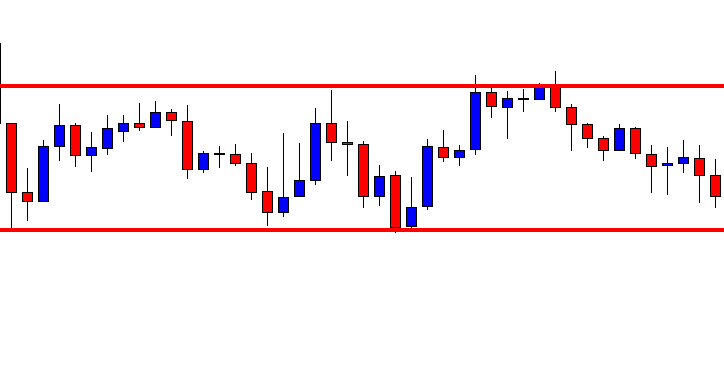
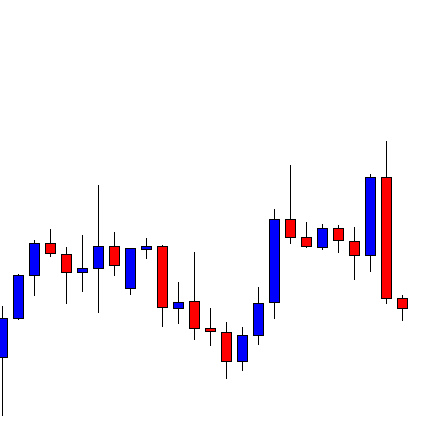
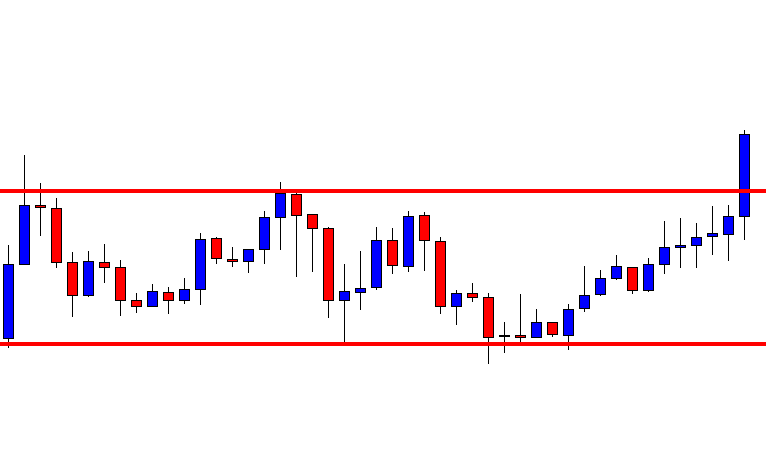
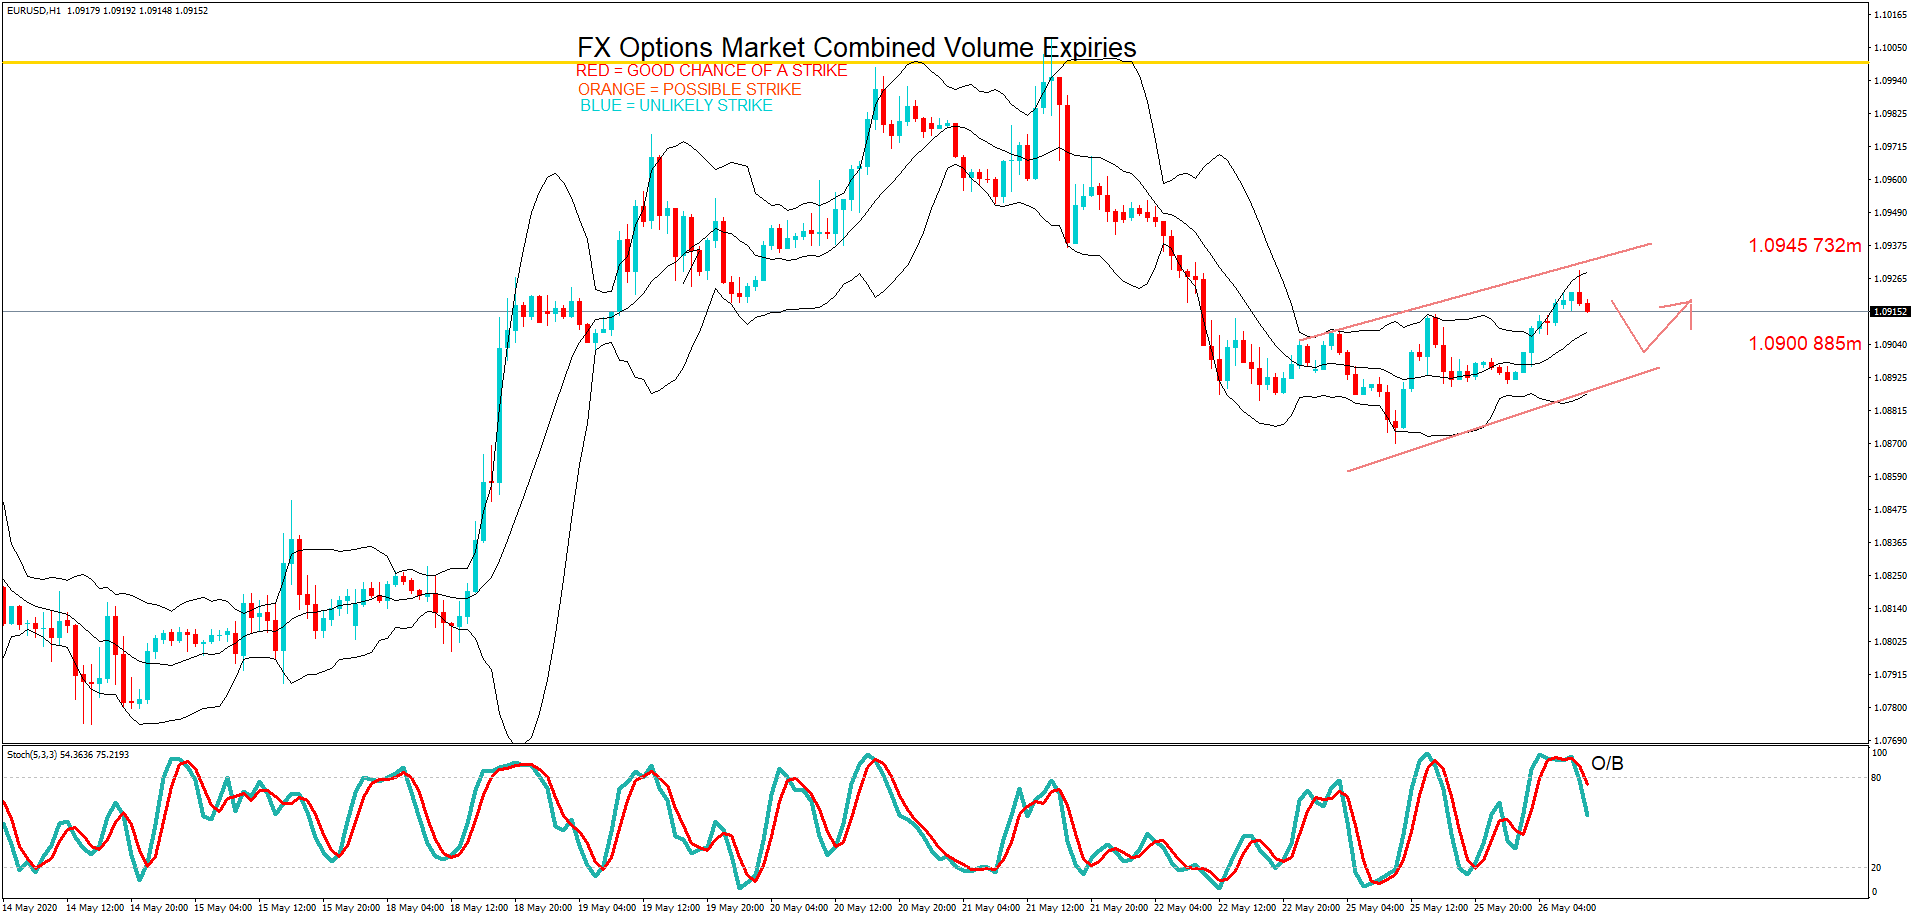
On Friday, the EUR/USD is trading at 1.0807, bouncing off over the double bottom support level of 1.07756. On the 4 hour chart, the EUR/USD is closing bullish candles above upward channel trendline, but at the same time, the 50 EMA and horizontal resistance seem to drive bearish sentiment for the EUR/USD pair. Extension of selling below 1.0843 level may lead the EUR/USD prices towards 1.07782 level, and below this, the next support is likely to be found around 1.0730. Consider staying bullish above and bearish below 1.0770 level today.
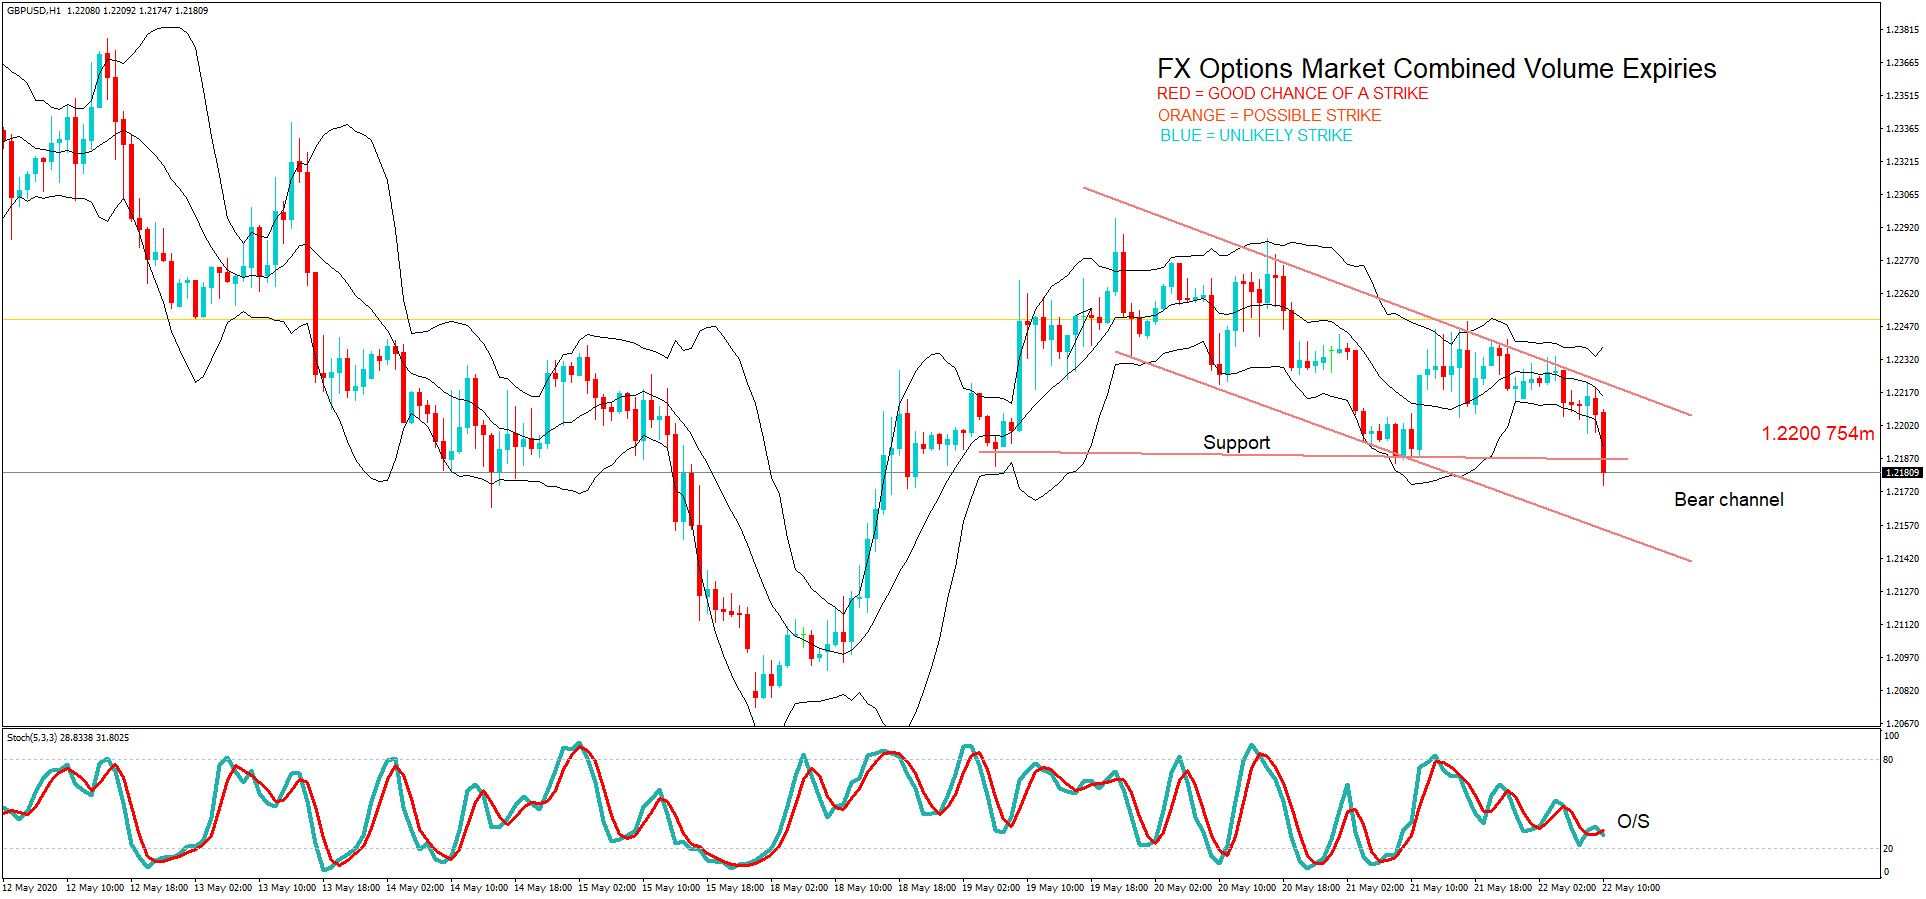
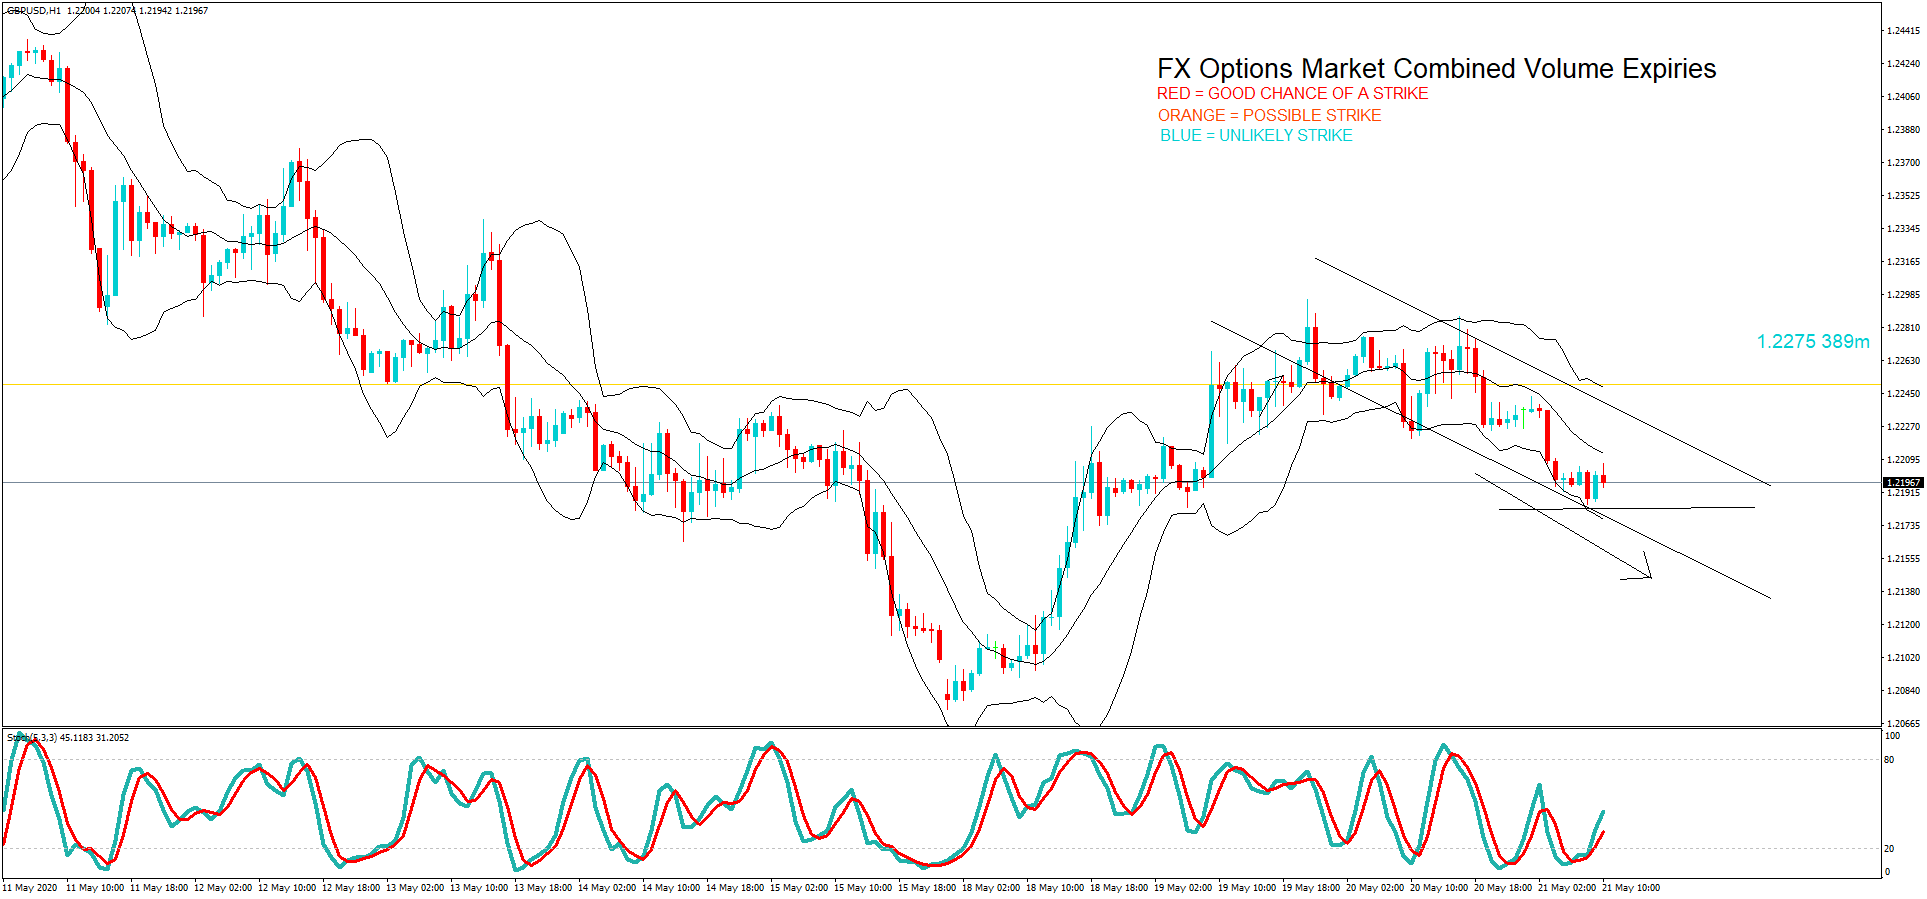
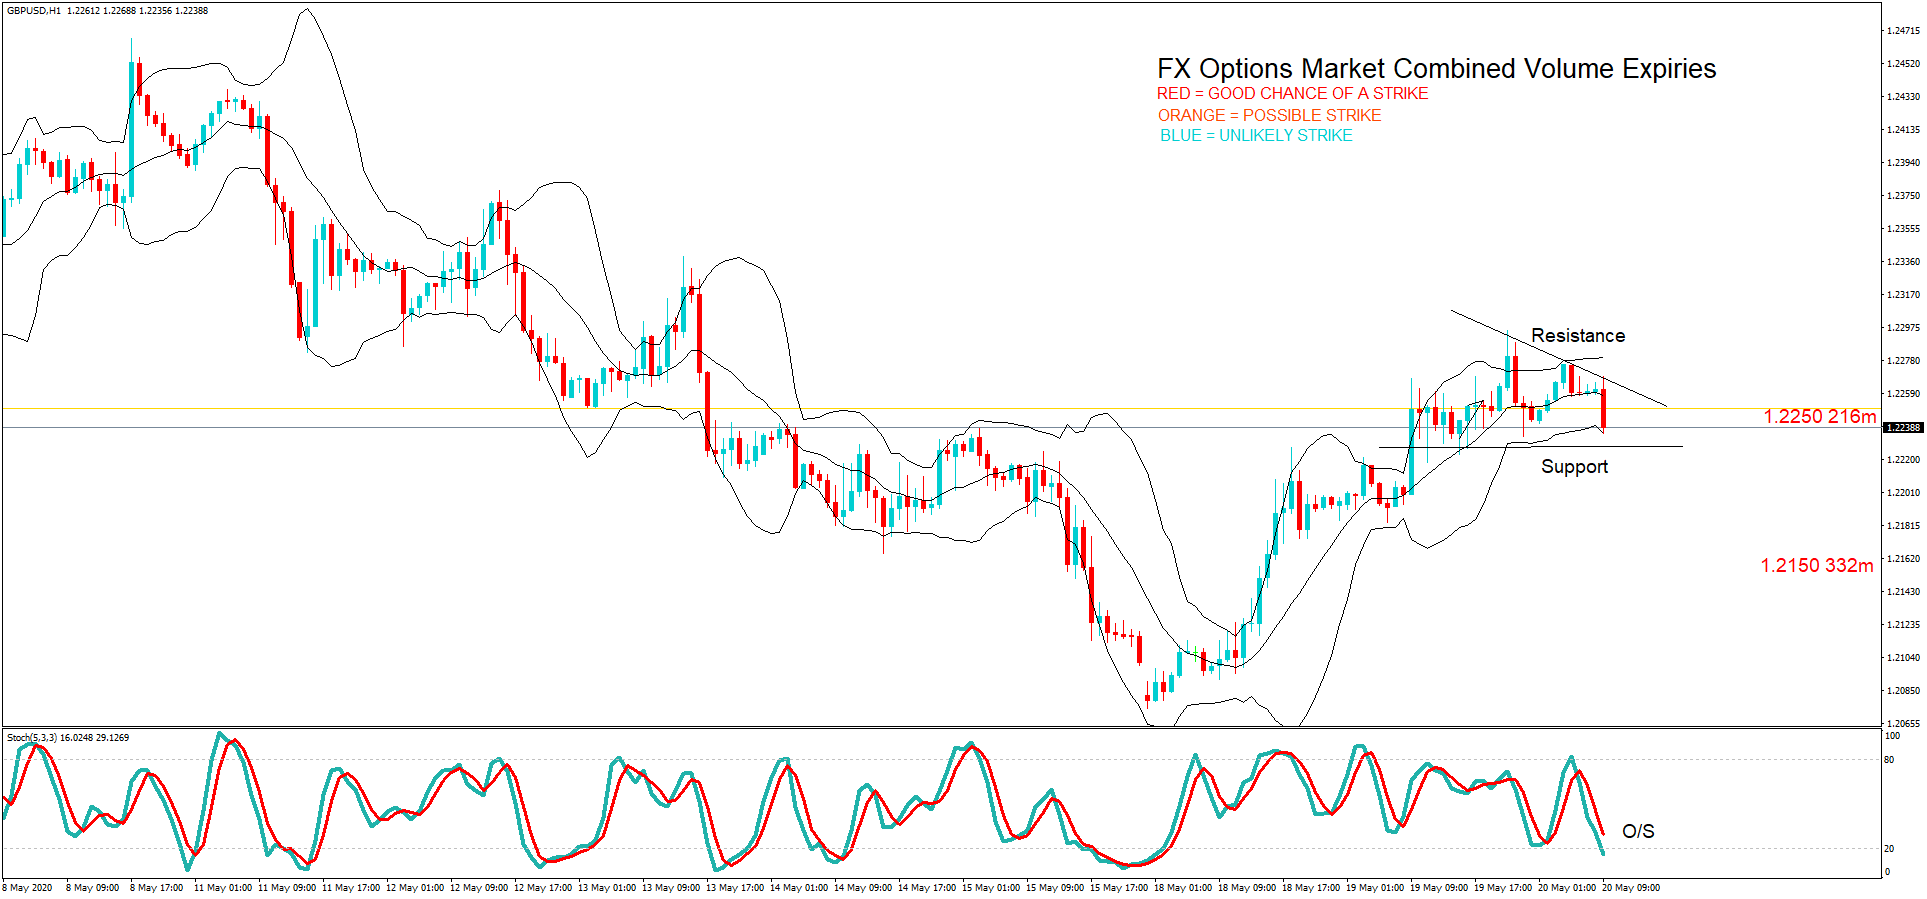
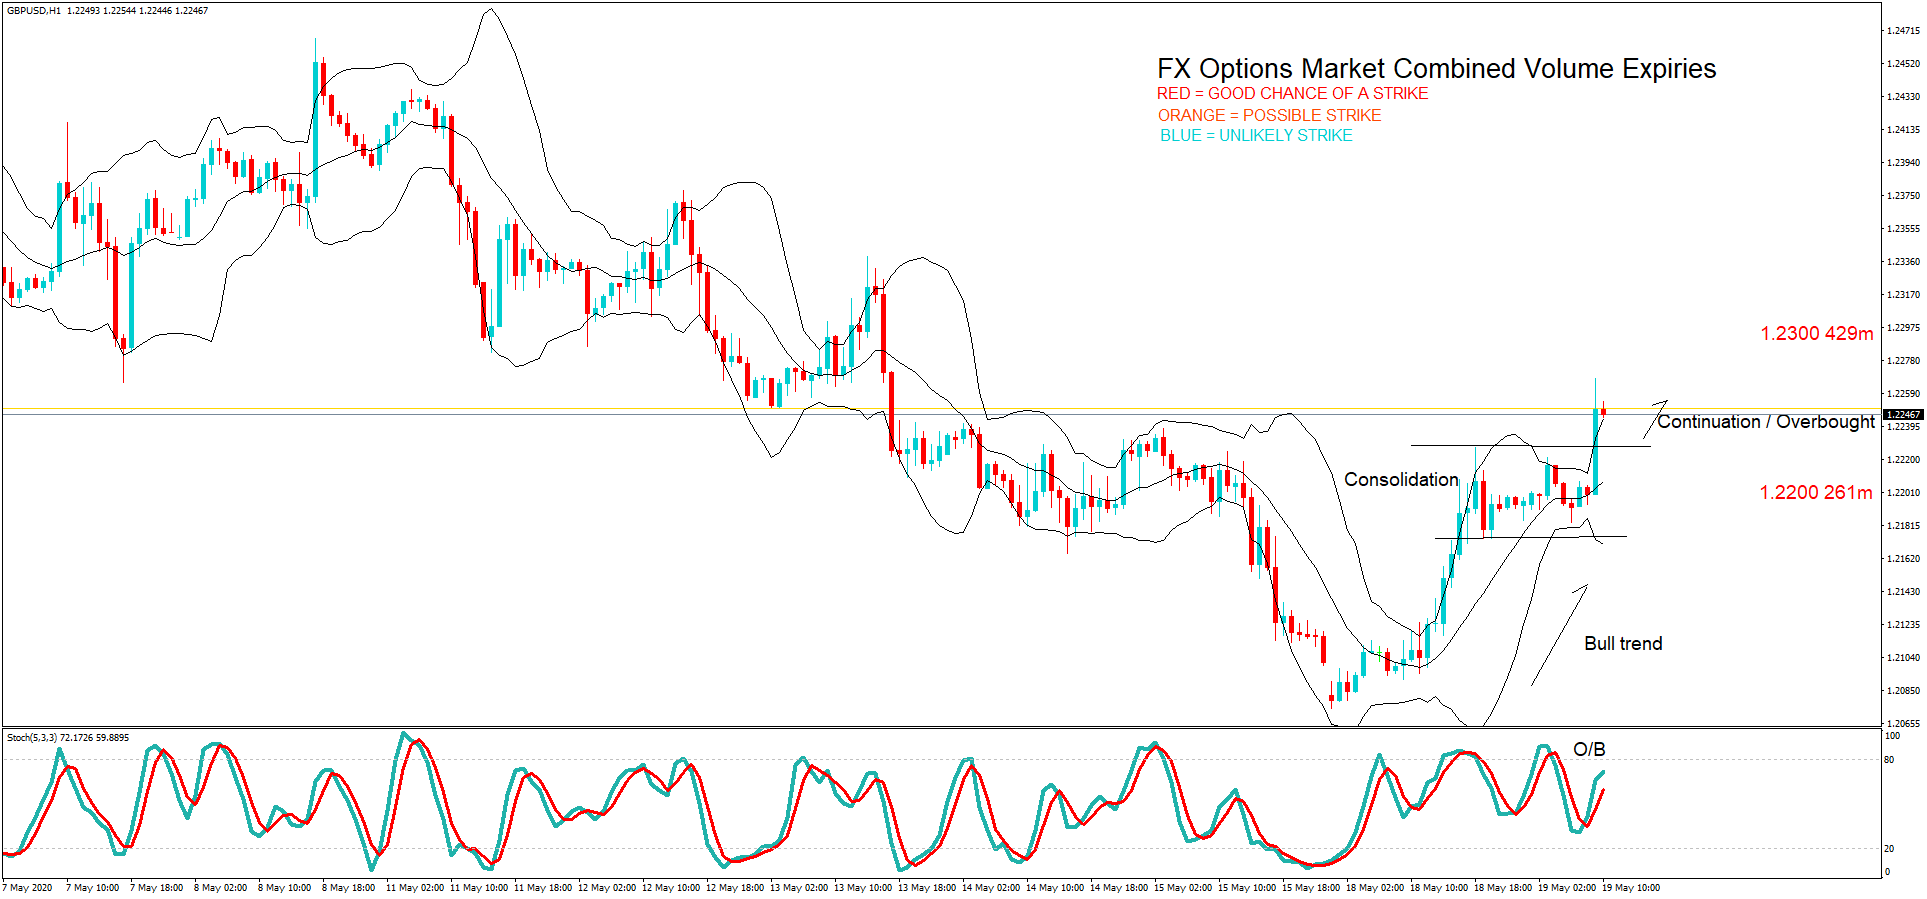
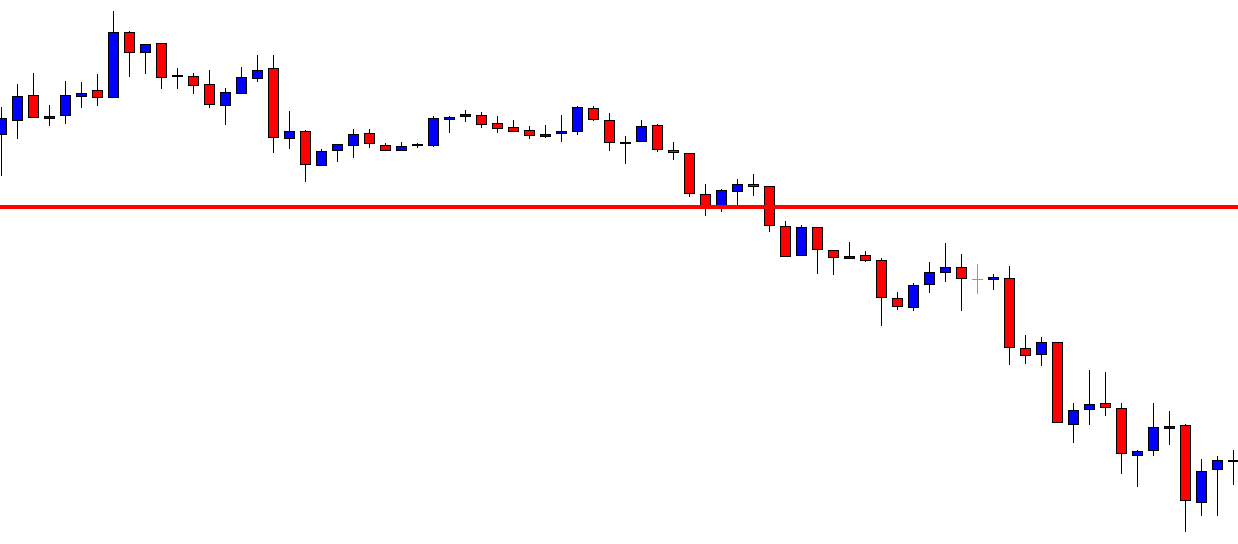
GBP/USD – Daily Analysis
The GBP/USD currency pair failed to stop its 5-day losing streak and dropped below the 1.2210 level while representing 0.15% losses on the day mainly due to the Brexit worries and coronavirus crisis. The broad-based U.S. dollar over-all bullish sentiment also weighed on the currency pair and kept the pair down. The GBP/USD is trading at 1.2208 and consolidates in the range between the 1.2203 – 1.2237. However, the traders are cautious about placing any strong position as they are keenly awaiting today’s U.S. consumer-centric data.
At the Brexit front, the European Union (E.U.) and the United Kingdom moderators are still pushing to cancel Brexit talk, which decided to happen through video conferences. At the same time, the European Commission’s (E.C.) took legal action against the U.K., which made talks tougher to happen. The European Commission initiated legal proceedings against the U.K. on Thursday, while accusing the U.K. about failing to comply with E.U. law on free movement which eventually keeps the cable currency under pressure and contributes to the pair’s declines.
On the flip side, the UK PM Boris Johnson keeps its preference high toward border checks at the Northern Ireland (N.I.) while the N.I. Secretary Brandon Lewis has repeatedly said there shall not be a border down the Irish Sea.
At the coronavirus front, the infected cases by coronavirus reached around 233 thousand overall in England, including 25 thousand in London,
as per the latest research by the Public Health England (PHE) and Cambridge University. In the meantime, the United Kingdom is talking with Swiss drugmaker Roche Holding AG about to buy an accurate COVID-19 antibody test after getting preliminary approval by the European Union and the United States.
Apart from this, the Bank Of England governor Andrew Bailey showed a willingness to take further action but denied rate cuts. The reason for the pairs bearish moves could also be attributed to the statement of the British central bank’s citizen panel in which they expect COVID-19 to have a large and enduring influence on the economy and society more broadly.
At the USD front, the broad-based U.S. dollar bolsters by the receding expectations of negative Fed rate and the increased probabilities of further stimulus from the government. While the Dollar Index (DXY), a gauge of the greenback versus significant currencies, remains mildly bid around 100.30 by the press time.
Daily Support and Resistance
- R3 1.2577
- R2 1.2508
- R1 1.2422
Pivot Point 1.2353
- S1 1.2268
- S2 1.2198
- S3 1.2113
GBP/USD– Trading Tip
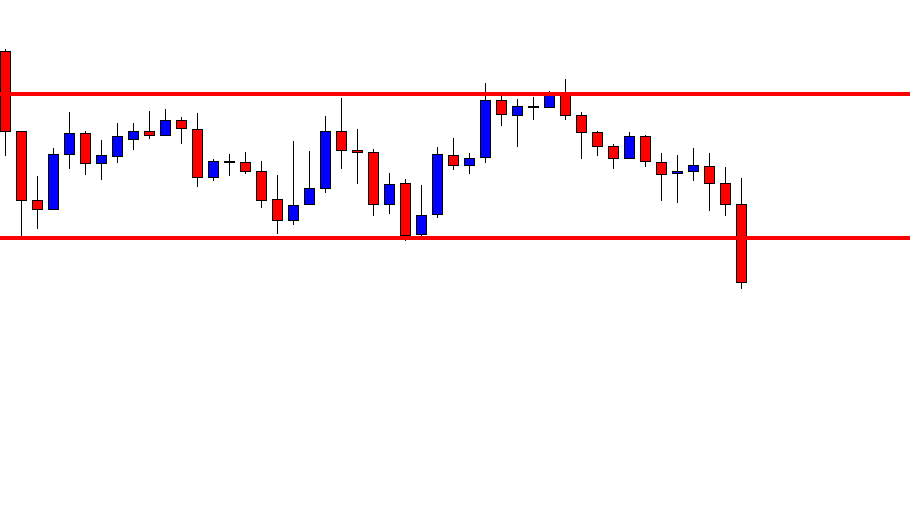
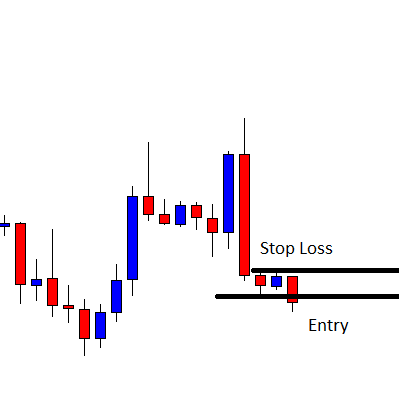
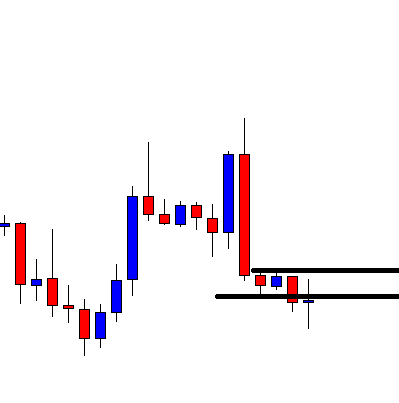
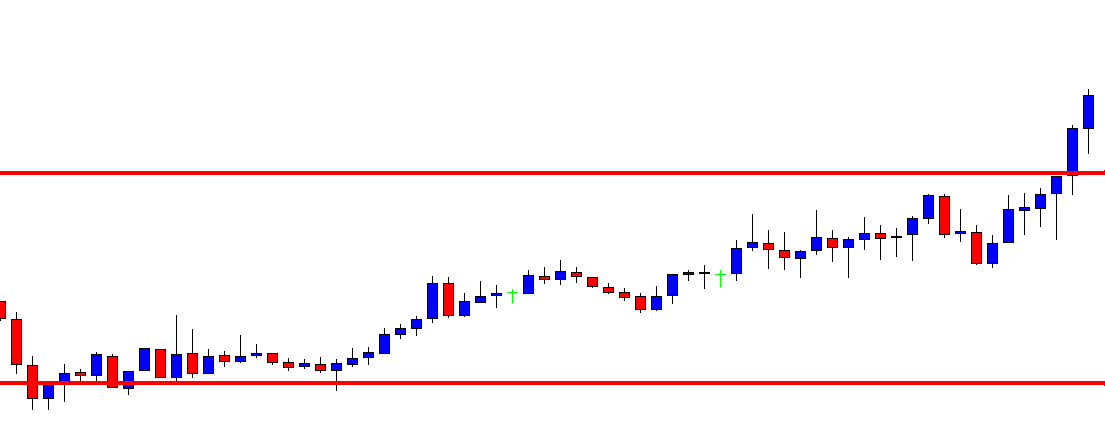
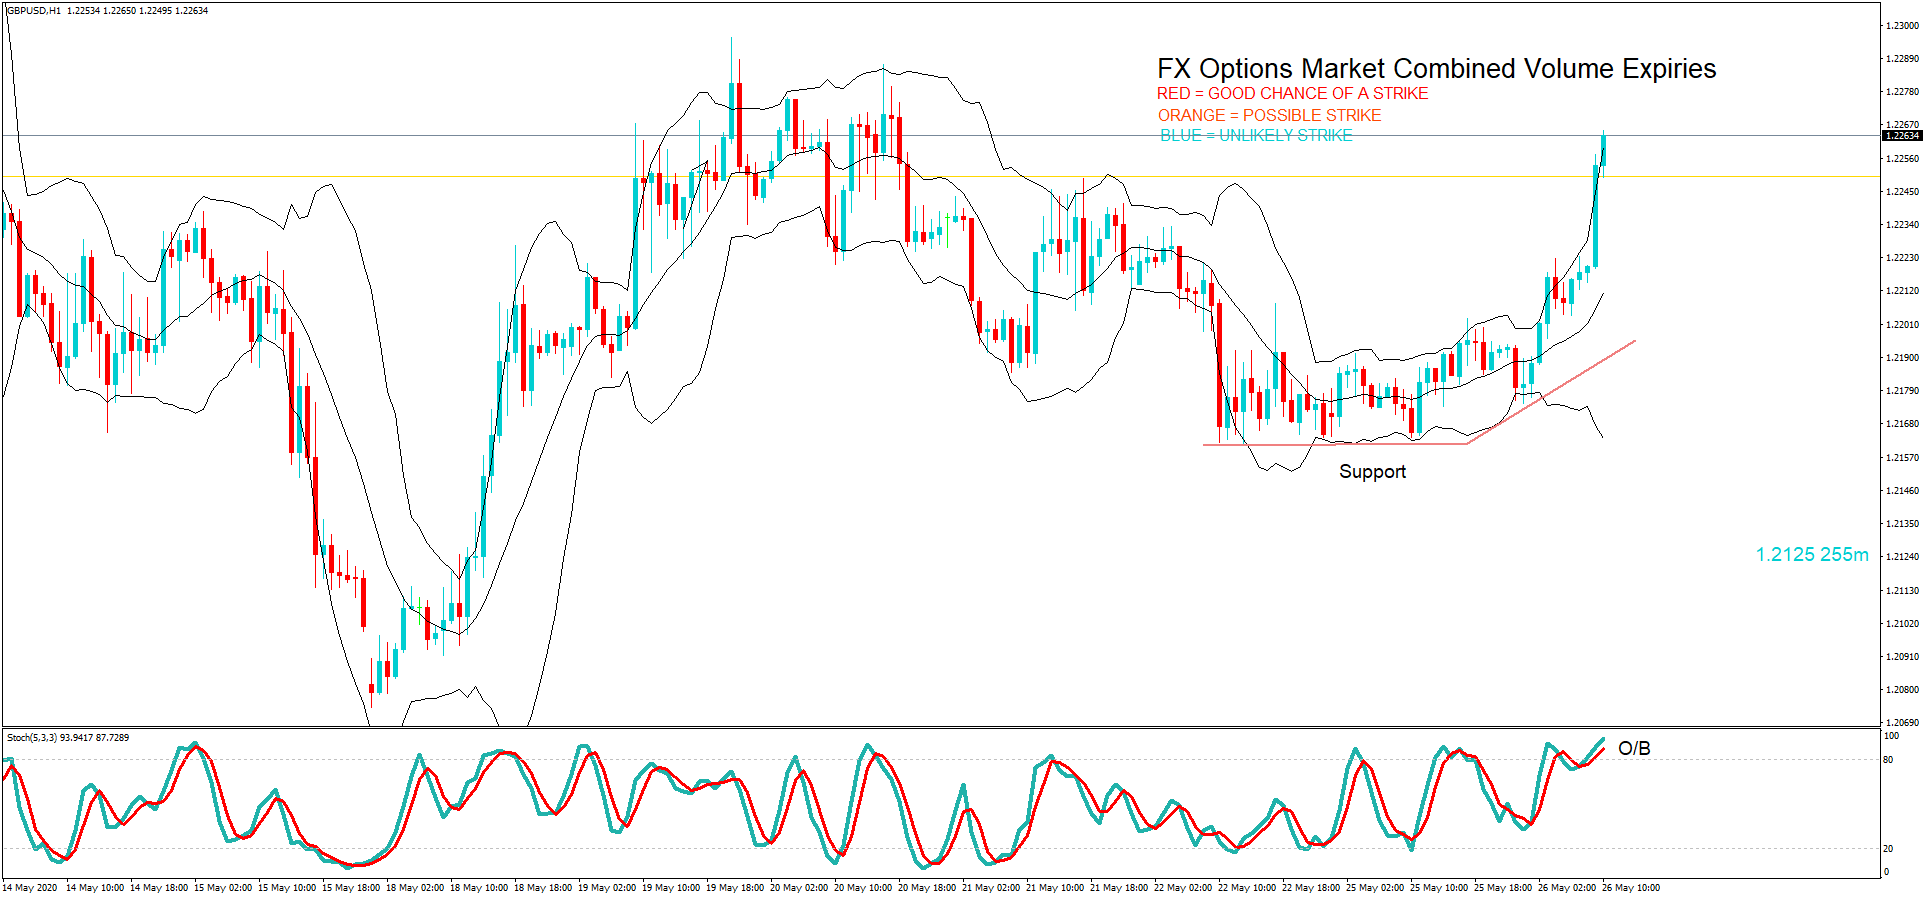
On the last trading day of the week, the GBP/USD is trading sideways at 1.2200 after breaking below the narrow trading range of 1.2320 – 1.2245. The Cable has formed a new range of 1.2245 – 1.2186, however it’s still holding below 50 EMA, which is extending resistance around 1.2260 level today. On the 4 hour chart, the GBP/USD is gaining support at 1.2180 level while the 50 EMA and horizontal resistance stay at a level of 1.2245.
The violation of the sideways trading range of 1.2245 – 1.2180, and the release of U.S. retail sales may help drive breakout in the GBP/USD pair.
The GBP/USD pair may lead its prices towards an immediate support level of 1.2190 and 1.2150 in case of positive date; elsewhere, the GBP/USD pair may soar towards 1.2240 and 1.2310.
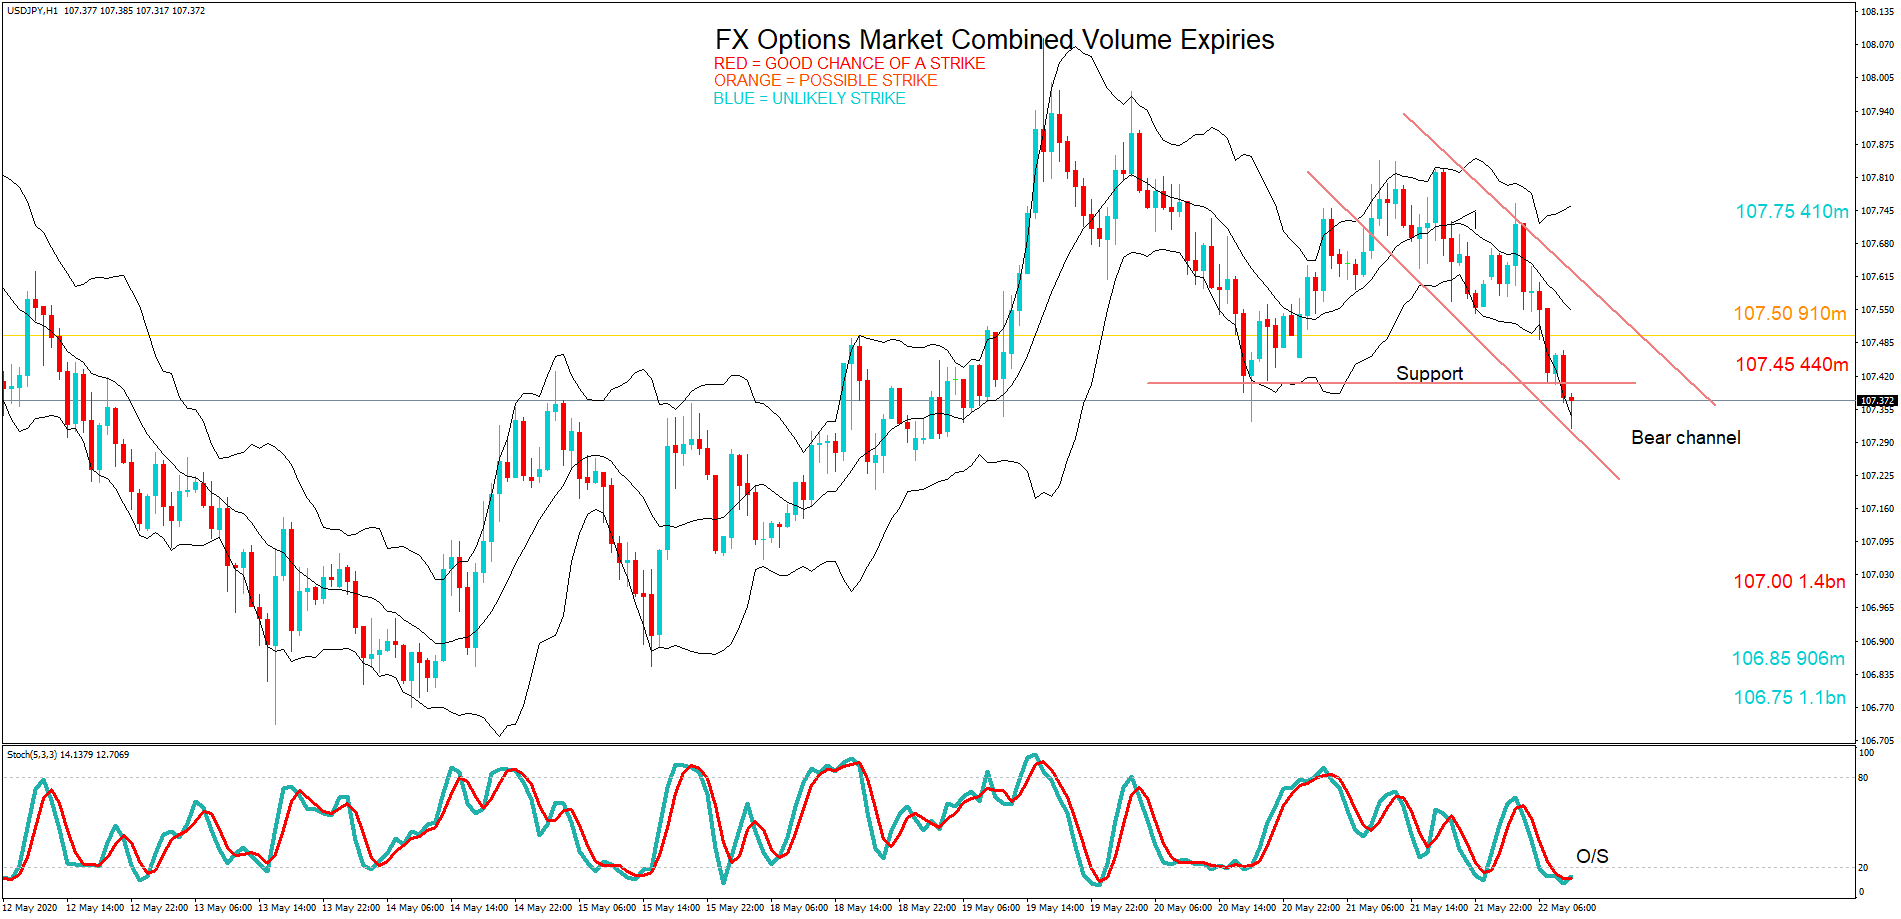
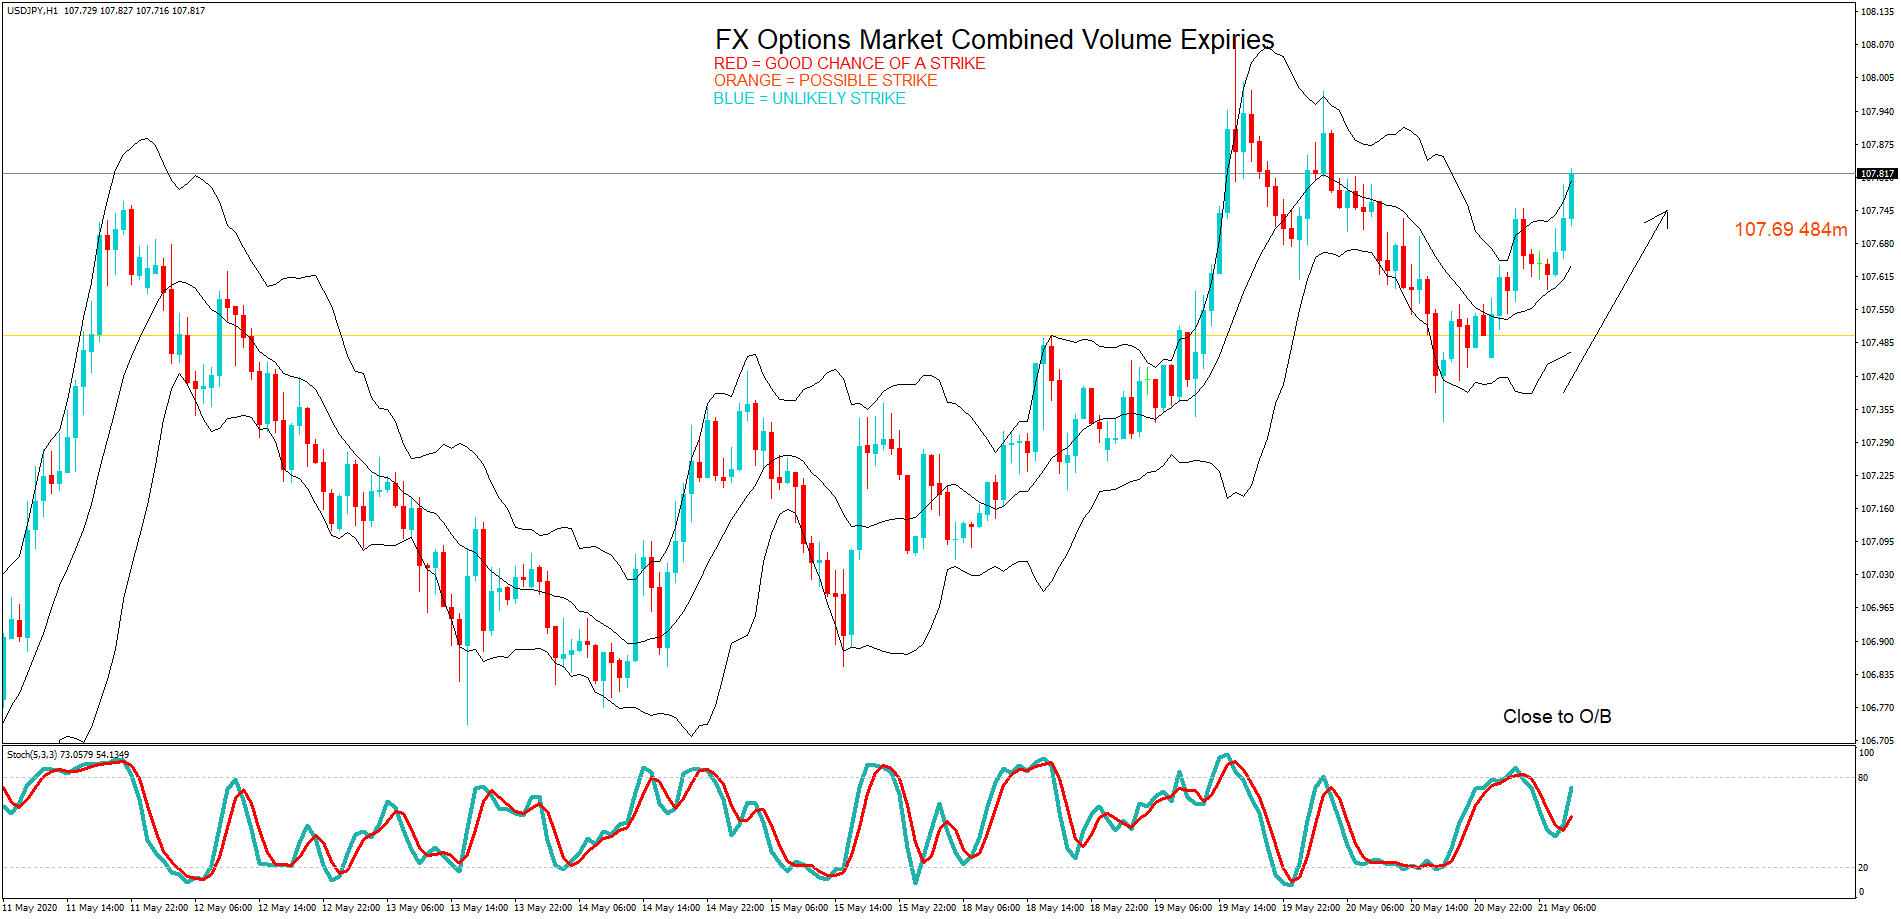
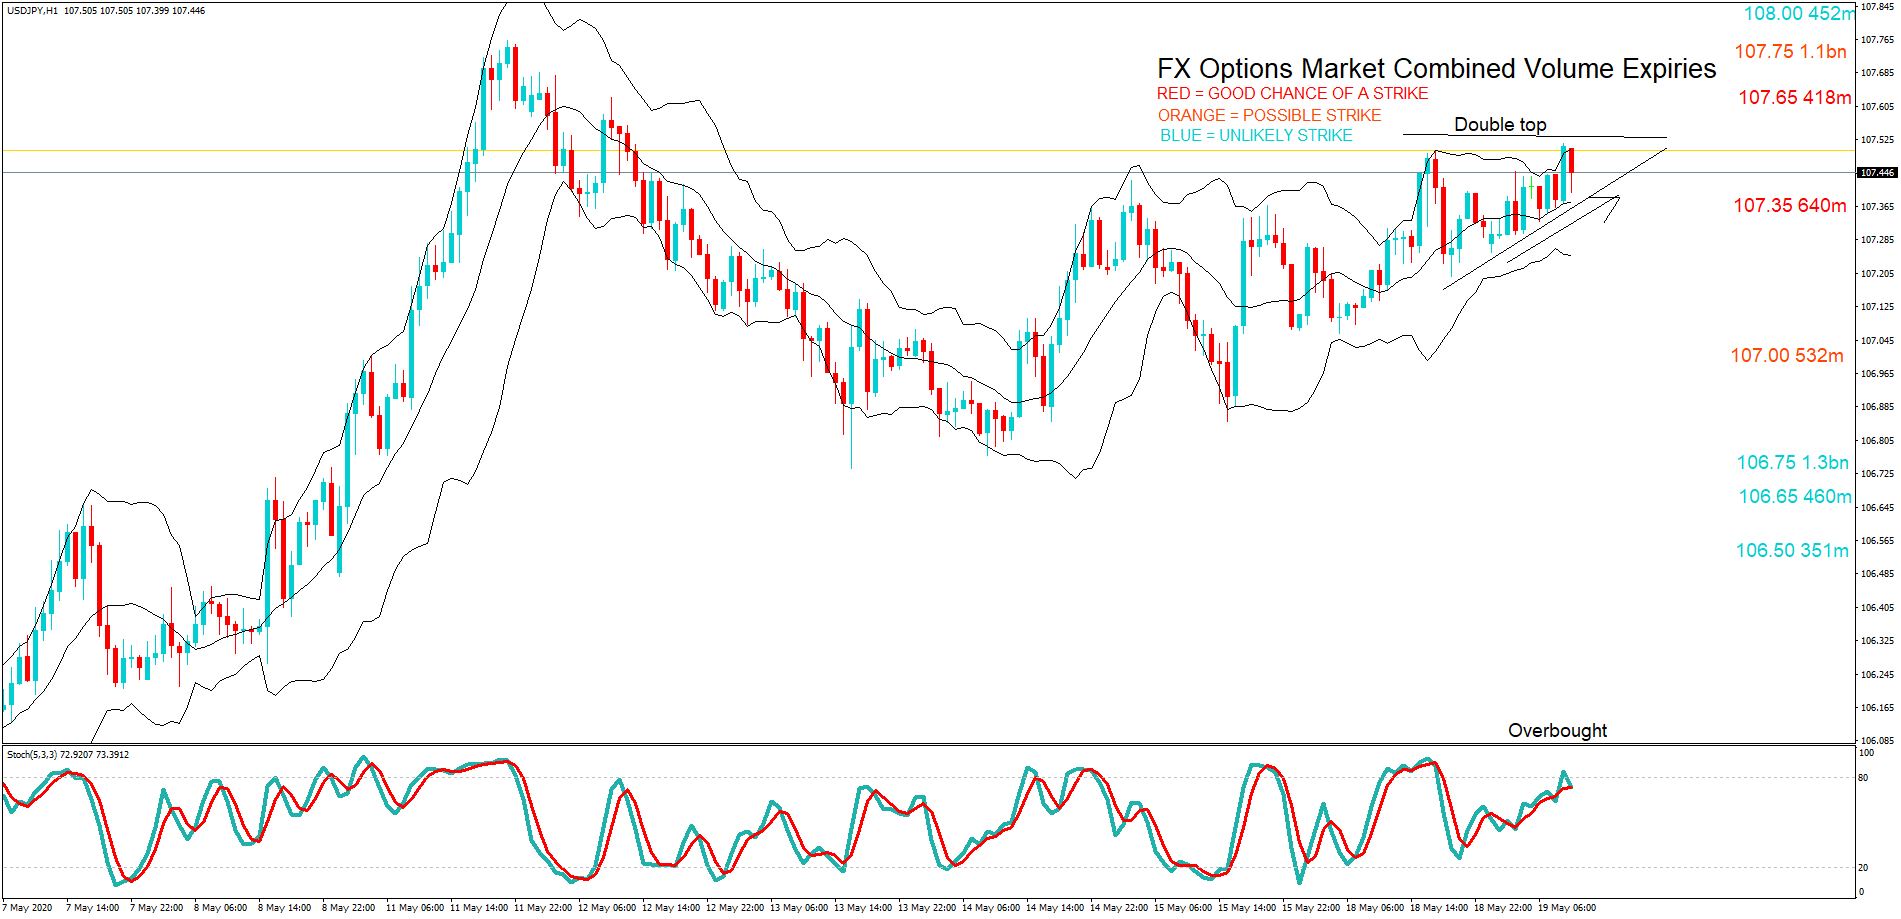
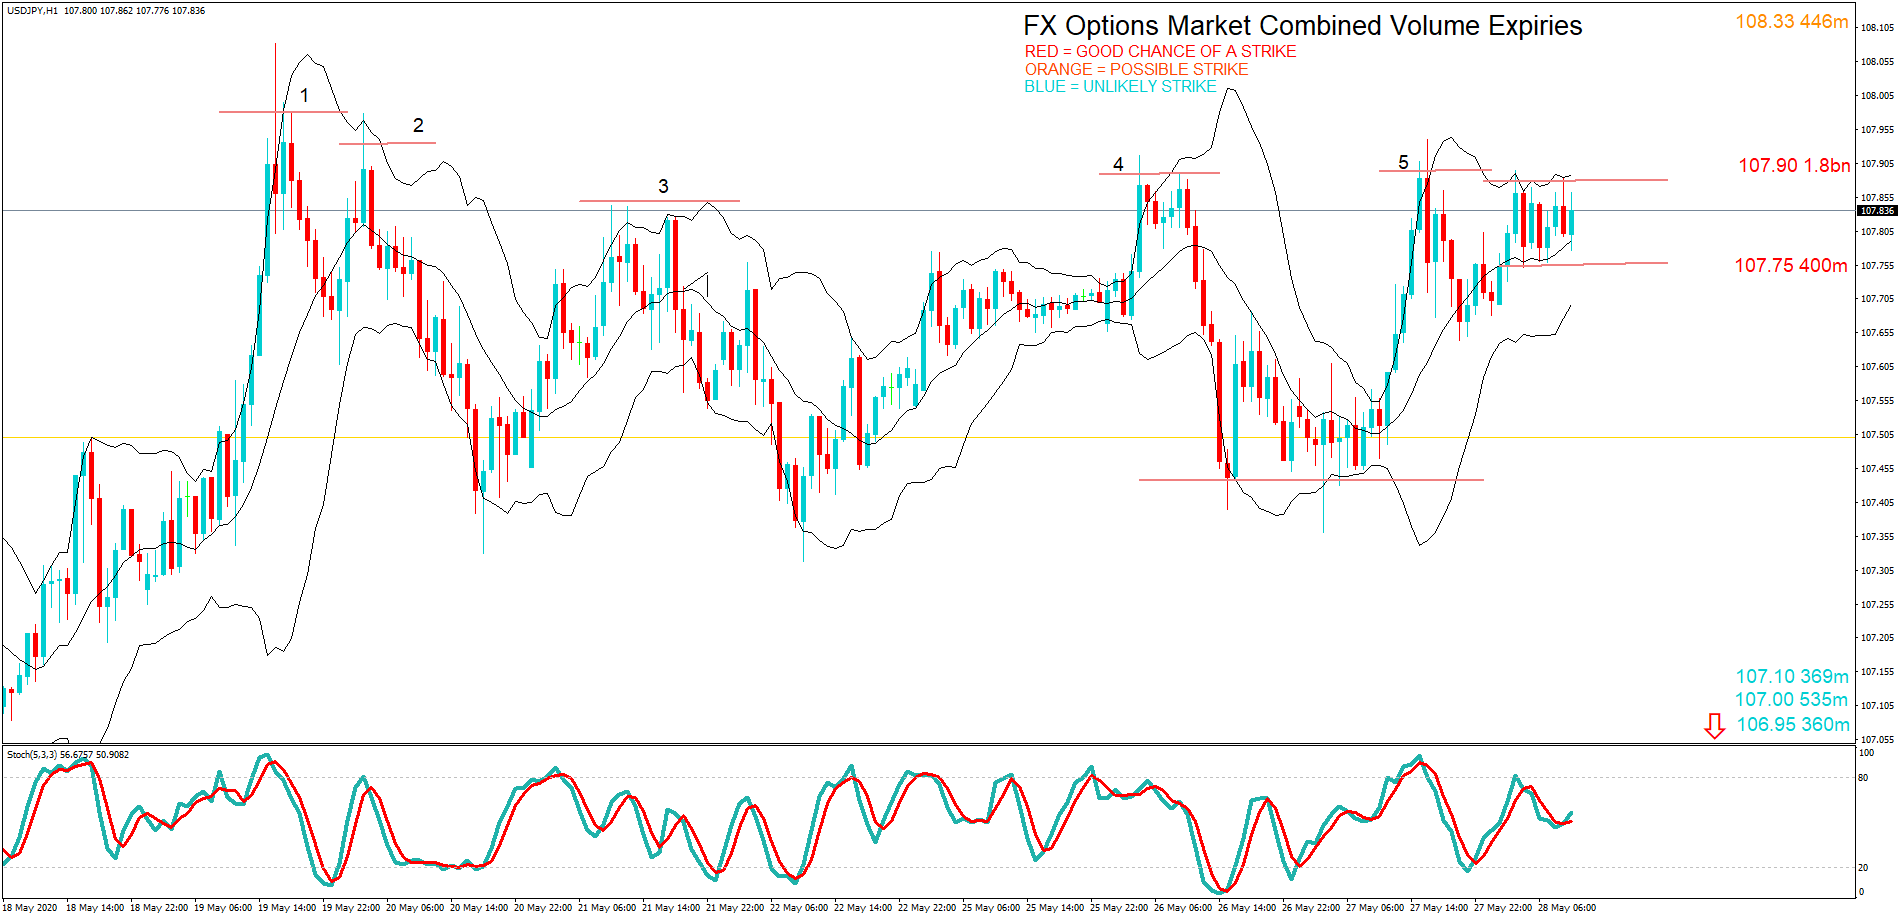
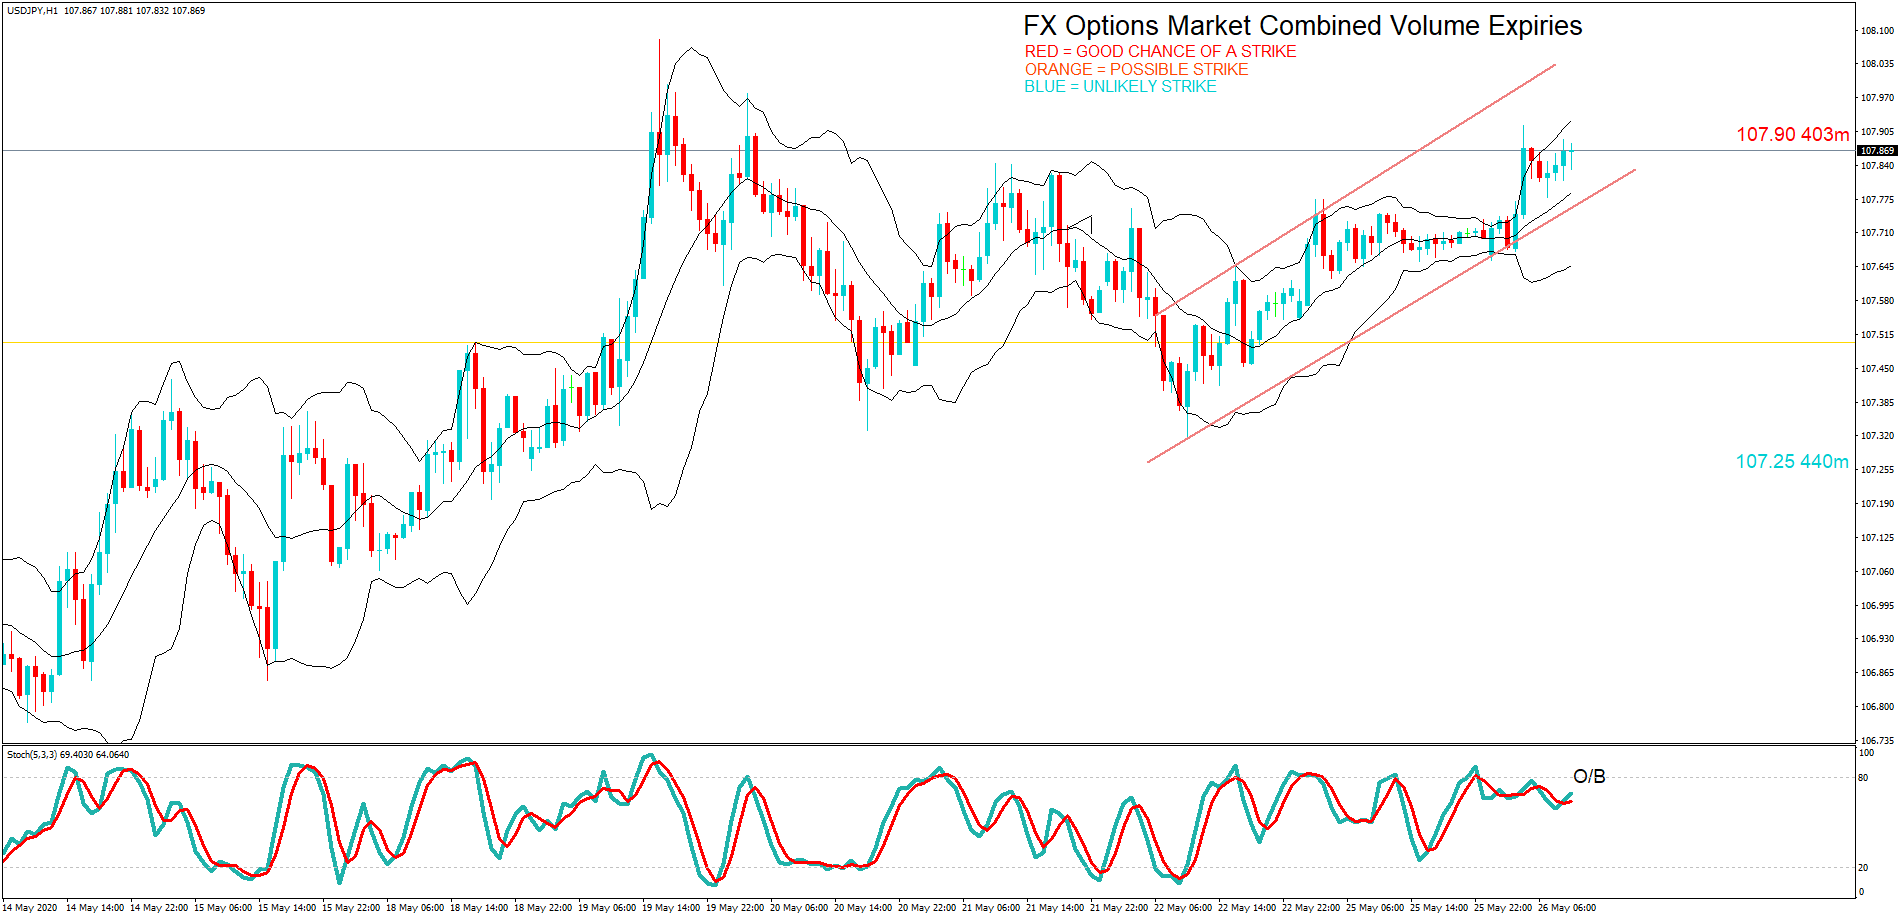
USD/JPY – Daily Analysis
The USD/JPY pair was closed at 107.224 after placing a high of 107.363 and a low of 106.773. Overall the movement of the USD/JPY pair remained bullish throughout the day. After dropping below 107 level on Thursday, the USD/JPY pair regained its strength and posted gains for the day on the back of the improved market sentiment. The increased claims for jobless benefits from the United States during the last week failed to weigh on the U.S. dollar. A total of 2.9M Americans applied for unemployment benefits in the previous week against the expected 2.5M.
At 17:30 GMT, the Unemployment Claims for last week exceeded the expectations of 2500K and came in as 2981K and weighed on the U.S. dollar. The Import Prices for April were declined by 2.6% against the forecasted decline by 3.1% and supported the U.S. dollar.
The U.S. Dollar Index ignored the job data from the United States and moved above 100.40 level on Thursday, which helped USD/JPY pair to stretch its gains. Another factor adding in the upward trend of the USD/JPY pair was the comments from Donald Trump in support of the dollar. He said that a strong dollar was a great thing that could help in fast economic recovery after the coronavirus, this triggered the U.S. dollar buying wave and extended USD/JPY pair’s gains.
From the Japan side, at 4:50 GMT, The M2 Money Stock for the year from Japan was recorded as 3.7% against the forecast of 3.4% and supported Japanese Yen. At 10:59 GMT, the Prelim Machine Tool Orders for the year showed a decline of -48.3% in comparison to the previous -40.7%.
Daily Support and Resistance
- R3 109.37
- R2 108.57
- R1 108.12
Pivot Point 107.33
- S1 106.88
- S2 106.09
- S3 105.64
USD/JPY – Trading Tips
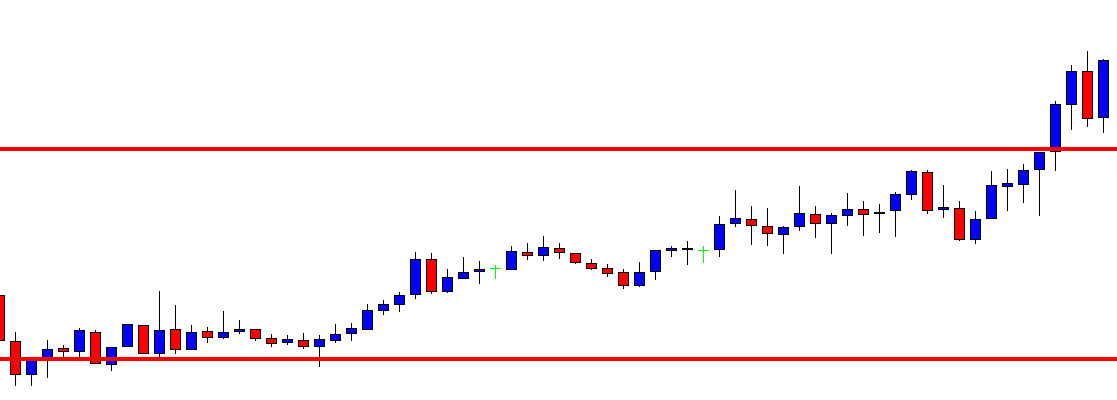
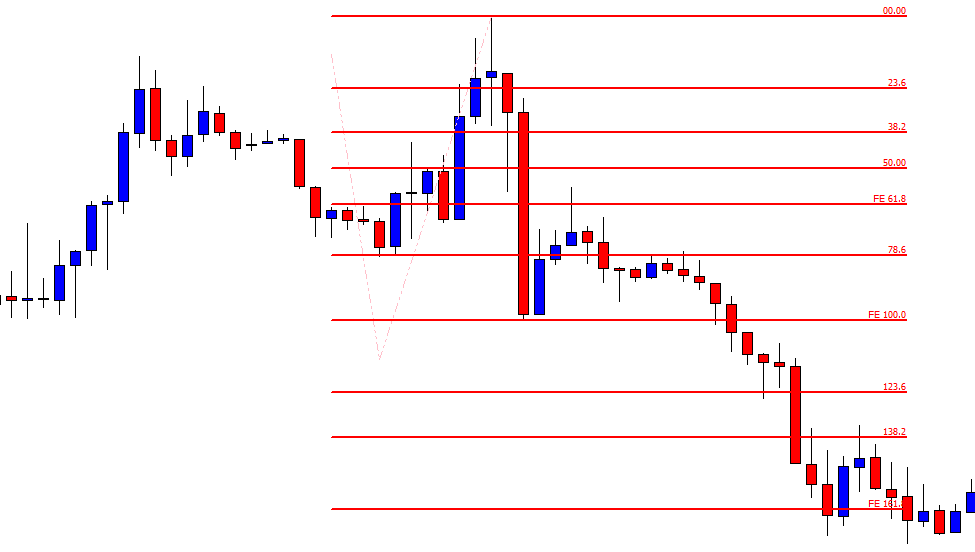
The safe-haven Japanese yen continues to trade in line with our previous forecasts. On Friday, the USD/JPY traded bearishly to trade below the support level of 107, which marked the 50% Fibonacci retracement level. The USD/JPY is holding at 107.05, where the 50 EMA is supporting the pair, and it may drop further below the 107 level. At the moment, the 4-hour candle appears to close below 107 support become resistant, and this may drive more selling in the USD/JPY pair. The pair may extend selling until 106.600 level, whereas the closing of buying candles above 107 can trigger bullish bias until 107.50. By the way, bearish bias seems solid today. All the best for today!


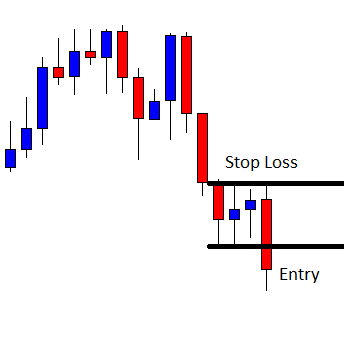


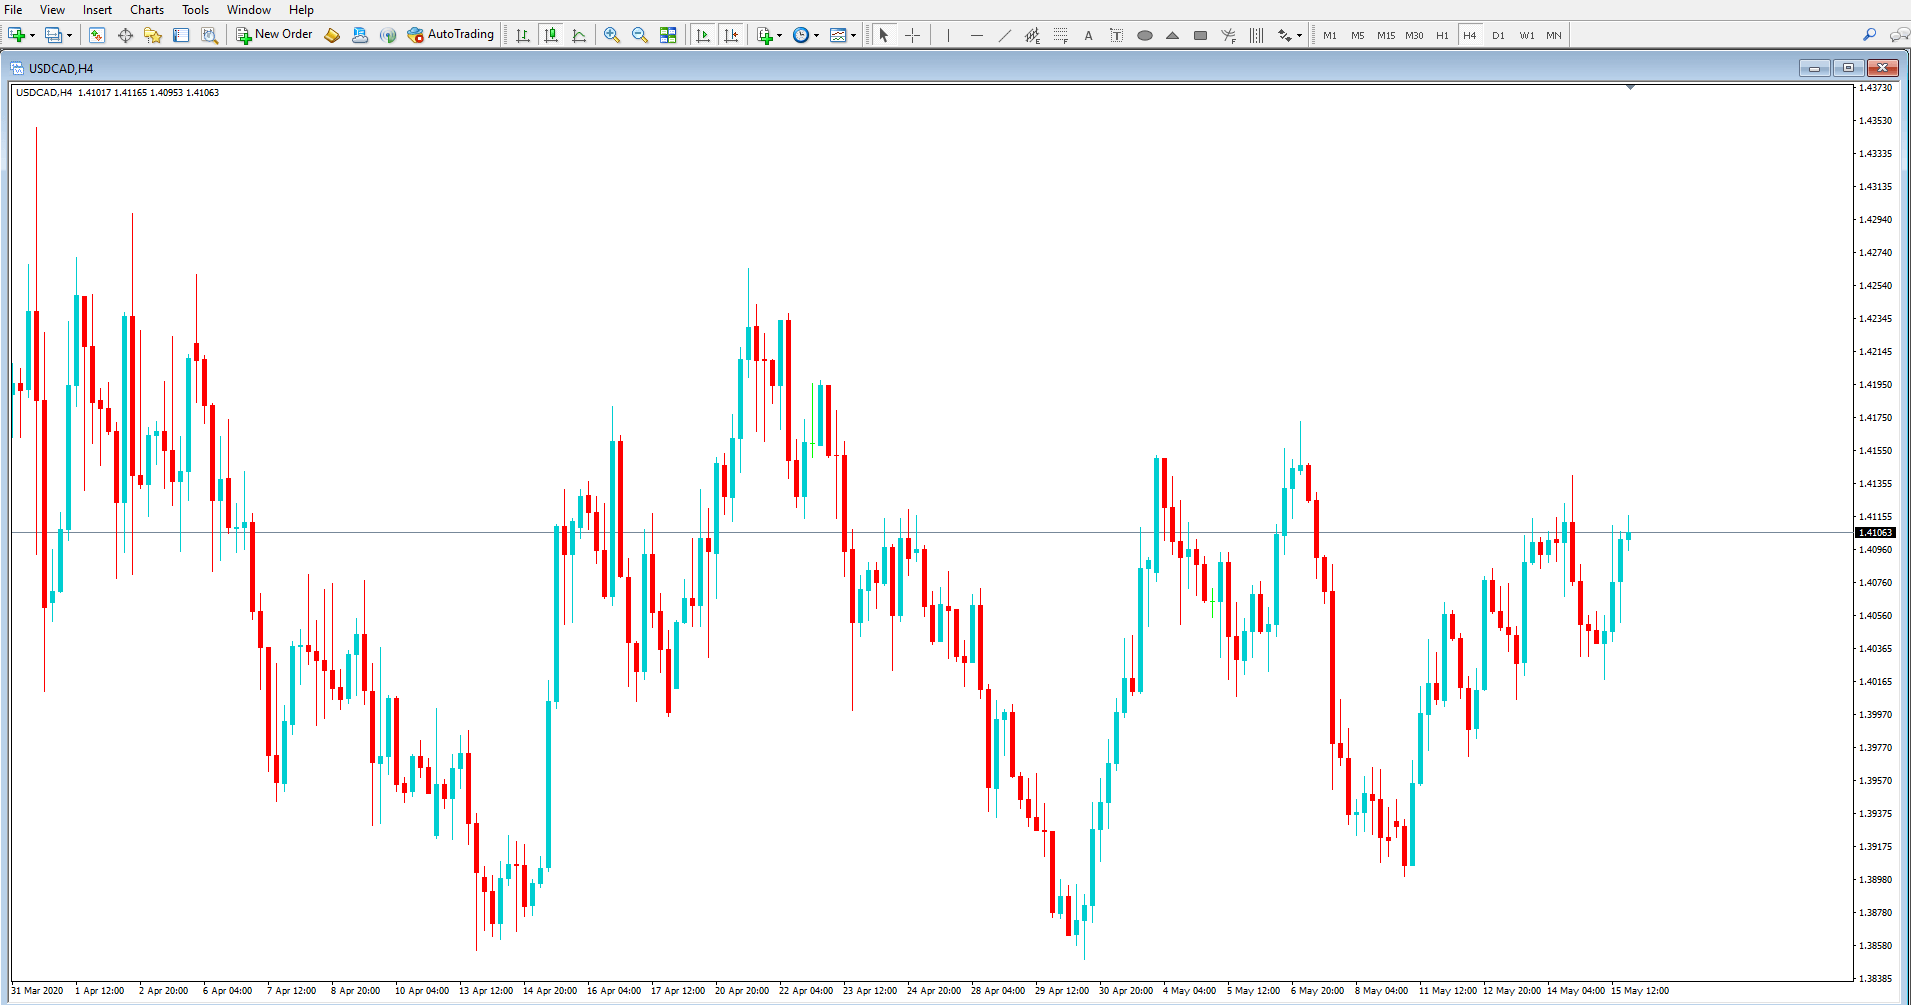
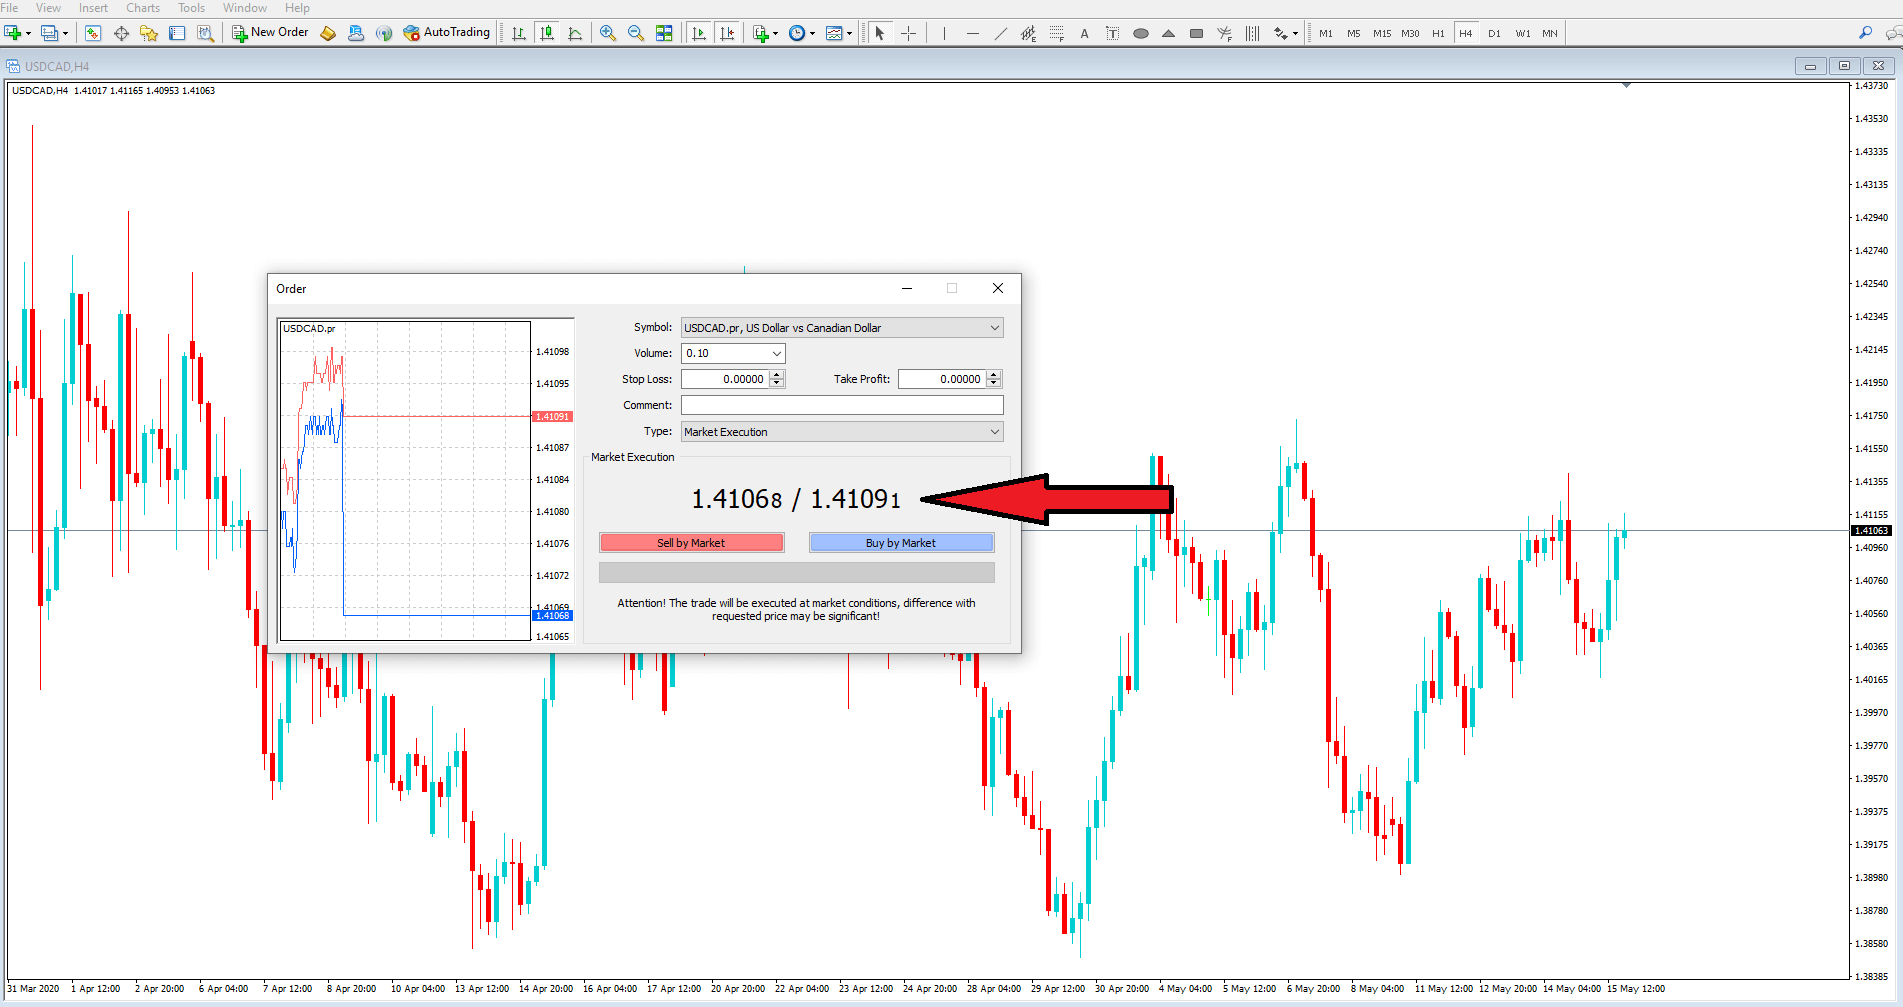
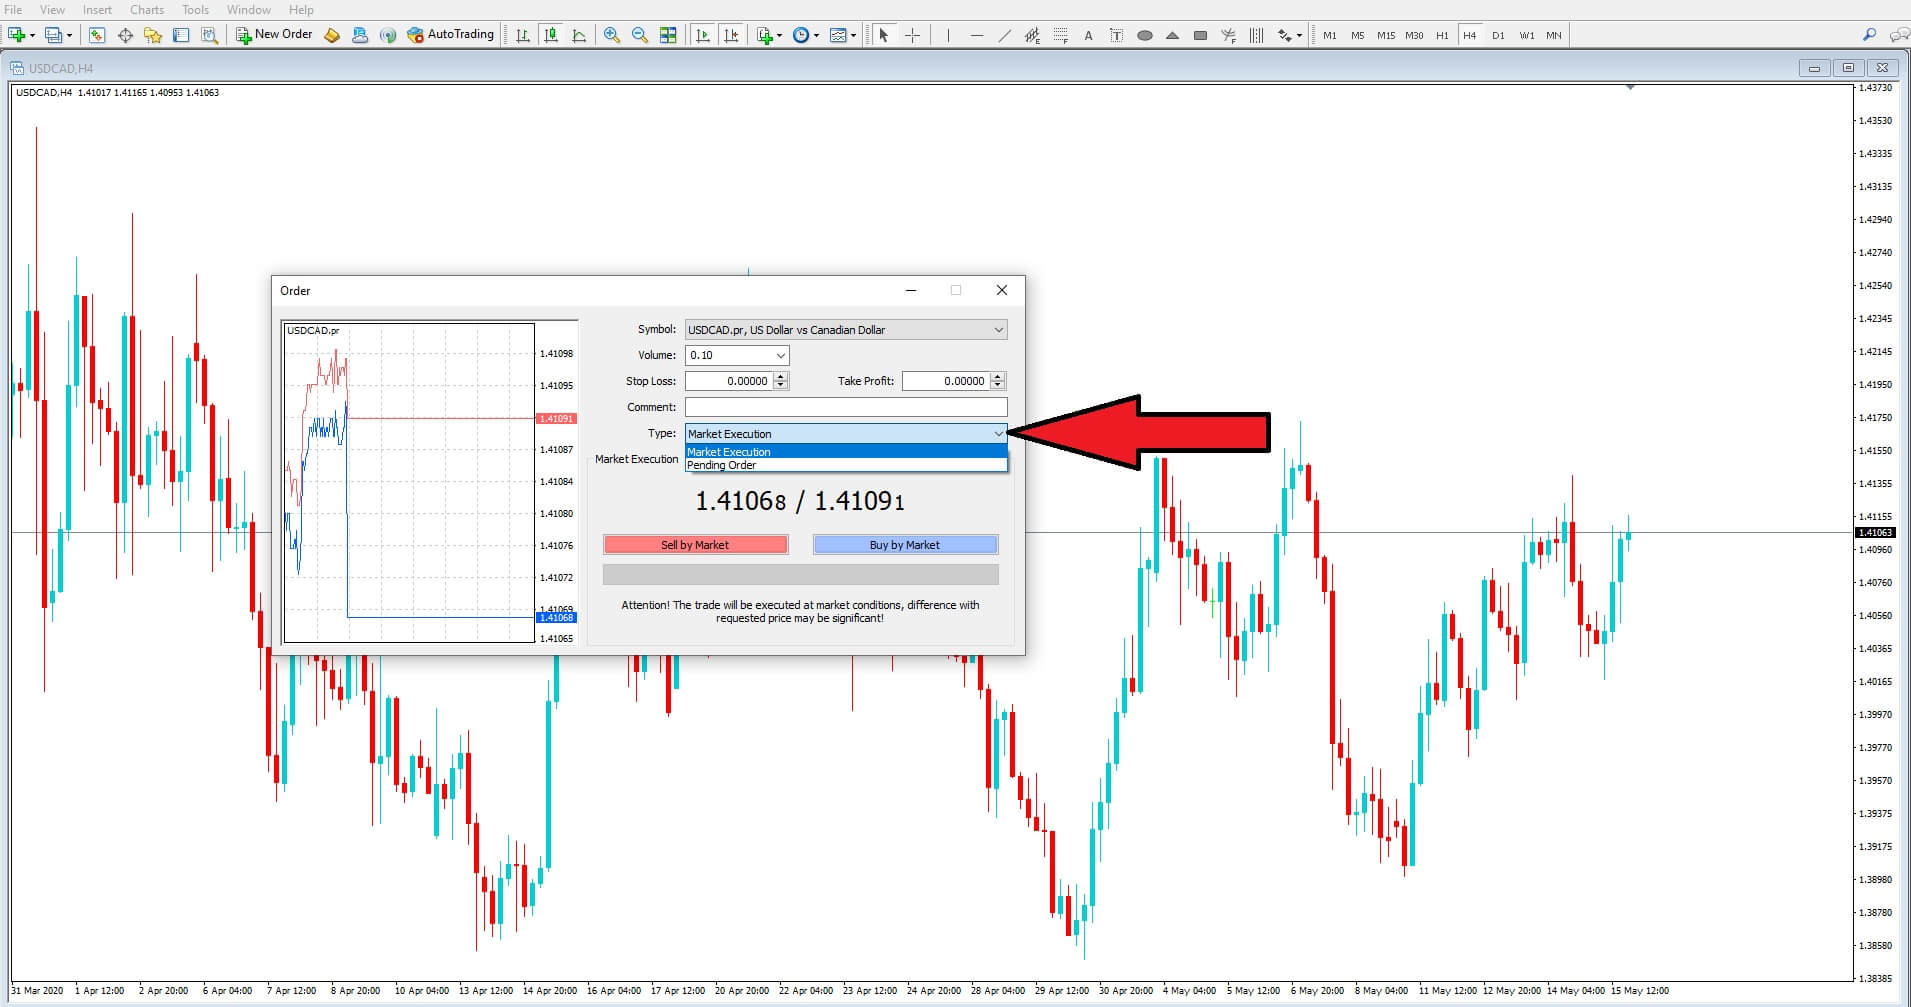
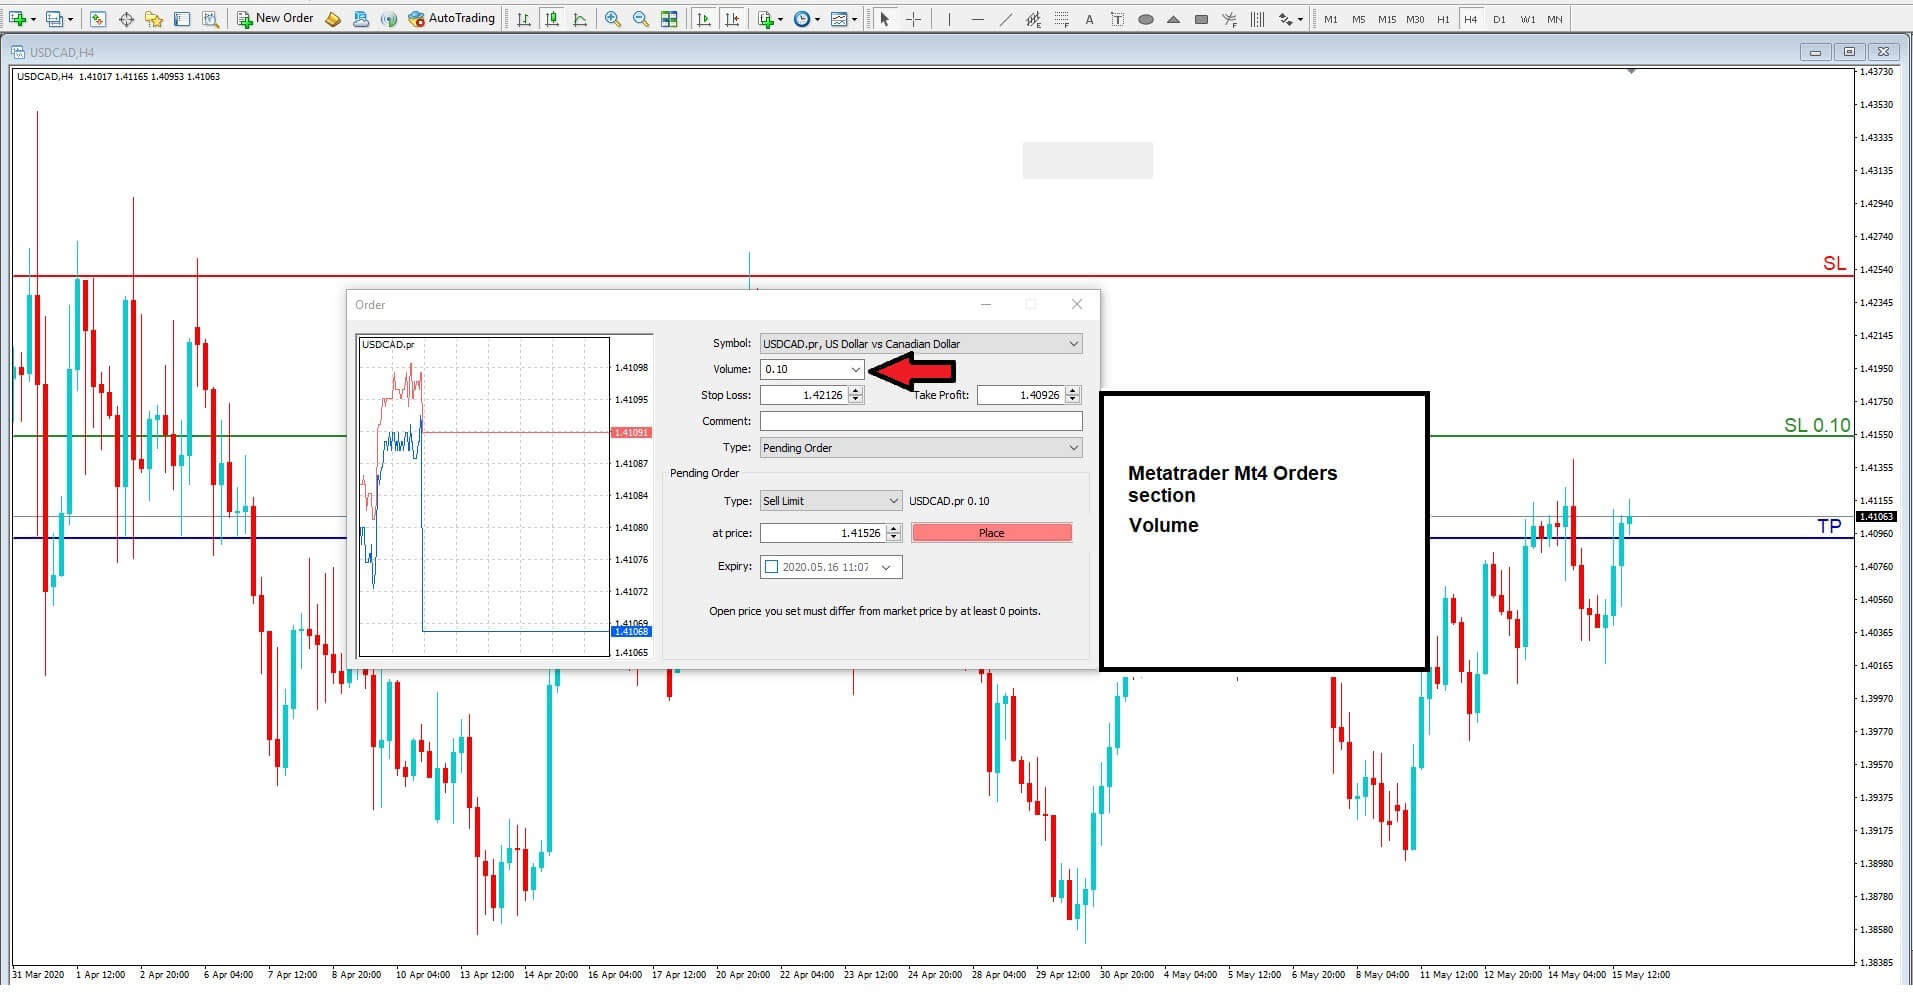
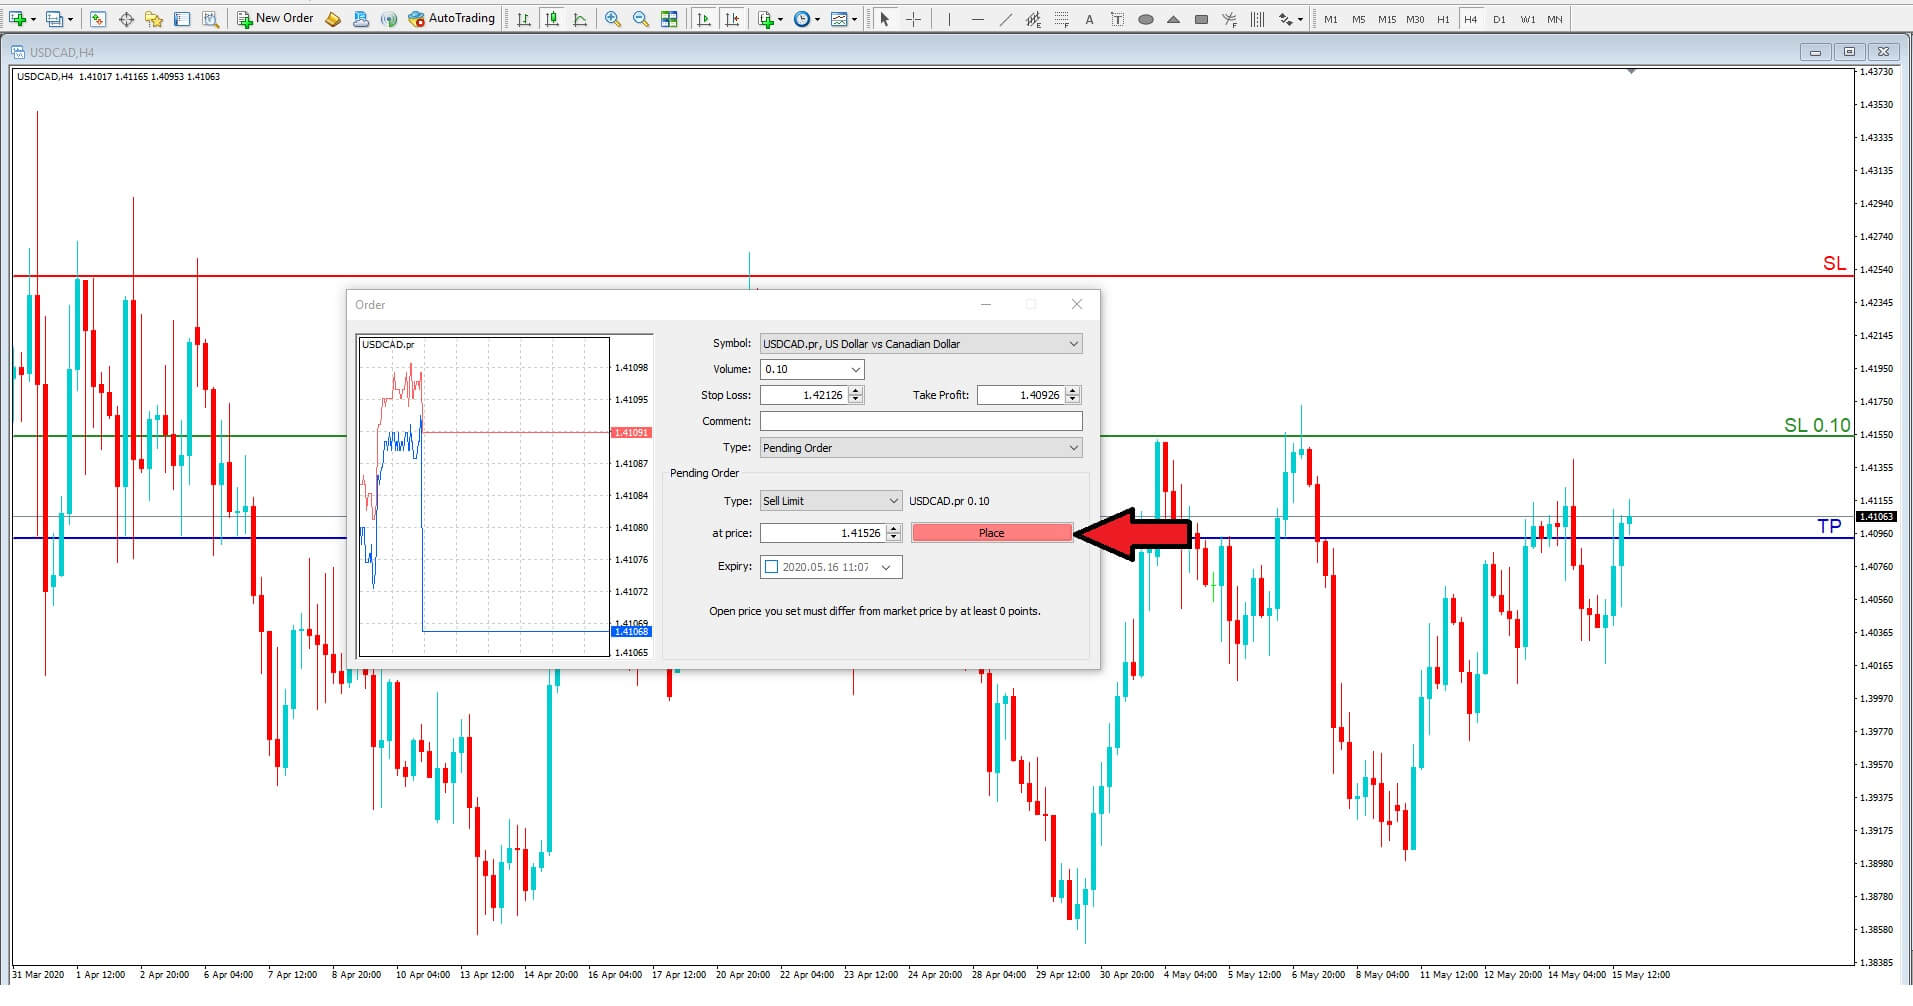
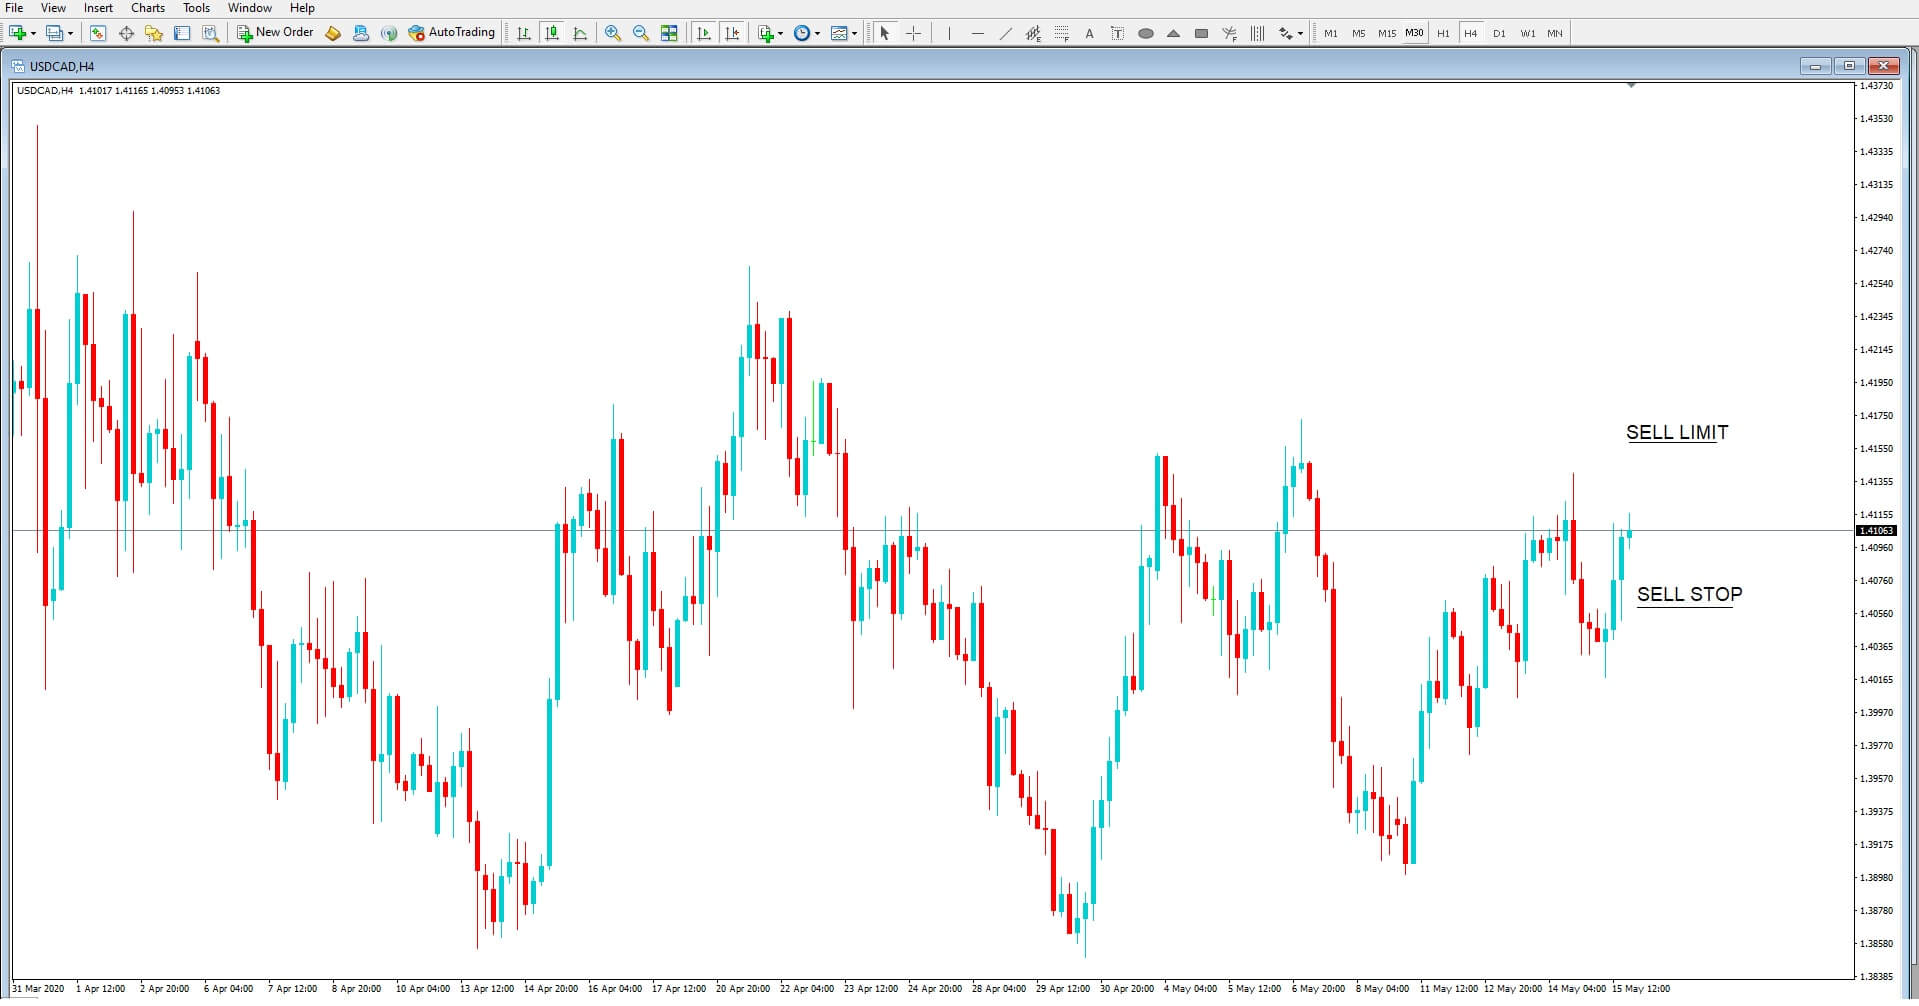
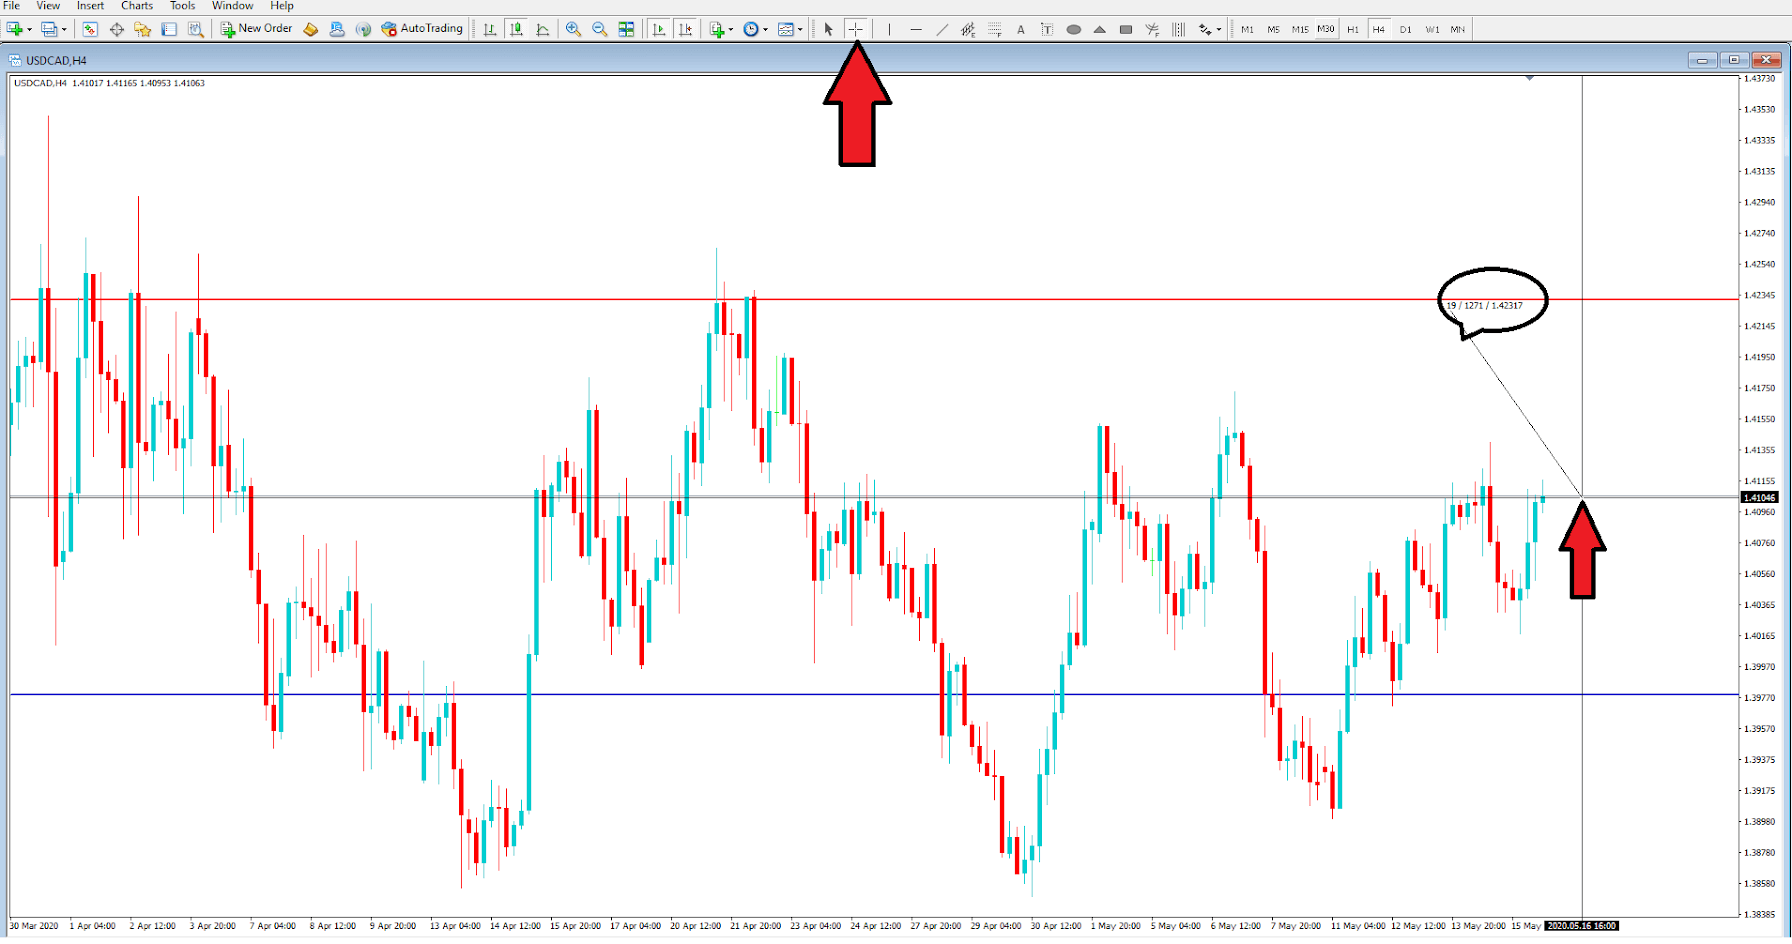
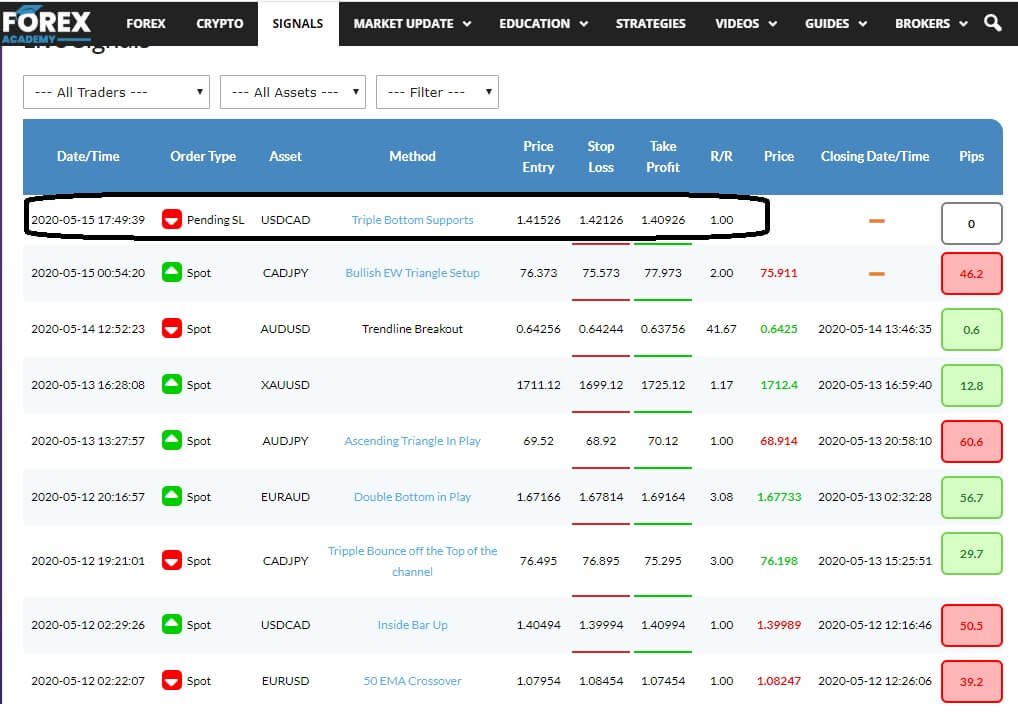 Let’s quickly remind ourselves of the trade we are copying. this is a Sell-limit pending order of the US dollar Cad pair, with an order to sell the pair at some point in the future with no specified cancellation date at an exchange rate of 1.41526 with a stop loss of 1.42126 and a