Categories
Forex Basic Strategies Forex Daily Topic

Partial Profit-taking and Decision-making

Traders on major charts such as the daily and the H4 often take partial profits and let the rest of the trade run to earn more profit. This is an effective way to earn more pips without any doubt. Yes, to do that, traders need to have good ideas about price action and enough experience to interpret the market’s language. In today’s lesson, we are going to demonstrate an example of partial profit-taking and a situation where traders to make a decision. Let us get started.

This is an H4 chart. The price heads towards the North with good bullish momentum. It then consolidates and produces a bullish engulfing candle. The buyers may trigger a long entry right after the last candle closes. Typically, the buyers shall aim to earn 1R.

The next candle comes out as a bullish candle as well. Things look suitable for buyers. It seems they do not have to wait too long to achieve 1R. Let us proceed to the next chart.

Things do not go according to the buyers’ expectations. However, the price hits their 1R target. Look at the last candle. It comes out as a bullish engulfing candle. Thus, the buyers may consider taking partial profit and let the rest of the trade run. Let us assume that the buyers take out their 50% trade. With 1R, they have free trade running.

After two more candles, things look a bit different. Anyway, the buyers must be patient and hold their positions. Overall, price action has been very bullish biased.

After a long while, the price does not know where to go. It gets trapped within two horizontal levels. Have a guess. What should you do here? It is an H4 chart, and the price action has been very choppy recently.

Yes, traders may close the rest of the entry as well. The price is at the breakeven (a bit above). Traders get ½ R here. In most cases, partial profit-taking rewards more. However, in some cases, it may not give us the maximum reward. Another important thing with partial profit-taking is it is to be applied when we trade only on the major charts. We may not consider taking partial profit if we trade on the 5M, the 15M, or the H1 chart. With partial profit-taking, we need to be well acquainted with using trailing stops as well. Only that is when we will be able to make the most out of it.

Categories
Forex Assets

Asset Analysis – USD/RON Forex Exotic Currency Pair

Introduction

USDRON is the abbreviation for the US Dollar against the Romanian Leu. This pair comes under the roof of emerging currency pairs. The volume in this pair is pretty low, and the volatility is high. Here, the US Dollar is referred to as the base currency and the RON the quote currency.

Understanding USD/RON

The fluctuating price in the exchange market specifies the value of RON equivalent to one USD. It is quoted as 1 USD per X RON. For instance, if the market price of this pair is 4.4723, then about 4½ RON is required to buy one US Dollar.

Spread

Spread is the difference between the bid and the ask prices set by the broker. It is not the same with all brokers. It also varies from the type of execution model used by the broker.

ECN: 19 pips | STP: 21 pips

Fees

The fee is the commission that is paid to the broker on each position you take. This, too, varies from the type of execution model. Typically, there is no fee on STP accounts. However, there are a few pips of fee on ECN accounts.

Slippage

Slippage is the difference between the price requested by the client and the price he actually got from the broker. This happens only on market orders. The primary reasons for its occurrence are,

Market’s volatility

Broker’s execution speed

Trading Range in USD/RON

A trading range is the representation of the pip movement in a currency pair for different timeframes. With these values, we can determine the gain or loss in a trade for a specified time frame. All that must be done is, multiply the required value from the below table with the pip value. This will yield the profit/loss for one standard lot.

Procedure to assess Pip Ranges

  1. Add the ATR indicator to your chart
  2. Set the period to 1
  3. Add a 200-period SMA to this indicator
  4. Shrink the chart so you can assess a large time period
  5. Select your desired timeframe
  6. Measure the floor level and set this value as the min
  7. Measure the level of the 200-period SMA and set this as the average
  8. Measure the peak levels and set this as Max.

USD/RON Cost as a Percent of the Trading Range

Apart from assessing the profit or loss on a trade, we can also determine how the cost varies as the volatility changes. Below is a tabular representation of the same.

ECN Model Account

Spread = 19 | Slippage = 3 |Trading fee = 3

Total cost = Slippage + Spread + Trading Fee = 3 + 19 + 3 = 25

STP Model Account

Spread = 21 | Slippage = 3 | Trading fee = 0

Total cost = Slippage + Spread + Trading Fee = 3 + 21 + 0 = 24

The Ideal way to trade the USD/RON

Trading emerging currency pairs is different from trading major and e pairs. This pair’s high volatility and low trading volume make it infeasible to trade any time during the day. So let’s take some info out from the above tables and try finding the ideal times to enter this pair.

From the table, it can be ascertained that the percentage values are high in the min column and pretty low in the max column. This means that the total costs on the trade increases as the volatility decreases. So, to have equilibrium between the two, it is perfect to enter during those times when the volatility is around the average values. This will ensure both sufficient volatility and affordable costs.

Another simple technique to reduce total costs is by trading using limit and stop orders instead of market orders. In doing so, the total costs will reduce significantly as the slippage will not be considered for limit/stop orders. The reduction in the costs is represented in the below table as follows.

Categories
Forex Assets

Analyzing The USD/EGP Exotic Forex Currency Pair

Introduction

USDEGP is the abbreviation for the US Dollar against the Egyptian Pound. The USDEGP is classified under the emerging currency pairs, and the volatility in these pairs is quite high. In this pair, the US Dollar is the base currency and the EGP the quote currency.

Understanding USD/EGP

The price of USDEGP specifies the value of EGP equivalent to one USD. It is quoted as 1 USD per X EGP. So, if the market price of this pair is 15.673, then 15.673 units of EGP are required to purchase one US Dollar.

Spread

The difference between the bid and ask price is referred to as the spread. This value varies from broker to broker as well as how they execute the trade. The approximate spread on ECN and STP accounts is shown below.

ECN: 20 pips | STP: 21 pips

Fees

The fee is a commission that is to be paid to the broker for each trade you execute on an ECN account. On STP accounts, the fee is nil.

Slippage 

The price you receive from the broker is usually different from the price when you executed. And the difference between these two prices is referred to as the slippage. The factors affecting slippage include,

  • Market’s volatility
  • Broker’s execution speed

Trading Range in USD/EGP

The trading range is a tabular representation of the pip movement in a currency pair for different timeframes. With it, one can assess their risk on the trade for each given timeframe.

Procedure to assess Pip Ranges

  1. Add the ATR indicator to your chart
  2. Set the period to 1
  3. Add a 200-period SMA to this indicator
  4. Shrink the chart so you can assess a large period
  5. Select your desired timeframe
  6. Measure the floor level and set this value as the min
  7. Measure the level of the 200-period SMA and set this as the average
  8. Measure the peak levels and set this as Max.

USD/EGP Cost as a Percent of the Trading Range

As the name pretty much suggests, this is a trading range table that represents cost variations (in terms of percentage) for different timeframes and volatilities. These values are useful in determining the ideal times of the day to trade this pair.

ECN Model Account

Spread = 20 | Slippage = 3 |Trading fee = 3

Total cost = Slippage + Spread + Trading Fee = 3 + 20 + 3 = 26

STP Model Account

Spread = 21 | Slippage = 3 | Trading fee = 0

Total cost = Slippage + Spread + Trading Fee = 3 + 21 + 0 = 24

The Ideal way to trade the USD/EGP

In emerging currencies, the volatility is high, and the traded volume is low. So is it not ideal to enter the market any time during the day. So, let’s interpret the above tables and find the best times of the day to trade this currency pair.

The magnitude of the percentage is directly proportional to the cost of the trade. And since the percentage is higher in the min column, we can conclude that as the volatility increases, the cost reduces. However, our main aim is not only to reduce costs but to have good volatility and trading volume as well. Hence, to ensure both, it is ideal to trade when the volatility is at/above the average values in the volatility table.

Moreover, one can bring their costs slightly lower by trading using limit orders instead of market orders. This will cut off the slippage on the total cost of the trade. An example of the same is given below.

Categories
Forex Assets

Learning The Costs Involved While Trading The USD/RUB Pair

Introduction

USD/RUB is the tick symbol for the US Dollar against the Russian Ruble. This emerging currency pair has high volatility and usually low volume. Here, the US Dollar is the base currency, and the RUB is the quote currency.

Understanding USD/RUB

The price of this pair determines the value of RUB that’s equivalent to one US Dollar. It is quoted as 1 USD per X RUB. For example, if the market price of this pair was 68.69, then these many Rubles are required to purchase one US Dollar.

Spread

It is the difference between the bid price and ask price in the exchange market. This value is set by the brokers and varies from each other. Also, it varies on the type of execution model.

ECN: 21 pips | STP: 23 pips

Fees

This fee is levied by stockbrokers as well. The fee on ECN and STP account is given below.

ECN: 3-10 pips | STP: 0 pips

Slippage

The difference between the investor’s intended price and the real price executed by the broker is called slippage. Slippage happens solely due to the changes in the market’s volatility and speed with which the broker executes a trade.

Trading Range in USD/RUB

The trading range is a tabular illustration of the minimum, average, and maximum volatility in a currency pair for a given timeframe. Using these values, traders can quickly assess their risk on the trade for any of the given timeframes.

Procedure to assess Pip Ranges

  1. Add the ATR indicator to your chart
  2. Set the period to 1
  3. Add a 200-period SMA to this indicator
  4. Shrink the chart so you can assess a substantial period
  5. Select your desired timeframe
  6. Measure the floor level and set this value as the min
  7. Measure the level of the 200-period SMA and set this as the average
  8. Measure the peak levels and set this as Max.

USD/RUB Cost as a Percent of the Trading Range

Total cost is the sum of the slippage, spread, and the trading fee. This varies based on the volatility of the market. And below is a table that represents the cost variation for different volatilities.

ECN Model Account

Spread = 21 | Slippage = 3 |Trading fee = 3

Total cost = Slippage + Spread + Trading Fee = 3 + 21 + 3 = 27

STP Model Account

Spread = 23 | Slippage = 3 | Trading fee = 0

Total cost = Slippage + Spread + Trading Fee = 3 + 23 + 0 = 26

The Ideal way to trade the USD/RUB

Note that, the larger the value of the percentages, the higher is the cost on the trade and vice versa. The table clearly says the costs are high for low volatilities as the magnitudes of costs are high in the min column. But, it is not really ideal to trade in these extreme regions. To ensure decent volatility with comparatively low costs, it is ideal to trade this pair when the Volatility is around the average value in the trading range table.

We can see that slippage is a pretty heavy variable in the total costs. However, it can be nullified simply by placing orders using limit/stop orders rather than market orders. The drop in the total costs on the trade is represented in the below table as follows.

We can see, also that there are substantial costs when trading the USDRUB pair, even ion a daily timframe. That means that you will need to be right on direction and extension of the movement to be profitable, because, on an average trading range it would require about 12 hours of positive price movement to cover the trading costs. Therefore it is recommended to trade this exotic pair on swings of more than a week, to reduce the percent of the movement that is absorbed by the trade cost.


Categories
Forex Assets

Understanding The USD/PLN Exotic Currency Pair

Introduction

USD/PLN is the abbreviation for the US dollar against the Polish Zloty. It is an emerging currency pair in the forex market. The volatility in this pair is high, and the trading volume is less compared to major and cross currencies. In this pair, USD is the base currency, and PLN is the quote currency.

Understanding USD/PLN

The value of this pair determines the value of PLN that is equal to one US dollar. It is quoted as 1 USD per X PLN. For example, if the value of this pair is 3.8146, then around 4 PLN is required to buy one USD.

Spread

In forex, one of the most used terms is the spread. Spread is the difference between the bid price and the ask price of the market. This value is decided by the broker and varies from the type of account model.

ECN: 18 pips | STP: 21 pips

Fees

There is some fee on every trade you execute. And this, too, varies from type of account model. For instance, there is no fee on the STP account and a few pips on ECN accounts.

Slippage

Slippage occurs only on market orders. By definition, it is the difference between the trader’s required price for execution and the actual price the order was executed. This value depends on the broker’s execution speed and the market’s volatility.

Trading Range in USD/PLN

Assessing the profit that you can make and the loss that you can incur is a vital risk management tool. And below is a table that represents the minimum, average, and maximum volatility in different timeframes, which will help determine profit/loss values.

Procedure to assess Pip Ranges

  1. Add the ATR indicator to your chart
  2. Set the period to 1
  3. Add a 200-period SMA to this indicator
  4. Shrink the chart so you can determine a large period
  5. Select your desired timeframe
  6. Measure the floor level and set this value as the min
  7. Measure the level of the 200-period SMA and set this as the average
  8. Measure the peak levels and set this as Max.

USD/PLN Cost as a Percent of the Trading Range

An excellent application to the above table is the cost as a Percent of the Trading Range. The below tables illustrate how the cost varies based on the volatility of the market. And these values will help us an idea on the best times of the day to enter into this currency pair.

ECN Model Account

Spread = 18 | Slippage = 3 |Trading fee = 3

Total cost = Slippage + Spread + Trading Fee = 3 + 18 + 3 = 24

STP Model Account

Spread = 21 | Slippage = 3 | Trading fee = 0

Total cost = Slippage + Spread + Trading Fee = 3 + 21 + 0 = 24

The Ideal way to trade the USD/PLN

Before getting right into it, let us comprehend what the tables actually mean. The higher the value of the percentage, the higher is the cost of the trade and vice versa. From the table, we can clearly ascertain that the percentages are high in the first (min) column, indicating that the costs are high when the market volatility is low.

Now, talking the ideal time to trade this currency pair, you may trade this pair during those times when the volatility is above the average values. In doing so, you will be assured with sufficient volatility and low costs as well.

Furthermore, if you wish to reduce your costs much more, you may place orders using the limit/stop instead of the market. This will completely nullify the slippage on the trade and will, in turn, bring down the total costs significantly. As an example, the above table, when the slippage is made, is nil is illustrated below.

Categories
Forex Assets

Trading The USD/CZK Exotic Forex Currency Pair

Introduction

USDCZK is the short-form for the US Dollar against the Czech Koruna. Since CZK is involved in this pair, it is classified as an exotic currency pair. Here, the US Dollar is called the base currency and the CZK the quote currency.

Understanding USD/CZK

The value of USDCZK determines the value of CZK equivalent to one USD. It is quoted as 1 USD per X CZK. So, if the market value of this pair is 22.4773, then many Koruna is required to buy one US Dollar.

Spread

Spread is the difference between the bid and the ask prices set by the broker. The amount of spread varies based on the type of execution model.

ECN: 16 pips | STP: 18 pips

Fees

The fee is a commission that has to be paid to the broker for every trade the clients take. This value depends on the type of execution model used by the broker. As a matter of fact, there is no fee on STP accounts.

Slippage

The difference between the trader’s required price and the broker’s executed price is referred to as the slippage. The slippage size depends on the broker’s execution speed and the volatility of the market.

Trading Range in USD/CZK

The minimum, average, and maximum volatility of the market are necessary to assess the profit/loss that can be made on a trade. And is a representation of the same for USDCZK.

Procedure to assess Pip Ranges

  1. Add the ATR indicator to your chart
  2. Set the period to 1
  3. Add a 200-period SMA to this indicator
  4. Shrink the chart so you can determine an extensive period
  5. Select your desired timeframe
  6. Measure the floor level and set this value as the min
  7. Measure the level of the 200-period SMA and set this as the average
  8. Measure the peak levels and set this as Max.

USD/CZK Cost as a Percent of the Trading Range

The total cost depends on the volatility of the market. Below is a table that shows the variation in the total costs for different volatilities in terms of percentages.

NOTE: These percentages are obtained by finding the ratio between the total cost and the volatility of the market in different timeframes.

ECN Model Account

Spread = 16 | Slippage = 3 |Trading fee = 3

Total cost = Slippage + Spread + Trading Fee = 3 + 16 + 3 = 22

STP Model Account

Spread = 18 | Slippage = 3 | Trading fee = 0

Total cost = Slippage + Spread + Trading Fee = 3 + 18 + 0 = 21

The Ideal way to trade the USD/CZK

The volatility in this currency pair is pretty high compared to major and minor currency pairs. And the costs are low by default for the exotic currency pairs. However, it is not ideal for this pair at any time.

The main focus of exotic currencies is to trade when the volatility is not too high. Hence, trading when the volatility is around average and maximum values in the volatility table will ensure decent volatility with lower costs as well.

Another simple technique to reduce costs is by placing limit/stop orders instead of executing by the market. In doing so, the slippage will be taken away from the total costs, which will, in turn, reduce the total cost of the trade.

Categories
Forex Assets

Asset Analysis – EUR/HKD Exotic Currency Pair

Introduction

EUR/HKD is the abbreviation for the Euro area’s euro against the Hong Kong dollar. It is classified as an exotic currency pair that usually has high volatility and low trading volume. Here, the EUR is the base currency, and the HKD is the quote currency.

Understanding EUR/HKD

The current value of the pair represents the value of HKD that is equivalent to one USD. It is quoted as 1 EUR per X HKD. For example, if the value of this pair is 9.8764, then these many units of HKD are required to buy one US dollar.

Spread

In trading, the difference between the bid price and the ask price is referred to as the spread. Spread typically varies from broker to broker. The approximate spread on ECN and STP accounts is given below.

ECN: 17 pips | STP: 18 pips

Fees

The fee is the commission you pay to your broker for each position you open. The value of this, too, is in the hands of the broker. However, note that there are no fee STP accounts.

Slippage

Slippage is the difference between the price at which the trader executed the trade and the price he actually received from the broker. Essentially, slippage depends on two factors:

  • Broker’s execution speed
  • Market’s volatility

Trading Range in EUR/HKD

Knowing how much profit you can make or how much loss you can incur in a trade in a specific time frame is vital. The Trading Range can be assessed using the table given below. It represents the minimum, average, and maximum pip movement in EURHKD in different timeframes.

Procedure to assess Pip Ranges

  1. Add the ATR indicator to your chart
  2. Set the period to 1
  3. Add a 200-period SMA to this indicator
  4. Shrink the chart so you can determine a large period
  5. Select your desired timeframe
  6. Measure the floor level and set this value as the min
  7. Measure the level of the 200-period SMA and set this as the average
  8. Measure the peak levels and set this as Max.

EUR/HKD Cost as a Percent of the Trading Range

Total cost is not constant for every trade you take. It varies based on the volatility of the market. And the variation of it can be obtained from the two tables given below.

ECN Model Account

Spread = 17 | Slippage = 3 |Trading fee = 3

Total cost = Slippage + Spread + Trading Fee = 3 + 17 + 3 = 23

STP Model Account

Spread = 18 | Slippage = 3 | Trading fee = 0

Total cost = Slippage + Spread + Trading Fee = 3 + 18 + 0 = 21

The Ideal way to trade the EUR/HKD

Exotic currency pairs tend to have high volatility and low volume. And it is not ideal to trade during these times. So, let us find out the best times of the day to trade this currency pair by comprehending the above tables.

The higher percentages depict higher costs on the trade. It can be ascertained that the percentages are on the upper side in the min column. Hence, we can conclude that the costs are high when the volatility of the market is high and vice versa.

And, when it comes to determining the right time to enter the market, one may open positions when the volatility of the market is around the average volatility. This method will ensure both decent volatility and low costs.

Market orders result in slippage, and limit orders do not. Hence, placing limit orders is another way through which one can considerably reduce their total costs on the trade.

Categories
Forex Assets

Analyzing The USD/NOK Exotic Forex Currency Pair

Introduction

USD/NOK is the abbreviation for the US Dollar against the Norwegian Krone. This pair comes under the classification of exotic currency pairs. In this pair, USD is the base, and NOK is the quote currency.

Understanding USD/NOK

The value of USDNOK determines the value of NOK that is equivalent to one US Dollar. It is quoted as 1 USD per X NOK. So, if the market value of this pair is 9.2913, then these many units of Norwegian Krone are required to buy one US Dollar.

Spread

Spread is the difference between the bid price and the ask price in the market. This difference is the revenue for the brokers. Spread typically varies on how the broker executes the trades. The approximate spread on ECN and STP accounts is given below.

ECN: 13 pips | STP: 15 pips

Fees

The commission that a broker charges their clients is referred to as the fee. This is not constant and varies from broker to broker. The fee on ECN accounts is around 5-10 pips, and on STP accounts, it is nil.

Slippage

Slippage is the difference between the trader’s demanded price and the actual executed price. Market volatility and the broker’s execution speed are the reasons for slippage to occur.

Trading Range in USD/NOK

A trading range is the tabular representation of the minimum, average, and maximum pip movement in a currency pair. Below are the values of USDNOK that help us assess the profit/loss one can incur in a trade.

Procedure to assess Pip Ranges

  1. Add the ATR indicator to your chart
  2. Set the period to 1
  3. Add a 200-period SMA to this indicator
  4. Shrink the chart so you can determine a large time period
  5. Select your desired timeframe
  6. Measure the floor level and set this value as the min
  7. Measure the level of the 200-period SMA and set this as the average
  8. Measure the peak levels and set this as Max.

USD/NOK Cost as a Percent of the Trading Range

Here we take the ratio of the total cost on the trade and the volatility values and represent them in percentages. These percentages are then used to determine the cost variation in trade in different timeframes.

ECN Model Account

Spread = 13 | Slippage = 3 |Trading fee = 3

Total cost = Slippage + Spread + Trading Fee = 3 + 13 + 3 = 19

STP Model Account

Spread = 15 | Slippage = 3 | Trading fee = 0

Total cost = Slippage + Spread + Trading Fee = 3 + 15 + 0 = 18

The Ideal way to trade the USD/NOK

In this section, we interpret what the above percentages actually mean and how to make use of it.

The magnitude of the percentages represents how high or low are the costs of trade. So the higher the values, the higher is the cost and vice versa. From the table, it can be ascertained that the costs are pretty on the higher in the min column. This means that the costs are high when the market’s volatility is low. But it is not ideal to trade during these times due to high costs.

To have an equilibrium on costs as well as volatility, it is perfect for entering during those times when the volatility of the current market is around the average values.

Now, if you still wish to reduce your costs, you may trade using limit orders instead of market orders. This will completely nullify the slippage on the trade and hence bring down the total cost as well.

Categories
Forex Assets

Everything About The USD/MXN Forex Currency Pair

Introduction

USDMXN is the abbreviation for the US Dollar against the Mexican Peso. It is classified as an exotic currency pair that usually has high volatility and low trading volume. Here, the US Dollar (on the left) is the base currency, and the MXN (on the right) is the quote currency.

Understanding USD/MXN

The market price of USDMXN represents the value of MXN that are required to purchase to one US Dollar. It is quoted as 1 USD per X MXN. So, if the market price of this pair is 18.7615, then this amount of MXN is required to buy one USD.

Spread

The difference between the bid and the ask price is referred to as the spread. Its value varies from the type of execution model of the broker.

ECN: 16 pips | STP: 17 pips

Fees

For every position a client takes from the broker, he must pay some fee on each. Note that there is no fee on STP accounts. However, there are few pips of fees on ECN accounts.

Slippage

The difference between the price requested by the client and the price that was given by the broker is referred to as the slippage. Its value depends on the volatility of the market and the broker’s execution.

Trading Range in USD/MXN

Assessing the amount of money you will win and lose beforehand, in a particular timeframe is critical in trading. Below is a volatility table through which one can determine the minimum, average, and maximum profit/loss they can encounter in a specified timeframe.

Procedure to assess Pip Ranges

  1. Add the ATR indicator to your chart
  2. Set the period to 1
  3. Add a 200-period SMA to this indicator
  4. Shrink the chart so you can assess a large time period
  5. Select your desired timeframe
  6. Measure the floor level and set this value as the min
  7. Measure the level of the 200-period SMA and set this as the average
  8. Measure the peak levels and set this as Max.

USD/MXN Cost as a Percent of the Trading Range

By applying the total cost to the above table, we can even determine the cost variation in a trade. The ratio between the two expressed in percentage will help us determine the ideal times of the day to trade the currency pair.

ECN Model Account

Spread = 16 | Slippage = 3 |Trading fee = 3

Total cost = Slippage + Spread + Trading Fee = 3 + 16 + 3 = 22

STP Model Account

Spread = 17 | Slippage = 3 | Trading fee = 0

Total cost = Slippage + Spread + Trading Fee = 3 + 17 + 0 = 20

The Ideal way to trade the USD/MXN

Comprehending the above tables is simple. The percentage values are directly proportional to the total cost of the trade. It is seen that the percentages are comparatively high on the min column and vice versa. Now, coming to the ideal time to enter the market, it would be when the volatility of USDMXN is somewhere around the average pip movement. Trading in such moments will ensure low costs as well as lower liquidity.

Furthermore, you reduce costs by placing orders using limit/pending orders instead of market orders. This will significantly bring down the total costs as the slippage will be zero at this point in time. I hope this article will help you trade this pair in a much efficient way. Cheers!

Categories
Forex Assets

Understanding The Trading Costs Involved In USD/TRY Exotic Currency Pair

Introduction

USDTRY, an exotic currency pair, is the abbreviation for the US Dollar against the Turkish Lira. One can expect high volatility in these pairs. Here, the US Dollar is called the base currency and TRY the quote currency.

Understanding USD/TRY

The value of USDTRY depicts the value of TRY equivalent to one USD. It is quoted as 1 USD per X TRY. So, if the market value of this pair is 5.9878, then 5.9878 Liras are required to buy one US Dollar.

Spread

Spread is the difference between the bid price in the market and the ask price in the market. These prices are set by the brokers. Hence, the prices from each broker differ. Moreover, it varies from the type of execution as well.

ECN: 12 pips | STP: 14 pips

Fees

The commission that you pay to your broker for taking a position in a currency pair is a fee on the trade. This, too, depends on the type of execution model. There is typically no fee on STP accounts. And on ECN accounts, there are a few pips of fees.

Slippage

Slippage is the difference between the trader’s requested price and the broker’s executed price. It depends on two factors, namely, the broker’s execution speed and market volatility.

Trading Range in USD/TRY

The trading range is the range of the pip movement in a currency pair on different timeframes. With it, traders can determine their minimum, average, and maximum risk on a trade in a specified time frame.

Procedure to assess Pip Ranges

  1. Add the ATR indicator to your chart
  2. Set the period to 1
  3. Add a 200-period SMA to this indicator
  4. Shrink the chart so you can determine a large time period
  5. Select your desired timeframe
  6. Measure the floor level and set this value as the min
  7. Measure the level of the 200-period SMA and set this as the average
  8. Measure the peak levels and set this as Max.

USD/TRY Cost as a Percent of the Trading Range

Apart from knowing how many pips the market moves in a given timeframe, it is also necessary to understand the total cost variation in a trade. And below are two tables (for ECN and STP) that will help determine the best time of the day to trade in the currency pair with reduced costs.

ECN Model Account

Spread = 12 | Slippage = 3 |Trading fee = 3

Total cost = Slippage + Spread + Trading Fee = 3 + 12 + 3 = 18

STP Model Account

Spread = 14 | Slippage = 3 | Trading fee = 0

Total cost = Slippage + Spread + Trading Fee = 3 + 14 + 0 = 17

The Ideal way to trade the USD/TRY

The costs on major currencies are pretty low, and the volatility is great. So it is ideal to enter any time in the market to trade these pairs. But, when it comes to exotic pairs, the volatility, as well as the costs, are quite high. Hence, one must be aware of when exactly they should trade these currencies.

The percentages in the above tables are directly proportional to the volatility of the market. Hence, we can conclude that costs are when the volatility is low and vice versa.

To determine the ideal times of the day to trade, you must glance at the volatility table and check if the current volatility if nearby the average values mentioned in the tables. If they are more or less in that range, you are good to trade that currency pair because this will assure a balance between both volatilities as well as costs.

Also, another simple way to reduce costs is by getting rid of the slippage on the trade. This can be done by executing orders using limit orders instead of market orders. In doing so, the total costs will reduce by a significant amount, and so will the cost of the trade.

Categories
Forex Assets

Trading The USD/SEK Exotic Forex Currency Pair

Introduction

USDSEK, the US Dollar against the Swedish Krona, is an exotic currency pair in the forex market. USD is called the base currency and SEK the quote currency. Coming under the classification of exotic pairs, the volatility in this pair is pretty high.

Understanding USD/SEK

The value of USDSEK represents the quantity of SEK that is required to purchase one US Dollar. It is quoted as 1 USD per X SEK. So, if the current of this pair is 9.6123, then these many units of Swedish krona are required to buy one US Dollar.

Spread

Spread is the difference between the bid price and the ask price set by your broker. It varies from each broker. It also varies on how they execute the trade as well.

ECN: 12 pips | STP: 14 pips

Fees

There is some fee associated with each trade you take in the market. The fee, too, varies from broker to broker and the type of execution model.

Fee on ECN – 5-10 pips

Fee on STP – 0

Slippage

Slippage is the algebraic difference between the price needed by the client and the price the broker actually gave him. There is this difference due to the market’s volatility and the speed of execution of the trade. Note that slippage is quite high on exotic pairs.

Trading Range in USD/SEK

The below table is the representation of the minimum, average, and maximum pip movement on the USDSEK pair. These values help us assess the gain that can be made or loss that can be incurred in a trade in a given timeframe.

Procedure to assess Pip Ranges

  1. Add the ATR indicator to your chart
  2. Set the period to 1
  3. Add a 200-period SMA to this indicator
  4. Shrink the chart so you can determine a large time period
  5. Select your desired timeframe
  6. Measure the floor level and set this value as the min
  7. Measure the level of the 200-period SMA and set this as the average
  8. Measure the peak levels and set this as Max.

USD/SEK Cost as a Percent of the Trading Range

An application to the above table is the cost variation in a trade. By calculating the ratio between the total cost and the volatility values, we can determine the perfect times of the day to trade in the market. The comprehension of it is discussed in the upcoming topics.

ECN Model Account

Spread = 12 | Slippage = 3 |Trading fee = 3

Total cost = Slippage + Spread + Trading Fee = 3 + 12 + 3 = 18

STP Model Account

Spread = 14 | Slippage = 3 | Trading fee = 0

Total cost = Slippage + Spread + Trading Fee = 3 + 14 + 0 = 17

The Ideal way to trade the USD/SEK

Trading exotic currency pairs are different from trading major and minor currency pairs because volatility and volume are different. And when it comes to costs, the costs are higher in exotic pairs compared to major and minor pairs.

The magnitude of the percentage depicts the costs on the trade and is proportional to it. High values in the min column tell that the costs are high when the market volatility is low and vice versa.

To have sufficient volatility with affordable costs, one may trade those times when the volatility is around the average values.

Moreover, limit orders also help in reducing the costs by a significant amount. This is because only market orders have slippage, and limit orders don’t. Hence, cutting off slippage from the total costs will reduce the costs of the trade considerably.

Categories
Forex Assets

Analyzing The USD/HUF Forex Exotic Currency Pair

Introduction

The US Dollar versus the Hungarian Forint, in short, is represented as USDHUF. It is an exotic currency pair in the forex market. It has got high volatility and lower volume compared to major and minor currencies. Here, USD is the base currency, and HUF is the quote currency.

Understanding USD/HUF

The value of this pair represents the number of HUF that are required to buy one US Dollar. It is quoted as 1 USD per X HUF. If the current market price of USDHUF is 307.72, these many Hungarian Forints are needed to purchase one unit of USD.

Spread

Spread is the primary way through which brokers generate revenue from their clients. The pip difference between the bid price and the ask price is their revenue, which is referred to as the spread. Spread is different on ECN accounts and STP accounts.

ECN: 16 pips | STP: 15 pips

Fees

On ECN accounts, one has to pay some pips of fee on each position you take. The fee is usually high on exotic pairs and comparatively less on major and minor pairs. However, on STP accounts, the fee is nil.

Slippage

Slippage in trading is the difference between the client’s intended price and the price the broker actually gave him. Slippage is affected by two factors:

  • Broker’s execution speed
  • The volatility of the market

Trading Range in USD/HUF

The representation of the minimum, average, and maximum volatility of a currency pair is the trading range. It shows the volatility of the market in different timeframes. And these values help in figuring the profit that can be gained or loss that can be incurred on a trade.

Procedure to assess Pip Ranges

  1. Add the ATR indicator to your chart
  2. Set the period to 1
  3. Add a 200-period SMA to this indicator
  4. Shrink the chart so you can assess a large time period
  5. Select your desired timeframe
  6. Measure the floor level and set this value as the min
  7. Measure the level of the 200-period SMA and set this as the average
  8. Measure the peak levels and set this as Max.

USD/HUF Cost as a Percent of the Trading Range

Cost as a per cent of the trading range is the representation of the cost discrepancies for different volatilities and timeframes. With these values, we can determine the moments of the day when the costs are less. And this shall be discussed in detail in the next topic.

ECN Model Account

Spread = 16 | Slippage = 3 |Trading fee = 3

Total cost = Slippage + Spread + Trading Fee = 3 + 16 + 3 = 22

STP Model Account

Spread = 15 | Slippage = 3 | Trading fee = 0

Total cost = Slippage + Spread + Trading Fee = 3 + 15 + 0 = 18

The Ideal way to trade the USD/HUF

We know that exotic currency pairs typically have high volatility and low trading volume. Also, the total costs on trade are pretty expensive. Hence, one must be choosy while deciding when to enter the market.

The higher percentage values in the min column represent that the costs are high when the volatility of the market is low. And the opposite is the case for lower percentage values. However, it is not ideal to trade during any of these times.

One may trade these currency pairs during those times of the day when the volatility values are around the average values. This will ensure decent volatility as well as low costs on the trade.

Furthermore, another simple way to reduce costs is by trading using limit orders and not market orders. Because this will take away the slippage on the total cost, and this will, in turn, reduce the total cost significantly. An example of the same is given below.

With slippage

Spread = 16 | Slippage = 3 |Trading fee = 3

Total cost = Slippage + Spread + Trading Fee = 3 + 16 + 3 = 22

Without slippage

Spread = 16 | Slippage = 0 |Trading fee = 3

Total cost = Slippage + Spread + Trading Fee = 0 + 16 + 3 = 19

Categories
Forex Assets

USD/DKK – Analyzing the Exotic Forex Pair

Introduction

USD/DKK is the abbreviation for the US Dollar against the Danish Krone. This pair is considered as an exotic currency pair that typically presents high volatility and low trading volume. The US Dollar is the base currency, and the Danish Krone is the quote currency.

Understanding USD/DKK

The value of USD/DKK represents the value of DKK that is equivalent to one US Dollar. It is quoted as 1 USD per X DKK. So, if the current value of this pair is 6.9868, then these many Danish Krones are required to purchase one US Dollar.

Spread

Spread is the difference between the bid and the ask price of a currency pair. It is the primary way through which brokers generate revenue. It varies from broker to broker and also the model of execution.

ECN: 14 pips | STP: 15 pips

Fees

The fee is simply the commission that you pay on each trade you take.

Fee on ECN – 3-6

Fee on STP – 0

Slippage

Slippage is the difference between the price which was intended by the client and the price he got from the broker. This difference changes with the market’s volatility and the broker’s execution speed. Slippage on exotic pairs is typically high.

Trading Range in USD/DKK

As it is pretty evident from the table, the trading range is an illustration of the pip movement in a currency pair in different timeframes. These values help us determine the minimum, average, and maximum profit or loss that can be incurred in a trade during a specified time frame. Another application for this table is discussed in the next topic.

Procedure to assess Pip Ranges

  1. Add the ATR indicator to your chart
  2. Set the period to 1
  3. Add a 200-period SMA to this indicator
  4. Shrink the chart so you can determine an extensive period
  5. Select your desired timeframe
  6. Measure the floor level and set this value as the min
  7. Measure the level of the 200-period SMA and set this as the average
  8. Measure the peak levels and set this as Max.

USD/DKK Cost as a Percent of the Trading Range

Cost as a percent of the trading range is an application to the above volatility table. The below two tables depict the total cost variation in different volatilities and timeframes for ECN and STP accounts.

Note: The percentages are obtained by finding the ratio between the total cost and the pip movement values in the above table.

ECN Model Account

Spread = 14 | Slippage = 3 |Trading fee = 3

Total cost = Slippage + Spread + Trading Fee = 3 + 14 + 3 = 20

STP Model Account

Spread = 15 | Slippage = 3 | Trading fee = 0

Total cost = Slippage + Spread + Trading Fee = 3 + 15 + 0 = 18

The Ideal way to trade the USD/DKK

What do the percentage values mean? Comprehending the above tables is simple. The higher the magnitude of the percentage, the higher are the costs for that particular volatility and timeframe. Similarly, lower percentage values mean that the costs are low.

Trading during high volatilities or when the cost is high is not ideal. So, to ensure an equilibrium between the two, it is best to enter the market during those times when the volatility is around the mid values illustrated in the volatility table.

Apart from this, one can reduce their total costs significantly by placing orders using limit/pending orders instead of market orders. This will altogether remove the slippage factor on the total cost and bring down its value by a high number.

As already mentioned, exotic currency pairs are highly volatile and have low trading volume. This results in higher costs on the trade. Hence, if you really want to trade this pair, it is recommended to follow the above-mentioned mentioned techniques to reduce costs by a considerable amount. Cheers!

Categories
Forex Daily Topic Forex Economic Indicators

What Moves the Forex Markets?

Analyzing the Forex Market

There are three ways to interpret the Forex markets: Fundamental Analysis, Technical Analysis, and Sentiment Analysis. But the markets move for just one reason: Supply and demand.
Supply and demand changes slowly or fast, depending on the current economic events, but that change is due to the Sentiment or beliefs of the major operators about what they think are imbalances of the market. That happens when institutional traders believe the current price is not a fair price, and it is due to change in the near or far future. The best strategies combine the tree methods to make the trading decisions, but a trader must always keep in mind the fundamental forces that move the Forex markets.

Fundamental Analysis

Fundamental Analysis deals with the economic and political events and situations that change supply and demand. Among the most important indicators are economic Growth Rates, Inflation, Interest Rates, Government Debt and Spending, Gross Domestic Product, and Unemployment. Fundamental Analysis combines all this information to determine the possible sentiment of the market participants and ultimately forecast the future performance of an asset.

Supply and Demand

Currencies’ prices change primarily driven by supply and demand. If the supply is larger than the demand, the price drops, and if the opposite happens, it goes up. We, as traders, cannot determine if the imbalance of the supply-demand forces is due to hedging, speculation, or monetary conversion. For example, the US dollar moved with strength from 1998 to 2001 when the Internet as the NASDAQ boom drove international investors to participate in the US financial markets in search of high returns. Investors had to buy dollars and sell their local currency, so the Dollar gained strength. At the end of 2001, the political climate changed after the 9/11 event, the stock market fell hard, and the FED started to cut interest rates. Therefore, stock investors moved their capital elsewhere, so they sold the Dollar, and its price dropped.

Capital Flows and Trade Flows

The flows of capital and trade are two major factors in the balance of payments. These two factors quantify the amount of demand for a currency. Common sense tells us that a balance of zero is needed for a currency to hold its value.
A negative number in the balance of payments will indicate that capital is leaving the domestic economy more rapidly than it is entering. Under these circumstances, the currency should move down. The opposite should happen if the balance of payments is positive.
An example of this is the Japanese Yen. Despite the fact of negative interest rates, the Japanese yen has managed to trade mostly moved by its high trade surplus; thus, this currency tends to increase in value. The Japanese government uses a negative interest rate policy and increases the money supply (by printing new money), counteract the inflows of currency coming from the export business to hold the currency’s value to a level not endangering its export business.

The capital flows show a measure of the net amount of currency bought and sold due to capital investments. A positive figure implies that the inflows originated from international investors entering the country exceded those bought by domestic investors abroad.

Physical Flows

Physical flows are originated by foreign investments, directly purchasing real estate, manufacturing facilities, and acquisitions of local firms. These operations require that foreign investors buy dollars and sell their local currency.
Physical flows data are essential, as they show the underlying changes in the physical investment activity. A change in the local laws encouraging foreign investments would boost Physical inflows. That happened in China when it relaxed the laws for foreign investment due to its entry into the World Trade organization in 2001.

Portfolio Inflows

Portfolio inflows measure the capital inflows in the equity and fixed-income markets.

Equity Markets

The Internet and computer technology enabled a greater easy to move fast and easily capitals from one market to another one in the search for profit maximization. A rally in the stock market can be an opportunity for any investor no matter where he lives. If the equity market rises, the money will flow in and drive the local currency up. If it moves down, investors would quit and move their money away.

Fig 1 – US Yields versus Stock Market Cycles

(source: http://estrategiastendencias.blogspot.com/)

The attraction of the equity markets compared to fixed-income markets ( bonds and monetary investments) is growing since the early 90ies. For example, the foreign transactions of US government bods dropped from 10-1 to 2-1.
That can also be verified when we see that the Dow Jones has over 80 percent correlation with the US Dollar Index.

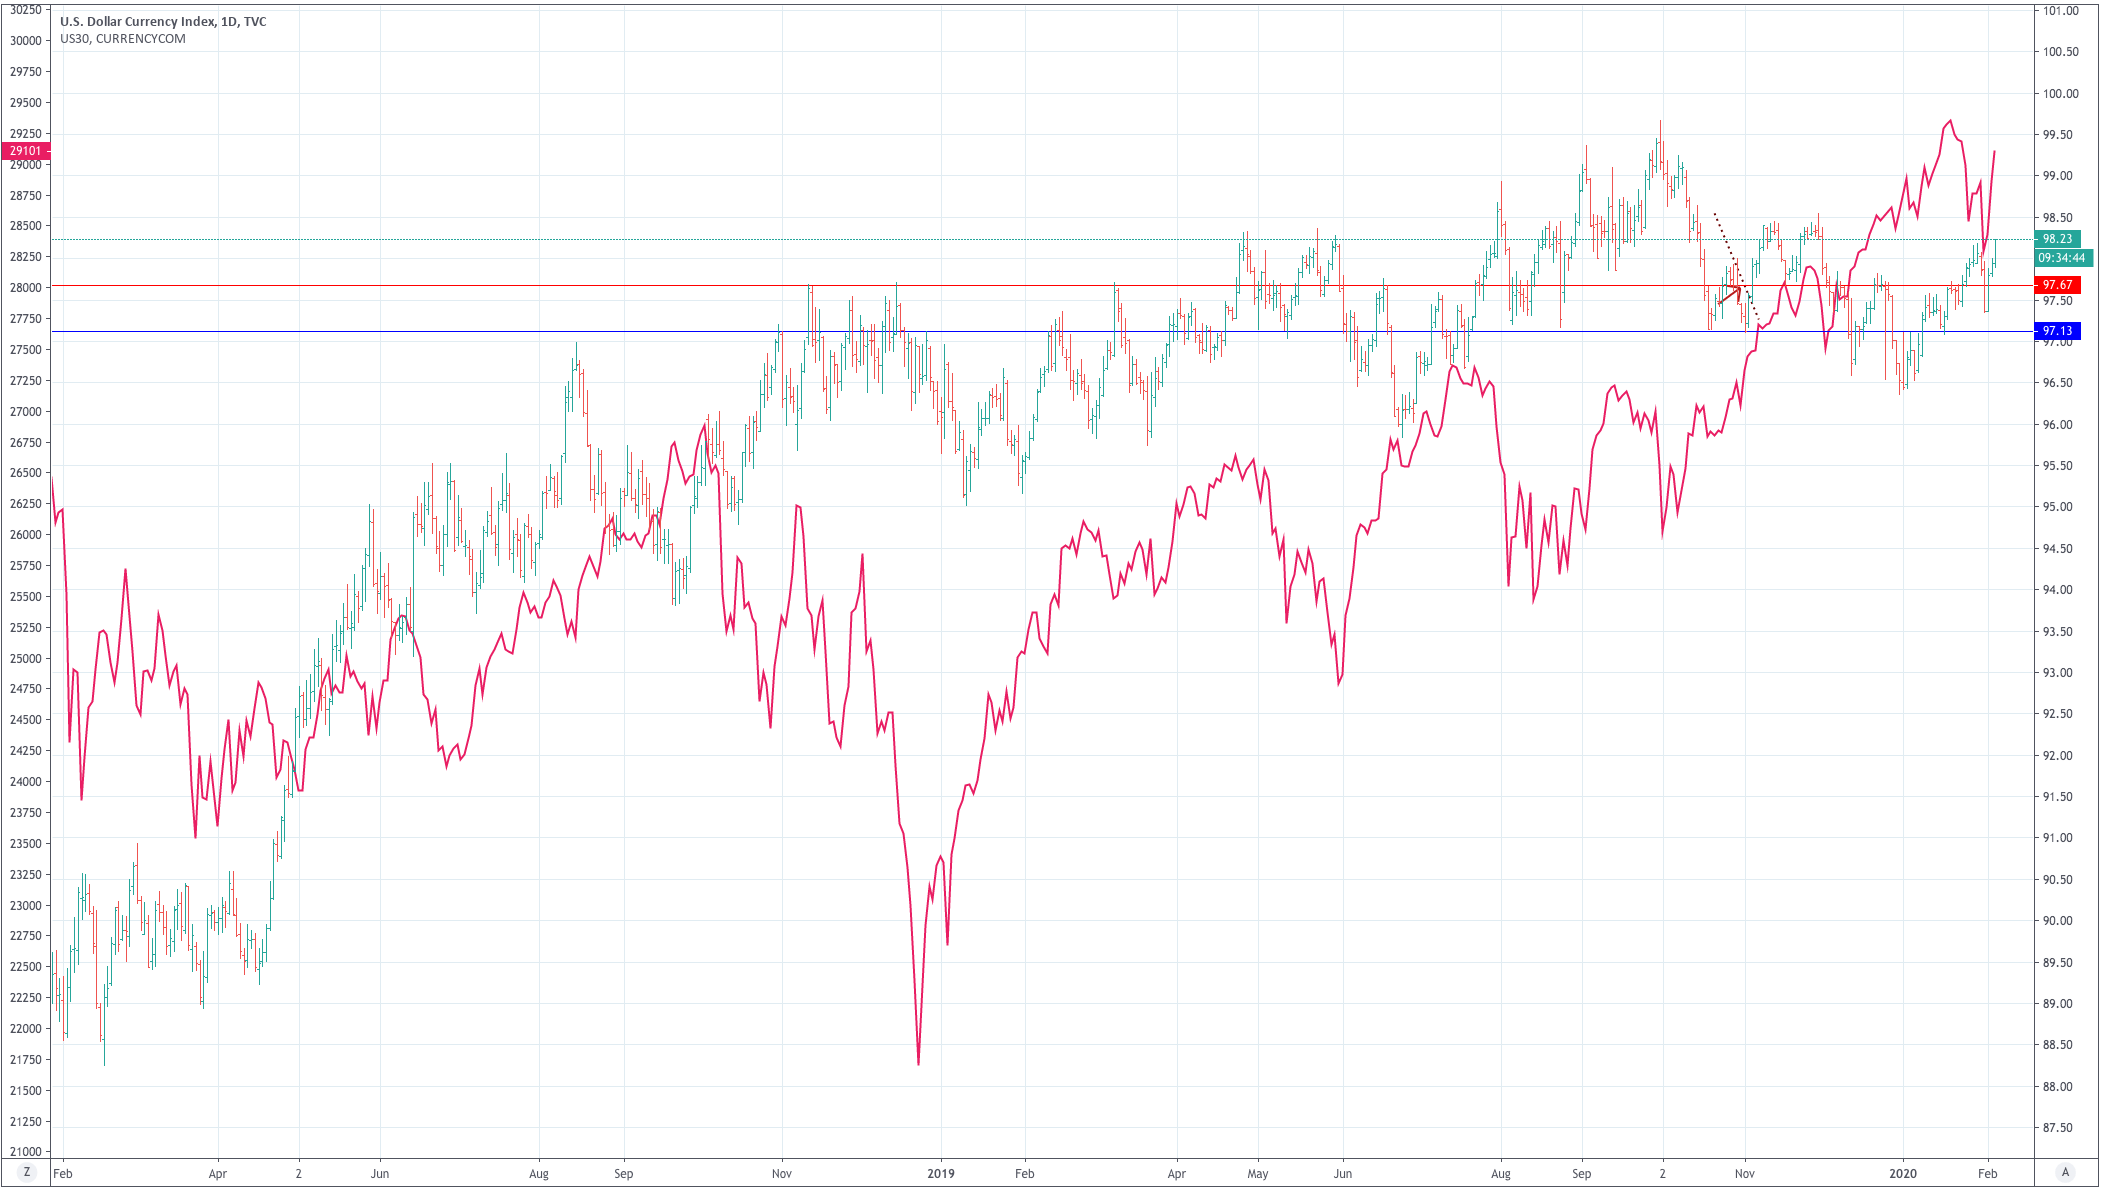
Fig 2 – US Dollar Index and the DOW-30 correlation  (Created using Tradingview)

Fixed Income Markets

Fixed income markets start being appealing in times of global uncertainty due to the perceived safe-haven nature of this type of investment. As a result, countries offering the best returns in fixed income products are more appealing and attract foreign money, which would need to be converted to the country’s money, boosting the demand for this particular currency.
A useful metric to analyze fixed-income flows is the short and long-term yields of the different government bonds. For example, comparing the 10-year US Treasury note yield against the yields on foreign bonds. The reason is that investors tend to move their money to countries offering the highest-yields. Thus, for instance, a rise in yields would signify a boost in the inflow of fixed-income capital, which would push the currency up.
Aside from the US Treasury notes, the Euribor futures or the futures on the Interbank Rate is a good gauge for the expected interest rate in the Eurozone.

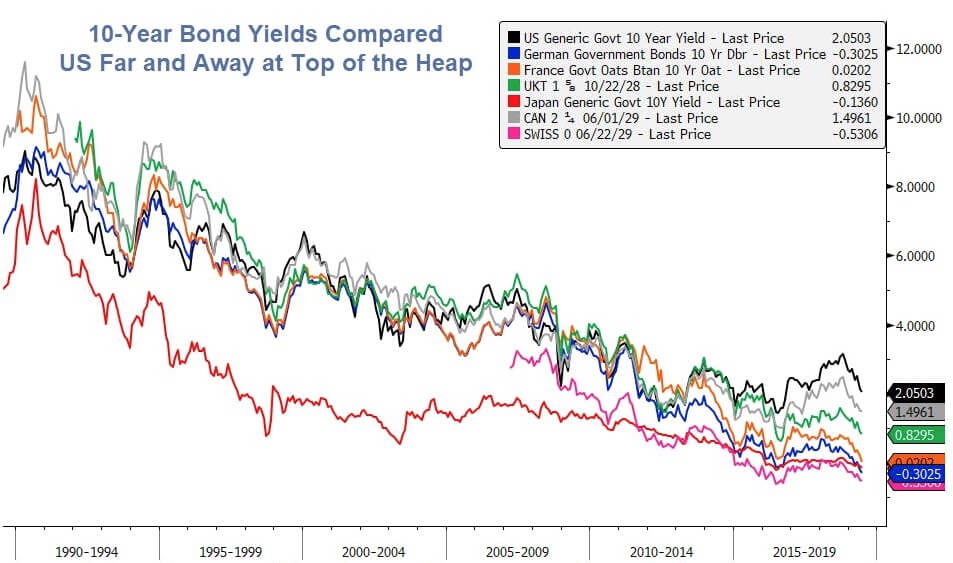
Fig 3 – 10-year note yield curves on Industrialized Countries

(from https://talkmarkets.com/)

Trade Flows

Trade flows are needed for import and export transactions. The Trade flows figure is a measure of the country’s trade balance. Countries that are net exporters will show a net surplus. Also, they will experience a rise in the value of their currencies as the result of the exchange transactions, when exporting companies trade the foreign currency for local money, as the local currency is bought more than sold.
Net importer countries will show a negative figure in its trad flow metric, and, since its currency is more often sold than bought will experience a push to the downside.

Economic Surprises

It seems logical that changes in any of the discussed flows would affect the involved currency pair. Traders, though, should focus on economic surprises. That is, data releases that are considerably different from the consensus forecasts. An unexpected figure would shatter the market and likely produce a long-term trend change. The trader should not trade the event itself, but use it to forecast future price trends and plan his short-term trading strategies with the long-term figure in mind.


Reference: Day Trading and Swing Trading the Currency Market, Kathy Lien


Categories
Forex Assets

Understanding The USD/THB Exotic Forex Pair

Introduction

USD/THB is the abbreviation for the US Dollar versus Thailand’s Thai Baht. It is an exotic currency pair which usually has high volatility and low trading volume. US Dollar, in this pair, is the base currency, and the Thai Baht is the quote currency.

Understanding USD/THB

The value of USDTHB represents the number of THB that are equivalent to one USD. It is quoted as 1 USD per X THB. So, if the market price of this pair is 30.98, then one has to produce 30.98 THB to buy one USD.

Spread

Spread is the difference between the bid and the ask price of the currency pair set by the brokers. It typically varies from broker to broker and also from the type of order execution. The spreads on ECN and STP accounts are as shown below.

ECN: 10 pips | STP: 11 pips

Fees

There is a fee associated with every trade you take. The fee is also referred to as the commission on the trade. Its value is usually a constant but varies from the type of execution model. The fee on STP accounts is nil, while there are a few pips of fee on ECN accounts.

Slippage

Slippage is the difference between the trader’s required price and the price at which his trade was executed. Since exotic pairs are highly volatile, the slippage is quite high.

Trading Range in USD/THB

Below we shoe a table representation of the minimum, average, and maximum pip movement in a currency pair. These values help us determine the profit or loss that can be made on a trade in a given amount of time. All you have to do is, multiply any one of the below values with the value per pip ($32.26). The result is the potential profit gained or lost on the trade for one bar of the timeframe.

Procedure to assess Pip Ranges

  1. Add the ATR indicator to your chart
  2. Set the period to 1
  3. Add a 200-period SMA to this indicator
  4. Shrink the chart so you can assess a large period
  5. Select your desired timeframe
  6. Measure the floor level and set this value as the min
  7. Measure the level of the 200-period SMA and set this as the average
  8. Measure the peak levels and set this as Max.

USD/THB Cost as a Percent of the Trading Range

The cost as a trading range represents the cost variation in trade in different volatilities of the market. It is presented in percentages of the total range. Thus, it helps determine the best moments to enter the market to ensure lower costs.

ECN Model Account

Spread = 10 | Slippage = 3 |Trading fee = 3

Total cost = Slippage + Spread + Trading Fee = 10 + 3 + 3 = 16

STP Model Account

Spread = 11 | Slippage = 3 | Trading fee = 0

Total cost = Slippage + Spread + Trading Fee = 11 + 3 + 0 = 14

The Ideal way to trade the USD/THB

Trading exotic pairs are different from trading the major and minor pairs. However, there are times when one can trade this pair by making attempts to reduce the costs.

The magnitude of the percentages represents the costs of the trade. The higher the percentages, the higher are the costs on the trade. It can be seen from tables that the costs are high on the min column and comparatively lower in the max column. This clearly means the costs are high during high volatilities and vice versa.

However, when it comes to determining the right time to trade, one must trade during those moments when the volatility is around the higher values because this will ensure pretty great volatility as well as low costs.

Furthermore, another simple way to reduce costs is by trading using limit/stop orders instead of market orders. Limit orders will eliminate the slippage and significantly reduce the total cost of the trade.

Finally, we can see that we must be pretty sure of the direction and extension of the trend to trade the USDTHB, and avoid trading it intraday. Using the daily chart and limit orders, we still would need almost 4 Hours of a positive movement (with the trade) to pay the costs. Therefore we practical setups would ask for at least 2-3 days of market action for propper reward-to-risk factors.

Categories
Candlestick patterns Forex Candlesticks

Candlestick Reversal Patterns V – The Morning Star and the Evening Star

The Morning Star and the Evening Star

The morning Star and the Evening Star formations are patterns made of three candlesticks. The original candlestick patterns were made on the Japanese rice futures trading and were created for daily timeframes. Thus, they could depict gaps from the previous close to the next open. The Star was a small real body – white or black – that was gaping away from a previous large body. The only place where that could occur in the Forex markets is during weekends. Thus, what is required to form a star in Forex is a small body, the smaller, the better, at the end of a large body, preferably with large shadows.

The Morning Star

The Morning Star is a three-candle formation at the bottom of a descending trend. In astronomy, Mercury is the morning star that foretells the sunrise and the arrival of the day. That was the name the Japanese gave to the formation, as they consider it to be the precursor of a new uptrend.

As said, it is formed by three candlesticks. The first one is a large and black candlestick. The session day the price starts with a gap down (or just at the close in Forex) continues moving down for a while, then it recovers and closes near the open, creating a tiny body. The third day is a white candlestick that closes near the open of the first black candlestick. The important factor in the signal is the confirmation of buyers after the star candle is formed. The close of the third day should, at least, cross the halfway up to the black candle body, as in the case of a piercing pattern. 

Chart 1 – Morning Star on the DAX-30 Index (click on it to enlarge)

Criteria for a Morning Star 
  1. The downtrend was evident
  2. The body of the first candle continues with the trend (black)
  3. The second candle is a short body figure showing indecision
  4. The third day the candle closes at least above 50 percent the body of the black candle.
  5. The larger the black and white candles, the better.
  6. A gap is desirable but doesn’t count on it on 24H markets
  7. A high volume in the first and third candles would be good signs of a selloff and consequent reversal.
Market Psychology

As in most bullish reversals, the first day, the hopeless bulls capitulate with a significant drop and substantial volume. The next day the power of the sellers stops in a short-bodied candle. The third day began bullish, touching the stops of the late short-sellers, and also caused by the close of positions of profit-takers. That fuels the price to the upside, making more short sellers close their positions -buying- and pushing up further the price. At the end of the day, buyers take control of the market action closing with a significant white candle on strong volume.

The Evening Star

The Evening star is the reciprocal of the Morning star, and even more so, when trading pairs in the Forex market, or any pair, for that matter. In this case, the Japanese linked this formation with the Venus planet, as the precursor or the night. It is created when a long white candle is followed by a small body and a large black candle.

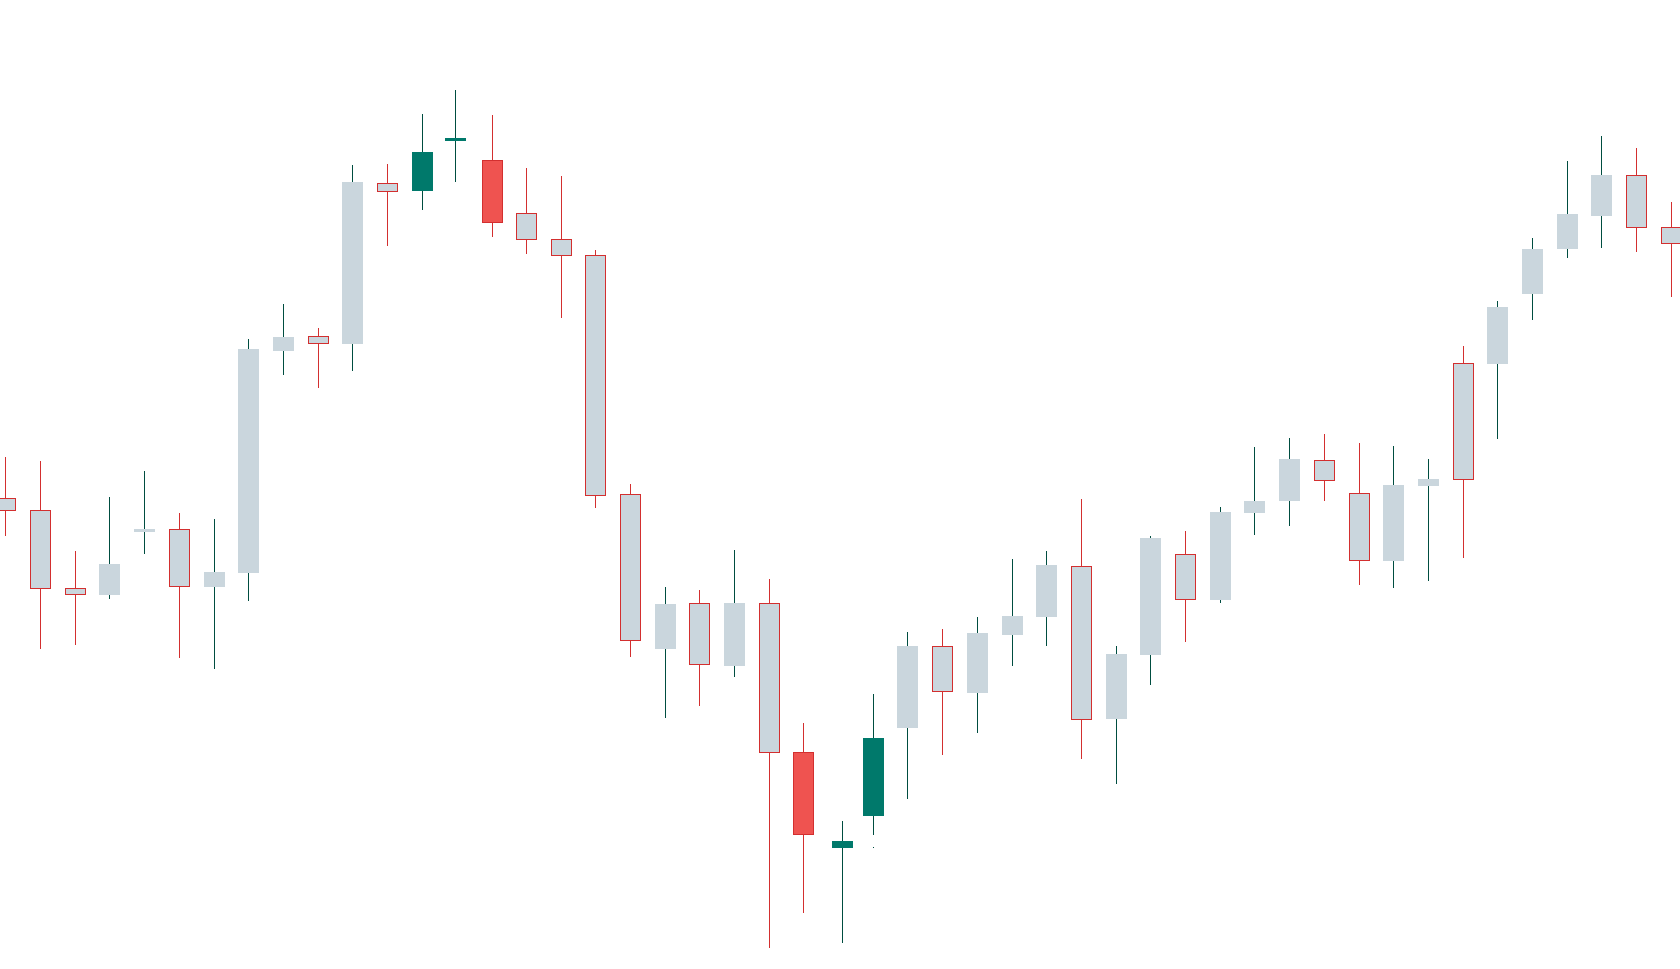
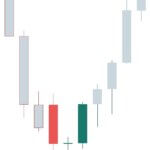
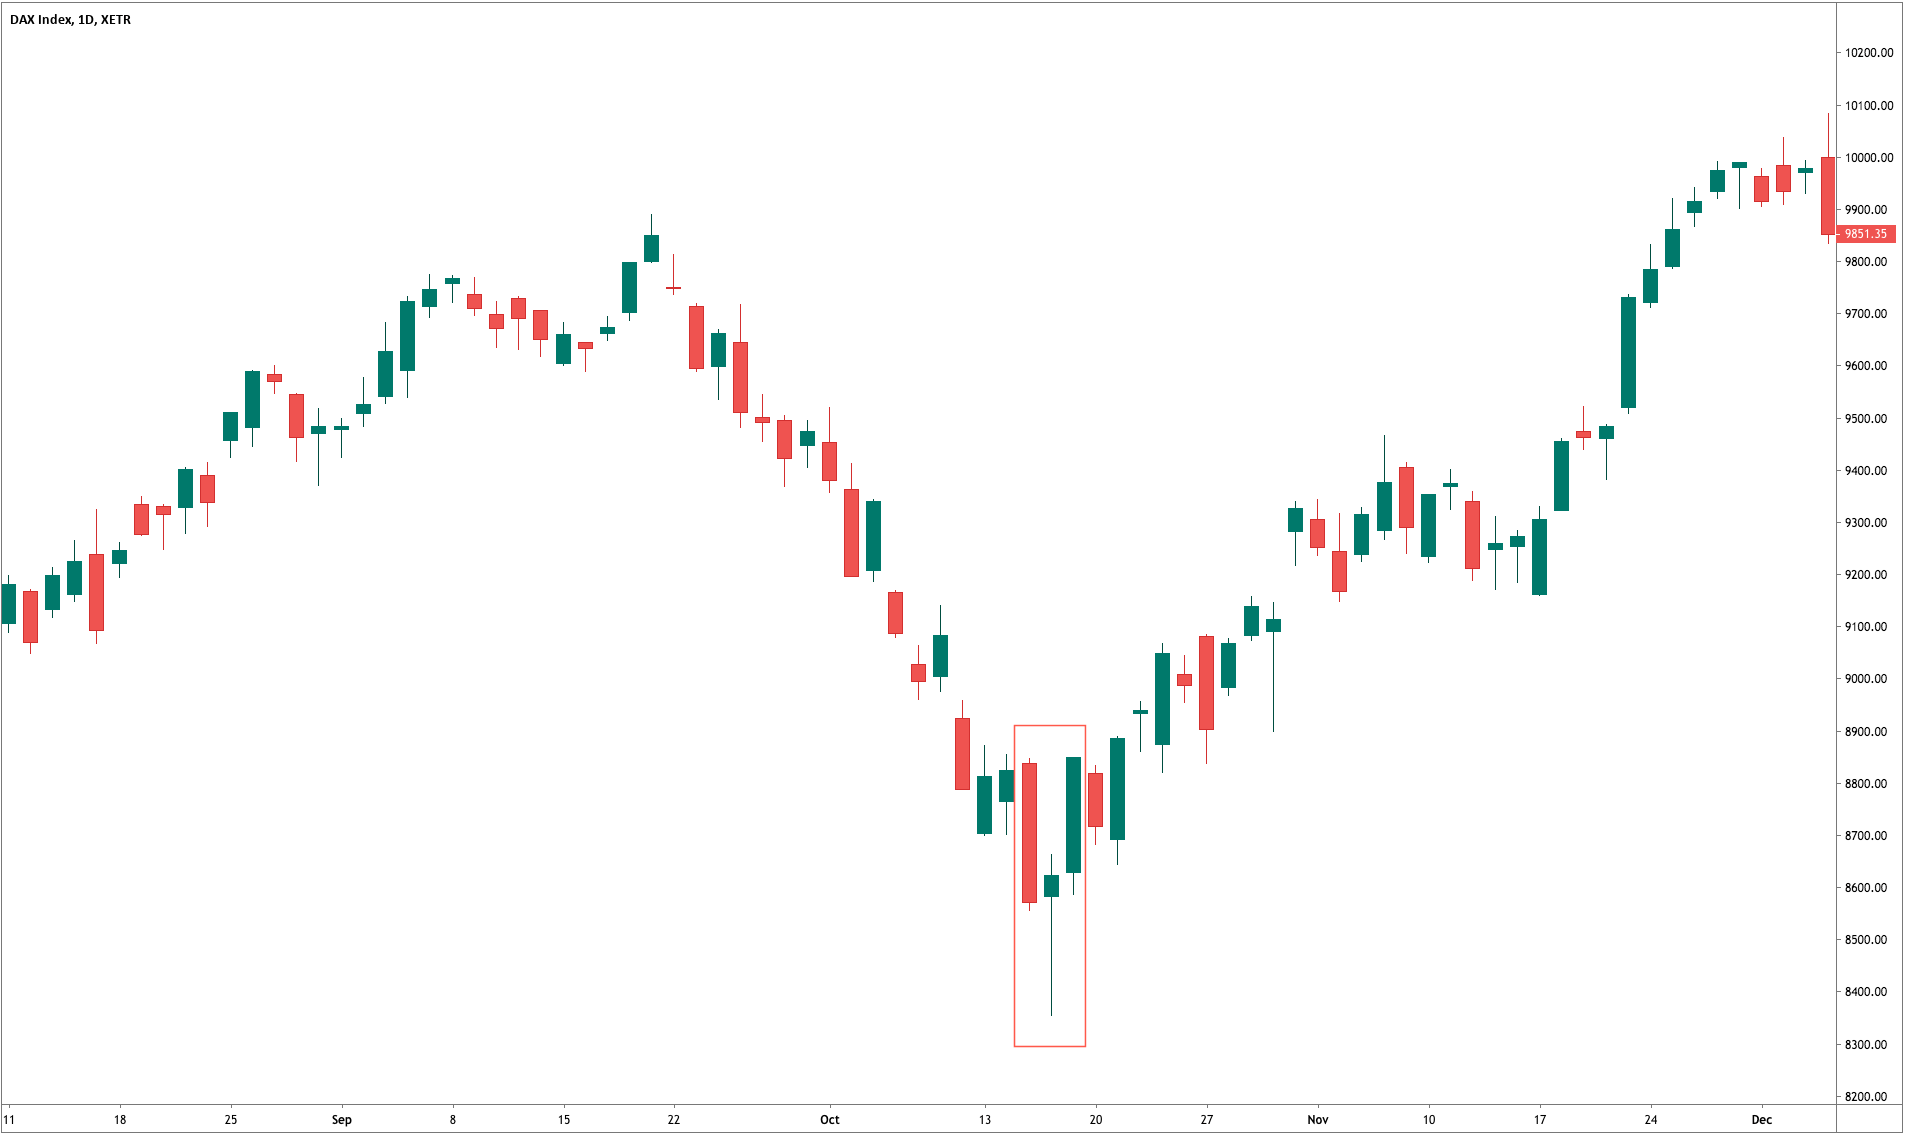
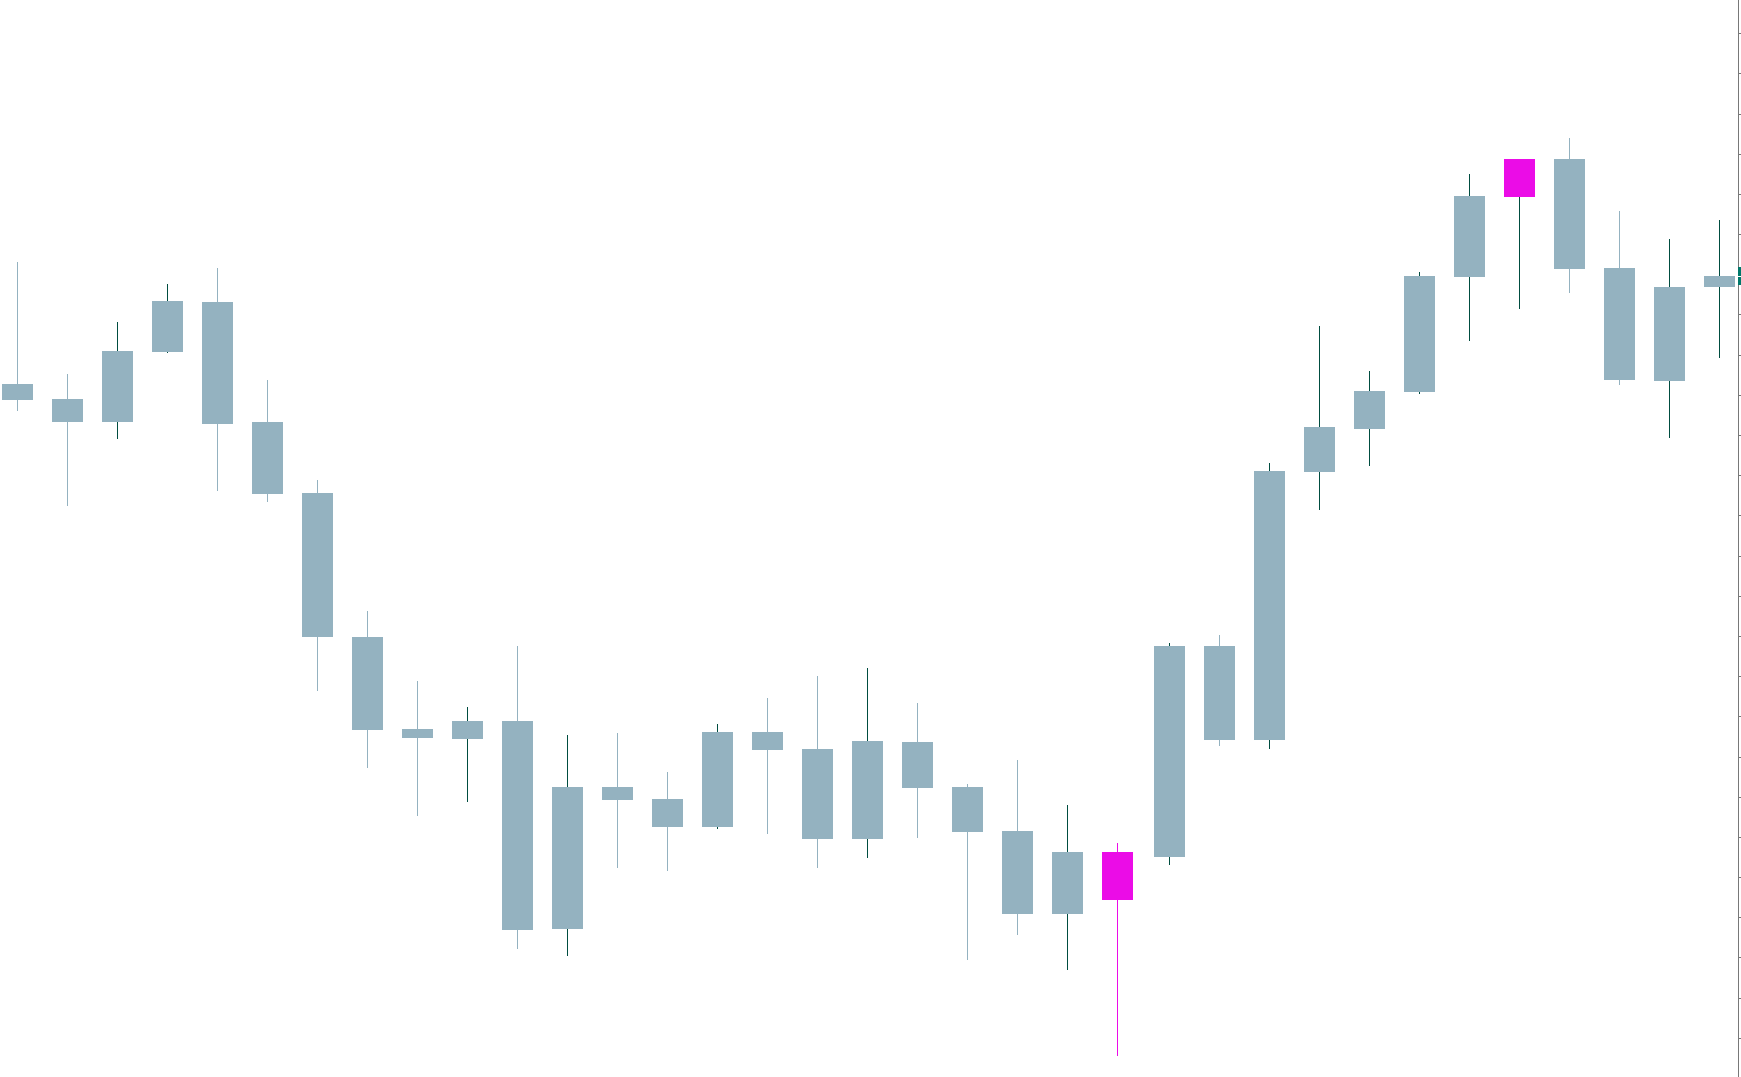
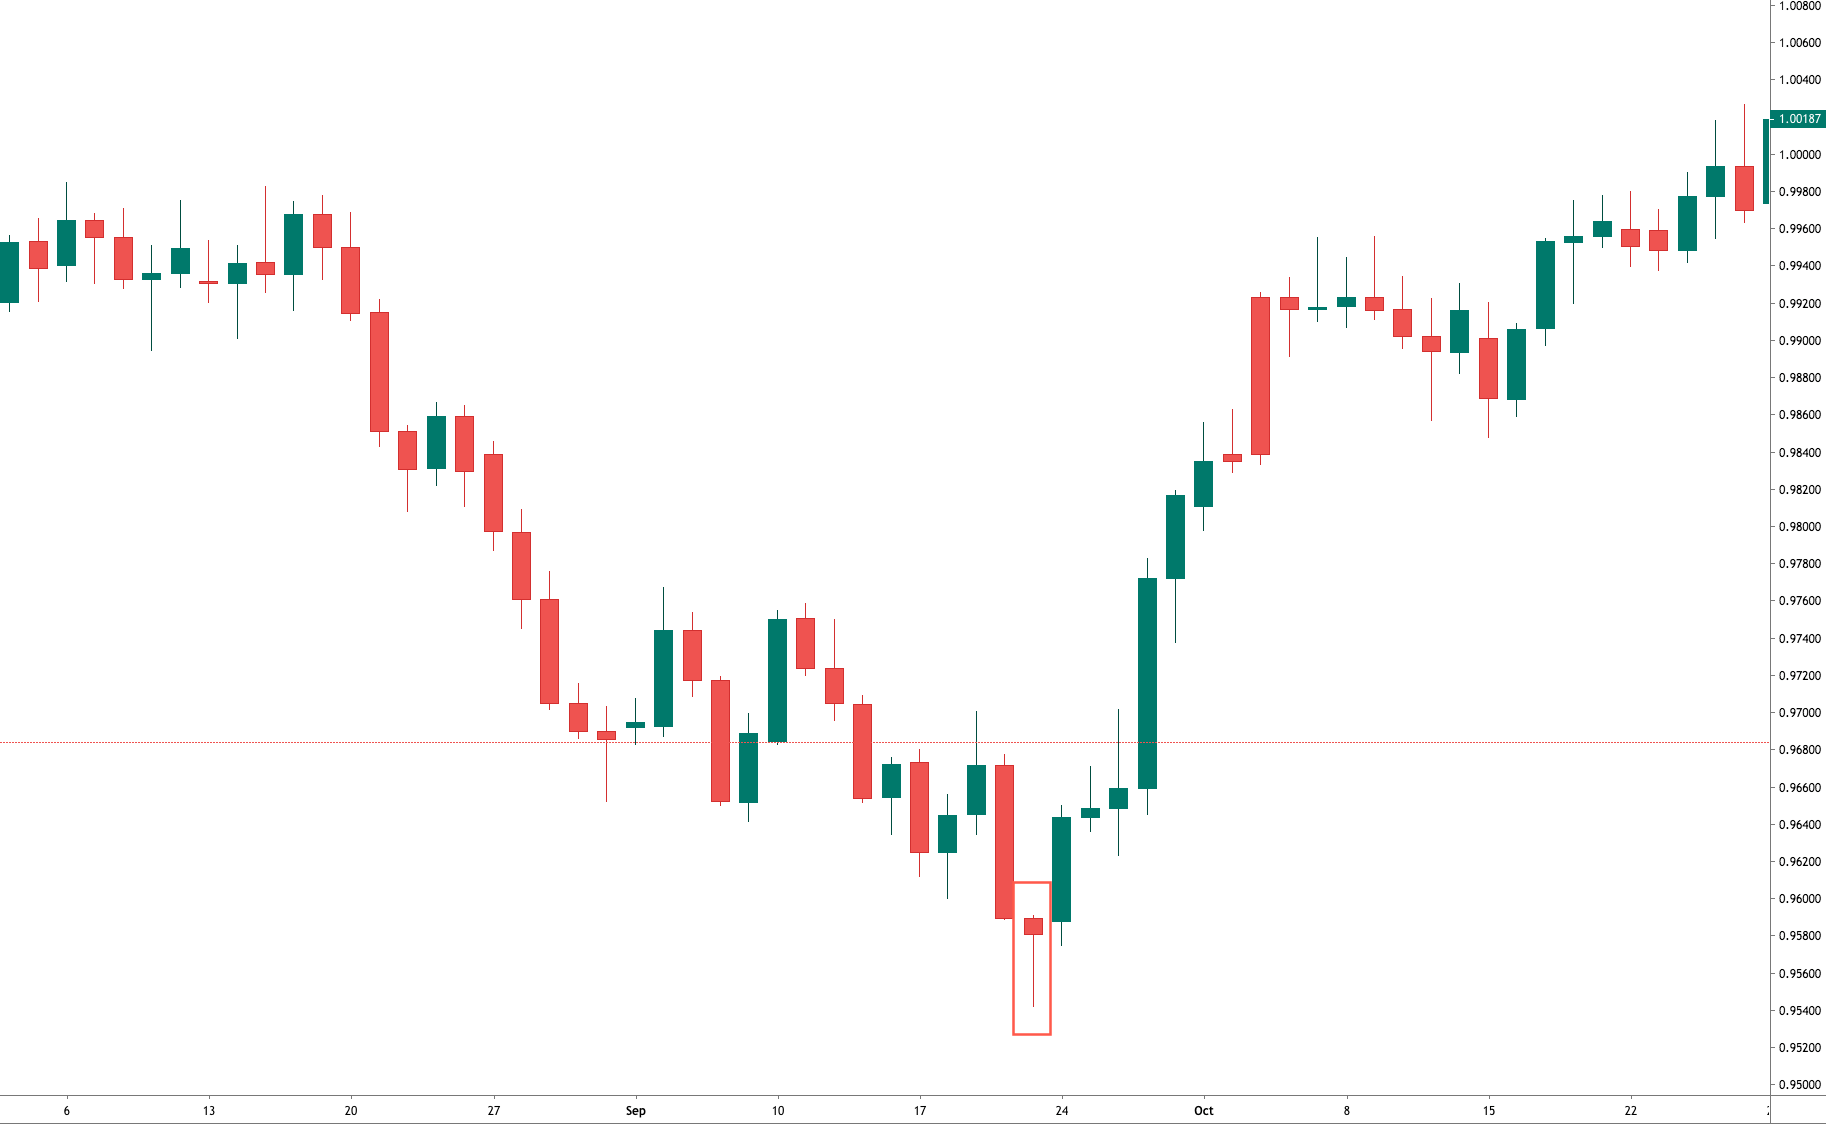
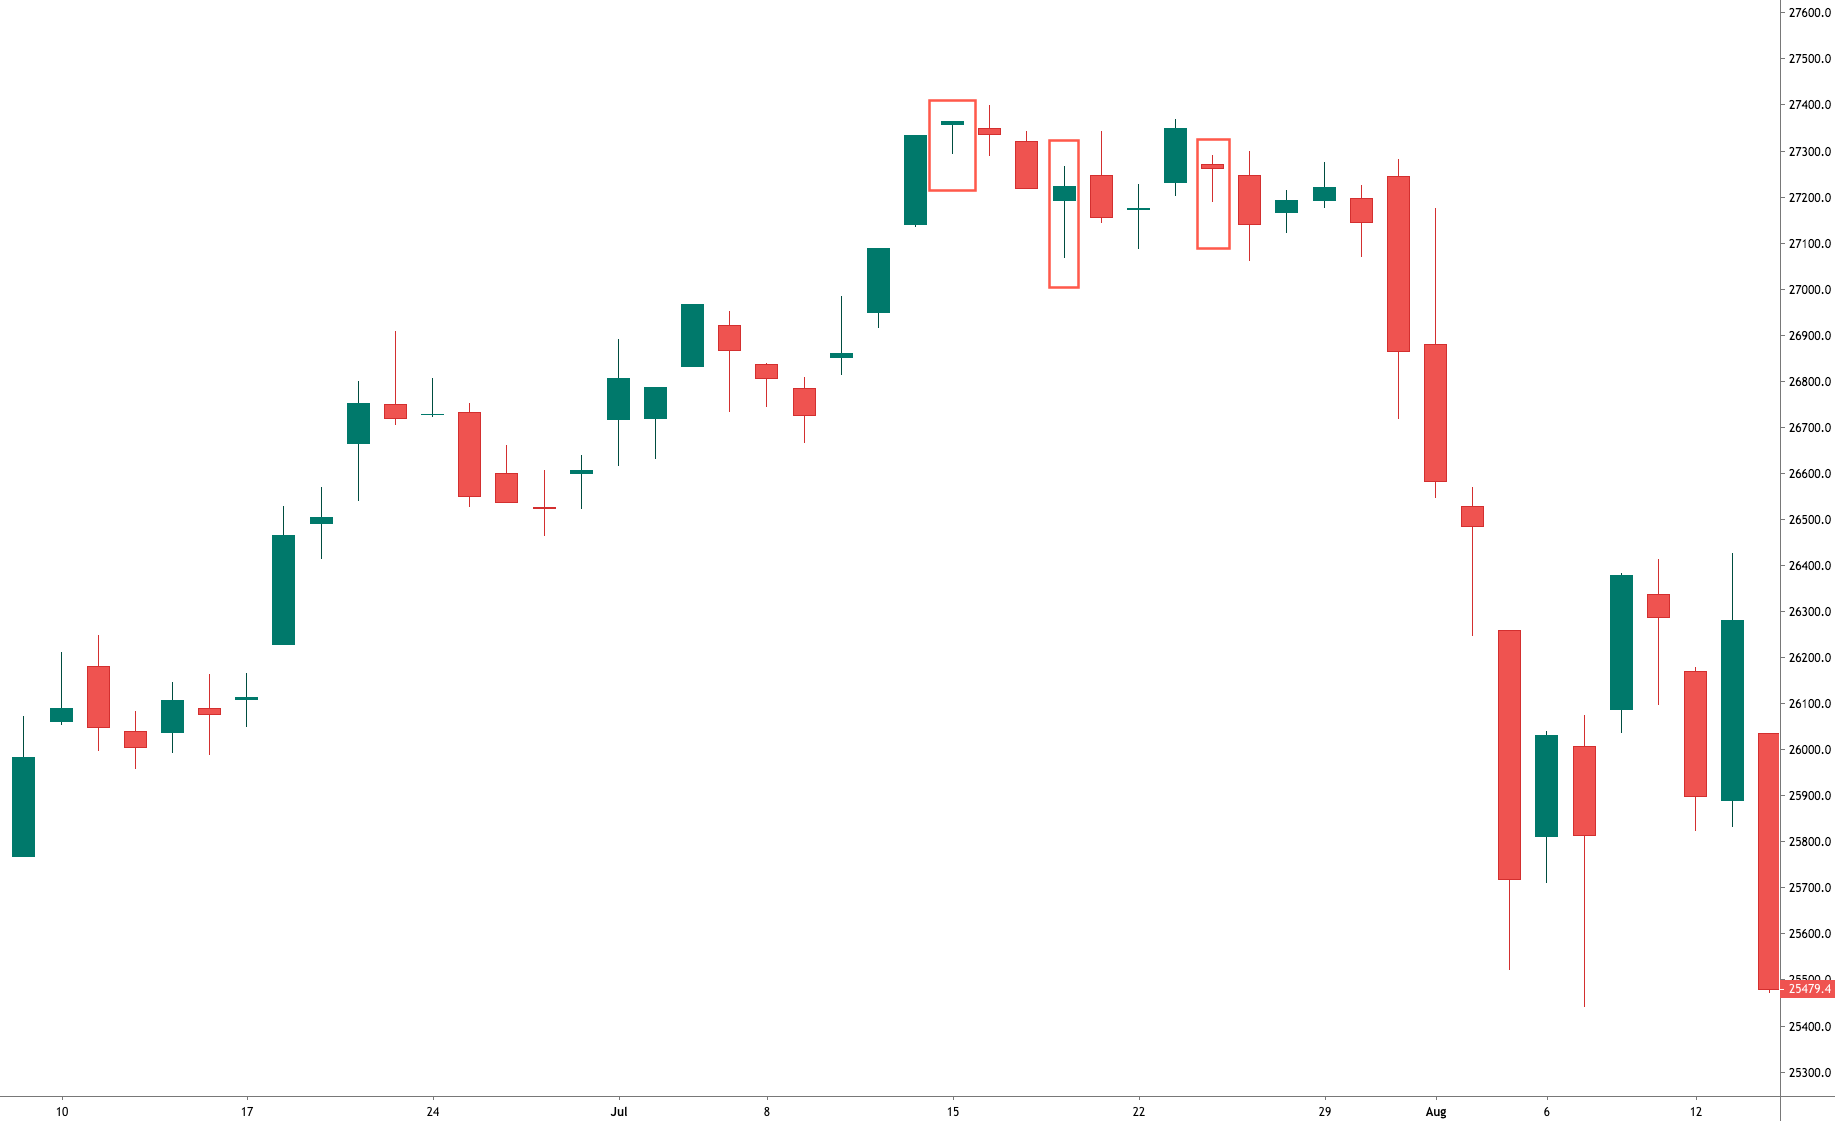
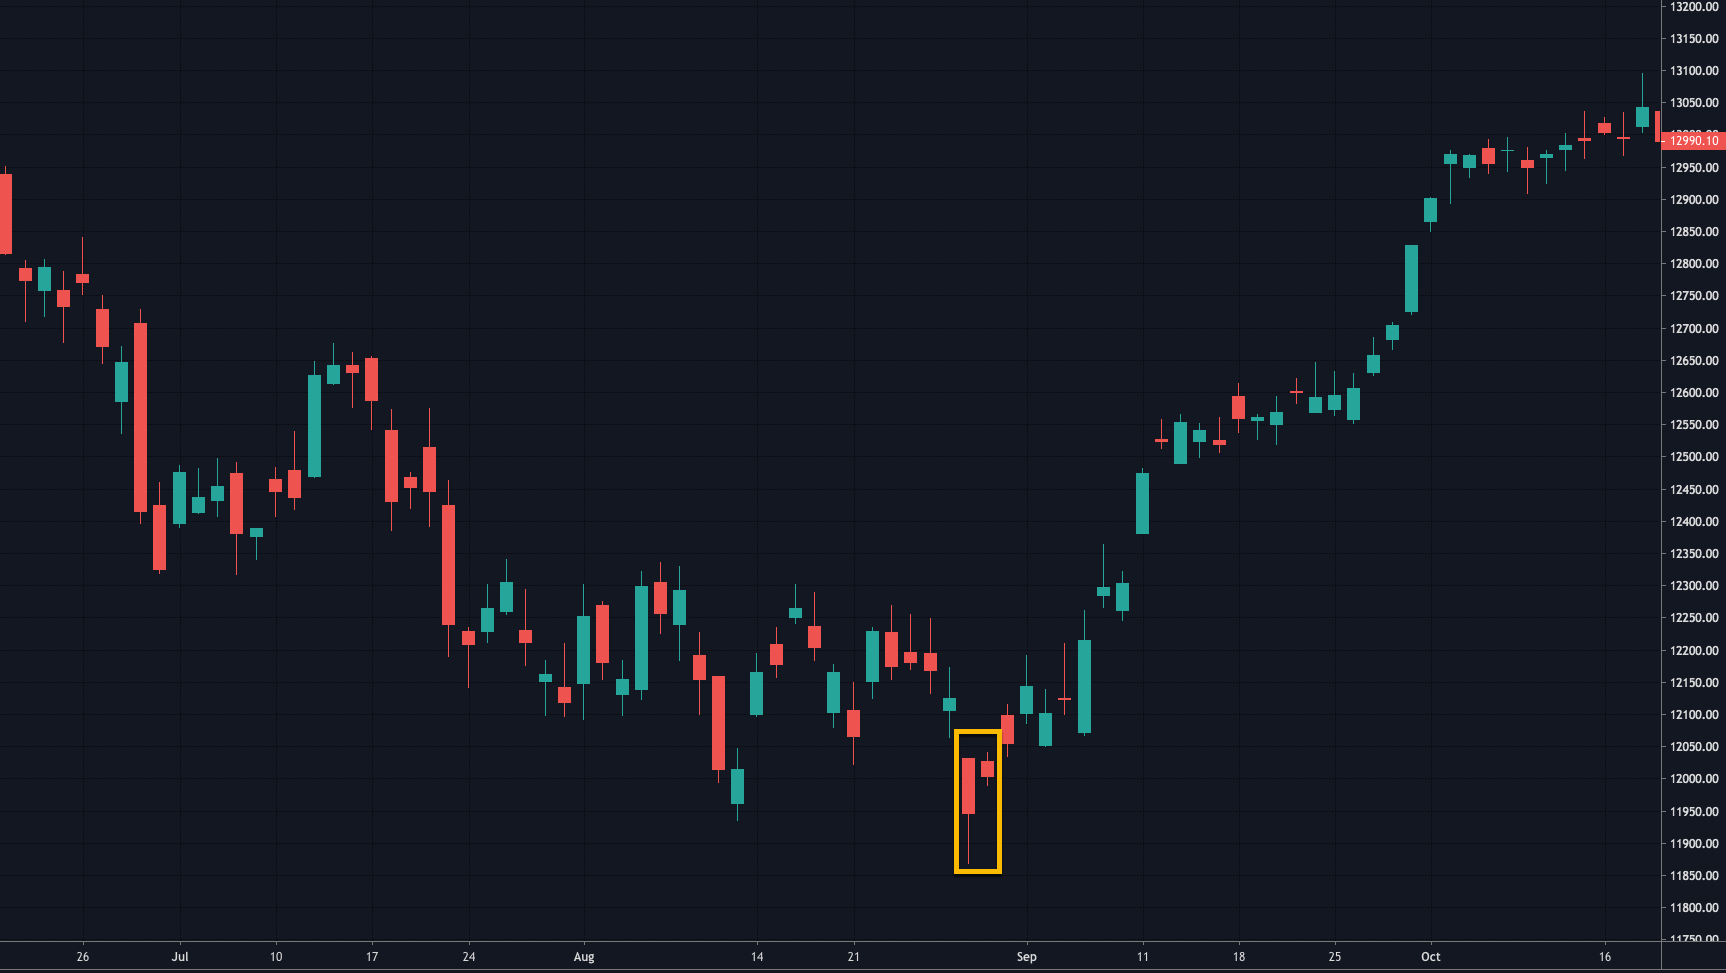
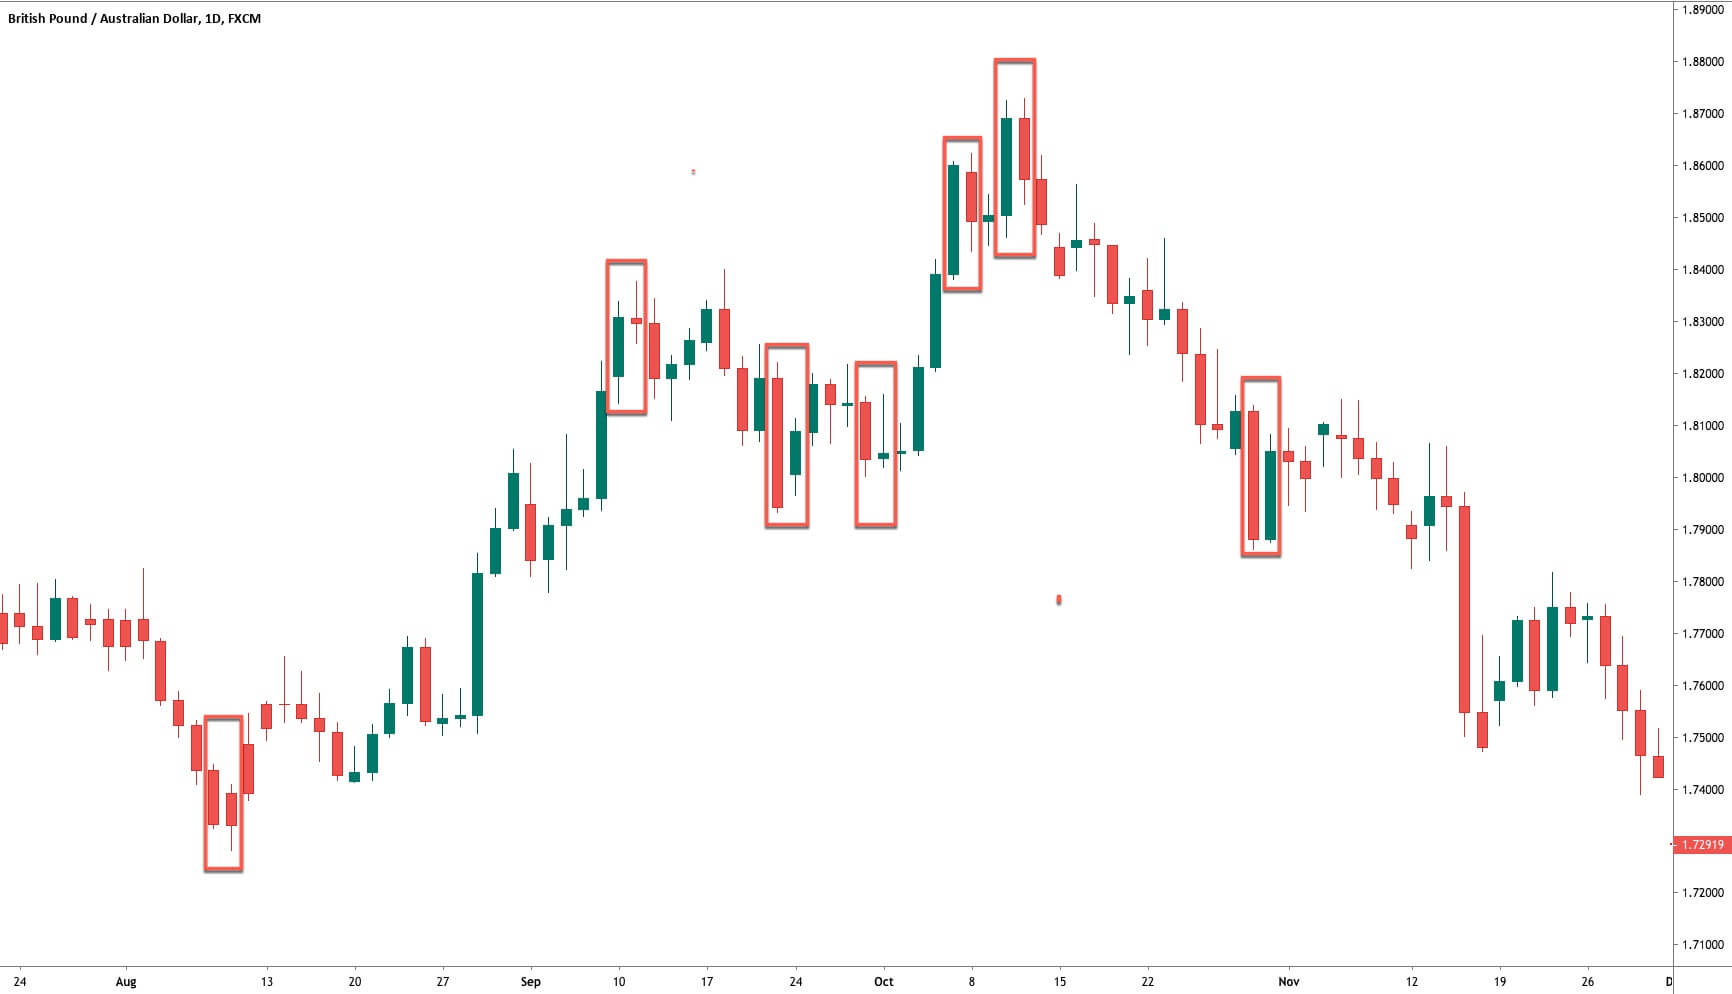
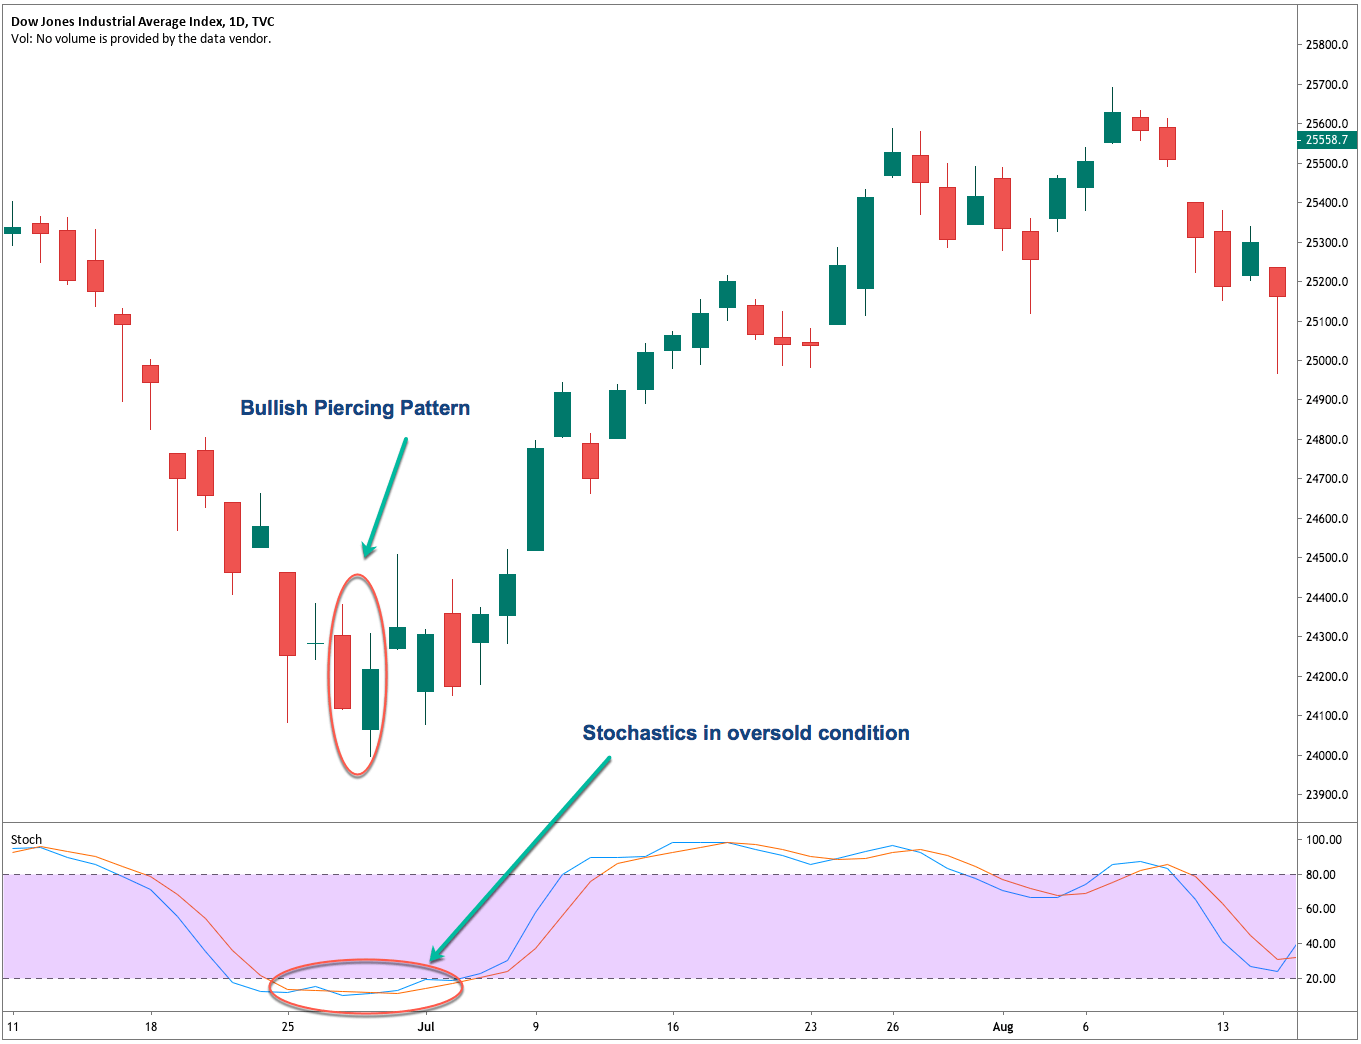
As the case of the Morning Star, a gap up on the second small-bodied candle followed by a gap down on the third black candle is further confirmation of a reversal, but that seldom happens in the Forex Market.  Also, the third candlestick is asked to close below 50 percent of the body of the first white candle.


Chart 2 – Evening Star on the EURUSD Pair (click on it to enlarge)

Criteria for an Evening Star
  1.  The upward trend has been showing for some time
  2. The body of the first candle is white and large.
  3. The second candlestick shows indecision in the market
  4. On the third day, it is evident that the sellers have stepped in and closes below 50 percent of the initial white candle.
  5. The longer the white and black candles, the better
  6. A gap before and after the second candle is desirable, although not attainable in Forex.
  7. A good volume in the first and third candles is also desirable.
Market Psychology

The uptrend has attracted the buyers, and the last white candle has seen an increasing volume. In the next session, the market gapped of continue moving up for a while, catching the last stops by short-sellers, but suddenly retraces and creates a small body, with the close next to the open. The next day there is a gap down makes the stops of the long positions to be hit, adding more selling pressure to the profit takers and short-sellers. The day ends with a close that wipes most of the gains of the first white candle, that shows that the control is in the hand of sellers.


Reference: Profitable Candlestick Patterns, Stephen Bigalow


Categories
Forex Assets

Analyzing The USD/SGD Forex Currency Pair

Introduction

US dollar versus the Singapore dollar, in short, is referred to as USDSGD. USD stands for the US dollar and is the base currency, and SGD stands for the Singapore dollar and is the quote currency. This currency pair comes under the sack of exotic currency pairs. Unlike the major and minor currencies, exotic currencies tend to have high volatility and low volumes.

Understanding USD/SGD

Comprehending the value of USDSGD is simple. The number of SGD equivalent to one USD is the value of the currency pair USDSGD. It is quoted as 1 USD per X SGD. So, if the value of this pair is 1.3641, then 1.3241 units of SGD are to be produced to purchase one USD.

Spread

Spread is a term given to the difference between the bid price and ask price of a currency pair. This value varies from broker to broker and on the type of execution model.

ECN: 7 | STP: 9

Fees

The fee is similar to the commission that is paid on each trade. This value, too, varies based on how the brokers execute a trade. Note that there is no fee on STP accounts. However, there is a fee on ECN accounts. And for exotic pairs, the fee is pretty high.

Slippage

Slippage is the difference between the price that a trader expected to receive and the price he actually got. There is always this difference due to the volatility of the market and the broker’s execution speed.

Trading Range in USD/SGD

Assessing the profit or loss that a trader is liable for is considered to be a vital factor in trading. This can easily be determined using the table below, which represents the pip movements in the currency pair in a given timeframe.

Procedure to assess Pip Ranges

  1. Add the ATR indicator to your chart
  2. Set the period to 1
  3. Add a 200-period SMA to this indicator
  4. Shrink the chart so you can assess a large time period
  5. Select your desired timeframe
  6. Measure the floor level and set this value as the min
  7. Measure the level of the 200-period SMA and set this as the average
  8. Measure the peak levels and set this as Max.

USD/SGD Cost as a Percent of the Trading Range

The total cost on a trade does not remain static even though you’re trading with the same broker. It varies depending on the volatility of the currency pair. To find the variation of these costs, we consider the values in the pip movement table and find the ratio with the total cost, and represent in percentage.

ECN Model Account

Spread = 7 | Slippage = 3 |Trading fee = 3

Total cost = Slippage + Spread + Trading Fee = 7 + 3 + 3 = 13

STP Model Account

Spread = 9 | Slippage = 3 | Trading fee = 0

Total cost = Slippage + Spread + Trading Fee = 9 + 3 + 0 = 12

The Ideal way to trade the USD/SGD

As mentioned, exotic pairs are pretty expensive to trade. However, it can still be traded in some moments when the costs are low.

It can be ascertained from the above table that the percentages are maximum in the min column and minimum on the max column. This means that the costs are high when the market’s volatility is low and vice versa.

Now, to ensure moderate volatility with affordable costs, it is ideal to trade when the volatility of the market is somewhere around the average values of the volatility table.

Slippage is a variable in the total cost that can be erased by trading using limit orders instead of market orders. In doing so, the costs will be reduced by a significant value. For example, if the total cost on the trade was 13 (including slippage=3), then the costs would be reduced to 10 as slippage is not considered.

Categories
Forex Assets

Understanding The USD/HKD Exotic Forex Pair

introduction

USDHKD is the abbreviation for the US dollar and the Hong Kong dollar. The USDHKD is an exotic currency pair. Exotics are pairs that are thinly traded in the foreign exchange markets and are not widely used in the global markets. One can expect high volatility and low volumes on this pair. Here, USD is referred to as base currency and HKD as the quote currency.

Understanding USD/HKD

The value of USDHKD represents the value of the Hong Kong dollar that is equivalent to one US dollar. It is quoted as 1USD per X HKD. For example, if the market price of USDHKD is 7.7684, then these many units of HKD are required to purchase one USD.

Spread

Spread is the difference between the bid price and the ask price of a currency pair. This value is set by the brokers, and it varies from different brokers. The type of execution model brings a variation in the spreads.

ECN: 5 | STP: 9

Fees

When you execute any trade through your brokers, there is a fee that has to be paid. The fee differs from brokers to brokers, as well as their execution type. Typically, there is no fee on STP accounts.

Slippage

Slippage is the difference between the trader’s intended price to execute a trade and the price he actually received from the broker. There is always this difference due to the volatility of the market and the broker’s execution speed. As a matter of fact, slippage is pretty high on exotic pairs.

Trading Range in USD/HKD

The trading range is the depiction of the minimum, average, and maximum pip movement of a currency pair. And these values help in assessing one’s risk on a trade. By finding the product of the volatility value with the pip valueyou can determine the profit or loss that can be incurred in a specified timeframe.

Procedure to assess Pip Ranges

  1. Add the ATR indicator to your chart
  2. Set the period to 1
  3. Add a 200-period SMA to this indicator
  4. Shrink the chart so you can determine a large time period
  5. Select your desired timeframe
  6. Measure the floor level and set this value as the min
  7. Measure the level of the 200-period SMA and set this as the average
  8. Measure the peak levels and set this as Max.

USD/HKD Cost as a Percent of the Trading Range

This calculation is an extremely helpful tool to analyze the cost variations in a trade. This table is basically a representation of the total cost variations in different timeframes and volatilities of the market. The costs are represented as a percentage of the range, and the magnitude of it depicts the cost of the trade.

ECN Model Account

Spread = 5 | Slippage = 5 |Trading fee = 1

Total cost = Slippage + Spread + Trading Fee = 5 + 5 + 1 = 11

STP Model Account

Spread = 9 | Slippage = 5 | Trading fee = 0

Total cost = Slippage + Spread + Trading Fee = 9 + 5 + 0 = 14

The Ideal way to trade the USD/HKD

Exotic pairs are expensive to trade when compared to major and minor currency pairs. However, it does not mean that one must completely avoid it. There are a few ways by which one can minimize the costs on the trade and take positions on it.

The higher the magnitude of the percentage, the higher is the cost of the trade. It is evident that the values are significant on the min column and comparatively small on the max column. Hence, costs are high for low volatilities markets and vice versa.

When it comes to picking the right time to enter the market, it is ideal to take positions when the volatility of the market is around the average values. From this, one can be guaranteed with affordable costs and decent volatility.

Slippage has a significant weight on the total cost of a trade. However, slippage can be wiped out. Trading using limit orders instead of market orders will take away the slippage on the trade. The next table displays the costs using limit orders.

Spread = 5 | Slippage = 0 |Trading fee = 1

Total cost = Slippage + Spread + Trading Fee = 5 + 0 + 1 = 6

Categories
Candlestick patterns Forex Candlesticks

Candlestick Reversal Patterns IV – The Hammer and The Hanging Man


The Hammer

The Hammer is a one-candle pattern. The Hammer is identified as a small body with a large lower shadow at the bottom of a downtrend. The result of having a small body is that the open and the close are near each other. The large lower shadow means during the session sellers could move down the price but, then, buyers stepped in and pushed the price back to the levels of the open, or, even, a bit further up. That means sellers lost the battle, and the buying activity started dominating the price action. A positive candle is needed to confirm the price action. This usually converts this candle into a Morning Star formation.

Chart 1 – Hammer in the USDCHF Pair

Criteria for Hammers

  1. The lower shadow must be at least twice the length of the body
  2. The real body is at the upper side of the range. The color does not matter much, although a white body would increase the likelihood of the reversal.
  3. There should be no upper shadow or a very tiny one.
  4. The longer the lower shadow, the better
  5. A large volume on the Hammer is a good signal, as a blob woff day might have happened.

Market Psychology

After a relatively large downtrend, the sentiment of the traders is rather bearish. The price starts moving down at the open and makes a new low. Then, buy orders to move the price up. Profit-taking activity also contributes to the upward move. Then intraday stop-loss orders come in fueling the action further up. A positive follow-up candle would confirm the control of the action by the buyers.

The Hanging Man

The Hanging Man is also a figure similar to a Hammer, with its small body and large lower shadow, but it shows up after a bullish trend. The Japanese named this figure that way because it looks like a head with the body and feet hanging.

Chart 2 – Three Hanging Man in the DOW-30 Index

Criteria for the Hanging Man

  1. The lower shadow must be at least twice the length of the body
  2. The real body is at the upper side of the range. The color does not matter much, although a white body would increase the likelihood of the reversal.
  3. There should be no upper shadow or a very tiny one.
  4. The longer the lower shadow, the better
  5. A large volume on the Hammer is a good signal, as a blowoff day might have happened.

Market Psychology

After a strong trend, the sentiment is quite positive and cheerful. On the day of the Hammer, the price moves higher just a bit, then it drops. After reaching the low of the session, the buyers step in again and push the price back up, close to the open level, at which level the session ends. This would indicate the price action is still in control of the buyers, but the considerable drop experienced in the first part of the session would mean the sellers are eager to sell at these levels, and a resistance zone was created. A lower open or a black candlestick the next day would move the control to the sell-side.


Reference.
Profitable Candlestick Patterns, Stephen Bigalow

Categories
Forex Assets

What Should You Know Before Trading The CHF/JPY Currency Pair

Introduction

CHFJPY is a symbolic representation of the Swiss franc against the Japanese yen. Here, CHF is the base currency, and JPY is the quote currency. Since it does not have USD involved, it is classified as a cross-currency pair.

Understanding CHF/JPY

The market price of this pair is the number of JPY that are required to purchase one CHF. It is quoted as 1 CHF per X JPY. For example, it’s current value is 112.31, then 112.31 yen are needed to buy one Swiss franc.

Spread

Spread in forex is the difference between the bid price of a currency and the ask price of it. And this pip difference is used up by the brokers as a form of fee. However, it is not a fixed value. It varies from brokers to brokers.

ECN: 1.3 | STP: 2.1

Fees

Spread is not the only form of fee that is levied by the brokers. There is a commission on the trade as well. The commission is nil on STP accounts, but pips on ECN accounts.

Slippage

When entering a trade using market orders, the trader does not get the exact price he intended when he executed it. There might be a difference in pips. This difference is referred to as slippage. Slippage may be in favor of or against the trader.

Trading Range in CHF/JPY

The trading range is simply a representation of the minimum, average, and maximum pip movement in a currency pair. With these values, one can assess how much money a trader will be risking in a particular timeframe. For example, if the average pip movement on the 4H in this pair is 15 pips, then a trader can expect to win or lose $150.6 in about 4H or so.

Procedure to assess Pip Ranges

  1. Add the ATR indicator to your chart
  2. Set the period to 1
  3. Add a 200-period SMA to this indicator
  4. Shrink the chart so you can determine a large time period
  5. Select your desired timeframe
  6. Measure the floor level and set this value as the min
  7. Measure the level of the 200-period SMA and set this as the average
  8. Measure the peak levels and set this as Max.

CHF/JPY Cost as a Percent of the Trading Range

Apart from knowing the profit or loss can one can incur in a given timeframe, it is necessary to assess the cost of these trades as well. Below is a table that represents the cost variation in different volatilities. And these costs are determined by finding the ratio between the total cost and the volatility.

ECN Model Account

Spread = 1.3 | Slippage = 2 |Trading fee = 1

Total cost = Slippage + Spread + Trading Fee = 2 + 1.3 + 1 = 4.3

STP Model Account

Spread = 2.1 | Slippage = 2 | Trading fee = 0

Total cost = Slippage + Spread + Trading Fee = 2 + 2.1 + 0 = 4.1

The Ideal way to trade the CHF/JPY

The forex market is open 24hours. However, it is not ideal to enter the market at any time. There are times when the costs are low, and times when it’s high.

The percentages in the table are directly proportional to the costs of the trade. It is seen that the percentages are high in the minimum column, and low in the maximum column. Hence, we can conclude that costs are inversely proportional to the volatility of the market. Now, when it comes to choosing the right time to trade, it is best to enter during those times when the volatility of the market is around the average values. This will ensure enough volatility in the market and low costs as well.

In addition, placing orders using limit/pending orders reduces costs too because this will completely nullify the slippage on the trade and will bring down the total cost significantly.

Categories
Candlestick patterns Forex Candlesticks

Candlestick Reversal Patterns III: Understanding the Harami

So far, the reversal formations we saw – the Piercing Pattern, the Dark Cloud Cover, and the Engulfing patterns, were strong reversal signals, showing that the bulls or bears had the control. The Harami is usually a less powerful signal.

The Harami is created when a short candle’s body is entirely contained inside the body of the preceding candle. The color of the second body of this pattern is unimportant, although the color of the first one follows the trend (black in downtrends and white in uptrends). The name “Harami” comes from the old Japanese word meaning “pregnant.” Japanese traders call the first candle, “the mother,” and the second one, “the baby.
The appearance of a Harami is indicative that the current trend has ended. According to Steve Nison, the Japanese say the presence of a Harami shows the market is losing its breath. They contend that, after a large healthy candle, the small inside candle shows uncertainty.
We have to say that if we look at the charts, harami-like formations appear often, but most of it was just pauses or pullbacks of the primary trend. Thus, although not good enough to call for a reversal of the trend, they could be potential signals to exit a trade or take partial profits.
Also, we have to remember that, since trading the Forex markets, and, also, intraday, there are no gaps available. This fact makes a harami quite similar to a Piercing pattern or a Dark cloud Cover if the body of the second candle surpasses half of the previous body.

Chart 1 – Several Haramis in the Cable.

As we see in chart 1, haramis and engulfing patterns are alike, with the exception of the second one.  What we can see is that be it harami or engulfing, the pattern is worth to pay attention to since most of the time signals the end of the previous leg.

Criteria for a Bullish Harami

  1. The body if the first candle is black (red) and the body of the second candle is white (green)
  2. There is evidence of a downtrend.
  3. The second candle opens higher or at the close of the first candle.
  4. Just the body needs to be inside the body of the first candle. That is unlike the inside day.
  5. A confirmation is needed for a reversal signal.
  6. The longer the black and white candles, the more powerful the signal
  7. The higher the white candle closes, the better.

Market Psychology of a Bullish Harami

After a selloff day, the next day, sellers don’t have the strength to push the prices further down. Concerned short-sellers start to take profits of just close the trade fuelling the purchases. The price finishes higher, and traders mark the double bottom as support. A strong day following the harami formation would convince the market participants that the trend has reversed.

Criteria for a Bearish Harami

  1. The body if the first candle is white (green) and the body of the second candle is black (red)
  2. There is evidence of an uptrend.
  3. The second candle opens lower or at the close of the first white candle.
  4. Just the body needs to be inside the body of the first candle. That is unlike the inside day.
  5. A confirmation is needed for a reversal signal.
  6. The longer the white and black candles, the more powerful the signal
  7. The lower the black candle closes, the better.

Chart 2- Several Haramis in the GBPAUD pair. Not all are successfully signaling a reversion of a trend

Market Psychology of a Bearish Harami

After a strong bullish trend, a long white candle emerges. In the next session, the longs cannot force more upsides. The asset began to drop, as concerned bulls are closing their positions to pocket their profits, and the day finished lower. Also, short-term traders mark the top of the white candle as a resistance level. A third day showing weakness is what is needed to convince everybody that the uptrend is over and a new leg down is starting.


References:

Profitable candlestick Patterns, Stephen Bigalow

The Candlestick Course: Steve Nison


Categories
Candlestick patterns Forex Candlesticks

Candlestick Reversal Patterns: Refresh your Knowledge

After our last articles on candlestick reversal patterns, test your knowledge.

If you need to give a second read, these are the links:


Let’s begin


[wp_quiz id=”59882″]


Reference:

The Candlestick Course: Steve Nison


Categories
Forex Assets

Analyzing The CAD/JPY Forex Asset Class

Introduction

CADJPY is the abbreviation for the currency pair, the Canadian dollar against the Japanese yen. This pair is one of the most extensively traded cross currency pairs. In CADJPY, CAD is referred to as the base currency and JPY as the quote currency.

Understanding CAD/JPY

The value of CADJPY is the value of JPY, which is required to purchase one CAD. It is quoted as 1 CAD per X JPY. For example, if the current market price of this pair is 82.651, then these many units of Japanese yen are needed to buy one Canadian dollar.

Spread

The bid price is the price used to sell a currency, and ask price is the price used to buy a currency. There is always a difference between the two prices. This difference is called the spread. It varies from broker to broker and also the type of their execution model.

ECN: 1.1 | STP: 2

Fees

Similar to stockbrokers, there are forex brokers who charge a few pips of fee on each position a trader opens and closes. This fee is no different from the commission brokers levy. On STP accounts, the fee is nil, while on ECN accounts, it is between 6-10 pips depending on the broker one is using.

Slippage

Slippage in trading is the difference between the price requested by the trader and the price he actually received. The two factors responsible for slippage are,

  • The volatility of the market
  • Broker’s execution speed

Trading Range in CAD/JPY

A trading range is a tabular representation of the number of pips a currency pair moved in a given timeframe. It represents the minimum, average as well as the maximum pip movement in six different timeframes. These values prove to be important for assessing one’s risk on a trade. For example, if the minimum pip movement in CADJPY on the 4H timeframe is ten pips, then a trader can expect to lose $917 in about 4H.

Procedure to assess Pip Ranges

  1. Add the ATR indicator to your chart
  2. Set the period to 1
  3. Add a 200-period SMA to this indicator
  4. Shrink the chart so you can determine a large period
  5. Select your desired timeframe
  6. Measure the floor level and set this value as the min
  7. Measure the level of the 200-period SMA and set this as the average
  8. Measure the peak levels and set this as Max.

CAD/JPY Cost as a Percent of the Trading Range

As already mentioned, there is a fee for every trade you take. And knowing the percent fee on the trades you are taking is important, as it depends on the volatility of the market and the timeframe you are trading.

Below is a representation of the total cost variation on trade in terms of percentages. Since costs on ECN accounts are different from STP accounts, we have two separate tables for this concept.

ECN Model Account

Spread = 1.1 | Slippage = 2 |Trading fee = 1

Total cost = Slippage + Spread + Trading Fee = 2 + 1.1 + 1 = 4.1

STP Model Account

Spread = 2 | Slippage = 2 | Trading fee = 0

Total cost = Slippage + Spread + Trading Fee = 2 + 2 + 0 = 4

The Ideal way to trade the CAD/JPY

Before getting right into it, let us comprehend the above tables. The higher the values of the percentages, the higher are the costs on the trade. It is pretty evident from the table that, percentage values are on the higher side in the min column and comparatively lower in the max column. This means that the costs are high when the volatility of the market is low and vice versa. Also, the trades that are taken based on a long term perspective, the costs are considerably low.

One may trade the high volatility markets to minimize your costs, or trade during low volatility by paying high costs. However, it is ideal to enter during those times of the day when the volatility is close to the average values. During these times, one can expect comparatively low costs with enough volatility as well.

On a further note, another simple and effective way to reduce costs is by trading using limit orders. This entry method will take slippage out of the total costs and bring down its value considerably. An example of the same is given below.

Spread = 2 | Slippage = 0 | Trading fee = 0

Total cost = Slippage + Spread + Trading Fee = 2 + 0 + 0 = 2

Categories
Candlestick patterns Forex Candlesticks

Candlestick Reversal Patterns II: Let’s know The Engulfing Patterns


The engulfing pattern is a major reversal figure, and it is composed of two inverted candlesticks, as in the case of the Piercing pattern and the Dark Cloud Cover figure. Typically, this figure appears at the end of an upward or downward trend. It is common that the price pierces a significant resistance or support level, then making a gap up or down in the following session, to, suddenly, change its direction and end the day entirely covering the first candle.

The Bullish Engulfing

The bullish engulfing candle shows at the bottom of the trend. After several sessions with the price controlled by sellers, another black candle forms. The next session opens below the previous session close and closes above the last open, thus, completely covering the body of the black candle made on the previous session.

Criteria:

  1. The body of the second candlestick covers completely that of the black candle.
  2. There is evidence of a downward trend, even a short-term one.
  3. The body of the second candle is white and of the opposite color of the first candlestick. The exception is when the first candlestick is a doji or a tiny body. In this case, the color of the first candle is unimportant.
  4. The signal is enhanced if a large body engulfs a small body.
  5. a Large volume on the engulfing day also improves the signal.
  6. A body engulfing more than one previous candle shows the strength of the new direction.
  7. Engulfing also the shadows of the previous candle is also good news.
  8. In case of a gap, the larger the gap, the higher the likelihood of a significant reversal.

Market Sentiment:

After a downtrend, the next day, the price starts lower than the previous close but, after a short while, the buyers step in and move the price up. The late sellers start to worry, as they see their stops caught, adding more buying to the upward movement. As the price moves up, it finds a combination of profit-taking, stop-loss orders, and new buy orders. At the end of the day, this combination creates a strong rally that moves the price above the previous close.

 Fig 1- Bearish and Bullish engulfing patterns in the Bitcoin 4H  chart

The Bearish Engulfing

The Bearish engulfing pattern is the specular figure of a Bullish engulfing figure. And more so in the Forex market where assets are traded in pairs, making every move symmetrical.

The bearish engulfing forms after an upward trend. It is composed of two different-colored bodies, as in the above case. This time, though, the order is switched, and a bullish body is followed by a black candle. Also, the black body engulfs completely the body of the previous white candlestick. Sometimes that comes after the price piercing a key resistance, to then come back, creating a fake breakout.

Criteria:

  1. The uptrend is evident, even short-term.
  2. The body of the second day engulfs the body of the previous day.
  3. The body of the second candle is black, and the previous candle is a white candlestick, except for tiny bodies or dojis. In that case, the color of the first candlestick is unimportant.
  4. A large body engulfing a small body is an enhancement, as it confirms a change in the direction.
  5. A large volume on the engulfing day is also good for the efficacy of the signal.
  6. A body engulfing more than one previous candle shows the strength of the new direction.
  7. Engulfing also the shadows of the previous candle is also good news.
  8. In case of a gap, the larger the gap, the higher the likelihood of a substantial reversal.

Market sentiment:

After an uptrend, the price opens higher but, after a while, it reverses and moves below the previous open and below. Some stops trigger and add more fuel to the downside. The downward action accelerates on a combination of profit-taking, more stops hit, and new short orders. At the end of the day, the price closes below the open of the previous session, with the sellers in control. 

—- 

References:

The Candlestick Course: Steve Nison

Profitable candlestick Patterns, Stephen Bigalow

Categories
Forex Assets

Fundamentals Of CAD/CHF Forex Currency Pair

Introduction

CAD/CHF is a currency pair where two currencies, namely, the Canadian dollar and the Swiss franc, are involved. It is a cross-currency pair. Here, CAD is called the based currency, and CHF is called the quote currency.

Understanding CAD/CHF

The current market price of CADCHF tells the value of CHF equivalent to one CAD. It is represented as 1 CAD per X CHF. For example, if the value of CADCHF in the market is 0.7372, then one must pay 0.7372 Swiss francs to buy one Canadian dollar.

Spread

In simple terms, the spread is the difference between the bid price and the ask price set by the brokers. It is not a fixed value and differs from time to time and broker to broker. It also varies based on the type of execution model.

ECN: 1 | STP: 2

Fees

The fee is the commission that is levied by the broker on each trade a trader takes. This, too, like the spread, differs from broker to broker and the type of their execution model. Fee on ECN accounts is 6-10 pips, while it is nil on STP accounts.

Slippage

Slippage is the difference between the trader’s executed price and the price he actually received from the broker. There is always this difference due to the volatility of the market and the broker’s trade execution speed. Note that slippage only happens on market orders.

Trading Range in CAD/CHF

Apart from analyzing the direction of the market, one must predetermine their risk and reward based on the volatility and the timeframe. Knowing how much a trader will gain or lose in a given time frame is a vital trade management tool. And below is a table through which one can determine their profit/loss that can be made in a specified timeframe. For example, the average pip movement on the 1H timeframe is 6.8. So, a trader can expect to be in a profit of $68.34 or in a loss of the same amount.

Procedure to assess Pip Ranges

  1. Add the ATR indicator to your chart
  2. Set the period to 1
  3. Add a 200-period SMA to this indicator
  4. Shrink the chart so you can assess a large time period
  5. Select your desired timeframe
  6. Measure the floor level and set this value as the min
  7. Measure the level of the 200-period SMA and set this as the average
  8. Measure the peak levels and set this as Max.

CAD/CHF Cost as a Percent of the Trading Range

An application to the above volatility table is to find the cost differences on trades by considering the volatility and the total cost on a trade. Below is the table that illustrates the variation in cost on a trade, in terms of percentage. The comprehension of it is discussed in the subsequent topic.

ECN Model Account

Spread = 1 | Slippage = 2 |Trading fee = 1

Total cost = Slippage + Spread + Trading Fee = 2 + 1 + 1 = 4

STP Model Account

Spread = 2 | Slippage = 2 | Trading fee = 0

Total cost = Slippage + Spread + Trading Fee = 2 + 2 + 0 = 2

The Ideal way to trade the CAD/CHF

The higher the magnitude of the percentage, the higher is the cost of the trade.

The values in the table are least in the min column and highest in the max column. This simply means that the costs are high when the volatility of the market is low and vice versa.

In the average column, the values are not as low as in the max column, and not as high as in the max column. The volatility here is moderate too. Hence, this becomes our ideal time of the day to trade in the market.

To sum it up, one must trade during those times of the day when the volatility is more or less near the average values. This will ensure decent volatility as well as minimal costs.

There is another simple technique to reduce costs on trade. When trades are executed using limit order instead of market orders, the slippage becomes nil. So, this brings down the total cost of the trade by a significant value.

Categories
Forex Assets

What Should Know About The AUD/JPY Currency Pair?

Introduction

AUDJPY is the abbreviation for the Australian dollar and the Japanese yen. It commonly referred to as “Aussie yen.” It is one of the cross-currency pairs in the forex market. AUD, being on the left, is termed as the base currency and JPY as the quote currency.

Understanding AUD/JPY

The market price of AUDJPY corresponds to the value of JPY that needs to be paid to buy one AUD. It is quoted as 1 AUD per X JPY. For example, if the value of AUDJPY is 74.571, then these many units of the yen are to be produced to purchase one Australian dollar.

AUD/JPY Specification

Spread

Spread is the medium through which brokers generate their revenue. They set different prices for buying a currency and selling a currency. The difference amount becomes their profit margin. The spread usually changes from time to time and varies on the type of execution model.

ECN: 0.7 | STP: 1.6

Fees

Apart from spreads, one needs to pay a charge for every execution a trader makes. It is essentially the commission levied by the broker on each trade. As a matter of fact, there is no fee on STP accounts. But, on ECN accounts, there is a fee of few pips.

Slippage

Going by the definition, slippage is the difference between the price executed by the trader and the price he actually received. It could be in favor of the trader or against him. It all depends on the broker’s execution speed and the change in the volatility of the market.

Trading Range in AUD/JPY

A trading range is a tabular representation of the minimum, average, and the maximum pip movement in a currency pair on different timeframes. These values help in determining the profit that can be made or loss one must bear in a given time frame. And this can be found out by simply finding the product between the pip movement and the value per pip ($9.15).

Procedure to assess Pip Ranges

  1. Add the ATR indicator to your chart
  2. Set the period to 1
  3. Add a 200-period SMA to this indicator
  4. Shrink the chart so you can determine a large time period
  5. Select your desired timeframe
  6. Measure the floor level and set this value as the min
  7. Measure the level of the 200-period SMA and set this as the average
  8. Measure the peak levels and set this as Max.

AUD/JPY Cost as a Percent of the Trading Range

Cost as a percent of the trading range is an illustration of the cost variation by considering the total cost and the volatility of the market in different timeframes. These values are expressed in a ratio that is converted to percentages. And the magnitude of these percentages helps in determining the cost variation in each trade.

ECN Model Account

Spread = 0.7 | Slippage = 2 |Trading fee = 1

Total cost = Slippage + Spread + Trading Fee = 2 + 0.7 + 1 = 3.7

STP Model Account

Spread = 1.6 | Slippage = 2 | Trading fee = 0

Total cost = Slippage + Spread + Trading Fee = 2 + 1.6 + 0 = 3.6

The Ideal way to trade the AUD/JPY

Though Forex is a 24/7 market, it is not ideal to enter any time in the market. There are certain times when you must enter the market, which can help reduce costs significantly. Let us determine that using the above tables.

Note that the higher the magnitude of the percentage, the higher is the cost of the trade. From the table, it can be ascertained that the values are high in the minimum column, implying that the costs are high when the volatility of the market is low. Similarly, the costs are low when the volatility is high. However, it is not ideal to trade during these times. To ensure optimum volatility and affordable cost, one must trade during those times when the volatility is around the average range.

Furthermore, there is another way through which you can reduce your costs. Trading using limit orders instead of the market orders brings down the total cost significantly, as the slippage becomes zero. The decline in the costs on the trade when slippage is made zero is shown below.

Categories
Forex Assets

Basics Of Trading The AUD/CHF Currency Pair & Analyzing The Trading Costs Involved

Introduction

AUDCHF is the abbreviation for the Australian dollar and the Swiss franc. It is a cross-currency pair in the market. AUD being on the left is the base currency, and CHF (on the right) is the quote currency. One can expect high volatility and liquidity during the Australian session.

Understanding AUD/CHF

The value of AUDCHF represents the amount of Swiss Francs required to buy one Australian dollar. It is quoted as 1 AUD per X CHF. For example, if the value of AUDCHF is 0.6885, then this number represents the CHF that is to be produced by the trader to buy one AUD.

AUD/CHF Specification

Spread

Spread is the difference between the bid price and the ask price of the market set by the brokers. It is not a fixed value. It differs from the account type as well as the broker.

ECN: 0.7 | STP: 1.7

Fees

Brokers charge a fee on every trade a trader takes. It could be per execution or finished trade (round trip). Also, it varies from the type of account model. Typically, fee on ECN type is 5-10 pips, and 0 on STP type.

Slippage

Slippage is the difference between the price demanded by the trader and the price he actually received from the broker. There is always a variation in this due to the broker’s execution speed and market volatility.

Trading Range in AUD/CHF

Wanting to know how much profit one can make in a given time? If so, then you may find the answer in the table illustrated below. This table is the representation of the min, average, and max volatility of the currency pair in different timeframes. And with these values in the table, one can determine the profit on a trade.

Procedure to assess Pip Ranges

  1. Add the ATR indicator to your chart
  2. Set the period to 1
  3. Add a 200-period SMA to this indicator
  4. Shrink the chart so you can determine a significant period
  5. Select your desired timeframe
  6. Measure the floor level and set this value as the min
  7. Measure the level of the 200-period SMA and set this as the average
  8. Measure the peak levels and set this as Max.

AUD/CHF Cost as a Percent of the Trading Range

The cost as a percent of the trading range is determined in the following table using different volatilities, assuming that the trading range can be seen as the potential profit on a given timeframe. The percentages are obtained by finding the ratio between the total cost of the trade and the range values. These values, thus, help in assessing the right moments in the day to trade the currency pair.

ECN Model Account

Spread = 0.7 | Slippage = 2 |Trading fee = 1

Total cost = Slippage + Spread + Trading Fee = 2 + 0.7 + 1 = 3.7

STP Model Account

Spread = 1.7 | Slippage = 2 | Trading fee = 0

Total cost = Slippage + Spread + Trading Fee = 2 + 1.7 + 0 = 3.7

The Ideal way to trade the AUD/CHF

Firstly, the higher the value of the percentage, the higher is the cost of the trade. It is pretty evident from the above tables that the costs are higher in the min column and keep decreasing in the subsequent columns. Meaning, as the volatility increases, the total cost of the trade reduces. But, it is not ideal to trade in either of the extremes. To have an affordable cost and optimal volatility, it is best to enter during those times of the day when the pip movement for the pair is more or less equal to the average values.

Furthermore, the total cost can easily be reduced by trading using limit order instead of market orders. This methodology would bring down the slippage to zero. Hence, significantly affecting the percentage values. And an example of the same is depicted below.

Categories
Forex Assets

Understanding The AUD/CAD Forex Currency Pair

Introduction

AUDCAD is the abbreviation for the currency pair, the Australian dollar, and the Canadian dollar. It is a cross-currency pair. One can expect great volatility and liquidity in the market during the Australian session. AUD is the base currency, and CAD is the quote currency.

Understanding AUD/CAD

The value of AUDCAD is the number of Canadian dollars required to buy one Australian dollar. It is quoted as 1 AUD per X CAD. For example, if the value of this pair is 0.9013, then 0.9013 CAD is needed to purchase one AUD.

AUD/CAD Specification

Spread

Spread in trading is the difference between the bid price and the ask price set by the broker. This pip difference is how brokers generate revenue. The spread always varies from broker to broker and the type of account model.

ECN: 1 | STP: 1.9

Fees

Apart from spreads, brokers charge a few pips of fee or commission on each trade you take. This exists only ECN accounts, as a fee on STP accounts is nil.

Slippage

Due to the delay in the broker’s execution speed and volatility of the market, a trader doesn’t get the exact price he intended. This difference in prices is referred to as slippage. It typically varies from 0.5 pips to 5 pips.

Trading Range in AUD/CAD

The trading range is the representation of the minimum, average, and maximum volatility in the market in a given timeframe. This proves to be useful in determining the profit/loss that can be made in a specific amount of time. One can determine this simply by finding the product of the pip movement on the required timeframe and the pip value (mentioned in the specification table).

Procedure to assess Pip Ranges

  1. Add the ATR indicator to your chart
  2. Set the period to 1
  3. Add a 200-period SMA to this indicator
  4. Shrink the chart so you can assess a large time period
  5. Select your desired timeframe
  6. Measure the floor level and set this value as the min
  7. Measure the level of the 200-period SMA and set this as the average
  8. Measure the peak levels and set this as Max.

AUD/CAD Cost as a Percent of the Trading Range

The cost of trade is an essential point of consideration in trading. Cost is that factor that is not fixed and varies on different variables. For example, when the volatility changes, the costs change. The same is the case with timeframes as well. Below is a table that illustrates the variation in the costs on a trade for different timeframes and volatilities.

ECN Model Account

Spread = 1 | Slippage = 2 |Trading fee = 1

Total cost = Slippage + Spread + Trading Fee = 2 + 1 + 1 = 4

STP Model Account

Spread = 1.9 | Slippage = 2 | Trading fee = 0

Total cost = Slippage + Spread + Trading Fee = 2 + 1.9 + 0 = 3.9

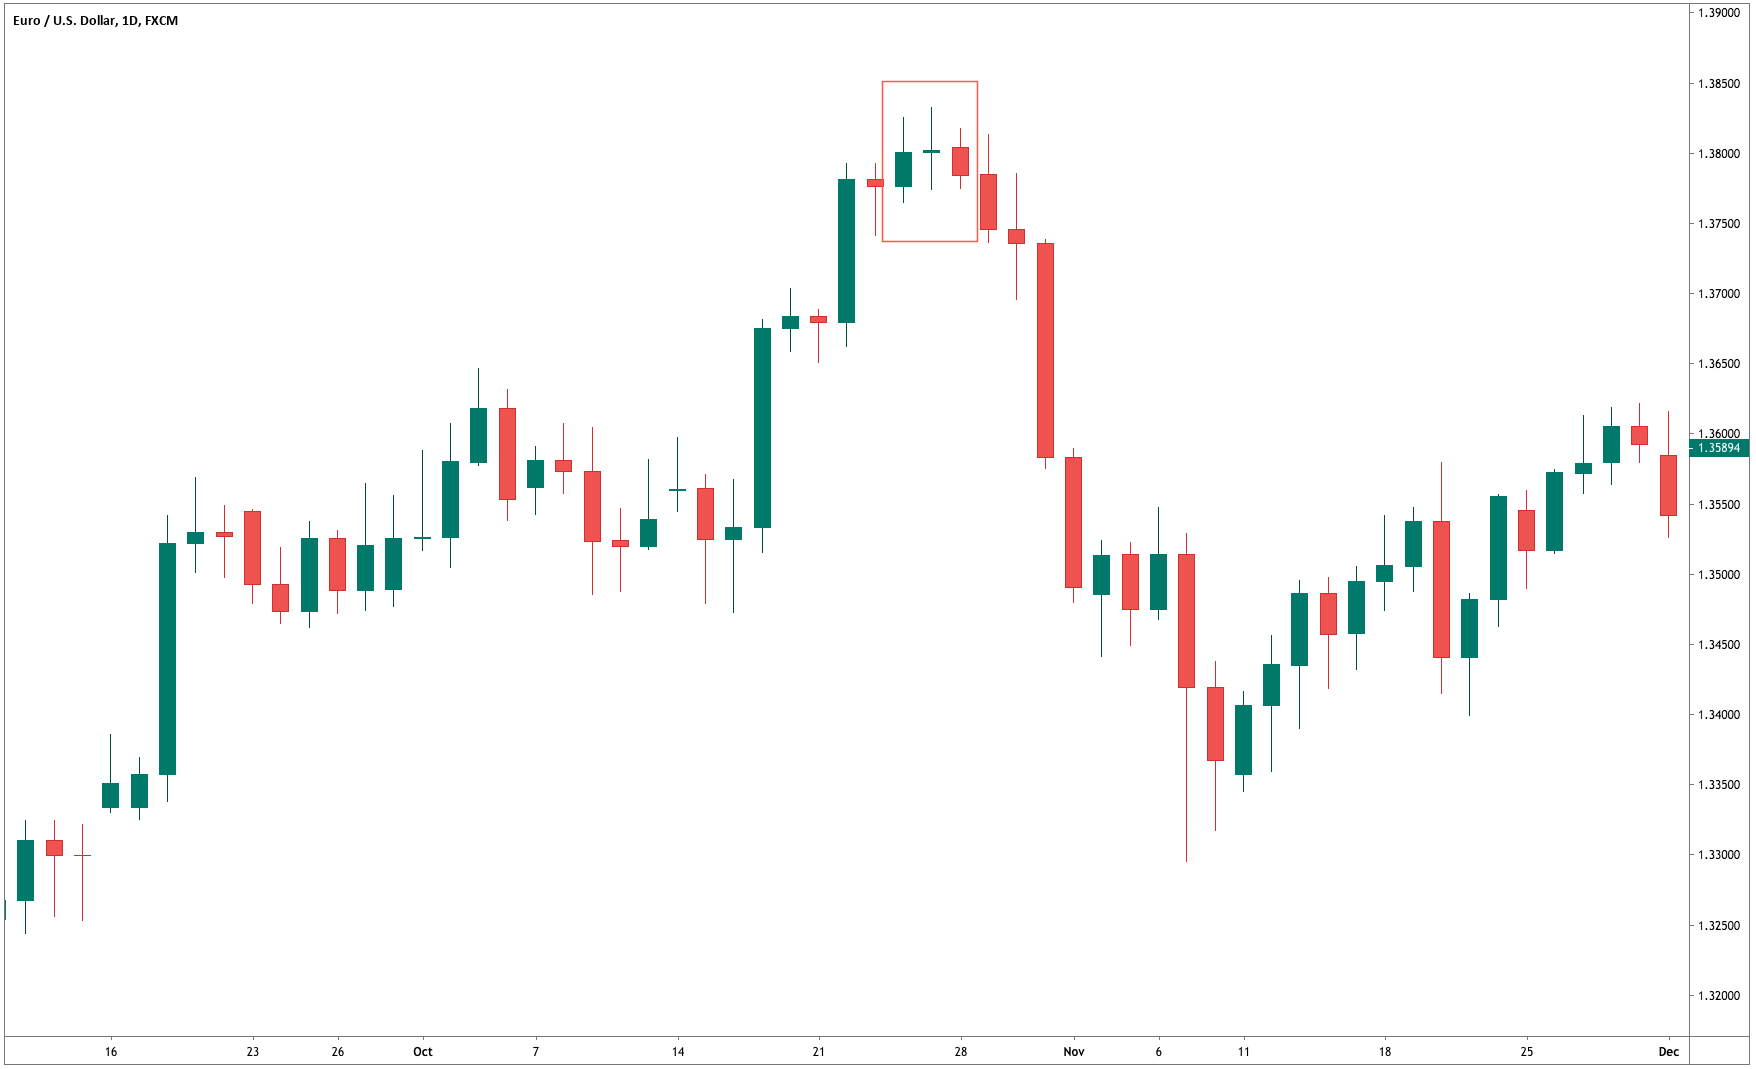
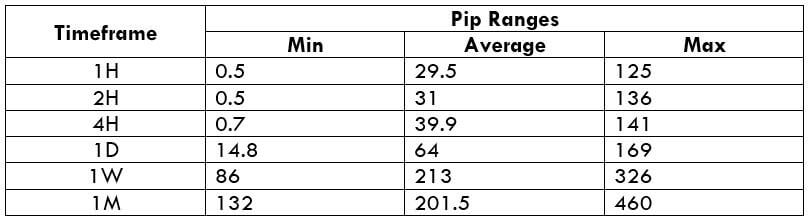
The Ideal way to trade the AUD/CAD

Comprehending the above tables is simple. The higher the magnitude of the costs, the higher is the total cost that has to be paid on a trade and vice versa. In the table, the percentages are on the higher side in the min column and lower in the max column. Hence, it can be concluded that the costs are higher when the volatility is low and vice versa. However, it isn’t ideal to trade in these situations. It is rather preferred to enter the market when the volatility is around the average values because the costs are affordable, and the volatility is as needed.

Moreover, it is recommended to design strategies such that limit orders are put to use. This shall completely eliminate the slippage on the trade. And with the elimination of slippage, the total cost would significantly reduce as well.

Categories
Candlestick patterns Forex Candlesticks

Candlestick Reversal Patterns I: Overview and The Piercing Pattern

Candlestick Reversal patterns: An Overview

Candlestick reversal figures are composed mainly of bu two or three candlesticks, which in combination harness the psychological power to shift the market sentiment. 

Depending on the importance of the severity of reversal, their names vary. Japanese are very visual regarding the names they gave to them. Therefore, we can almost visualize them just by its name.

In this article, we will learn the following content:

  • Overview of the reversal candlestick patterns
  • how to identify a Bullish Piercing pattern and its specular Dark Cloud Cover pattern
  •  How important engulfing patterns are and how to recognize them
  • Experience how counterattack figures lead to swift trend reversals.

The predicting power of two candle figures is sometimes astonishing. For a sample to be statistically significant, scientists need more than 20 samples for normally distributed phenomena, sometimes more. A reversal figure only shows eight data points. 2x (OHLC), and besides that traders most of the time, the reversal figure warns about a trend reversal or at least the end of the current trend.

The typical reversal pattern is a two candle figure that begins with a topping or bottoming candle followed by an opposite candle that erases partially or totally, the price action of the first one.

Piercing pattern and Dark Cloud Cover

The Piercing Pattern and the Dark Cloud Cover are specular patterns. The Piercing Pattern warns of a reversal of the bearish trend, whereas the Dark Cloud Cover heralds the end of a bullish trend.

 Candlesticks are not always good predictors, and the Piercing Pattern is a weak signal, especially if the trend has not moved too deep yet. Of course, the most oversold is the price, the better a Piercing Pattern predicts a reversal. The Dark Cloud Cover, though, is seen to show much more predicting power.

Timeframes

The Japanese used them mostly in daily and weekly timeframes. The use of these two patterns in intraday trading must be confirmed with other signals, as, for instance, the Piercing Pattern occurring after hitting a significant support or a Dark Cloud cover as a result of a strong resistance rejection. The use of short-term oscillators such as 10-period stochastics or Williams percent R in combination with these two signals will improve the likelihood of success while trading them.

Recognizing a Piercing Pattern


The bullish Piercing Pattern is composed of a large bearish body forming after a broad downtrend. The next candle begins below the low of the first black candle, and closes above the midway up, or even near the open if the preceding bearish candle. 

Criteria:
  1. The first candle shows a black body
  2. The second candle shows a white body
  3. The Downtrend is clear and for a long time
  4. The second day opens below the range of the previous day
  5. the second white candle closes beyond the 50% of the range of the last day.
  6. The longer the candles, the better their predicting power.
  7. If there is a gap down, the greater, the better
  8. The higher the white candle closes, the stronger the signal
  9. A large volume during these two candles is significant.

The Dark Cloud Cover

Apply the specular conditions to the Dark Cloud cover. We also should remember that trading forex pairs make both patterns fully symmetrical.

Criteria:
  1. The first candle shows a white body
  2. The second candle shows a black body
  3. The upward trend is clear and for a long time
  4. The second day opens above the range of the previous day
  5. the second black candle closes below the 50% of the range of the last day.
  6. The longer the candles, the better their predicting power.
  7. If there is a gap up, the greater, the better
  8. The lower the black candle closes, the stronger the signal
  9. A large volume during these two candles is significant.


Final words

lease note that the Forex and crypto markets rarely have gaps. Therefore, the condition that the second open being below the range of the first candle is almost impossible to satisfy. In this case, we rely solely on the relative size of both candlesticks and the closing above 50 percent of the range of the black candle. Of course, it is almost impossible to get gaps in intraday charts except for spikes due to sudden unexpected events.


References: 

The Candlestick Course: Steve Nison

Profitable candlestick Patterns, Stephen Bigalow

Categories
Forex Assets

AUD/NZD – Everything About This Forex Currency Pair

Introduction

AUD/NZD is derived from the full-form of the currency pair, the Australian dollar, and the New Zealand dollar. It comes under the classification of cross currency pairs. In this pair, AUD is the base currency, and NZD is the quote currency.

Understanding AUD/NZD

The value of AUD/NZD depicts the value of NZD that is equivalent to AUD. It is simply quoted as 1 AUD per X NZD. For example, if the current value of this pair is 1.0405, then these many New Zealand dollars are needed to purchase one Australian dollar.

AUD/NZD Specification

Spread

Spreads are a typical way through which brokers make money. The pip difference between the bid price and the ask price is their profit margin, which is referred to as the spread. It varies from the type of account model.

ECN: 0.9 | STP: 1.8

Fees

The fee is basically the commission on a trade levied by the broker on each trade. Again, it varies from the type of account model.

Fee on STP = 0

Fee on ECN = 6 to 10 pips (starts from as low as one pip)

Slippage

The slippage is the difference between the broker’s executed price and the trader’s execution price. There is this variation as the order is executed using market execution. There are two reasons for slippage to take place.

  • Broker’s execution speed
  • Market’s volatility

Trading Range in AUD/NZD

Assessing the profit/risk is a great add-on to one’s trading analysis. With this, the trader can know how long he must before his trade performs. And below is the table that enables the analysis of it.

Procedure to assess Pip Ranges

  1. Add the ATR indicator to your chart
  2. Set the period to 1
  3. Add a 200-period SMA to this indicator
  4. Shrink the chart so you can assess a large time period
  5. Select your desired timeframe
  6. Measure the floor level and set this value as the min
  7. Measure the level of the 200-period SMA and set this as the average
  8. Measure the peak levels and set this as Max.

AUD/NZD Cost as a Percent of the Trading Range

This is one great application of the above table. By combining these values with the total cost of trade, one can determine variations in the costs by varying the parameters like volatility and timeframe.

ECN Model Account

Spread = 0.9 | Slippage = 2 |Trading fee = 1

Total cost = Slippage + Spread + Trading Fee = 2 + 0.9 + 1 = 3.9

STP Model Account

Spread = 1.8 | Slippage = 2 | Trading fee = 0

Total cost = Slippage + Spread + Trading Fee = 2 + 1.8 + 0 = 3.8

The Ideal way to trade the AUD/NZD

Before getting into finding the best way to trade this pair, let us comprehend what the above table has got to say.

The higher the magnitude of the percentages, the higher is the cost on the trade for that particular volatility and timeframe. The min column represents low volatility, and the max column represents high volatility.

It can clearly be ascertained from the table that the percentages are comparatively higher on the min column and lower on the max column. This means that the costs are high when volatility is low and vice versa.

But, it is not ideal to trade in neither of the two situations mentioned below.

When the volatility is high -> because of the risk involved
When the volatility is low -> because the costs are high

Now, to maintain a balance between all the parameters, it is best to trade when the pip movement is around the average values.

Furthermore, another simple way to reduce cost is by trading using a pending/limit order instead of market orders, as it will nullify the slippage on the trade. And this, in turn, will reduce the total cost of the trade as well.

Categories
Forex Assets

What Should You Know Before Trading The NZD/JPY Currency Pair

Introduction

NZDJPY, or the NZD/JPY or the New Zealand dollar against the Japanese yen, is a cross-currency pair in the Forex market. The left currency (NZD) represents the base currency, and the one the right (JPY) represents the quote currency.

Understanding NZD/JPY

The market value of NZDJPY is a value of JPY that is required to buy one NZD. It is quoted as 1 NZD per X JPY. For example, if the CMP (current market price) of NZDJPY is 72.657, then it takes 72.657 yen to buy one New Zealand dollar.

NZD/JPY Specification

Spread

Spread is the difference between the bid price and the ask price controlled by the broker. It varies across brokers and their type of execution.

ECN: 0.8 | STP: 1.7

Fees

On every trade a trader takes, there are few pips of fee on it. And this is only on ECN accounts because the fee on STP accounts is nil.

Slippage

Slippage, which happens on market orders, is the difference between the price asked by the client and the price he actually received. There are two primary reasons for it, namely, the broker’s execution speed and the change in volatility of the market.

Trading Range in NZD/JPY

The average, minimum, and maximum pip movement is determined in the trading range table. This comprehensive table helps traders assess the profit they can generate and loss they can incur in a given timeframe. Moreover, this table is helpful in analyzing the cost variation in a trade, which shall be discussed in the next section.

Procedure to assess Pip Ranges

  1. Add the ATR indicator to your chart
  2. Set the period to 1
  3. Add a 200-period SMA to this indicator
  4. Shrink the chart so you can assess a large time period
  5. Select your desired timeframe
  6. Measure the floor level and set this value as the min
  7. Measure the level of the 200-period SMA and set this as the average
  8. Measure the peak levels and set this as Max.

NZD/JPY Cost as a Percent of the Trading Range

The cost of a trade is not the same throughout the trading day. It varies based on the volatility of the market. Hence, it is necessary to know during what times the cost is high and what times it is low. This could be found out from the table illustrated below.

ECN Model Account 

Spread = 0.8 | Slippage = 2 |Trading fee = 1

Total cost = Slippage + Spread + Trading Fee = 2 + 0.8 + 1 = 3.8

STP Model Account

Spread = 1.7 | Slippage = 2 | Trading fee = 0

Total cost = Slippage + Spread + Trading Fee = 2 + 1.7 + 0 = 3.7

The Ideal way to trade the NZD/JPY

The magnitude of the cost percentage is directly proportional to the cost of a trade. So, the higher the value of the percentage, the higher is the cost of a trade. From the table, it can be observed that the cost is highest in the min column compared to the other two columns. This means that the costs are highest when the volatility of the market is low and vice versa, irrespective of the timeframe you’re trading. It is neither ideal to trade when the volatility of the market is high, nor when the costs are high. The average column is on the one we focus on. Trading when the volatility is at the average value is when you can expect moderate volatility and decent costs.

Also, you may reduce your costs by trading using limit or pending orders instead of market orders. This will bring the slippage to ground zero. This, in turn, will reduce the total cost of the trade as well. An example of the same is illustrated below.

Spread = 1.7 | Slippage = 0 | Trading fee = 0

Total cost = Slippage + Spread + Trading Fee = 0 + 1.7 + 0 = 1.7

Hence, it is seen that the costs have reduced by around 50% of the previous value.

Categories
Forex Assets

Understanding The Basics Of NZD/CHF Forex Pair

Introduction

NZDCHF is a cross-currency pair in the Forex market. It is an abbreviation for the New Zealand dollar and the Swiss franc. Here, NZD is the base currency, and CHF is the quote currency.

Understanding NZD/CHF

The value of NZDCHF simply represents the units of CHF equivalent to one unit of NZD. It is quoted as 1 NZD per X CHF. For example, in the market, if the price of NZDCHF is 0.64535, then it requires those many units of CHF to buy one NZD.

NZD/CHF Specification

Spread

The bid price and ask price in the market is typically not the same. The difference between these two prices is referred to as the spread. And this difference amount is used by the broker. It varies from the type of account model.

ECN: 1.1 | STP: 1.9

Fees

The fee is basically the commission that has to be paid on each trade you take. It varies from broker to broker and their execution type. Typically, there is no fee on STP accounts, but a few pips on ECN accounts.

Slippage

Another type of fee traders have to bear is the slippage. It is the difference between the trader’s requested price and the broker’s executed price. Slippage always is changing due to the ups and downs in market volatility and the broker’s execution speed.

Trading Range in NZD/CHF

Many novice traders randomly take trades without determining the amount they’re going to risk. The trading range is that representation, which indirectly illustrates the risk and profit area in a trade, in a given time frame. For example, if the average pip movement on NZDCAD on the 4H timeframe is 20 pips, then the trader will be risking $205.4 in an hour on an average.

Procedure to assess Pip Ranges

  1. Add the ATR indicator to your chart
  2. Set the period to 1
  3. Add a 200-period SMA to this indicator
  4. Shrink the chart so you can assess a large time period
  5. Select your desired timeframe
  6. Measure the floor level and set this value as the min
  7. Measure the level of the 200-period SMA and set this as the average
  8. Measure the peak levels and set this as Max.

NZD/CHF Cost as a Percent of the Trading Range

Apart from knowing the profit/loss that can be made from a trade in a given time, it is also necessary to know the cost variation in different volatilities and timeframes. Below is a table representing the cost as a percentage that is obtained by considering the volatility, timeframe, and the total cost on a trade.

ECN Model Account 

Spread = 1.1 | Slippage = 2 |Trading fee = 1

Total cost = Slippage + Spread + Trading Fee = 2 + 1.1 + 1 = 4.1

STP Model Account

Spread = 1.9 | Slippage = 2 | Trading fee = 0

Total cost = Slippage + Spread + Trading Fee = 2 + 1.9 + 0 = 3.9

The Ideal way to trade the NZD/CHF

Trading on any timeframe and during any volatility is not an efficient way of trading. There are specific times in the market when you must enter/exit. This can be determined from the above two tables. Firstly, the higher the magnitude of the percentage, the higher is the cost of a trade for that particular timeframe and volatility. It can be ascertained from the table that the costs are low for high volatilities and high for low volatilities. And neither of the two states is ideal to trade. To keep your cost affordable and volatility moderate, it is ideal to trade when the volatility is nearby the average values.

Furthermore, it is recommended to have strategies that enable the use of limit orders. Because trading with limit orders will completely cut off the slippage on the trade Nullifying it, the total cost will significantly reduce, which, in turn, will reduce the cost percentage as well. For example, it was observed that cost percentages were reduced by about 50% when the slippage was removed.

Categories
Forex Assets

What Should You Know Before Trading The NZD/CAD Currency Pair

Introduction

NZDCAD is the abbreviation for the currency pair New Zealand dollar against the Canadian dollar. It is referred to as a cross-currency pair. Here, NZD is the base currency, and CAD is the quote currency. In this article, we shall be going over everything you need to know about this currency. Firstly, let’s get started by understanding what the value of NZDCAD depicts.

Understanding NZD/CAD

Comprehending the value of a currency pair is simple. The value of NZDCAD determines the Canadian dollars that must be paid to buy one New Zealand dollar. It quoted as 1 NZD per X CAD. For example, if the current value of NZDCAD is 0.86595, then 0.86595 CAD is required to purchase one NZD.

NZD/CAD Specification

Spread

Spread is the primary way through which brokers make revenue. They have a different price for buying and selling. The difference between these prices is called the spread. It varies from broker to broker and their execution type.

ECN: 1 | STP: 1.8

Fees

For every execution, there is a fee levied by the broker. This fee is also referred to as the commission on a trade. It is nil on STP accounts. And on ECN accounts, it is usually within 6 to 10 pips.

Slippage

Slippage is the variation in the price executed by you and the price you actually received. It happens on market orders. Slippage depends on two factors:

  • The volatility of the market
  • Broker’s execution speed

Trading Range in NZD/CAD

The trading range is a tabular representation of the pip movement in a currency pair in various timeframes. These values help in assessing the risk-on trade as it determines the minimum, average, and maximum profit that can be made on a trade.

Procedure to assess Pip Ranges

  1. Add the ATR indicator to your chart
  2. Set the period to 1
  3. Add a 200-period SMA to this indicator
  4. Shrink the chart so you can assess a large time period
  5. Select your desired timeframe
  6. Measure the floor level and set this value as the min
  7. Measure the level of the 200-period SMA and set this as the average
  8. Measure the peak levels and set this as Max.

NZD/CAD Cost as a Percent of the Trading Range

Cost a percentage of the trading range is an excellent application of the above table. By manipulating the values with the total cost, the variations in costs in different at different volatilities and timeframes can be calculated. For this, the ratio between the total cost and pip movement is found out and represented in percentage.

ECN Model Account 

Spread = 1 | Slippage = 2 |Trading fee = 1

Total cost = Slippage + Spread + Trading Fee = 2 + 1 + 1 = 4

STP Model Account

Spread = 1.8 | Slippage = 2 | Trading fee = 0

Total cost = Slippage + Spread + Trading Fee = 2 + 1.8 + 0 = 3.8

Comprehending the above tables

There are two variables here, namely, timeframe and volatility. By varying these two, the variation in the total cost is examined. Note that the higher the percentage, the higher is the cost on a trade and vice versa. From this, we can make out that the prices are high when the volatility is low. And prices are low when volatility is high. Also, as the timeframe widens, the cost decreases.

The Ideal way to trade the NZD/CAD

It is not ideal to trade when the volatility is high, as it is risky. It is also not the best choice to trade when the volatility is low, as the costs are high. So, to keep a balance between both volatility and cost, it is ideal to trade when the pip movement of the pair is around the average values.

Talking about timeframes, trading the 4H or the Daily would be great, as the cost is bearable, and the trade wouldn’t take too long to perform as well.

Another simple hack to reduce cost is by trading using limit/pending orders instead of market orders. This will significantly reduce costs on a trade because the slippage on the trade becomes 0. It is observed that the cost reduces by about 50% of the original value. Below is a table representing the cost percentage when the slippage is made zero.

Categories
Forex Assets

Information About The GBP/JPY Forex Currency Pair

Introduction

The Great Britain pound versus the Japanese yen is a cross-currency pair in the forex market. It is a widely traded pair with great liquidity and volatility. In this currency pair, GBP is the base currency, and JPY is the quote currency.

Understanding GBP/JPY

The market price of GBPJPY shows the units of yens required to purchase one pound. It is quoted as 1 GBP per X JPY. For example, if the value of GBPJPY is 143.82, then 143.82 yen are to be produced by the trader to buy one pound.

GBP/JPY Specification

Spread

Spread is the difference between the bid price and the ask price set by the broker. These prices vary from broker to broker and type of account model as well. The approximate spread on ECN and SPT accounts is mentioned as follows.

ECN: 0.7 | STP: 1.6

Fees

There is a fixed round-trip fee on every trade a trader takes. On ECN accounts, the spread is around 6 to 10 pips. And on STP accounts, there is no fee as such. However, though there is no fee on STP accounts, the total fee is still compensated with the high spread on it.

Slippage

Slippage is another parameter that adds up to the total fee. It is the difference between price executed by the trader and price he actually received from the broker. This happens solely due to the change in volatility of the market and the broker’s execution speed.

Trading Range in GBP/JPY

The trading range is a pip depiction tool that determines the minimum, average, and maximum pip movement in a different timeframe. This volatility table is pretty useful in analyzing the amount of risk that is involved in a trade. For example, if the max pip movement on the 4H is 60 pips, then a trader can get an idea that he can gain/lose a max of $552.6 in a time frame of 4 hours.

Procedure to assess Pip Ranges

  1. Add the ATR indicator to your chart
  2. Set the period to 1
  3. Add a 200-period SMA to this indicator
  4. Shrink the chart so you can assess a large time period
  5. Select your desired timeframe
  6. Measure the floor level and set this value as the min
  7. Measure the level of the 200-period SMA and set this as the average
  8. Measure the peak levels and set this as Max.

GBP/JPY Cost as a Percent of the Trading Range

The cost as a percent of the trading range is again the volatility but combined with total cost on a trade. It is a tabular representation of the cost of trading in varying timeframes and volatilities. The percentages are obtained simply by finding the ratio between the total cost and volatility.

ECN Model Account

Spread = 0.7 | Slippage = 2 |Trading fee = 1

Total cost = Slippage + Spread + Trading Fee = 2 + 0.7 + 1 = 3.7

STP Model Account

Spread = 1.6 | Slippage = 2 | Trading fee = 0

Total cost = Slippage + Spread + Trading Fee = 2 + 1.6 + 0 = 3.6

The Ideal way to trade the GBP/JPY

The magnitude of the percentages basically determines how high or how low the costs are for each trade. If the percentage is high, the costs are high. If they are low, the costs are low. The very first observation that can be made is that the costs are high in the min column comparative to the average column and maximum column. Hence, the costs are high for low volatile markets, and low for high volatile markets. But, it is not ideal to trade in either of these markets. The best time to get into the pair is when the volatility is around the average values. As far as the timeframes are concerned, the cost decreases as the width of the timeframe increases.

Placing limit orders is another way to minimize your cost significantly. Because this will not take slippage into consideration for calculating the total costs. Thus, the total cost reduces greatly. An example of the same is illustrated below.

Hence, we can see that the percentages have reduced by around 50% or so.

Categories
Forex Assets

Everything You Should Know About GBP/NZD Forex Pair

Introduction

GBPNZD is the abbreviation for the Great Britain pound against the New Zealand dollar. Here, the pound is the base currency, while the New Zealand dollar is the quote currency. Though it is not a major currency, it has considerable volatility and liquidity.

Understanding GBP/NZD

The value of GBPNZD represents the value of NZD equivalent to one pound. It is quoted as 1 GBP per X NZD. For example, if the value of GBPNZD is at 1.9677, then to buy one pound, the trader has to pay 1.9677 NZ dollars for it.

GBP/NZD Specification

Spread

Spread is the medium through which brokers generate revenue. They set two different prices for buying and selling a currency pair. The difference between the prices is their profit. This difference is referred to as the spread. The prices usually vary from type of account model.

ECN: 1.2 | STP: 2.1

Fees

The fee is basically the commission on each trade a trader must pay. Typically, there is no fee on STP accounts, but a small fee on ECN accounts. The fee is usually between 6 and 10 pips.

Slippage

Slippage takes place when positions are opened/closed using market orders. The trader wishes to pay a specific price, but in reality, he receives a different price. And the difference between these two prices is called slippage.

Trading Range in GBP/NZD

The trading range is the depiction of the pip movement of a currency pair on different timeframes. With it, one can analyze how many dollars they can win/lose in a given timeframe. For example, if the average pip movement on the 1H timeframe is 30 pips, then you will either be in a profit of $198.6 or a loss of $198.6 in an hour. Knowing this, a trader can plan their lot sizes accordingly.

Procedure to assess Pip Ranges

  1. Add the ATR indicator to your chart
  2. Set the period to 1
  3. Add a 200-period SMA to this indicator
  4. Shrink the chart so you can assess a large time period
  5. Select your desired timeframe
  6. Measure the floor level and set this value as the min
  7. Measure the level of the 200-period SMA and set this as the average
  8. Measure the peak levels and set this as Max.

GBP/NZD Cost as a Percent of the Trading Range

Having knowledge of the cost of the trade is necessary. Note that the cost varies based on the volatility and the timeframe traded. So, it becomes vital to know when the right moments to enter the market are. Below are two tables illustrating the total costs as a percentage for varying timeframes and volatility.

ECN Model Account

Spread = 1.2 | Slippage = 2 |Trading fee = 1

Total cost = Slippage + Spread + Trading Fee = 2 + 1.2 + 1 = 4.2

STP Model Account

Spread = 2.1 | Slippage = 2 | Trading fee = 0

Total cost = Slippage + Spread + Trading Fee = 2 + 2.1 + 0 = 4.1

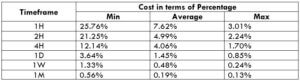
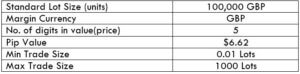
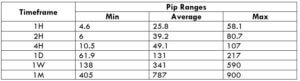
The Ideal way to trade the GBP/NZD
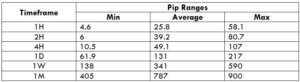
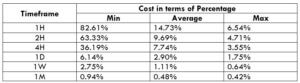
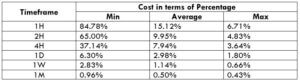
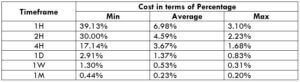
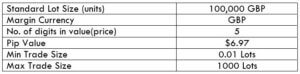
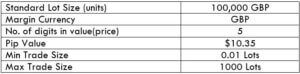
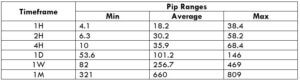
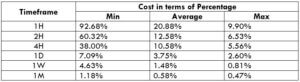
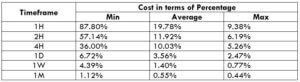
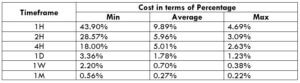
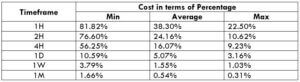
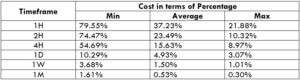
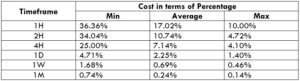
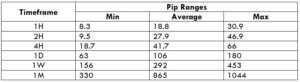
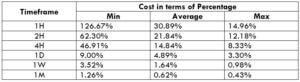
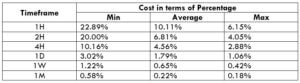
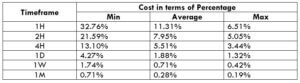
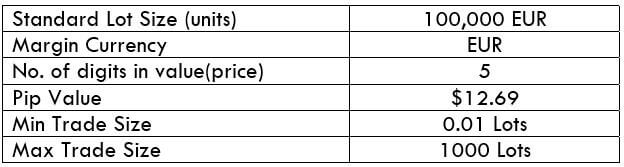
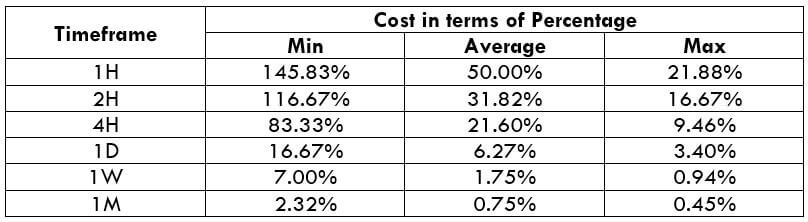
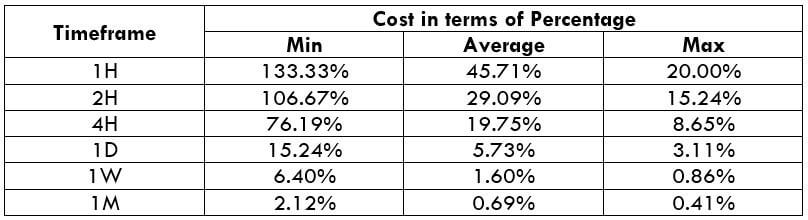
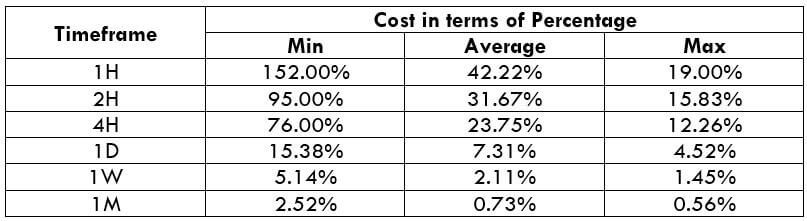
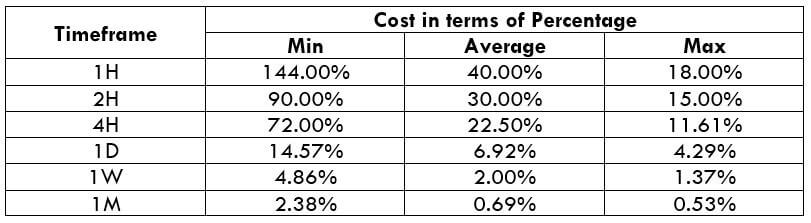
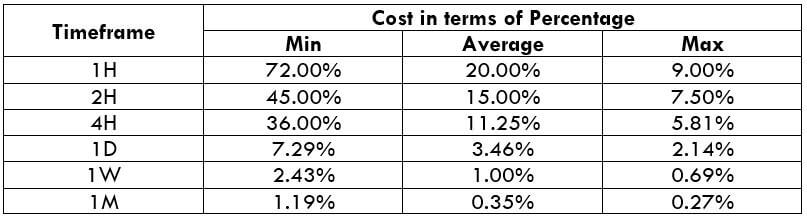
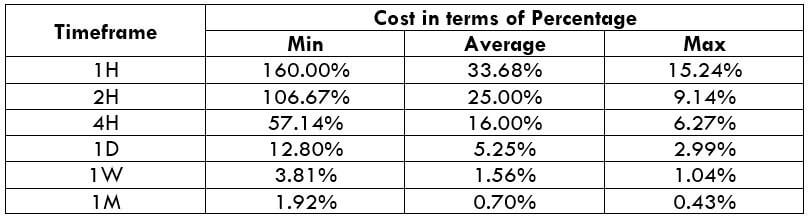
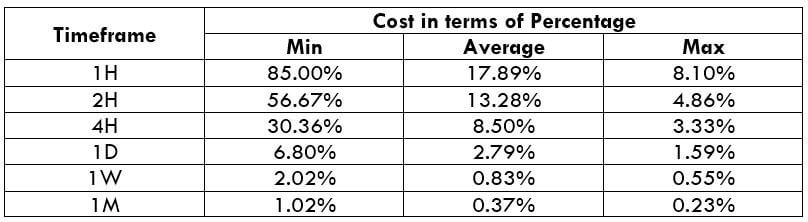
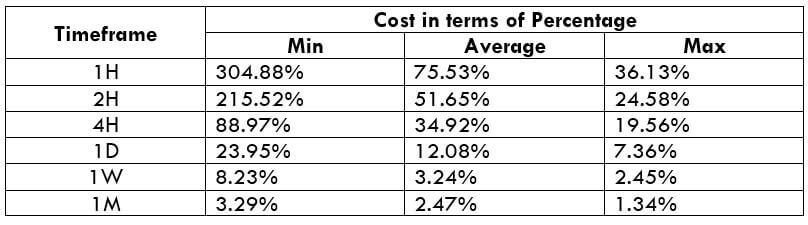
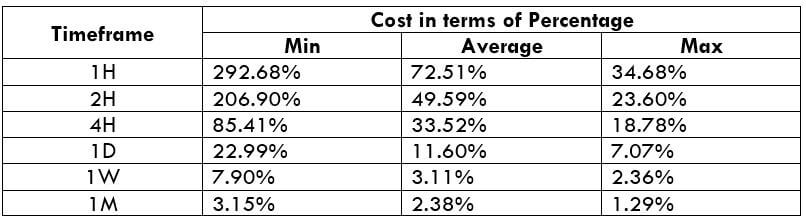
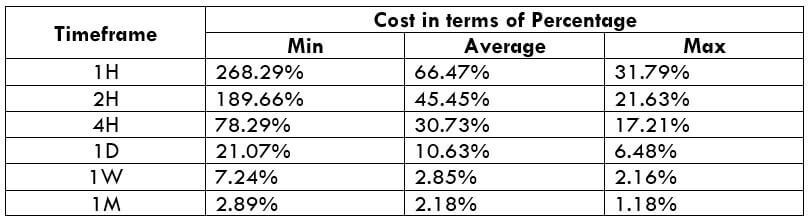
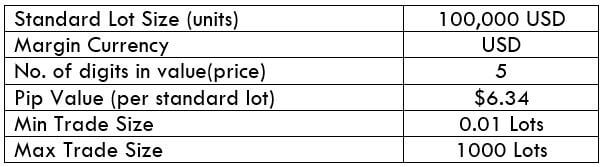
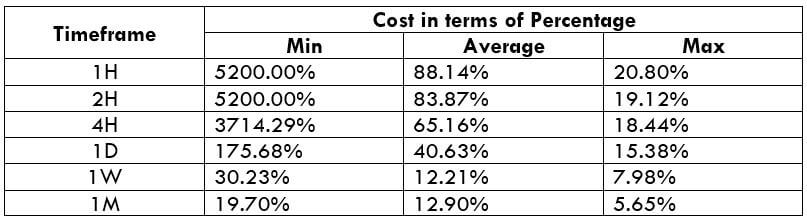
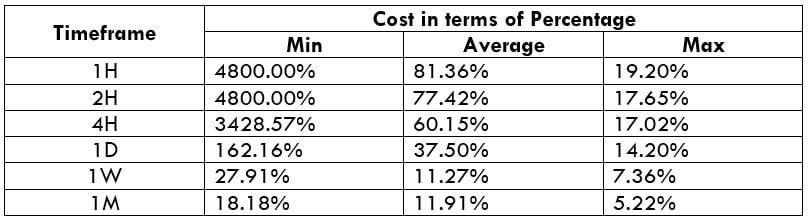
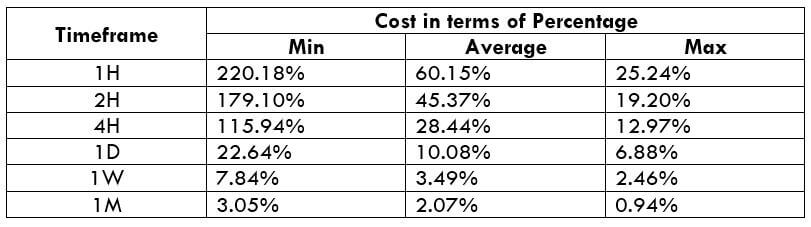
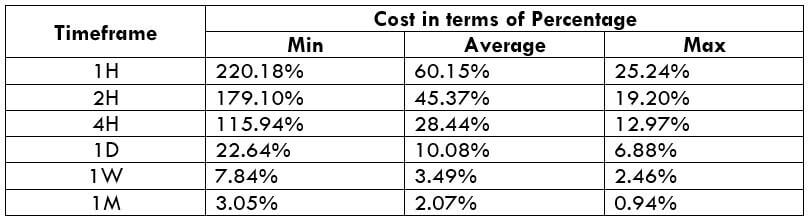
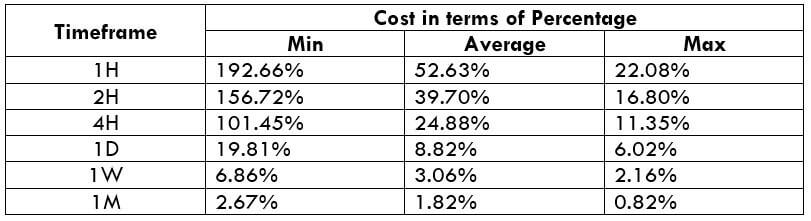
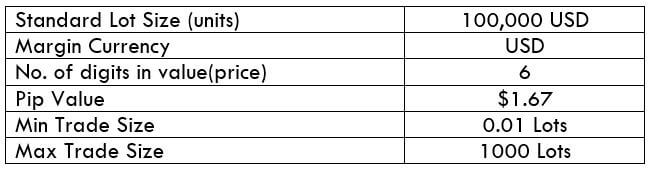
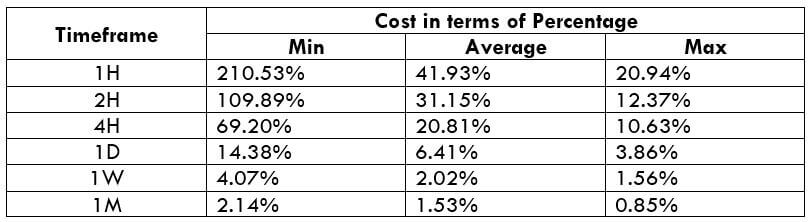
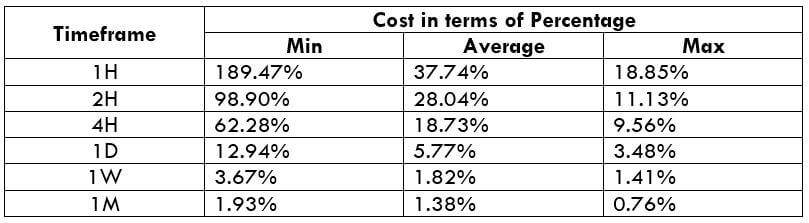
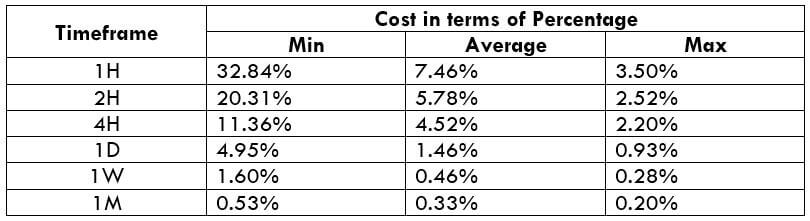
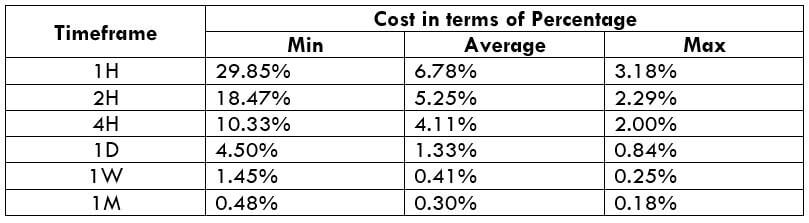
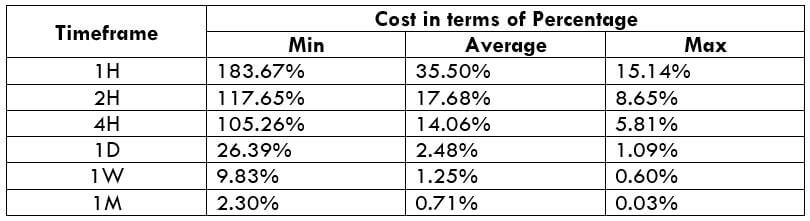
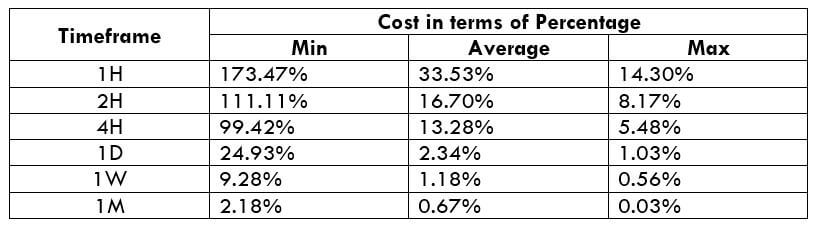
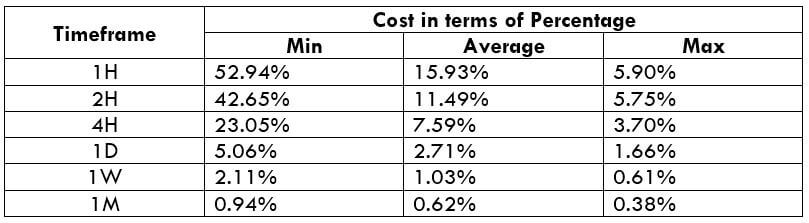
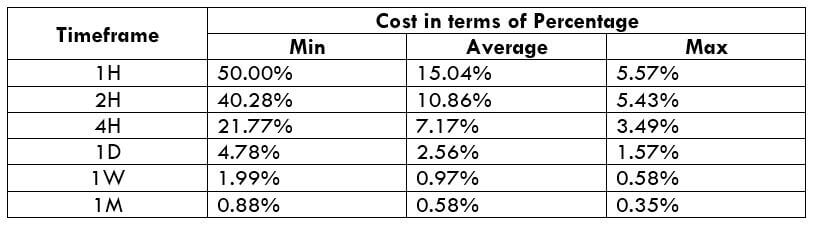
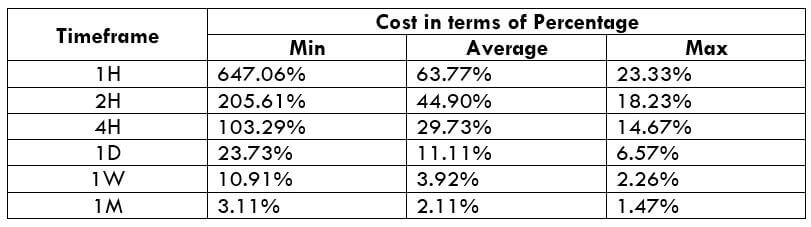
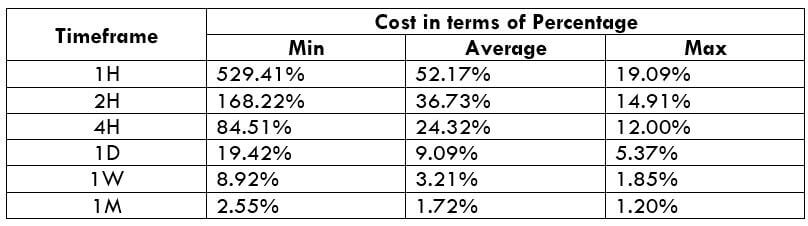
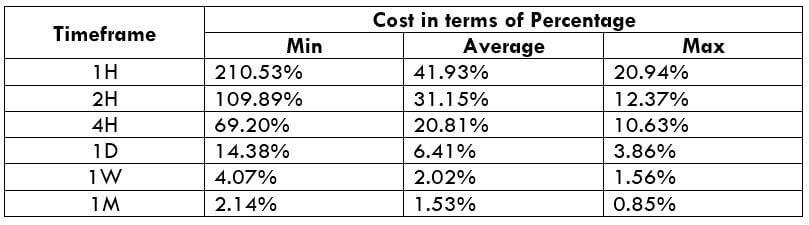
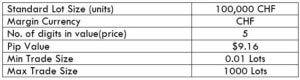
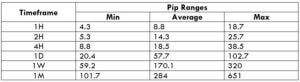
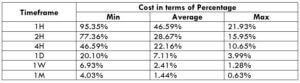
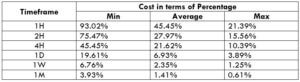
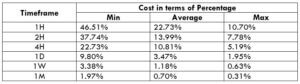
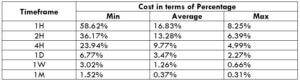
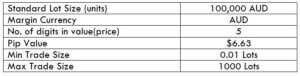
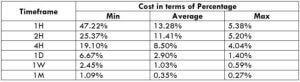
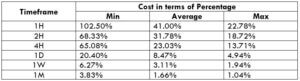
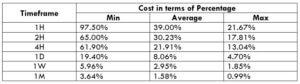
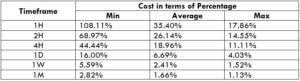
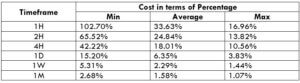
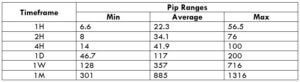
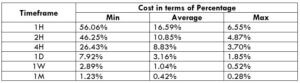
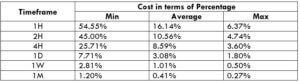
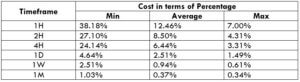
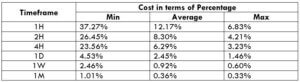
The above tables show that the costs are high in the min column and low in the max column. The higher the value of the percentage, the high is the cost. So, this means that the costs are high for low volatility markets and vice versa. It is neither ideal to trade during low volatility nor during high volatility. To have an equilibrium between the costs and the volatility, it is best to enter the market when the volatility is around the average mark.

Slippage is a parameter for calculating the total cost. It has a great weight in the total cost. However, there is a way to minimize and nullify it. This can be simply be done by trading using limit orders instead of market orders.

Categories
Forex Assets

Exploring The Basics Of GBP/CAD Forex Pair

Introduction

GBPCAD pronounced as ‘pound cad” is minor/cross currency pair in forex. GBP refers to Great Britain Pound, and CAD refers to the Canadian Dollar. Since GBP is on the left, it becomes base currency, and CAD on the right becomes the quote currency.

Understanding GBP/CAD

The current market price has of GBPCAD is not similar to the prices in the stock market. The value of GBPCAD represents the value of CAD equivalent to one GBP. It is simply quoted as 1 GBP per X CAD. For example, if the value of GBPCAD is 1.7192, then 1.7192 Canadian dollars are required to purchase one pound.

GBP/CAD Specification

Spread

Spread is the difference between the bid price and the ask price in the market. These values are controlled by the brokers. So, it differs from broker to broker as well as the type of account.

ECN: 0.8 | STP: 1.9

Fees

There is a small levied by the broker on every trade a trader takes. There are a few pips of fee on ECN accounts, while the fee is nil on STP accounts. The fee is usually between 6 to 10 pips.

Slippage

Slippage is the difference between the trader’s demanded price and the real executed price. Slippage happens when orders are executed by the market price. It happens solely due to the volatility of the market and the broker’s execution speed.

Trading Range in GBP/CAD

A trading range is the representation of the pip movement of GBPCAD in different timeframes. These values are helpful in getting a rough idea of the profit/loss that can be made from the trade in a given timeframe. For example, if the min pip movement on the 1H timeframe is 3 pips, then a trader can expect to gain/lose at least $22.38 when one standard lot is traded.

Procedure to assess Pip Ranges

  1. Add the ATR indicator to your chart
  2. Set the period to 1
  3. Add a 200-period SMA to this indicator
  4. Shrink the chart so you can assess a large time period
  5. Select your desired timeframe
  6. Measure the floor level and set this value as the min
  7. Measure the level of the 200-period SMA and set this as the average
  8. Measure the peak levels and set this as Max.

GBP/CAD Cost as a Percent of the Trading Range

Now that we know how much profit/loss can be made within a given time frame let us also calculate the cost on each trade by considering the volatility and timeframe. For this, the ratio between the total cost and volatility calculated and expressed in percentages. The magnitude of these percentages will then be used to determine the timeframe with marginal costs.

ECN Model Account 

Spread = 0.8 | Slippage = 2 |Trading fee = 1

Total cost = Slippage + Spread + Trading Fee = 2 + 0.8 + 1 = 3.8

STP Model Account

Spread = 1.9 | Slippage = 2 | Trading fee = 0

Total cost = Slippage + Spread + Trading Fee = 2 + 1.9 + 0 = 3.9

The Ideal way to trade the GBP/CAD

From the above two tables, it can be ascertained that the percentages largest on the min column, moderate on the average column, and least on the max column. The higher the value of percentages, the higher is the cost of the trade. So with this, we can conclude that the costs are high during low volatility, and low during high volatility. Similarly, the costs are high on lower timeframes and considerably low on higher timeframes. Hence, to keep volatility and cost at a balance, it ideal to trade when the pip movement in the market is around the average values.

Market orders bring in an additional cost in the trade. To eliminate this, one can trade using limit orders. This will set the slippage value to 0, and eventually, reduce the total cost on the trade by a significant amount. An example supporting the statement is illustrated below.

Total cost = Spread + trading fee + slippage = 0.8 +1 + 0 = 1.8

Categories
Forex Assets

Fundamentals Of Trading The GBP/AUD Currency Pair

Introduction

GBPAUD is an abbreviation for the Great Britain pound and the Australian dollar. This cross currency pair is widely traded with high volume in the forex market. In this pair, GBP is the base currency, and AUD is the quote currency.

Understanding GBP/AUD

The value of GBPAUD in the market is the value of AUD equivalent to one pound.GBPAUD is quoted as 1 GBP per X AUD. For example, if the value of GBPAUD is 1.8505, then these many Australian dollars are to be given to receive one pound.

GBP/AUD Specification

Spread

The prices for buying and selling a currency pair are different. To buy, one must refer to the ask price; and to sell, one must refer to the bid price. The difference between the bid price and the ask price is called the spread. The spread varies from the type of account model.

ECN: 0.7 | STP: 1.7

Fees

Apart from the spread, brokers levy fee on every round-trip trade. This fee is fixed in for every trade. However, it varies from broker to broker. Usually, there is no fee on STP accounts. On ECN accounts, there is a fee of a few pips.

Slippage

Slippage is the difference between the price when the trader entered the market order and the price he was actually given. Most of the time, there is a variation in the prices. This difference could be in favor of or against the trader. There are two factors responsible for it. One, the volatility of the market, and two, broker’s execution speed.

Trading Range in GBP/AUD

The trading range of currency pairs simply depicts the volatility of the pair in a different timeframe. In other terms, the trading range represents the minimum, average, and maximum pip movement in different timeframes. These values are helpful in assessing one’s risk, as well as making trades much cost-effective.

Procedure to assess Pip Ranges

  1. Add the ATR indicator to your chart
  2. Set the period to 1
  3. Add a 200-period SMA to this indicator
  4. Shrink the chart so you can determine a large time period
  5. Select your desired timeframe
  6. Measure the floor level and set this value as the min
  7. Measure the level of the 200-period SMA and set this as the average
  8. Measure the peak levels and set this as Max.

GBP/AUD Cost as a Percent of the Trading Range

Cost as a percent of the trading range is a very supportive tool in analyzing the cost of a trade, in different timeframes, and at different volatilities. This is done by finding the ratio of the total cost and volatility values and then expressing it as a percentage. The comprehension of the below tables shall be discussed in the subsequent topic.

ECN Model Account 

Spread = 0.7 | Slippage = 2 |Trading fee = 1

Total cost = Slippage + Spread + Trading Fee = 2 + 0.7 + 1 = 3.7

STP Model Account

Spread = 1.7 | Slippage = 2 | Trading fee = 0

Total cost = Slippage + Spread + Trading Fee = 2 + 1.6 + 0 = 3.7

The Ideal way to trade the GBP/AUD

Note that the higher the magnitude of the percentage, the higher is the cost of the trade. From the table shown above, we can observe that the values are highest on the min column and lowest on the max column. This means that the costs are higher when the volatility of the market is low and vice versa. Reading it horizontally, the cost gets lower as the timeframe widens. Hence, the ideal to trade when the pip movement of the currency pair is near the average values. This will ensure decent volatility by keeping the costs minimal.

Another effective way to reduce the total cost is by trading using limit orders, not market orders. Doing so, the slippage on the trade will shrink to zero. The following table shows the costs of the GBP/USD with no sleppage, for the same market conditions as on the preceding tables.

Total cost = Spread + trading fee + slippage = 0.7 +1 + 0 = 1.7

Hence, from the above table, it can be inferred that the cost percentages have a significant value.

Categories
Forex Assets

What Should You Know Before Trading The GBP/CHF Currency Pair?

Introduction

GBPCHF is the abbreviation for the Great Britain pound and the Swiss franc. Since USD is not involved in this pair, it is called a minor currency pair. However, there is an excellent liquidity and volatility in this pair. In this pair, GBP is the base currency, and CHF is the quote currency. GBPCHF is often referred to as “pound Swiss franc.”

Understanding GBP/CHF

The value of GBPCHF determines the Swiss francs required to purchase one pound. It is quoted as 1 GBP per X CHF. For example, if the value of GBPCHF is 1.2740, then one needs to pay 1.2740 Swiss francs to buy a pound.

GBP/CHF Specification

Spread

Spread is the difference between the bid price and the ask price in the market. The bid price is the price used for shorting, and the bid price is the price used for buying a currency pair. These prices differ from broker to broker as well as the account type.

ECN: 0.8 | STP: 1.6

Fees

For every trade a trader takes, there is a fee associated with it. This fee is basically the commission charged by the broker. This fee varies from broker to broker. Note that there is no fee on STP accounts, and on ECN accounts, the fee is around 6 to10 pips.

Slippage

Slippage in trading is the difference between the price requested by the trader and the price given by the broker. Due to variation in volatility and the broker’s execution speed, it is not quite possible to get the exact intended price. Slippage happens only on market orders.

Trading Range in GBP/CHF

Knowing the number of pips the currency pair moved in a given timeframe is a good add-on to a trader’s analysis. This will help them get an idea of the profit/loss that can be made in a specified amount of time. For example, if the average pip movement on the 1D timeframe is 50 pips, then a trader can expect to gain or lose $517.5 (50 pips x 10.35 value per pip).

Procedure to assess Pip Ranges

  1. Add the ATR indicator to your chart
  2. Set the period to 1
  3. Add a 200-period SMA to this indicator
  4. Shrink the chart so you can determine an extensive period
  5. Select your desired timeframe
  6. Measure the floor level and set this value as the min
  7. Measure the level of the 200-period SMA and set this as the average
  8. Measure the peak levels and set this as Max.

GBP/CHF Cost as a Percent of the Trading Range

The cost as a percent of the trading range depicts the magnitude of the variation in the cost in different timeframes for different variable volatility. The percentages are useful in determining the ideal time to enter into this currency pair with marginal costs. Below are the tables representing the cost percentages for minimum, average, and maximum volatility.

ECN Model Account 

Spread = 0.8 | Slippage = 2 |Trading fee = 1

Total cost = Slippage + Spread + Trading Fee = 2 + 0.8 + 1 = 3.8

STP Model Account

Spread = 1.6 | Slippage = 2 | Trading fee = 0

Total cost = Slippage + Spread + Trading Fee = 2 + 1.6 + 0 = 3.6

The Ideal way to trade the GBP/CHF

The lower the percentage, the lower are cost on the trade. In the table, we can infer that the costs are on the lower side in the max column. This implies that the cost of the trade is less when the volatility of the market is low and vice versa. Now, when it comes to the best time to trade this pair, it is ideal to pick at times when the volatility is decent, and the costs are affordable. For example, a 1D trader may trade during those times when the volatility is around 100 pips.

Moreover, the total cost of the trade can be reduced by entering and exiting trades using limit/pending orders. This way, the slippage on the trade will be fully cut off. The impact on the cost percentage when slippage is made 0 is shown below.

Total cost = Spread + trading fee + slippage = 0.8 +1 + 0 = 1.8

From the above table, it is evident that the costs have reduced by over 50% or so. Hence, it is preferable to trade using limit orders rather than market orders.

Categories
Forex Assets

Understanding The EUR/JPY Asset Class

Introduction

The Euro area’s euro against the Japanese yen, in short, is termed as EURJPY. This pair, too, like the EURCHF, EURNZD, EURCAD, EURGBP, etc. is a minor or cross currency pair. It is one of the most traded currency pairs in the forex market. Here, the EUR is the base currency, and JPY is the quote currency. The value of this pair is quoted in terms of the quote currency.

Understanding EUR/JPY

This currency pair is precisely quoted as 1 EUR per X JPY. In simple terms, the value determines the units of the quote currency (JPY) required to buy one unit of the base currency (EUR). For example, if the market value of EURJPY is 121.00, it basically means that these many yen are required to purchase one euro.

EUR/JPY Specification

Spread

Spread is the difference between the bid price and the ask price set by the broker. This value is not constant and varies from broker to broker. It also varies on the type of account model.

Spread on ECN model: 0.6

Spread on STP model: 1.5

Fees

Spread is not the only way through which brokers generate their revenue. They charge some fee (commission) on each trade as well. Fees again vary from broker to broker and account model. Typically, there is no fee on an STP account. However, there are a few pips or fees on an ECN account as their spread is lesser than an STP account.

Slippage

Slippage is the difference between the trader’s asked price and the actual price given to him. Two factors majorly affect slippage on a trade; one, the volatility of the market, and two, broker’s execution speed. The slippage is usually within 0.5 to 5 pips. For major currencies, the slippage is much lower.

Trading Range in EUR/JPY

The trading range is the illustration of the minimum, average, and the maximum number of the pips the currency pair has moved in a given time frame. These values help assess the profit/loss potential of a trade. For instance, if the max volatility on the 1H is 10 pips, then one can expect to win or lose a maximum of $92 (10 pip x 9.20 value per pip) in an hour or two.

Procedure to assess Pip Ranges

  1. Add the ATR indicator to your chart
  2. Set the period to 1
  3. Add a 200-period SMA to this indicator
  4. Shrink the chart so you can determine an extensive period
  5. Select your desired timeframe
  6. Measure the floor level and set this value as the min
  7. Measure the level of the 200-period SMA and set this as the average
  8. Measure the peak levels and set this as Max.

EUR/JPY Cost as a Percent of the Trading Range

In addition to assessing the profit/loss in a timeframe ahead of time, we can use these values in determining the cost variation in different timeframes and volatility as well. The cost as a percent of the trading range tells the min, average, max costs by considering the timeframes and volatility as its variables.

ECN Model Account 

Spread = 0.6 | Slippage = 2 | Trading fee = 1

Total cost = Slippage + Spread + Trading Fee = 2 + 0.6 + 1 = 3.6

STP Model Account

Spread = 1.5 | Slippage = 2 | Trading fee = 0

Total cost = Slippage + Spread + Trading Fee = 2 + 1.5 + 0 = 3.5

The Ideal way to trade the EUR/JPY

Above are the costs of each trade in terms of percentages. Note that they do not represent the actual cost on trade in terms of dollars, but are magnitude values which can be used for comparing with other values. The higher the magnitude of the percentage, the higher is the cost on the trade for that particular timeframe and volatility. From the tables, it can be ascertained that the values are highest on the min column and lowest on the max column. This, in turn, implies that the costs are higher when the volatility is low and vice versa. Talking about the timeframe, the costs are high on the lower timeframes and low on the higher timeframes. So, a day trader may preferably trade on the 2H/4H when the volatility is around the average values. And long-term traders may trade the 1W/1M whatsoever be the volatility of the market.

Furthermore, a trader may reduce their costs by entering and exiting trades using limit order instead of market orders. This will completely erase the slippage on the trade. An example of the same is given below.

Total cost = Spread + trading fee = 0.6 +1 = 1.6

Categories
Forex Assets

Everything About EUR/CAD Currency Pair

Introduction

EURCAD is the abbreviation for the currency pair Euro area’s euro and the Canadian dollar. This is a cross-currency pair, as it does not involve the US dollar. In EURCAD, EUR is the base currency, and CAD is the quote currency. The price of this pair basically tells the value of CAD w.r.t EUR.

Understanding EUR/CAD

The current market price of EURCAD determines the required Canadian dollars to purchase one euro. It is quoted as 1 EUR per X CAD. For example, if the CMP of EURCAD is 1.4700, it is as good as saying that 1.4700 CAD is needed to buy one EUR.

EUR/CAD Specification

Spread

The algebraic difference between the bid price and the ask price set by the broker is known as the spread. Spread varies from time to time and broker to broker. The approximate spread value on an ECN account is 0.8, and on an STP account is 1.8.

Fees

For every position that a trader opens, there is some fee associated with it. And it depends on the type of account model. It is seen that there is no fee on STP accounts and a few pips on ECN accounts.

Slippage

Slippage is terminology in trading, which, by definition, is the difference between the trader’s wished price and the real executed price. That is, the trader does not get the exact price he had intended for. There is some variation due to the volatility of the market and the broker’s execution speed. It usually varies from 0.5 to 5 pips on these minor currency pairs. The slippage is typically lesser on major currency pairs.

Trading Range in EUR/CAD

The trading range is an illustration of the minimum, average, and maximum pip movement in EURCAD. It determines the volatility of the market. The volatility of the market is a vital piece of information in trading, as one can assess the time that can be taken on each trade. And by applying more variables to it, one can determine the cost varies on the trade as well.

Procedure to assess Pip Ranges

  1. Add the ATR indicator to your chart
  2. Set the period to 1
  3. Add a 200-period SMA to this indicator
  4. Shrink the chart so you can assess a large time period
  5. Select your desired timeframe
  6. Measure the floor level and set this value as the min
  7. Measure the level of the 200-period SMA and set this as the average
  8. Measure the peak levels and set this as Max.

EUR/CAD Cost as a Percent of the Trading Range

Cost as a percent of the trading range is a simple yet very effective application of the above volatility table. There is a cost on every trade you take. The total cost of a trade is the sum of slippage, spread, and trading fee. This total cost is divided by the volatility values and is expressed in terms of a percentage. And the percentage values are used to figure out the best times of the day to enter and exit a trade with marginal cost.

ECN Model Account 

Spread = 0.8 | Slippage = 2 | Trading fee = 1

Total cost = Slippage + Spread + Trading Fee = 2 + 0.8 + 1 = 3.8

STP Model Account

Spread = 1.8 | Slippage = 2 | Trading fee = 0

Total cost = Slippage + Spread + Trading Fee = 2 + 1.8 + 0 = 3.8

The Ideal way to trade the EUR/GBP

To determine the ideal way of trading the EURCAD, let us first comprehend what the percentage means.

High percentage => High cost

Low percentage => Low cost

Min column => Low volatility

Max column => High volatility

From the table, we can infer that the percentages are high in the min column and low for the max column. So,

Min column => High percentage

Thus, Low volatility => High cost

Max column => Low percentage

Thus, High volatility => Low cost

It is not ideal during low volatility as costs are high. Also, trading during high volatility is not a good idea as it is quite risky. Hence, to have a balance between both volatility and cost, it is ideal to trade when the pip movement on the currency pair is at the average values.

Another simple hack to reduce the costs is to trade using limit orders instead of market orders. Doing so, the slippage will be automatically cut off from the trade, and the total cost will significantly reduce.

Categories
Forex Economic Indicators

Let’s Understand The ‘Current Account’ Economic Indicator

Current Account vs. Capital Account

The Current Account and Capital Account make up the two components of the Balance of Payments in international trade. The Capital Account represents the changes in asset value through investments, loans, banking balances, and real property value and is less immediate and more invisible than the current account.

The Current Account

The Current Account is a record of a country’s transactions with the rest of the world. It records the net trade in goods and services, the net earnings on cross-border investments, and the net transfer of payments over a defined period of time. The ratio of the current account balance to the Gross Domestic Product provides the trader with an indication of the country’s level of international competitiveness in world markets.

What makes up the Current Account?

Trade balance: which is the difference between the total value of exports of goods and services and the total value of imports of goods and services.

The net factor income: being the difference between the return on investment generated by citizens abroad and payments made to foreign investors domestically and,

Net cash transfers: where all these elements are measured in the local currency.

What affects the current account balance

The current account of a nation is influenced by numerous factors from its trade policies, exchange rates, international competitiveness, foreign exchange reserves, inflation rate, and other factors. The trade balance, which is the result of exports minus imports, is generally the most significant determining factor of the current account surplus or deficit.

When a country’s current account balance is positive, the country is considered a net lender to the rest of the world, and this is also known as incurring a surplus. When a country’s current account balance is in the negative, known as running a deficit, the country is a net borrower from the rest of the world.

A Current Account Deficit

A Current Account Deficit occurs when a country spends more on what it imports than what it receives on goods and services it exports. This term should not be confused with a trade deficit, which happens when a country’s imports exceed its exports.

When a country is experiencing a strong economic expansion, import volumes may surge as a result. However, if a country’s exports are unable to grow at the same rate, the current account deficit will widen. During a recession, the current account deficit will shrink if the imports decline and exports increase to countries with stronger economies.

Influence on the currency

The currency exchange rate has a huge impact on the trade balance, and as a result, on the current account. A currency that is overvalued leads to imports being cheaper and thus making exports less competitive and widening the current account deficit.  An undervalued currency can boost exports and make imports more expensive, thus increasing the current account surplus.  Countries with a chronic current account deficit will be subjected to investor scrutiny during these periods of heightened uncertainty.  This situation creates volatility in the markets as precious foreign exchange reserves are depleted to support the domestic currency. The forex reserve depletion, in combination with a deteriorating trade balance, puts further pressure on the currency in question. This leads countries to take stringent measures to support the currency, such as raising interest rates and curbing currency outflows.


The Data

The Organisation for Economic Co-operation and Development (OECD) was founded in 1961 “[…] to promote policies that will improve the economic and social well-being of people around the world” (Source: OECD) and is comprised of 34 countries. The OECD publishes quarterly reports comparing figures on the balance of payments and international trade of its 34 members.

Here you can get detailed information on the 34 listed countries Current Account Balance https://data.oecd.org/chart/5NMc


Categories
Forex Assets

Asset Analysis – EUR/NZD Forex Currency Pair

Introduction

EURNZD is the abbreviation for the Euro area’s euro and the New Zealand dollar. It is classified under the minor/cross currency pairs. In EURNZD, EUR is the base currency pair, and NZD is the quote currency. As a matter of fact, in all currency pairs with euro in it, EUR is the base currency.

Understanding EUR/NZD

The value of this pair defines the New Zealand dollars required to purchase one euro. It is quoted as 1 EUR per X NZD. For example, if the value of value in the market is 1.6650, it implies that to buy one euro, the trader has to pay 1.6650 New Zealand dollars for it.

EUR/NZD Specification

Spread

Spread is a very popular term in the forex industry. This is the way through which the broker makes revenue. Spread is simply the difference between the bid price and the ask price. It differs from the type of account model. The spread on ECN and STP is given below.

ECN: 0.9 | STP: 1.7

Fees

For every position that a trader opens, there is some fee associated with it. And it depends on the type of account model. It is seen that there is no fee on STP accounts and a few pips on ECN accounts.

Slippage

Slippage is the difference between the price the trader had demanded and the actual price the trade was executed. Slippage happens when trades are taken using market orders. Slippage has a significant load on the total cost of the trade. More on this shall be discussed towards the end of this article.

Trading Range in EUR/NZD

A part of the analysis in trading is knowing the volatility of the market. Volatiltiy will give an close idea on the number of pips the currency pair will move in a given timeframe. The trading range depicts the minimum, average, and maximum pip movement in a specified time frame. Below are the values for EUNZD.

Procedure to assess Pip Ranges

  1. Add the ATR indicator to your chart
  2. Set the period to 1
  3. Add a 200-period SMA to this indicator
  4. Shrink the chart so you can assess a large time period
  5. Select your desired timeframe
  6. Measure the floor level and set this value as the min
  7. Measure the level of the 200-period SMA and set this as the average
  8. Measure the peak levels and set this as Max.

EUR/NZD Cost as a Percent of the Trading Range

Cost as a percent of the trading range represents the cost percentage that a trader is bearable for each trade they take. The percentage is obtained by finding the ratio between the total cost and volatility. With these percentage values, we come into the conclusion of the best time to enter and exit the market with minimal costs.

ECN Model Account 

Spread = 0.9 | Slippage = 2 | Trading fee = 1

Total cost = Slippage + Spread + Trading Fee = 2 + 0.9 + 1 = 3.9

STP Model Account

Spread = 1.7 | Slippage = 2 | Trading fee = 0

Total cost = Slippage + Spread + Trading Fee = 2 + 1.7 + 0 = 3.7

The Ideal way to trade the EUR/NZD

By analyzing the percentages obtained above, we can find ways to reduce risk and cost on every trade of EURNZD. Firstly, the percentage tells the cost variation for different volatilities in different timeframes. The values are large in the first (Min) column. Meaning, the costs are high in the min column. Also, since this column represents low volatility, it implies that costs are high when the volatility is low and vice versa. In the average column, the costs are neither too high nor too low. And the volatility is under balance as well. Hence, this turns out to be the ideal time to trade in the market.

Moreover, another feasible technique to reduce cost is by placing limit orders. By the use of limit orders, a trader will eradicate the existence of slippage on the trade, and, in turn, reduce the total cost on the trade considerably. An example of the same is given below.

Comparing this table with the previous table, it is evident that the percentages have almost halved. Hence, entering and exiting trades using limit orders can prove to be very advantageous to reduce costs on trade.

Categories
Forex Assets

Understanding The EUR/AUD Forex Currency Pair

Introduction

EURAUD is a minor/cross currency pair traded in the forex market. EURAUD is the abbreviation for the euro area’s euro and the Australian dollar. The left currency, EUR is the base currency and the one on the right, AUD is the quote currency. The price of EURAUD basically tells the value of the Australian dollar.

Understanding EUR/AUD

The exchange rate of EURAUD shows the Australian dollars required to purchase one euro. It is quoted as 1EUR per X AUD. For example, if the value of EURAUD is 1.5995, it means that these many units of AUD are to be possessed by the trader to buy one unit of EUR.

EUR/AUD Specification

Spread

Spread is the way through which brokers make money. It is merely the difference between the bid price and the ask price set by the broker. These prices are often different from broker to broker. The spread differs based on the volatility of the market as well. The approximate spread on an ECN account and an STP account is given below.

ECN: 0.9 | STP: 1.7

Fees

For every trade a trader takes, there is some fee associated with it. And this fee is charged only by ECN type brokers. Typically, there is no fee on STP type brokers. The fee range is usually between 6 pips and 10 pips.

Slippage

A trader can place trades using either market order or using a limit order. In the case of market orders, the trader doesn’t get the exact price at which he executed the trade. The real price he received is different. This difference in the price is referred to as slippage.

Trading Range in EUR/AUD

As a professional trader, it is vital to know how many pips the currency pair moves in each timeframe. It gives the trader an idea of how long he must wait for his trade to perform. Traders can also assess their profit/loss in a given time frame. For example, if a trader takes a trade by analyzing the 1H timeframe, and the min market volatility is three pips, then he can expect to win or lose at least $20.91 (3 pips x $6.97 value per pip).

Procedure to assess Pip Ranges

  1. Add the ATR indicator to your chart
  2. Set the period to 1
  3. Add a 200-period SMA to this indicator
  4. Shrink the chart so you can assess a large time period
  5. Select your desired timeframe
  6. Measure the floor level and set this value as the min
  7. Measure the level of the 200-period SMA and set this as the average
  8. Measure the peak levels and set this as Max.

EUR/AUD Cost as a Percent of the Trading Range

Apart from knowing the potential profit/loss from the volatility of the market in different timeframes, one can also determine the cost variation by considering the volatility and the timeframe. For this, the ratio between total cost and volatility is taken into account. It is then expressed in terms of percentage. The magnitude of the percentage determines the cost of each trade.

ECN Model Account

Spread = 0.9 | Slippage = 2 | Trading fee = 1

Total cost = Slippage + Spread + Trading Fee = 2 + 0.9 + 1 = 3.9

STP Model Account

Spread = 1.6 | Slippage = 2 | Trading fee = 0

Total cost = Slippage + Spread + Trading Fee = 2 + 1.7 + 0 = 3.7

The Ideal way to trade the EUR/AUD

Now that we’ve got the values from the above table, here is our ideal way to trade the EUR/AUD.

The higher the magnitude of the percentages, the higher is the cost of the trade on that particular timeframe. Comprehending this to the above table, it is seen that the percentages are highest and lowest on the min and max columns, respectively. This, in turn, implies that the costs are high when the volatility of the market is feeble. And the costs are low when the volatility is high. So, it is ideal to trade on any timeframe, given the volatility of the market is above average volatility. This will ensure the fairly high volatility with affordable costs.

Furthermore, the costs can be made much lower by placing limit orders instead of market orders because this will reduce the slippage on the trade to zero. As an example, the cost percentage table is given by ignoring the slippage value.

Thus, comparing the two tables, it is evident that the costs have reduced by 50%.

Categories
Forex Assets

What Should You Know About The EUR/CHF Forex Pair?

Introduction

EURCHF is the abbreviation for the Euro area’s euro and the Swiss franc. This currency pair is a minor/cross currency pair. Here, EUR is the base currency, and CHF is the quote currency. Trading the EURCHF is commonly called trading the ‘swissie.’

Understanding EUR/CHF

The value of EURCHF determines the number of units of Swiss francs required to purchase one euro. It is quoted as 1 euro per X francs. For example, if the value of 1.3000, it means that one must pay 1.3000 francs to buy one euro.

EUR/CHF Specification

Spread

Spreads are the way by which brokers make their money. There is a separate price to buy a currency pair and a separate price to sell it. To buy, one must refer to the ask price, and to sell, one must refer to the bid price of the currency pair. The difference between these two prices is known as the spread. This spread usually differs from account type. The average spread on ECN and STP model account are as follows:

ECN: 0.9 | STP: 1.6

Fees

The fee is nothing but the commission charged by the broker on a single trade. The fee also varies base on account type.

Fee on STP account: NIL

Fee on ECN account: 1 pip

Note: The fee depends from broker to broker. Here, we have taken the average value by referring to some brokers.

Slippage

Slippage in trading is the difference between the trader’s desired price and the real executed price by the broker. The slippage value depends on two factors:

  • Broker’s execution speed
  • Currency pair’s volatility

Trading Range in EUR/CHF

The trading range in EURCHF is the representation of the minimum, average, and maximum pip movement in different timeframes. These values can be used to assess one’s approximate profit or loss in a given time frame. For example, if the volatility on the 1H timeframe is five pips, then one can expect to be in a profit or loss of $50.25 (5 pips x $10.05 value per pip) in an hour or two.

Procedure to assess Pip Ranges

  1. Add the ATR indicator to your chart
  2. Set the period to 1
  3. Add a 200-period SMA to this indicator
  4. Shrink the chart so you can assess a large time period
  5. Select your desired timeframe
  6. Measure the floor level and set this value as the min
  7. Measure the level of the 200-period SMA and set this as the average
  8. Measure the peak levels and set this as Max.

EUR/CHF Cost as a Percent of the Trading Range

Apart from assessing your profit and loss, one can find the best time of the day to enter and exit a trade. For this, another table is inserted that represents costs in terms of percentage. And the magnitude of these percentages determines the range of costs on each trade.

ECN Model Account

Spread = 0.9 | Slippage = 2 | Trading fee = 1

Total cost = Slippage + Spread + Trading Fee = 2 + 0.9 + 1 = 3.9

STP Model Account

Spread = 1.6 | Slippage = 2 | Trading fee = 0

Total cost = Slippage + Spread + Trading Fee = 2 + 1.6 + 0 = 3.6

Comprehending ‘Cost as a percentage of trading range’

Note that the mentioned percentages are a unitless quantity, and we consider only the magnitude of it. If the percentage value is high, then the costs are high. If they’re low, the costs are low too. Relating it to volatility, if the volatility is high, the costs are low and vice versa.

The Ideal way to trade the EUR/CHF

Now that we’ve comprehended what the cost percentages mean, let us determine the best times to trade the EURCHF currency pair. The minimum column of the table has the highest percentages, while the max column has the lowest percentages for each timeframe. It is neither ideal to trade when the volatility is high & costs are low nor when the volatility is low, and the costs are high. The only option left is the average column. The average column consists of the median values for both volatility and costs. Hence, this becomes the most suitable time to enter into this currency pair for trading.

Limit orders and their benefits

Traders usually enter and exit trades using market orders. This is the sole reason for slippage to take place. This has a significant weight on the cost of the trade. However, placing a limit order instead will nullify the slippage on the trade.

The difference in the ‘costs as a percentage of trading range’ when the slippage is made nil is illustrated below.

Categories
Forex Assets

What Should You Know About EUR/GBP Forex Pair Before Trading

Introduction

EURGBP is the abbreviation for the currency pair Euro area’s euro against the Great Britain pound. This pair, unlike the EURUSD, USDCAD, GBPUSD, USDCHF, etc. is not a major currency pair. This pair is classified under the minor currency pairs and the cross-currency pairs. In EURGBP, EUR is the base currency, and GBP is the quote currency.

Understanding EUR/GBP

The current market price of EURGBP depicts the required number of pounds to purchase one euro. For example, if the value of EURGBP is 0.8527, then one needs to pay 0.8527 pounds to buy one euro.

EUR/GBP Specification

Spread

Spread in trading is the difference between the bid price and the ask price. The spread is not the same on all brokers but depends on the type of account. It also varies depending on the volatility of the market. An average spread on an ECN account and an STP account is shown below.

Spread on ECN: 0.8 | Spread on STP: 1.5

Fees

On trade a trader takes, there is some fee associated with it. Fees, again, depends on the type of account. There is no fee on STP accounts, but few pips on ECN accounts.

Slippage

When a trader executes a using the market order, they don’t really get the price they had intended. There is a small pip difference between the two prices. And this difference between the prices is referred to as slippage. The slippage is usually within 0.5 to 5 pips.

Trading Range in EUR/GBP

Understanding the volatility of the market is essential before opening or closing a position. It shows how much profit or loss a trader will be on a particular timeframe. For example, if the volatility is on the 4H is 10 pips, the trader can expect to gain or lose $1269 (10 pips x 12.69 value per pip) in a matter of about 4 hours.

The table below illustrates the minimum, average, and maximum pip movement on the 1H, 2H, 4H, 1D, 1W, and 1M timeframe.

EUR/GBP PIP RANGES

Procedure to assess Pip Ranges

  1. Add the ATR indicator to your chart
  2. Set the period to 1
  3. Add a 200-period SMA to this indicator
  4. Shrink the chart so you can assess a large time period
  5. Select your desired timeframe
  6. Measure the floor level and set this value as the min
  7. Measure the level of the 200-period SMA and set this as the average
  8. Measure the peak levels and set this as Max.

EUR/GBP Cost as a Percent of the Trading Range

An application of the volatility would be the determining of cost on each trade. As in, the ratio between the volatility and the total cost on each trade is calculated and is expressed in terms of percentage. The percentage depicts the cost for a particular timeframe and volatility. The comprehension of it shall be discussed in the subsequent section.

ECN Model Account

Spread = 0.8 | Slippage = 2 | Trading fee = 1

Total cost = Slippage + Spread + Trading Fee = 2 + 0.8 + 1 = 3.8

STP Model Account

Spread = 1.5 | Slippage = 2 | Trading fee = 0

Total cost = Slippage + Spread + Trading Fee = 2 + 1.5 + 0 = 3.5

The ideal way to trade the EUR/GBP

With the above two tables, let us figure out the ideal way to trade this currency pair. Note that the higher the percentage, the higher is the cost on a trade and vice versa. It is evident from the chart that the percentages are highest for the minimum column and lowest for the max column. In other words, the cost is high when the volatility of the market is low, and the cost is low when the volatility is high. So does this mean it is ideal to trade when the volatility is high? Well, that’s not the right approach to it, as trading in high volatility is risky. So, it is ideal to take trades during those times when the volatility is around the average range. Doing that will ensure marginal cost as well as decent cost. For example, a 4H trader must take trades during those occasions when the volatility is around 20 pips.

Note: One can apply the ATR indicator to determine the current volatility of the market.

Another feasible way to reduce costs is by canceling out the slippage cost. Cancel slippage costs can simply be done by placing limit orders. With limit orders, the slippage automatically becomes 0.

The difference in the cost percentage when the slippage goes to zero is illustrated as follows.

We hope you find this Asset Analytics informative. Let us know if you have any questions in the comments below. Cheers!

Categories
Forex Economic Indicators

What Is Gross Domestic Product (GDP) & How Is It Useful For The Forex Traders?

Introduction

Gross Domestic Product, also known as GDP, is one of the main Microeconomic Indicator in Forex. It is the total amount of money spent on final goods and services. GDP is expressed in percentage terms and is calculated across different time periods. The time period is usually from one quarter to another.

It is a standard measure for the value added to the country’s economy through the production of goods and services during a specific time period. GDP is published by the International Monetary Fund (IMF), and information on the same can be found on their official website.

What does GDP measure?

Just as explained in the beginning, GDP measures the health of an economy. If the GDP of a country is high, it means it is receiving capital flows from central banks and institutions, which is a big positive for that country. However, if the GDP numbers are declining quarter on quarter, it means the economic growth of the country is shrinking. When GDP falls, unemployment in the country rises, and output in production drops.

GDP is important because it gives a birds-eye view of how the economy is doing. It is a sign of people getting more jobs, getting better pay, and businesses feeling confident about investing more.

Calculation of GDP

The GDP of a country can be calculated by using the below-mentioned formula

GDP = C + I + G + (X-M)

Where C is the spending made by consumers

I is the investment by businesses

G is the government spending

(X-M) is the net exports

How do Forex traders use GDP?

GDP is an indicator that is used by both technical and fundamental traders. It is one of the most critical drivers of the economy and is closely monitored by all. GDP is important because it can affect how the financial markets can behave, both positively and negatively. Strong GDP growth translates into higher corporate earnings, which directly appreciates the currency value. Conversely, falling GDP means the economy is weakening, which is negative for the currency and, therefore, stock prices. According to economists, a recession is said to occur when there are two consecutive quarters of negative GDP growth.

One should not forget that GDP is a lagging indicator, meaning it shows what the economy did in the past. It does not predict the state of the economy in the near future. Hence, if the GDP data of a country is not good, traders view this as an opportunity to buy the currency and make a profit in the long term.

Summary

Understanding the Gross Domestic Product and its growth rate is essential for investors and traders as it affects the decision-making process of policymakers of the country. When the GDP growth rate is high, the central banks raise interest rates and encourage investment. High-interest rate is said to attract foreign investors and financial institutions. With the improvement in research and quality of data, statisticians and governments are trying to find measures to strengthen GDP and make it a comprehensive indicator of national income.

Categories
Forex Economic Indicators Forex Fundamental Analysis

How the Trade Balance Affects the Forex Market


We can define Trade Balance as the difference in value between exported and imported goods and services for a designated time period. It can also be referred to as trade deficit/surplus. A trade deficit occurs if more products and services are imported than exported. A trade surplus happens if there are more goods and services which are exported than imported.

Every country produces goods and services. These can be consumed locally or exported to other countries for foreign exchange earnings. No country is entirely self-sufficient. Therefore it will also import goods and services that are beneficial to their economy from other countries, thus, paying the cost using foreign exchange. That is is the trade process that countries engage in. The Trade Balance is the comparison between the amount earned from the exports and the amount spent on foreign exchange for its imports. This can also be referred to as the balance of trade.


What factors affect the Trade Balance

Factors affecting the balance of trade include:

  1. a) Production costs, which includes land, labor, capital, taxes, incentives, etc. in the exporting country and the same applies to those in the importing economy;
  2. b) The cost and availability of resources which include raw materials, intermediate goods, and other inputs;
  3. c) Fluctuations in the exchange rate;
  4. d) Taxes and limitations on trade;
  5. e) Non-tariff barriers such as health, safety standards and environmental;
  6. f) The availability (or lack of it) of foreign currency to pay for imports; and
  7. g) Prices of domestic manufactured goods.


Why are Trade Balance Figures Relevant to Forex Traders?

Manufacturing, employment, and consumption are what make up international commerce and trade. Imports and exports attract demand and, as a result, are directly linked to the need for both local or foreign currencies. A country should use international currency reserves when they conduct international trade, and the dynamics between imports and exports will dictate which side employment will be generated. Consumer spending and habits will be affected by the kind of goods imported into a country and which are manufactured in a country for local consumption or export.

The Trade Balance report carries a high market impact as manufacturing, employment, and consumer spending/consumption are factors that significantly affect the state of a countries economy. Also, the trade balance has a direct impact on a country’s Gross Domestic Product (GDP).


How does a Trade Balance report influence the respective currencies?

Net Importers – A net importer country has more imports than exports. Therefore it will need access to a large amount of foreign currency to fund the cost of its imports. An increased supply of the local currency coupled with a growing demand for foreign money will lead to a depreciation of the local currency.

An imbalance in the Balance of Trade which sways towards importation will lead to layoffs in

the manufacturing sector and thus increase unemployment and will cause a depreciation in the value of the local currency.

Net Exporters – A country that is a net exporter will export more goods than they import and have a demand from foreign sources for the cost into the local currency. Increased demand in export will also lead to increased manufacturing, which creates jobs and drives consumer spending and consumption and will cause the value of the local currency to appreciate.

Summary

  • Increased deficit, when imports exceed exports, is bad for the local currency.
  • Increased surplus, when exports exceed imports, is good for the local currency.

The Trade Balance report

The Trade Balance report is issued on a monthly basis, and covers the period of the previous month, which is under review. The most important reports are released from the US, Canada, Australia, New Zealand, United Kingdom, European Union countries, and China. Below you can peruse the various data from the major players.


GBP (Sterling) – https://tradingeconomics.com/united-kingdom/balance-of-trade

AUD – https://tradingeconomics.com/australia/balance-of-trade

USD – https://tradingeconomics.com/united-states/balance-of-trade

CHF – https://tradingeconomics.com/switzerland/balance-of-trade

EUR – https://tradingeconomics.com/euro-area/balance-of-trade

CAD – https://tradingeconomics.com/canada/balance-of-trade

NZD – https://tradingeconomics.com/new-zealand/balance-of-trade

JPY – https://tradingeconomics.com/japan/balance-of-trade


In conclusion

It is important to keep an eye o Trade Balance reports, as they show the overall health of the respective country. A country that is facing a high rate of unemployment and falling into a bad state of affairs in manufacturing will benefit from a positive trade balance report more than a country where these are not huge concerns. The trade balance report is a crucial piece of fundamental analysis for a trader to use in order to maximise the effectiveness of his trades.


Categories
Forex Assets

Understanding The Fundamentals Of USD/JPY Forex Pair

Introduction

USDJPY is the abbreviation for the currency pair US dollar against the Japanese yen. This currency pair is very liquid and volatile. It is classified as a major currency pair. Here, USD is the base currency, and JPY is the quote currency. The currency pair shows how many JPY are required to purchase one US dollar.

Understanding USD/JPY

The exchange rate of USDJPY represents the units of JPY equivalent to one US dollar. For example, if the value of USDJPY is 109.550, then these many Japanese yen are required to buy one US dollar.

USD/JPY Specification

Spread

Spread is simply the difference between the bid price and the ask price. It depends on the account type. The average spread for ECN and STP account is shown below.

Spread on ECN: 0.5

Spread on STP: 1.2

Fees

The fee is basically the commission charged by the broker on each trade. Typically, the fee on STP accounts is nil, and there is some fee on the ECN account. There is no fixed fee on the ECN account and varies from broker to broker.

Slippage

Slippage is the difference between the price needed by the trader and the real price the trader was executed. Slippage happens when orders are executed as market orders. The slippage is usually within the range of 0.5 to 5 pips.

Trading Range in USD/JPY

The trading range is the representation of the minimum, average, and maximum volatility on a particular timeframe. It shows the range of pips the currency pair moved on a given timeframe. These values prove to be helpful in assessing a trader’s risk and controlling their cost on a trade.

USD/JPY PIP RANGES

Procedure to assess Pip Ranges

  1. Add the ATR indicator to your chart
  2. Set the period to 1
  3. Add a 200-period SMA to this indicator
  4. Shrink the chart so you can assess a large time period
  5. Select your desired timeframe
  6. Measure the floor level and set this value as the min
  7. Measure the level of the 200-period SMA and set this as the average
  8. Measure the peak levels and set this as Max.

USD/JPY Cost as a Percent of the Trading Range

Just knowing how many pips the currency pair moved is pointless. To bring it some value, it is clubbed with the total cost to understand how the cost varies based on the volatility of the market. It shows cost and volatility are dependent on each other.

The relation between Cost and Volatility

Cost and volatility are inversely proportional to each other. When the volatility of the market is low, the costs are high; and when the volatility is high, the cost is low. More on this is discussed in the subsequent section.

ECN Model Account

Spread = 0.5 | Slippage = 2 | Trading fee = 1

Total cost = Slippage + Spread + Trading Fee = 2 + 0.5 + 1 = 3.5

STP Model Account

Spread = 1.2 | Slippage = 2 | Trading fee = 0

Total cost = Slippage + Spread + Trading Fee = 2 + 1.2 + 0 = 3.2

The Ideal way to trade the USD/JPY

The above two tables are formed by finding the ratio between the total cost and the volatility. It is then expressed in terms of a percentage. Comprehending the values is simple. It is based on the relation between cost and volatility. If the percentage value is high, then the cost is high for that particular volatility and timeframe. It can be inferred that the min column has the highest values compared to the average and max column. This simply means that the costs are high when the volatility of the market is low. Hence, it is recommended to open/close positions when the volatility is at or above the average mark.

Furthermore, apart from volatility, the cost is heavily affected by the slippage. As mentioned, this happens due to market order executions. Hence, to reduce your cost by up to 50% on each trade, it is recommended to trade using limit orders and not market orders.

Categories
Forex Assets

USD/CHF Currency Pair – Everything You Should Know!

Introduction

USD/CHF is the abbreviation for the US dollar and the Swiss franc. This pair is a major currency pair. USD is the base currency, while CHF is the quote currency. The pair as a whole tells how many units of the quote currency is needed to purchase one unit of the base currency. Trading USDCHF is as good as saying, trading the ‘Swissie.’

Understanding USD/CHF

The exchange value of USDCHF represents the number of Swiss francs required to buy one US dollar. For example, if the value of USDCHF is 0.9820, to purchase one USD, the trader must pay 0.9820 Swiss francs.

USD/CHF Specification

Spread

Spread in trading is the difference between the bid price and the ask price offered by the broker. It is measured in terms of pips and varies on the type of account and type of broker.

Spread on ECN: 0.8

Spread on STP: 1.6

Fees

There is a small fee or commission charged by the broker for every trade a trader takes. This depends on both types of accounts and broker. For our analysis, we have kept the fee fixed at one pip.

Slippage

Due to volatility in the market, a trader does not usually get the price that he demanded. The actual price differs from the demanded price. This difference is referred to as slippage. For example, if a trader executes a trade at 0.9890, the real price received would be 0.9892. This difference of two pips is known as slippage.

Trading Range in USD/CHF

The trading range is a tabular representation of the minimum, average, and maximum pip movement on a particular timeframe. Having knowledge about this is necessary because it helps in managing risk as well as determining the right times of the day to enter and exit a trade with minimal costs.

Below is a table that depicts the minimum, average, and maximum volatility (pip movement) on different timeframes.

USD/CHF PIP RANGES

Procedure to assess Pip Ranges

  1. Add the ATR indicator to your chart
  2. Set the period to 1
  3. Add a 200-period SMA to this indicator
  4. Shrink the chart so you can assess a large time period
  5. Select your desired timeframe
  6. Measure the floor level and set this value as the min
  7. Measure the level of the 200-period SMA and set this as the average
  8. Measure the peak levels and set this as Max.

USD/CHF Cost as a Percent of the Trading Range

The number of pips the currency pair move in each timeframe is shown in the above table. Now, we apply these values to find the cost percentage when the volatility is minimum, average, and max. This cost percentage will then help us filter out the most optimal time of the day to take trades.

The comprehension of the cost percentage is simple. If the percentage is high, then the cost is high for that particular timeframe and range. If the percentage is low, then the cost is relatively low for that timeframe and range.

Note that, the total cost on a single trade is calculated by adding up the spread, slippage, and trading fee.

ECN Model Account

Spread = 0.8 | Slippage = 2 | Trading fee = 1

Total cost = Slippage + Spread + Trading Fee = 2 + 0.8 + 1 = 3.8

STP Model Account

Spread = 1.6 | Slippage = 2 | Trading fee = 0

Total cost = Slippage + Spread + Trading Fee = 2 + 1.6 + 0 = 3.6

The Ideal way to trade the USD/CAD

Entering and exiting trades during any time of the day might not be the smartest move. There are particular times of the day a trader must manage their trade to reduce both risk and cost on the trade. This can be made possible by comprehending the above two tables.

The percentages are highest in the min column. Meaning, the cost is pretty high when the volatility of the market is low. For example, on the 1H timeframe, when the volatility is 2.5 pips, the cost percentage is 152%. This means that one must bear high costs if they open or close trades when the volatility is around 2.5 pips. So, ideally, it is recommended to trade when the market volatility is above the average mark.

Apart from that, it is much better if one trades using the limit orders rather than market orders, as it nullifies the slippage on the trade. In doing so, the costs of each trade will reduce by about 50%.

Categories
Forex Assets

What Should You Know About USD/CAD Forex Pair?

Introduction

USDCAD is the short form for the US dollar against the Canadian dollar. USDCAD, just like the EURUSD, GBPUSD, AUDUSD, etc. is a major currency pair. In this pair, the US dollar is the base currency, and the Canadian dollar is the quote currency. Trading this currency pair is known as trading the “loonie” because it is the name for the Canadian one-dollar coin.

Understanding USD/CAD

The exchange price of USD/CAD is basically the value of 1 USD in terms of CAD. It is quoted as 1 US dollar per X* Canadian dollars. For example, if the value of USDCAD is 1.3300, it means that it takes 1.3300 Canadian dollars to buy one US dollar.

*X is the current market price of USDCAD

USD/CAD Specification

Spread

The difference between the bid price and the ask price mentioned by the broker is the spread. Typically, this differs from the type of account.

Spread on ECN: 0.7

Spread on STP: 1.2

Fees

There is a fee (commission) on every trade a trader takes. This again depends on the type of account registered by the user. There is no fee on the STP account, but a few pips on an ECN account.

Note: We are considering fees in terms of pips, not currency units.

Slippage

Sometimes a trader is executed at a different price from what he had intended. This variation in price is known as slippage. Slippage takes place when orders are executed as a market type, and it depends on the volatility of the currency pair and also the execution speed of the broker.

Trading Range in USD/CAD

Trading analysis is not all about predicting when the prices will rise and fall. Sometimes, even though a trader knows the prices are going to rise/fall, it might not be ideal to jump on the trade without the knowledge of volatility of the market. Volatility range plays a major role in managing the total cost of a trade. Hence, it is vital to know the minimum, average, and maximum pip movement in each timeframe to assess the trading costs.

Below is a table that depicts the minimum, average, and maximum volatility (pip movement) on different timeframes.

USD/CAD PIP RANGES

Procedure to assess Pip Ranges

  1. Add the ATR indicator to your chart
  2. Set the period to 1
  3. Add a 200-period SMA to this indicator
  4. Shrink the chart so you can assess a large time period
  5. Select your desired timeframe
  6. Measure the floor level and set this value as the min
  7. Measure the level of the 200-period SMA and set this as the average
  8. Measure the peak levels and set this as Max.

USD/CAD Cost as a Percent of the Trading Range

With the min, average, and max pip movement, the cost range is calculated in terms of percentage. This percentage has no unit and determines if the width of the cost. That is, if the percentage is high, the cost is high for the trade, and if the percentage is low, the cost is low too.

Below are two tables representing the range of cost for an ECN account and an STP account.

ECN Model Account

Spread = 0.7 | Slippage = 2 | Trading fee = 1

Total cost = Slippage + Spread + Trading Fee = 2 + 0.7 + 1 = 3.7

STP Model Account

Spread = 1.2 | Slippage = 2 | Trading fee = 0

Total cost = Slippage + Spread + Trading Fee = 2 + 1.2 + 0 = 3.2

The Ideal way to trade the USD/CAD

As mentioned earlier, the higher the percentage, the higher is the cost for a trade. Applying this idea to the above tables, it can clearly be inferred that the percentages are high on the minimum column. This means that the costs are high when the volatility of the currency pair is very feeble.

Similarly, the costs are considerably low when the volatility is quite high. However, this does not mean that trading during high volatility is the ideal way. This is because the volatility is quite risky to trade volatile markets. Therefore, one must trade during those times of day when the market volatility is around the mentioned average. The costs are decent enough, and the risk is maintained just fine.

Another point of consideration is that costs are reduced significantly when the slippage is made nil. This can be made possible by entering and exiting a trade by placing a pending/limit order instead of executing them by market.

Below is the same cost percentage table after making the slippage value to 0.

Now it is evident from the above table that slippage eats up a significant amount of cost on each trade. Hence, limit orders are the way to go.