Introduction
New Zealand dollar versus the US dollar, in short, is referred to as NZD/USD or NZDUSD. This currency pair is classified as a major currency pair. In NZDUSD, NZD is the base currency, and USD is the quote currency. Trading the NZDUSD is as good as saying, trading the New Zealand dollar, as NZD is the base currency.
Understanding NZD/USD
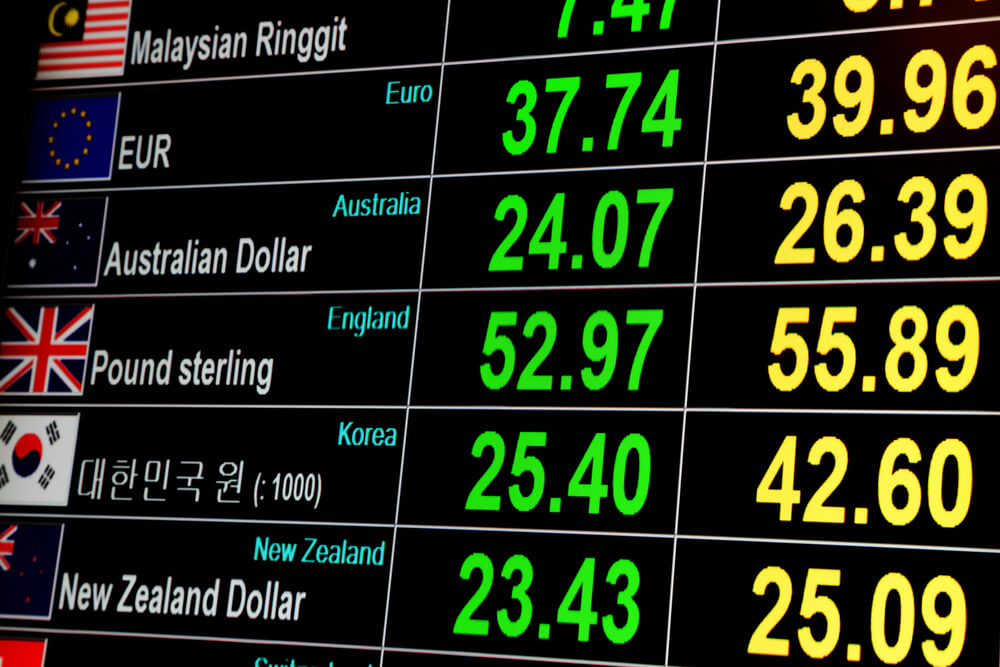
The value (currency market price) of NZDUSD represents units of USD equivalent to 1 NZD. In layman terms, it is the number of US dollars required to purchase one New Zealand dollar. For example, if the value of NZDUSD is 0.6867, then 0.6867 USD is required to buy one NZD.
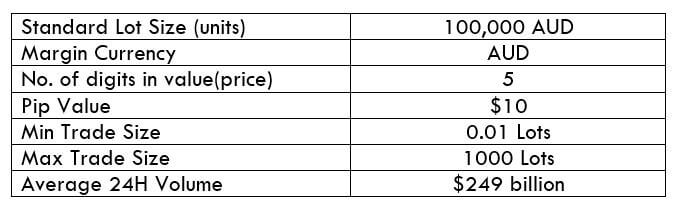
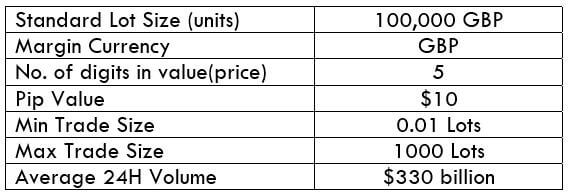
NZD/USD Specification
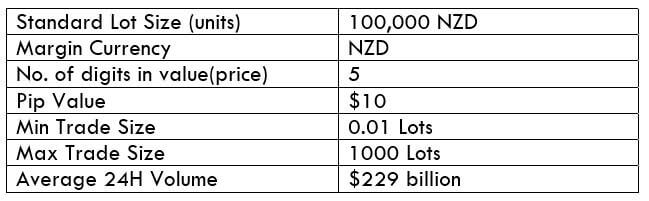
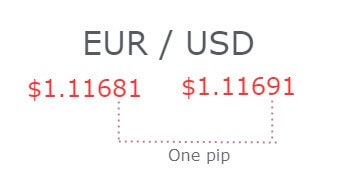
Spread
The algebraic difference between the bid price and the ask price is called the spread. It depends on the type of execution model provided by the broker.
Spread on ECN: 1
Spread on STP: 1.9
Fees
Similar to spreads, fees also depend on the type of execution model. Usually, there is no fee on the STP model, but there is a small fee on the ECN model. In our analysis, we shall fix the fee to 1 pip.
Slippage
Slippage is the difference between the price asked by the trader for execution and the actual price the trader was executed. Slippage occurs on market orders. It is dependent on the volatility of the market as well as the broker’s execution speed. Slippage has a decent weight on the cost of each trade. More about it shall be discussed in the coming sections.
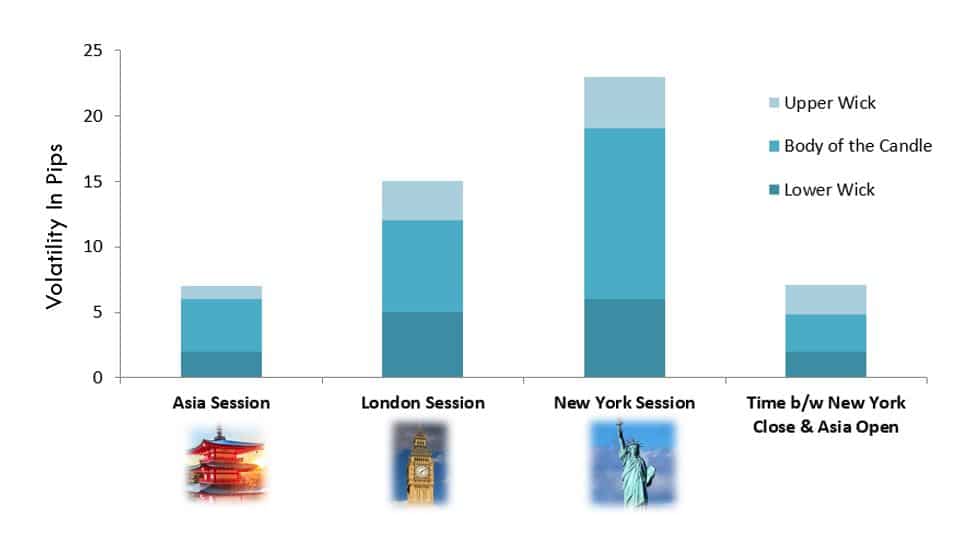
Trading Range in NZD/USD
The volatility of a currency pair plays a vital role in trading. It is a variable that differs from timeframe to timeframe. Understanding the range (min, avg, max) is essential for a trader, as it is helpful for reducing the cost of each trade.
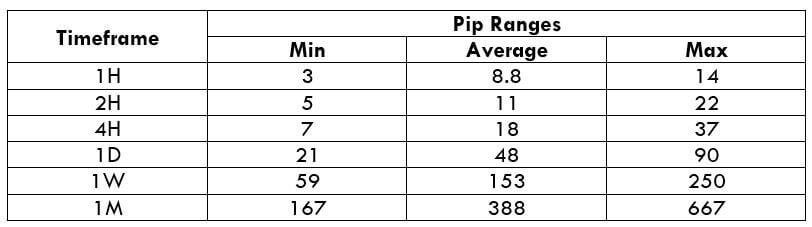
The volatility gives the measure of how many pips the pair has moved on a particular timeframe. This, in turn, gives the approximate profit or loss on each timeframe. For example, if the volatility of NZDUSD on the 1H timeframe is 10 pips, then one can expect to gain or lose $100 (10 pips x $10 [pip value]) within an hour or two.
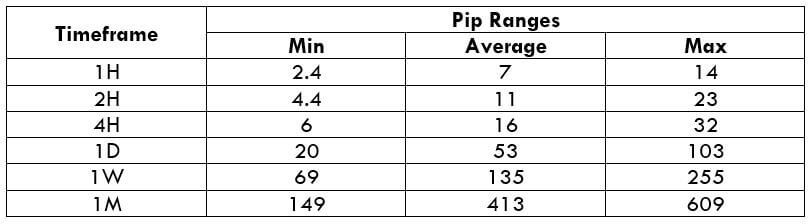
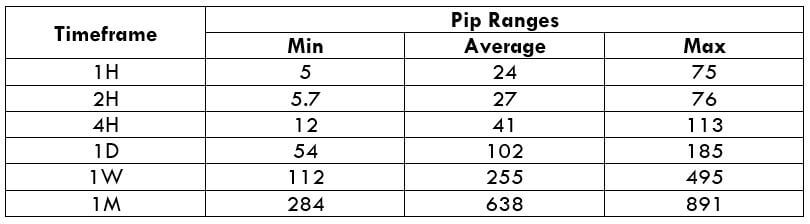
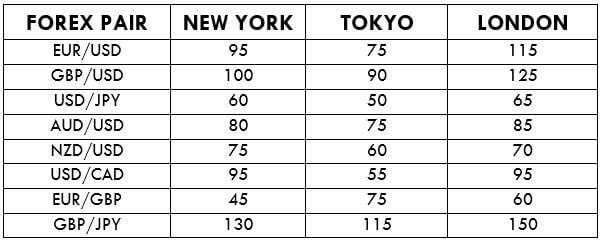
Below is a table that depicts the minimum, average, and maximum volatility (pip movement) on different timeframes.
AUD/USD PIP RANGES
Procedure to assess Pip Ranges
- Add the ATR indicator to your chart
- Set the period to 1
- Add a 200-period SMA to this indicator
- Shrink the chart so you can assess a large time period
- Select your desired timeframe
- Measure the floor level and set this value as the min
- Measure the level of the 200-period SMA and set this as the average
- Measure the peak levels and set this as Max.
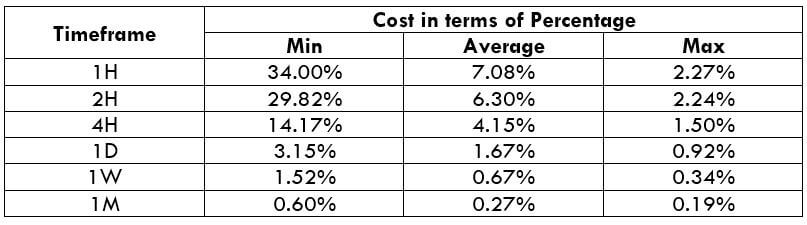
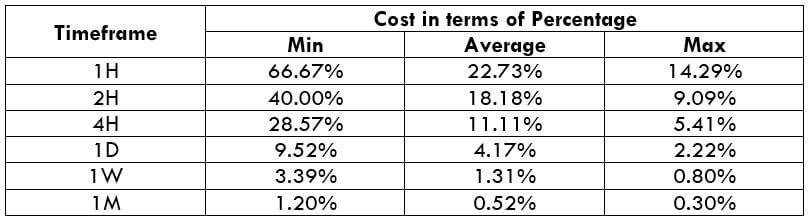
NZD/USD Cost as a Percent of the Trading Range
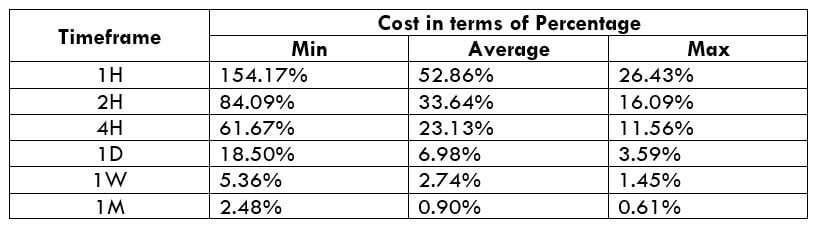
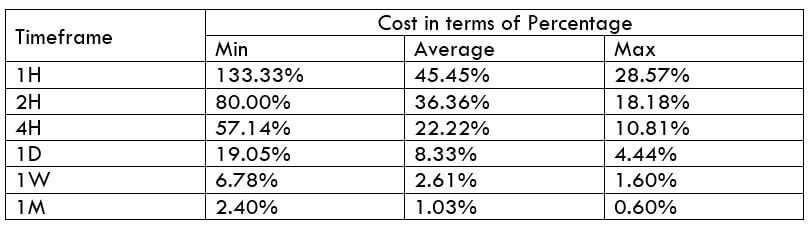
With the volatility values obtained in the above table, the total cost of each trade is calculated on each timeframe. These values are represented in terms of a percentage. And these percentages will determine during what values of volatility it is ideal to trade with low costs.
The total cost is calculated by adding up the spread, slippage, and trading fee. As a default, we shall keep the slippage at 2 and the trading fee for the ECN model at 1.
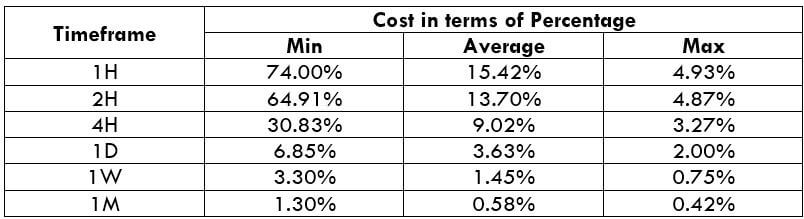
ECN Model Account
Spread = 1 | Slippage = 2 | Trading fee = 1
Total cost = Slippage + Spread + Trading Fee = 2 + 1 + 1 = 4
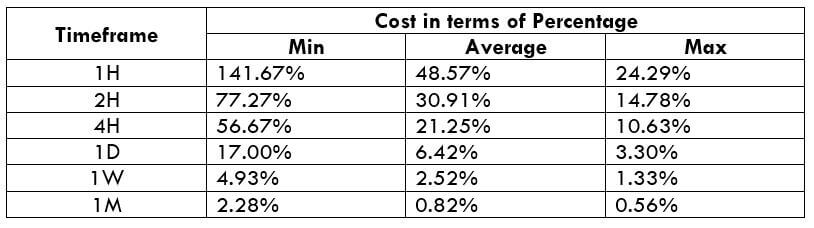
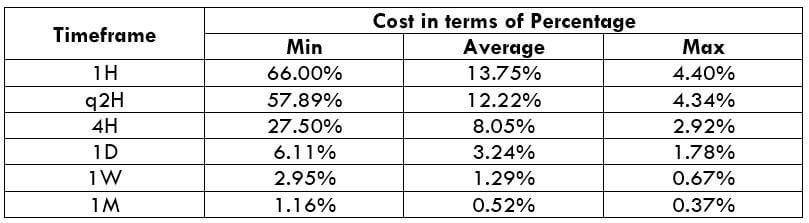
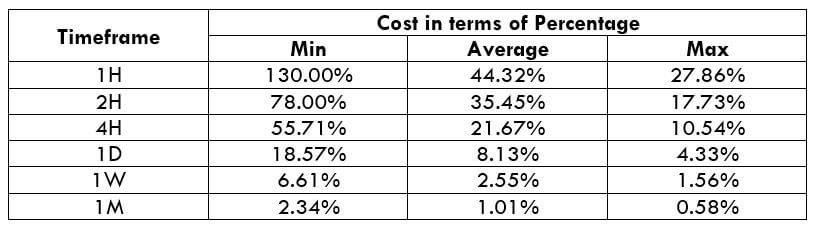
STP Model Account
Spread = 1.9 | Slippage = 2 | Trading fee = 0
Total cost = Slippage + Spread + Trading Fee = 2 + 1.9 + 0 = 3.9
 The Ideal Timeframe to Trade NZD/USD
The very first observation that can be made from the above two tables is that the total costs in both the model types are more or less the same. So trading on any one of the two accounts is a fine choice.
From the minimum, average, and maximum column, it can be ascertained that percentages (costs) are the highest on the minimum column of all the timeframes. In simpler terms, when the volatility of the currency pair is very low, the costs are usually on the higher side. Conversely, when the volatility is high, the costs are pretty low. Hence, it is ideal to trade during those times of the day when the volatility of the pair is at or above average. For example, a day trader can trade the 1H timeframe when the volatility of the currency pair is above 8.8 pips. This will hence assure that the costs are pretty low.
Another way to reduce the costs is by nullifying the slippage. This can be done by placing a limit order instead of executing them by a market order. This shall reduce the total costs by a significant percentage. An example of the same is given below.
Total cost = Slippage + Spread + Trading fee = 0 + 1 + 1 = 2
From the above table with nil slippage, it is evident that the costs have reduced by about 50%. Hence, to sum it up, to optimize the cost, it is ideal to trade when the volatility is above average and also enter & exit trades using limit orders rather than market orders.