Categories
Forex Daily Topic Forex Fundamental Analysis

Understanding The Impact of ‘Sales Tax Rate’ News Release On The Forex Market

Introduction

The sales tax rate usually comes as an afterthought to many. But for forex traders, understanding how the rarely-talked about sales tax rate could prove useful in the long-run. This article defines what sales tax rate is and further shows how they impact a country’s economic development and, by extension, its currency.

Understanding the Sales Tax Rate

A sales tax rate is the percentage of the total cost of the goods or services being sold. Sales tax is a consumption tax that is imposed by governments or local authorities on the sale of goods and services. The sales tax rate is calculated as a percentage then added on the cost. These taxes are usually collected at the retail point of sale on behalf of the imposing authority.

As structured, any business that is offering goods or services is liable for the payment of the sales tax in a given jurisdiction. Depending on the laws, this occurs is they have a physical location within the jurisdiction, an official employee, or an affiliate.

How Sales Tax Work?

The sales tax is collected at the end of the supply chain, only after resale to the consumer has occurred. Since consumers are the ones paying the tax, businesses receive a resale certificate to show that the sales tax is not yet due. The purpose of this certificate to the resellers is to ensure that no sales tax is paid on purchases of items to be resold.

The administration for the sales tax is triggered by whether or not a particular business has a presence within the tax jurisdiction. To be eligible to collect sales tax from its customers, the business has to apply for a sales tax permit from the relevant authorities.

Depending on the jurisdiction, the goods and services that are eligible for a sales tax vary. Groceries and medications are exempt from sales tax, as are goods and services purchased by nonprofit organizations.

Sales Tax Rate as an Economic Indicator

The sales tax rate can serve as a leading indicator for the shifts in demand and supply within the economy. Higher sales tax rates reduce the purchasing power and, with it, the aggregate demand and aggregate supply. The lowered demand and supply within the economy result in reduced economic activities, which could have an unintended ripple effect throughout the economy. With lowered demand and supply, unemployment as a result of job cuts in the affected sectors is another unintended consequence of a higher sales tax rate.

On the other hand, lowering sales tax increases the purchasing power of consumers, which in turn increases the aggregate demand and aggregate supply. These increases lead to job creation in various sectors and boost a flourishing economy. With a lower sales tax rate, the GDP growth within the country is guaranteed to bring about a strengthening currency as a result of improved economic conditions.

How the Sales Tax Rate Affects the Economy

In general, the sales tax rate has a negative correlation with the GDP. This negative relationship is shown in the scatterplot graph below of the US state sales tax rate against the GDP.

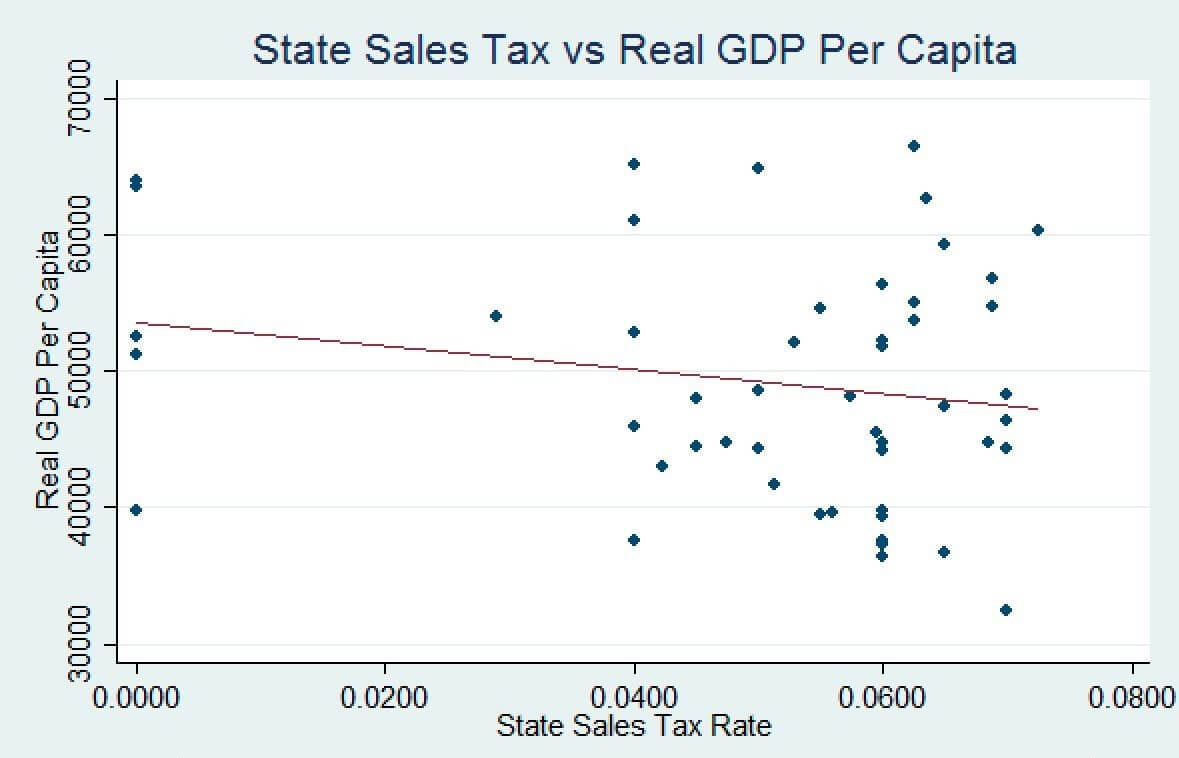
Source: Georgia Tech Library

At its core, sales tax is a revenue stream for the government. Thus, it can be said that a higher sales tax rate increases government revenues. The increase in government revenues increases government expenditure, hence higher GDP. In this scenario, a conflict arises. This conflicts because sales tax is an extra cost passed on to the consumer.

Thus, in general, the sales tax rate reduces the purchasing power of the consumers.  The reduced purchasing power leads to lesser sales taxes collected by the government, hence lower GDP. As a result of the diminished purchasing power, the consumers will spend less, resulting in a reduction in the aggregate demand within the economy. This reduction in demand leads to a reduction in the economic output hence lower GDP.

On the other hand, a lower sales tax rate returns some of the purchasing power to the consumers. They will spend more of their disposable income hence increasing the aggregate demand and supply within the economy. The increase in demand and supply increase the economic output. Furthermore, spending more implies that the government is bound to collect more revenue in the form of the applicable sales tax. An increase in revenue will increase the government expenditure within the economy, thus increasing the GDP.

How Sales Tax Rate Impacts Currency

The strength of any currency is usually seen as a direct reflection of its economic performance. As already discussed, the sales tax rate is considered to be leading indicators of aggregate demand and aggregate supply within an economy, and by extension, the unemployment levels. An increase in the sales tax rate will result in a drop in the aggregate demand and aggregate supply. This drop leads to increased unemployment levels and consequently reduced GDP. Long term currency traders can take their cue from an increased sales tax rate as an impending loss of strength in the country’s currency.

This loss in the currency’s strength can be brought by the expectations that, in the long run, central banks and the government will employ the use of expansionary fiscal and monetary policies to stimulate a stagnating economy. These policies harm the currency.

On the other hand, lowering the sales tax rate signifies that in the long run, the economy will be stimulated to grow. This growth is brought about by increased demand and supply. For forex traders, a country that is lowering the sales tax rate or entirely removing the sales tax can expect its currency to strengthen. The currency strength is because the traders can anticipate that in the long run, the government and the central banks may be forced to employ deflationary monetary and fiscal policies to avoid an overheating economy. These contractionary policies are good for the country’s currency.

Therefore, it can be expected that an increase in sales tax corresponds to a weakened currency against other pairs while a decrease in the sales tax rate corresponds to the strengthening of the currency.

How Sales Tax Rate News Release Affects The Forex Price Charts

The sales tax rate is not an indicator forex traders consider when placing their trades because it is a low-impact leading indicator. However, it is useful for forex traders to know just how much the impact of this low-level indicator is on the price charts.

In the US, the national government does now impose the sales tax. However, the various local governments set their own local sales tax rates. The detailed list of the US states and the sales tax rate applicable in each state can be found on the Sales Tax Institute website. The data on annual GDP growth can be accessed from the World Bank website. A forecast of the sales tax rate through to 2020 can be found on the Trading Economics website.

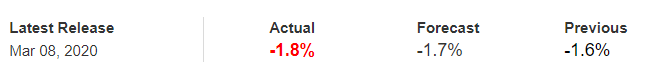
Below is a screengrab of the Sales Tax Institute showing the most recent changes sales tax rate in Washington.

In the latest release, Washington state lowered the sales tax rate applicable from 8.0 % to 6.5% in an attempt to alleviate the strain on consumers as a result of the Coronavirus pandemic.

Now, let’s see how this news release made an impact on the Forex price charts.

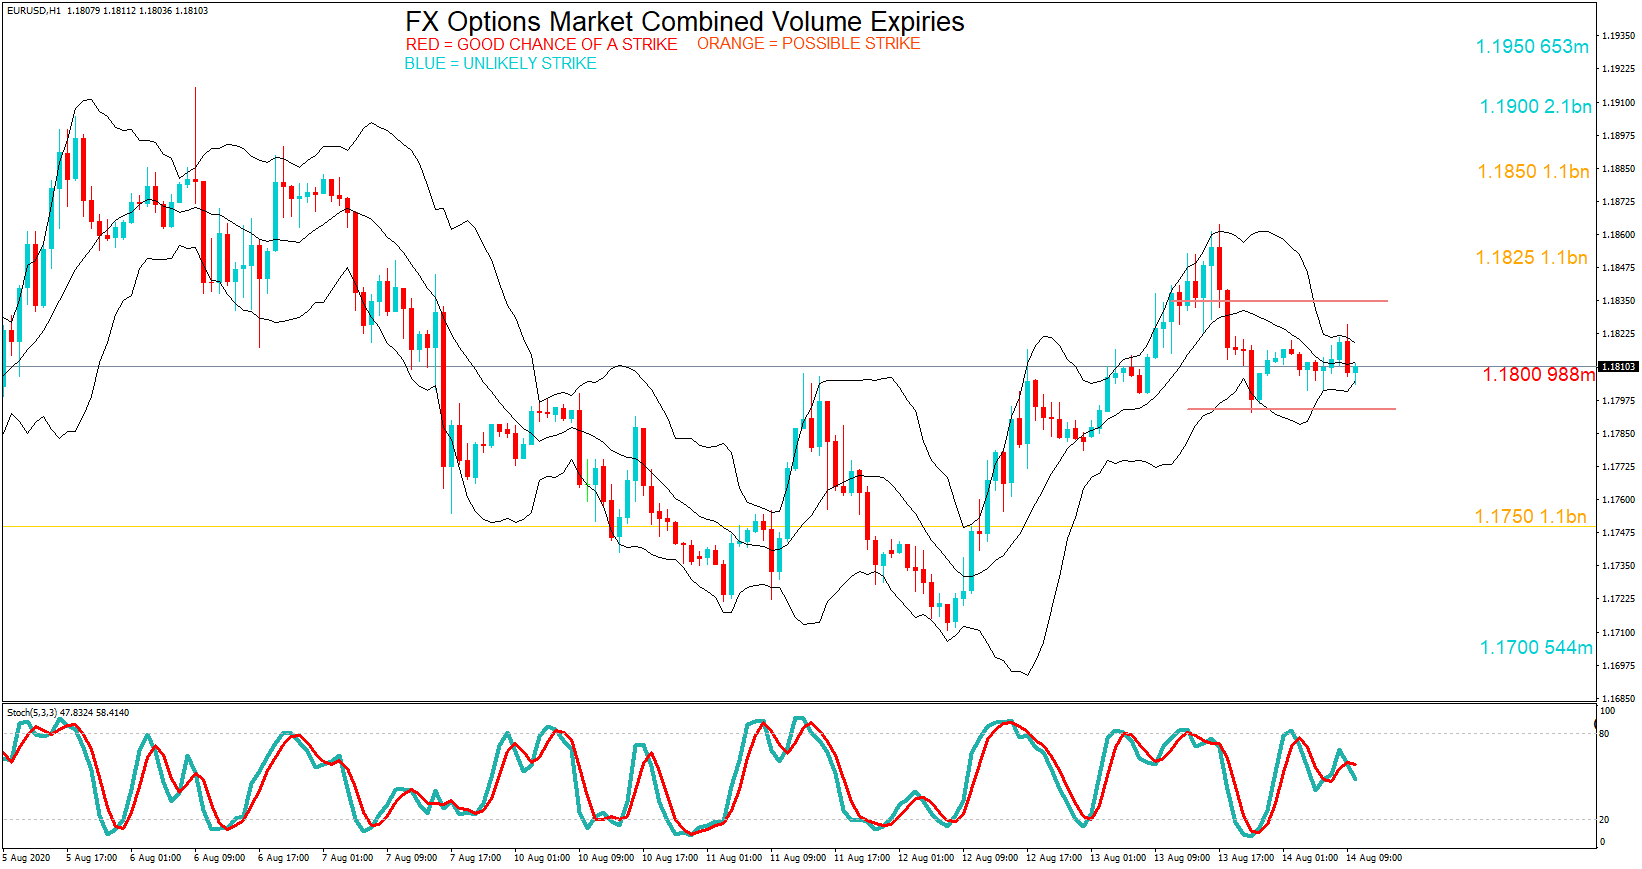
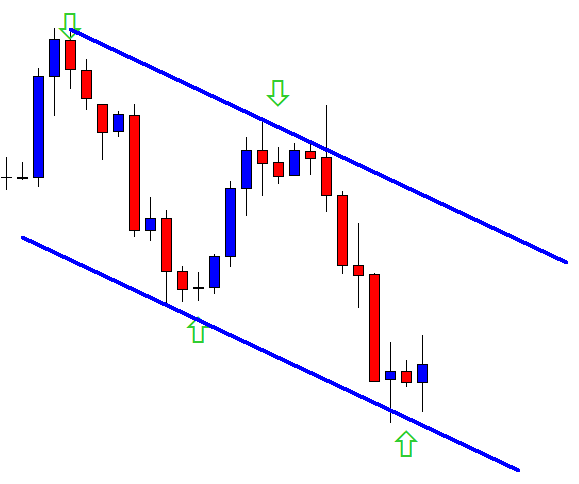
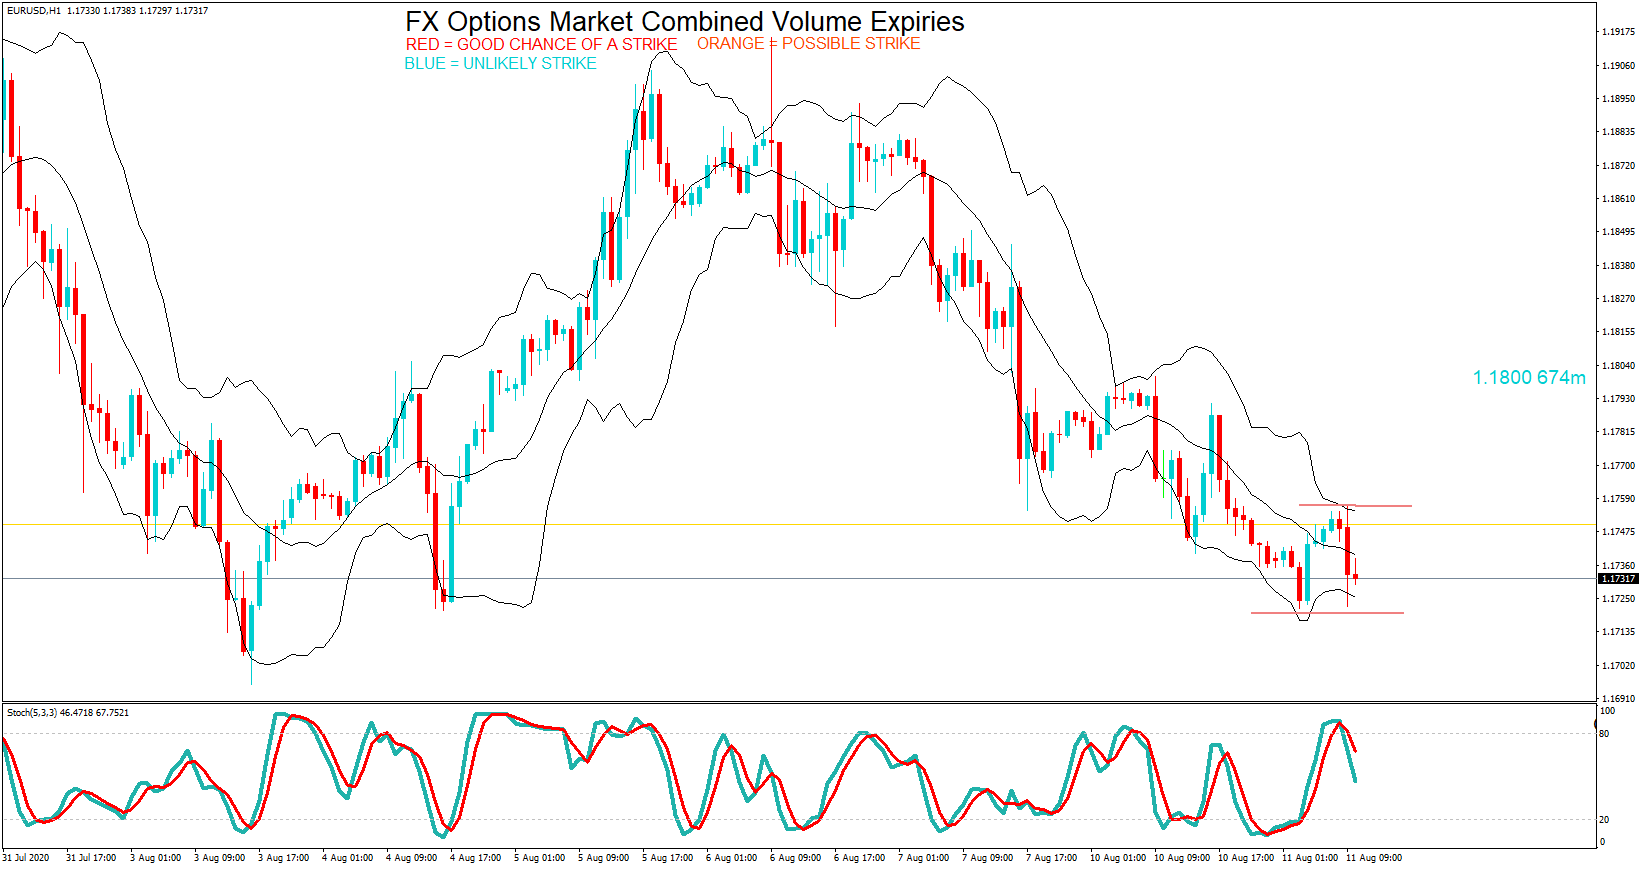
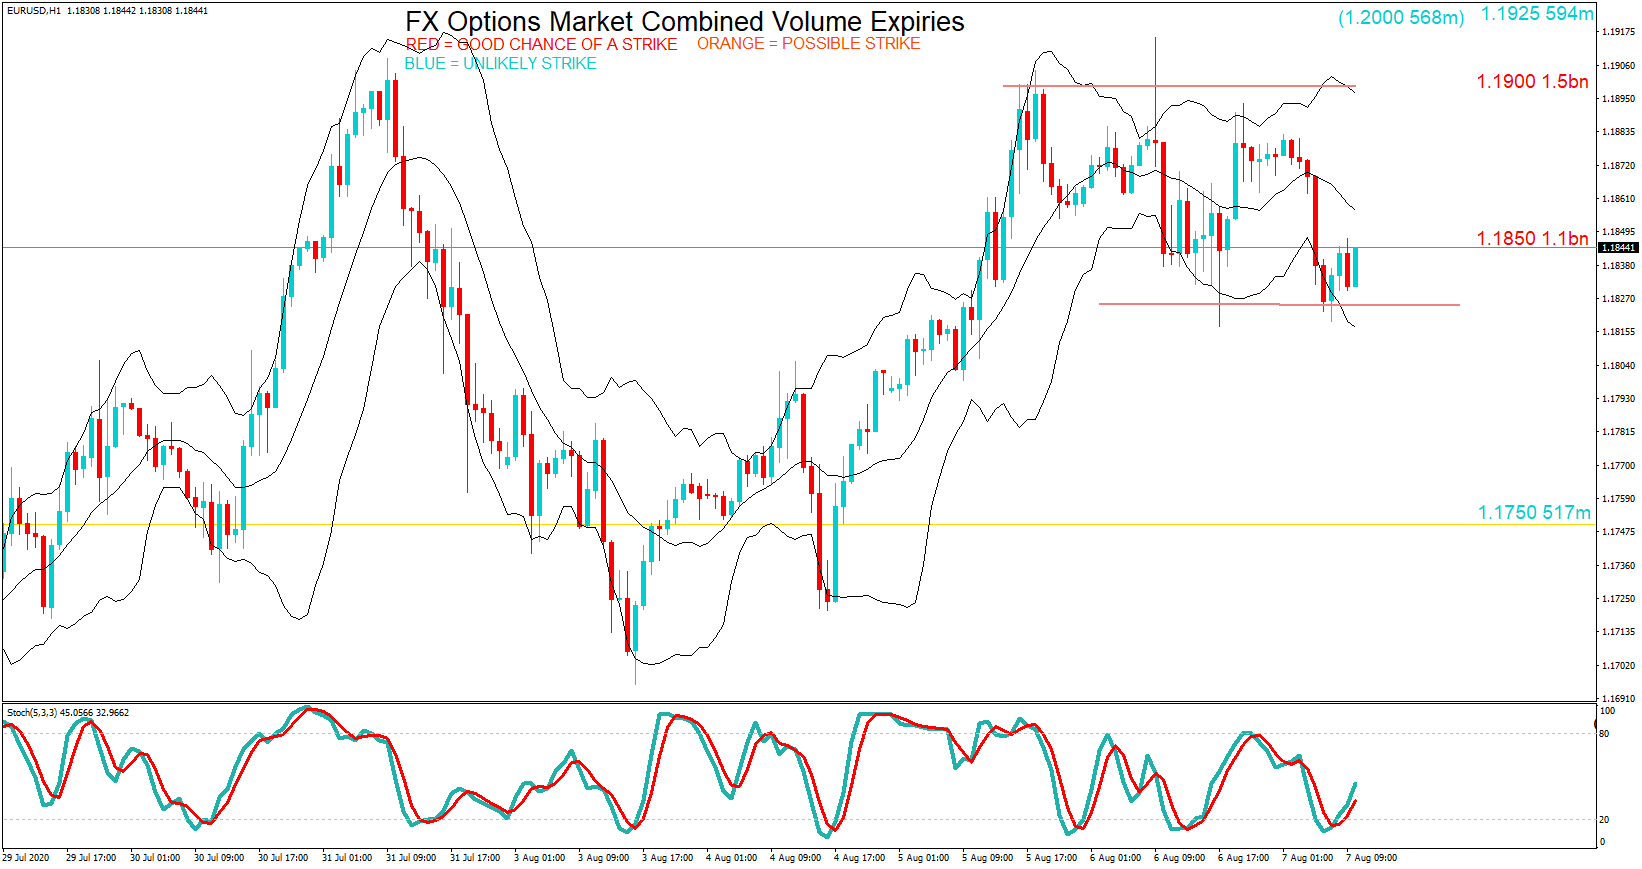
EUR/USD: Before Washington Sales tax rate release July 1, 2020

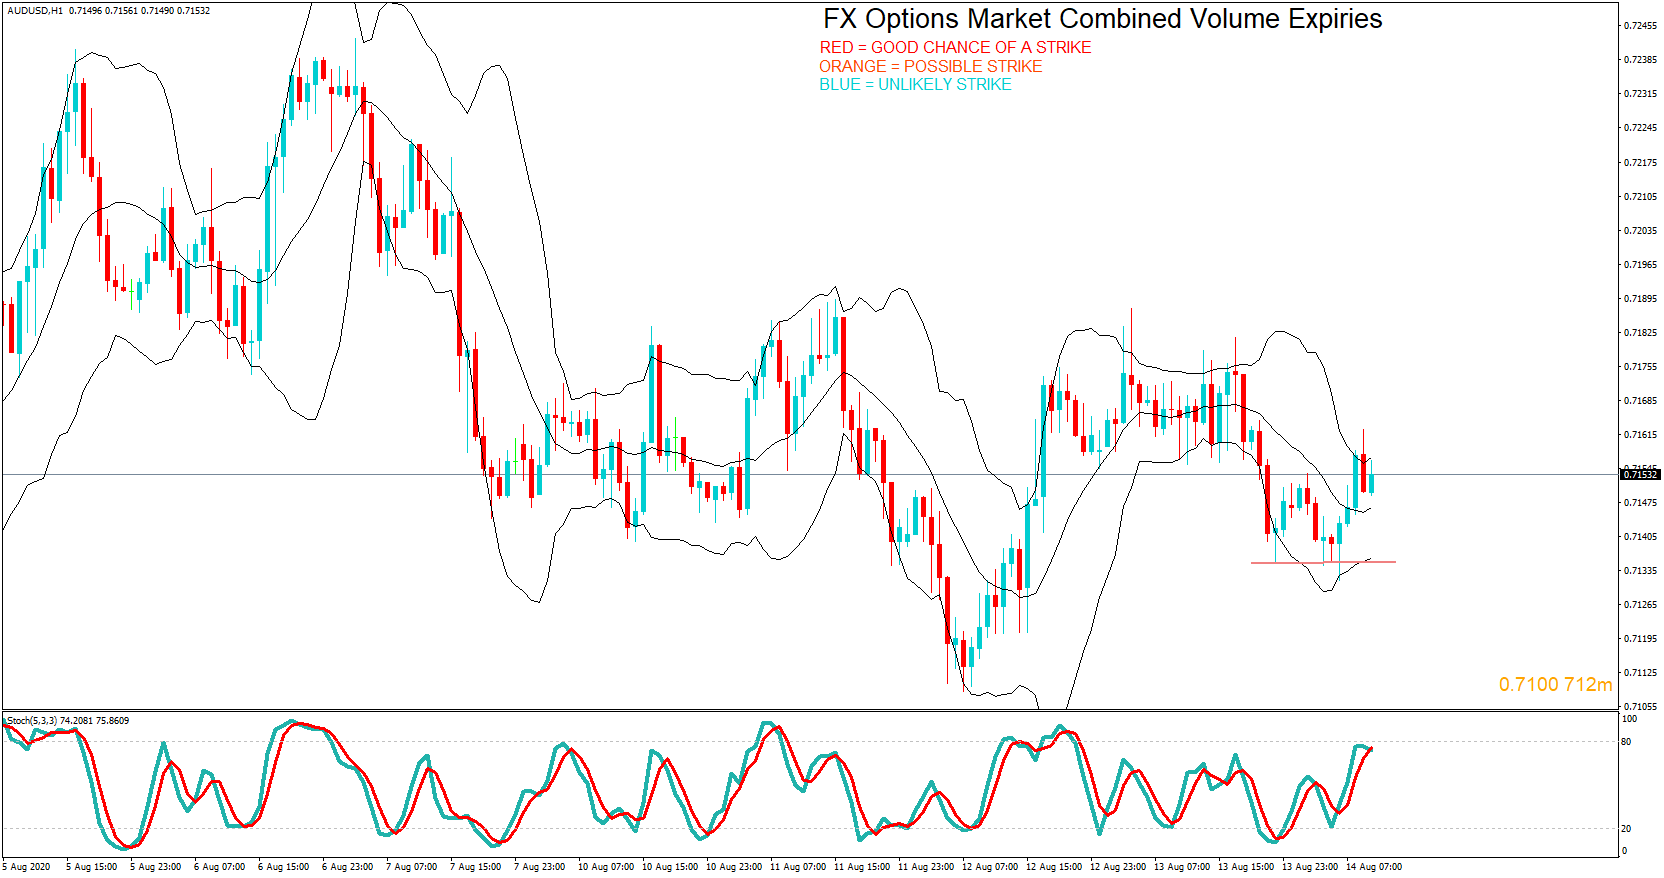
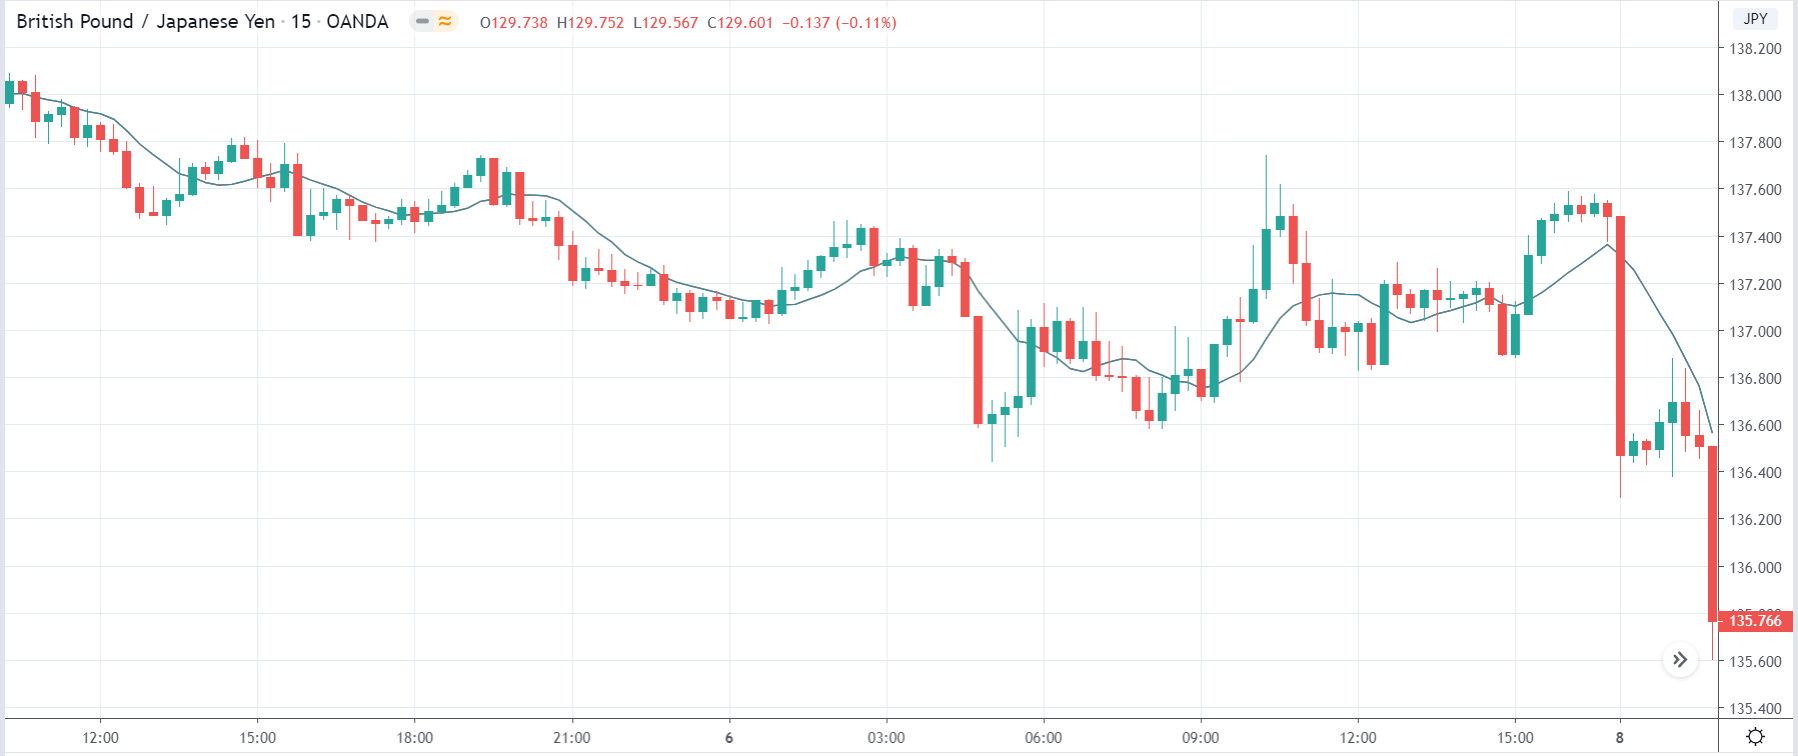
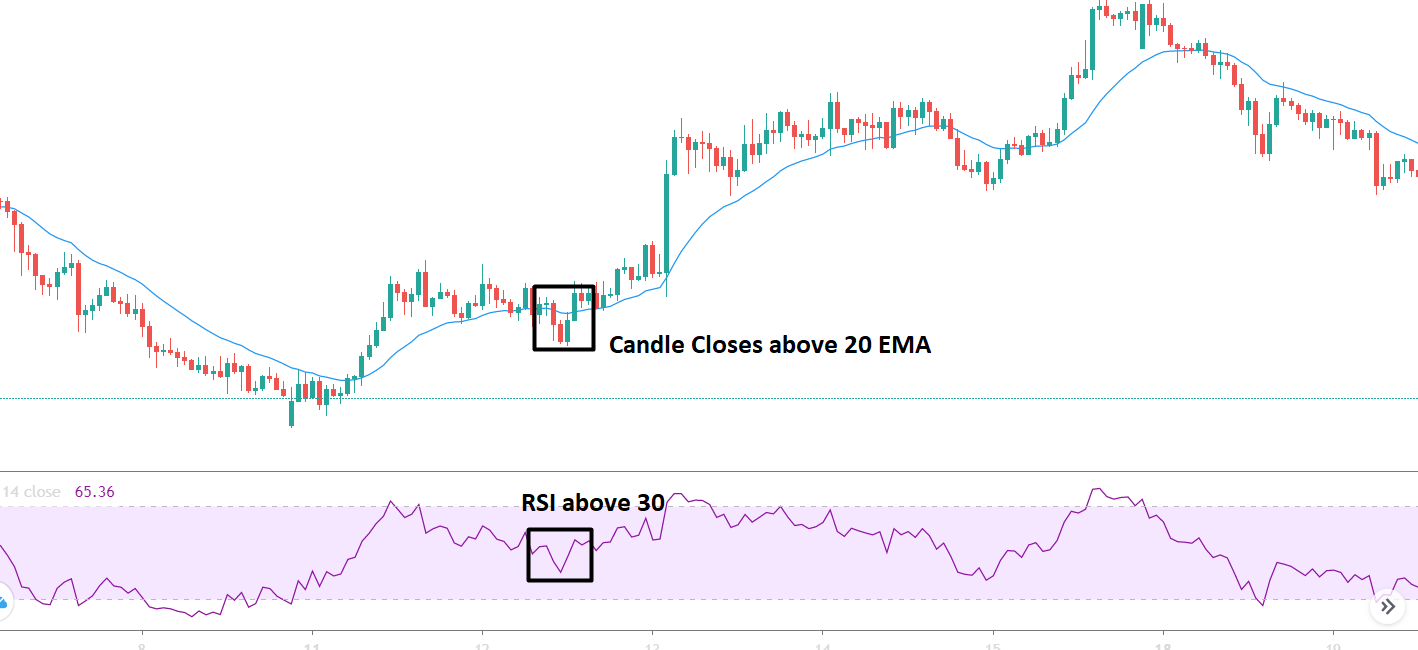
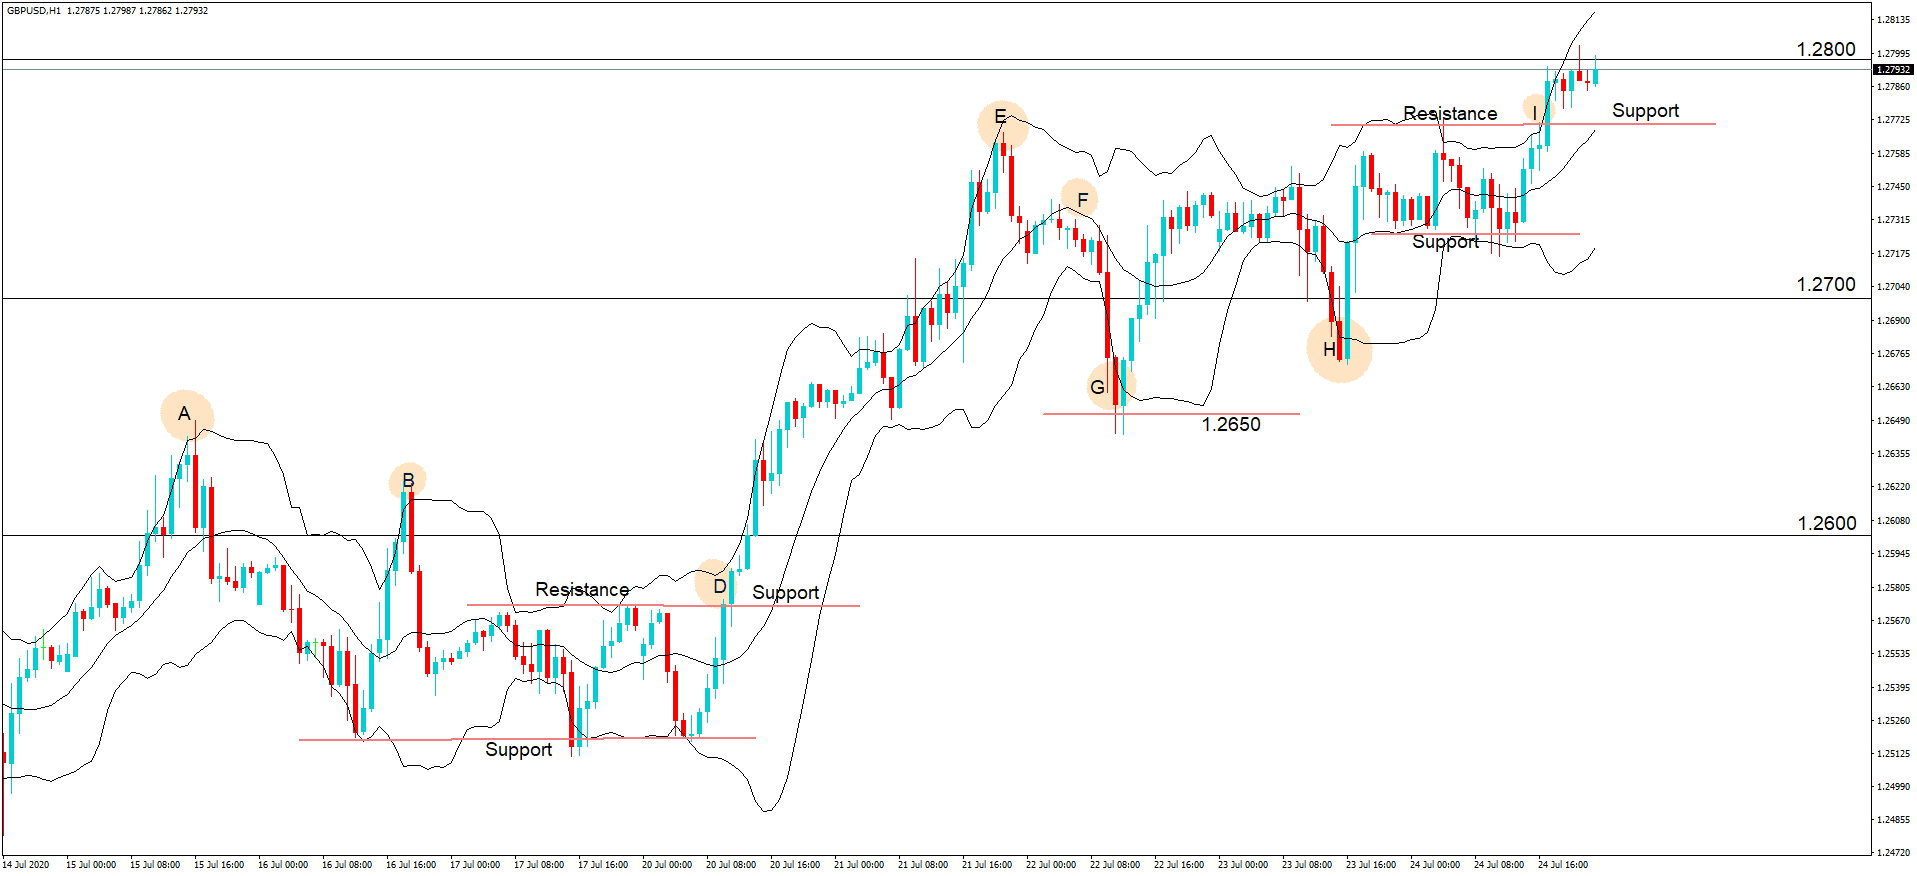
As can be seen in the chart above, we have plotted a 20-period Moving Average on a one-hour EUR/USD chart. From the chart, the pair is one a steady uptrend, represented by the candlesticks forming above the Moving Average. Before the news release at 1730GMT, the pair can be seen to be on a recovering uptrend. This uptrend can also be observed in the AUD/USD pair, as shown by the chart below.

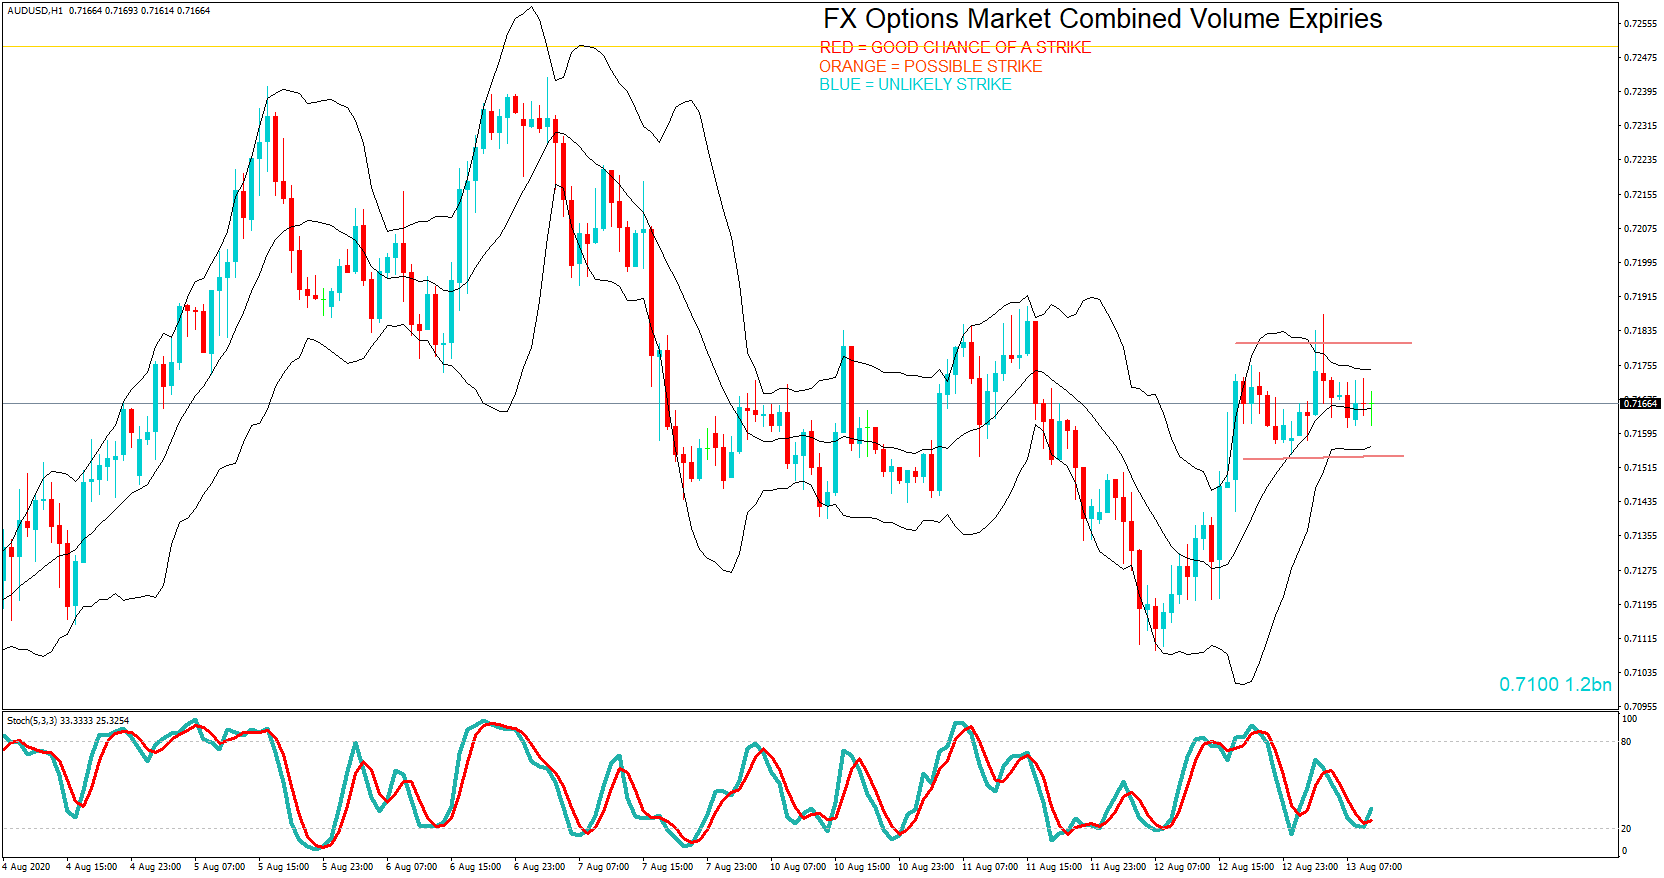
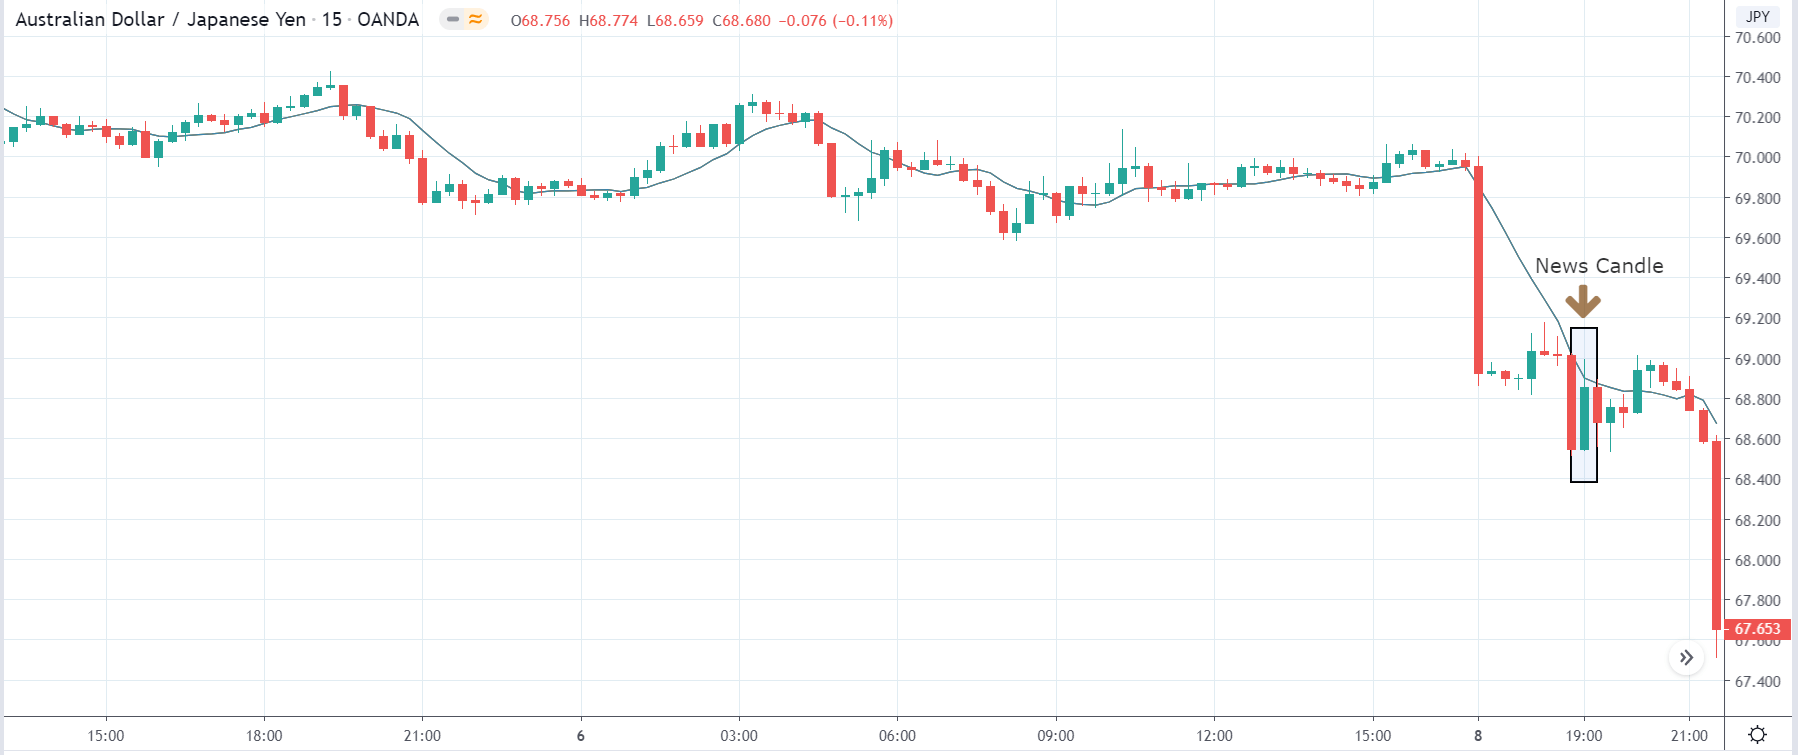
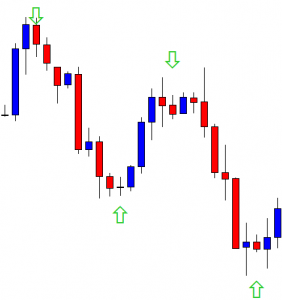
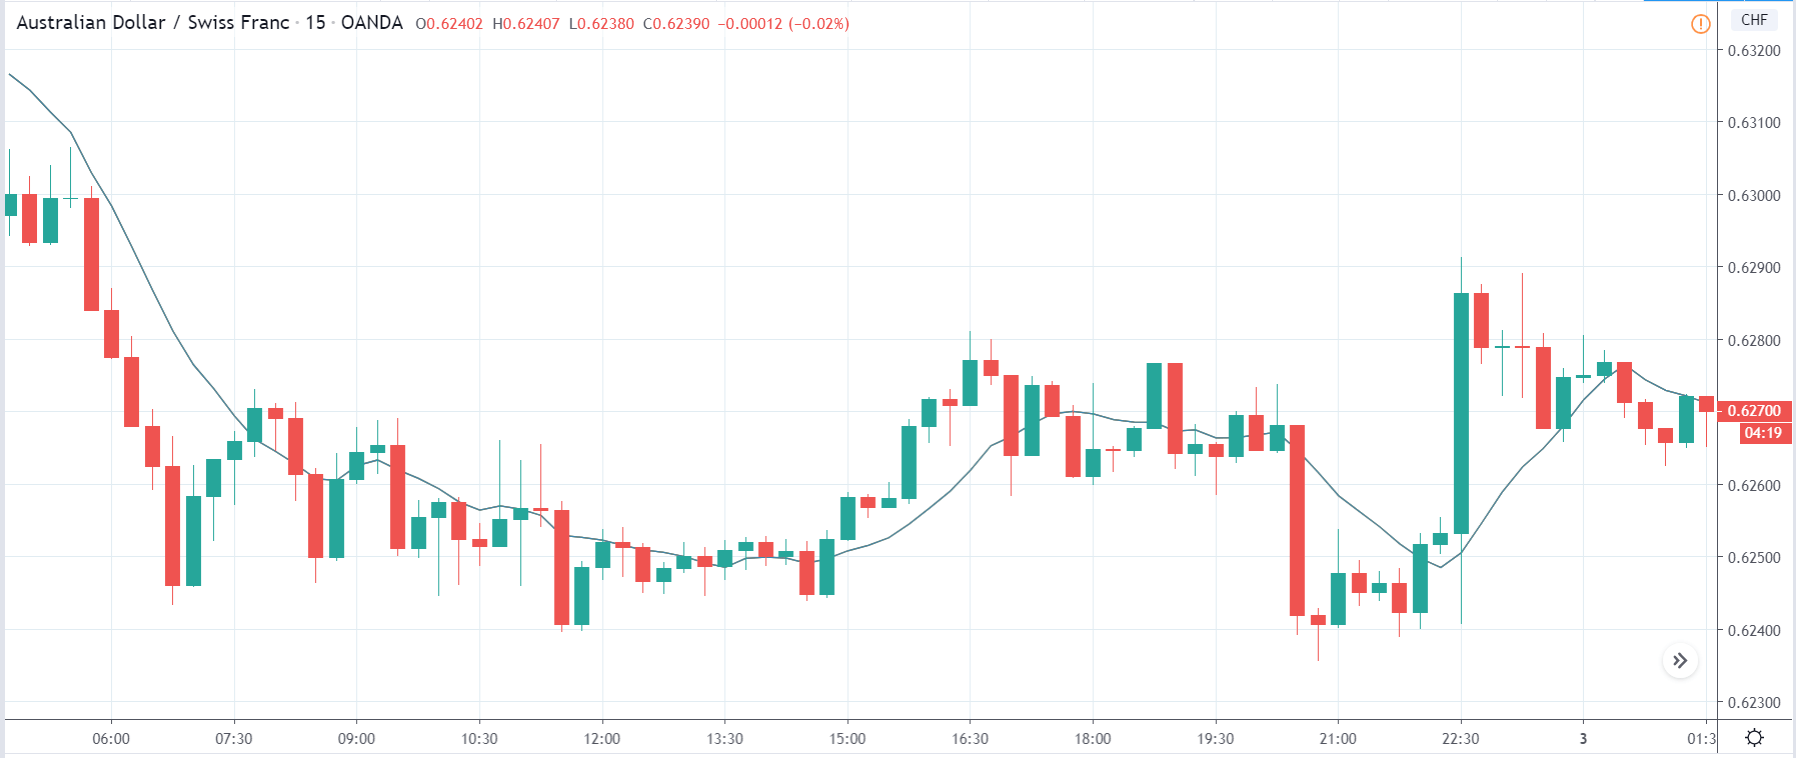
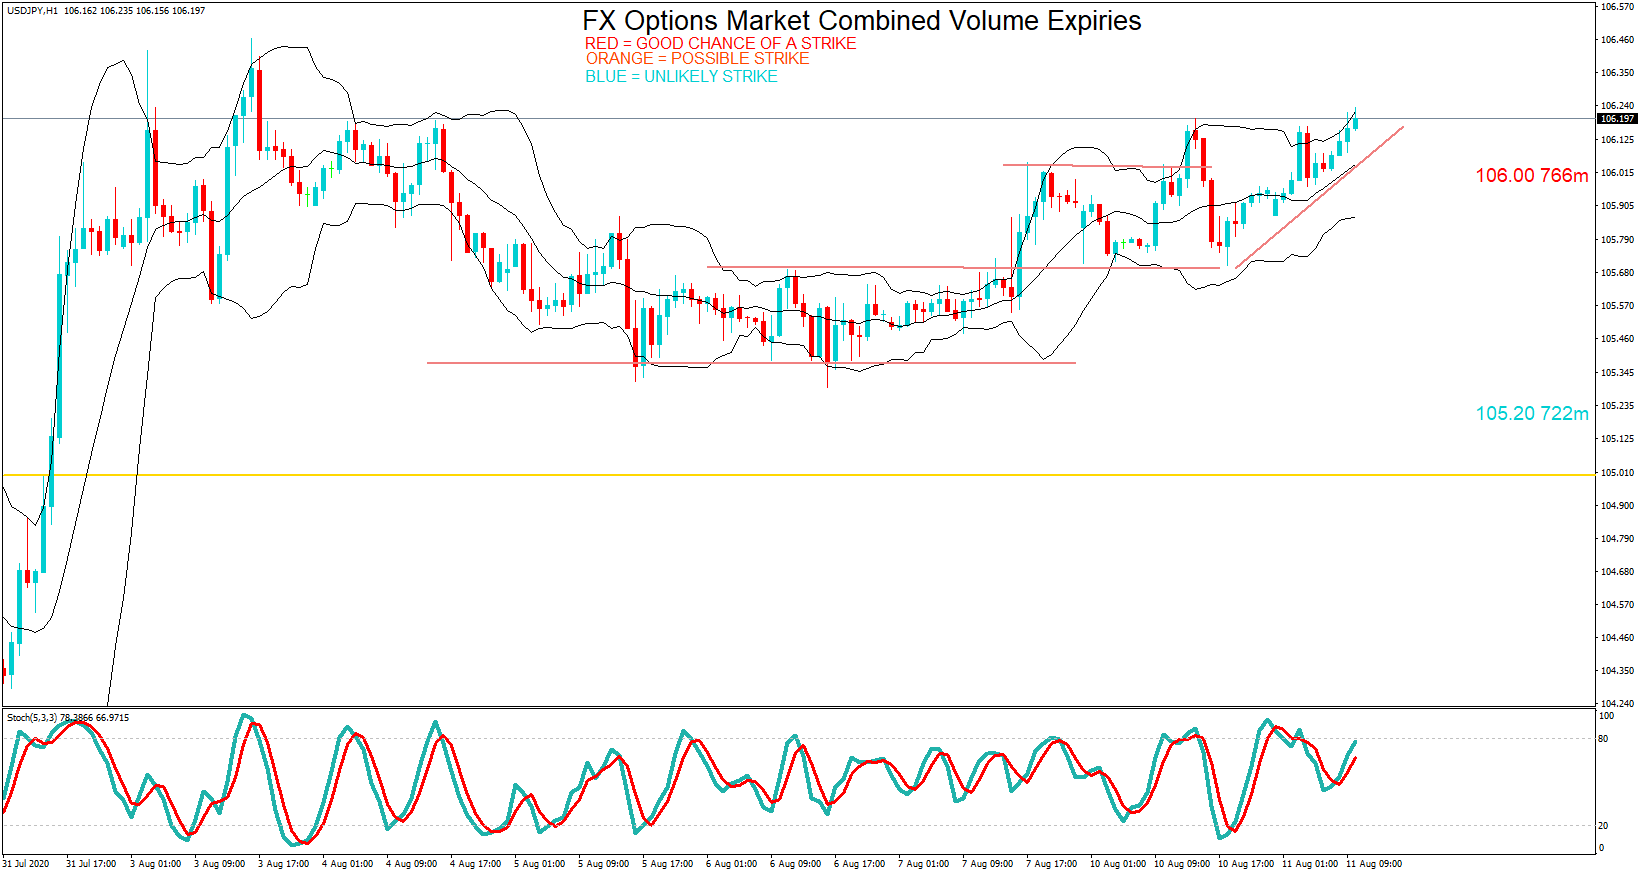
AUD/USD: Before Washington Sales tax rate release July 1, 2020

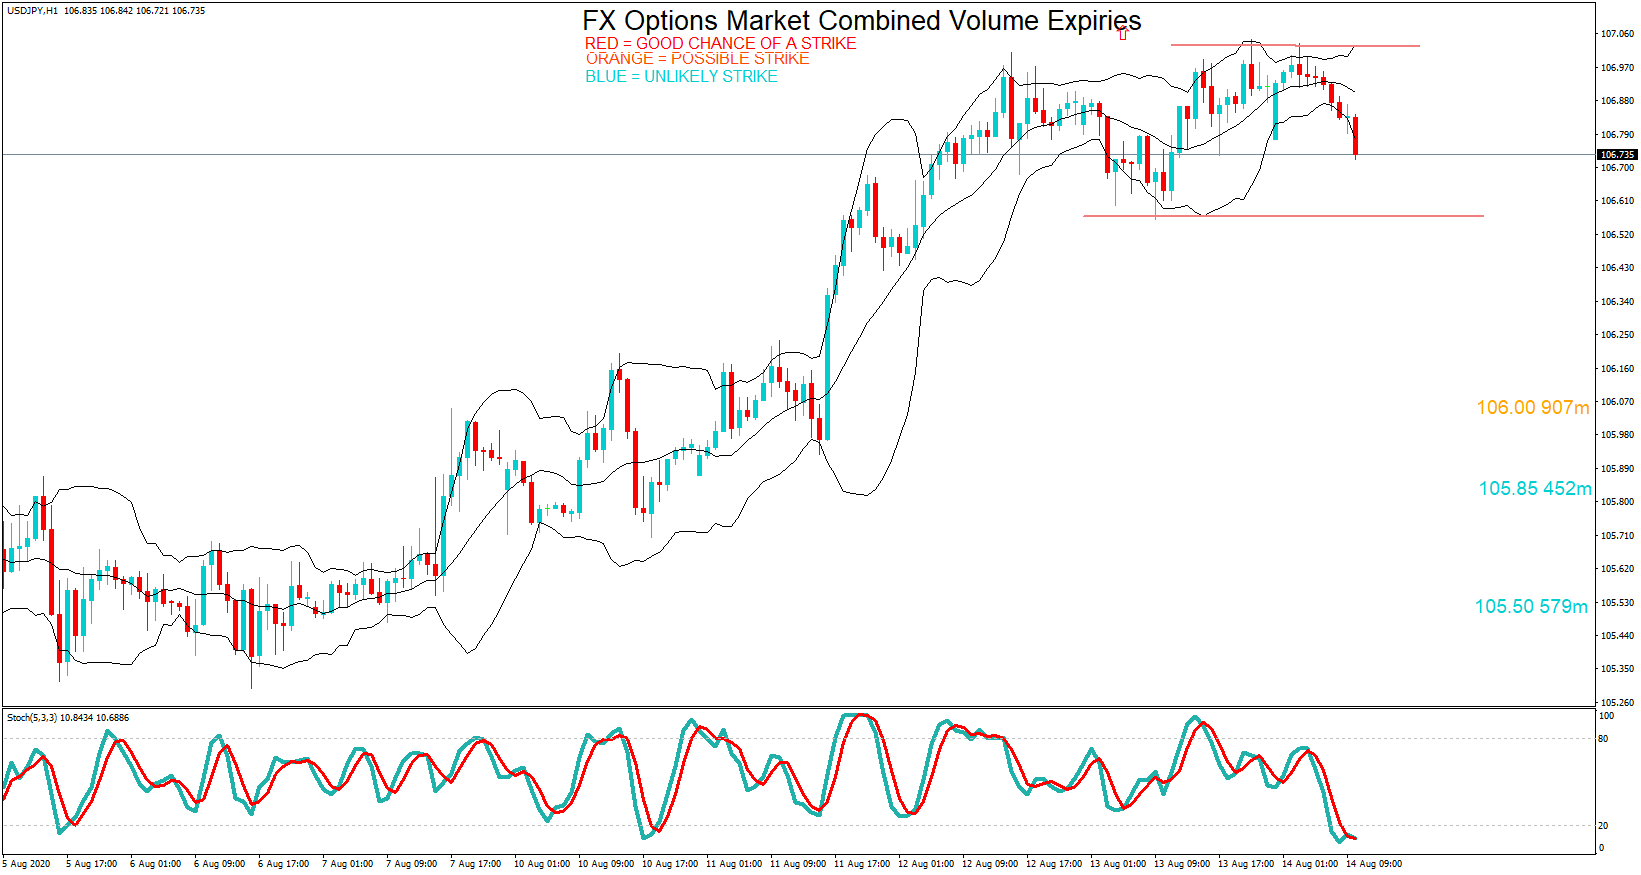
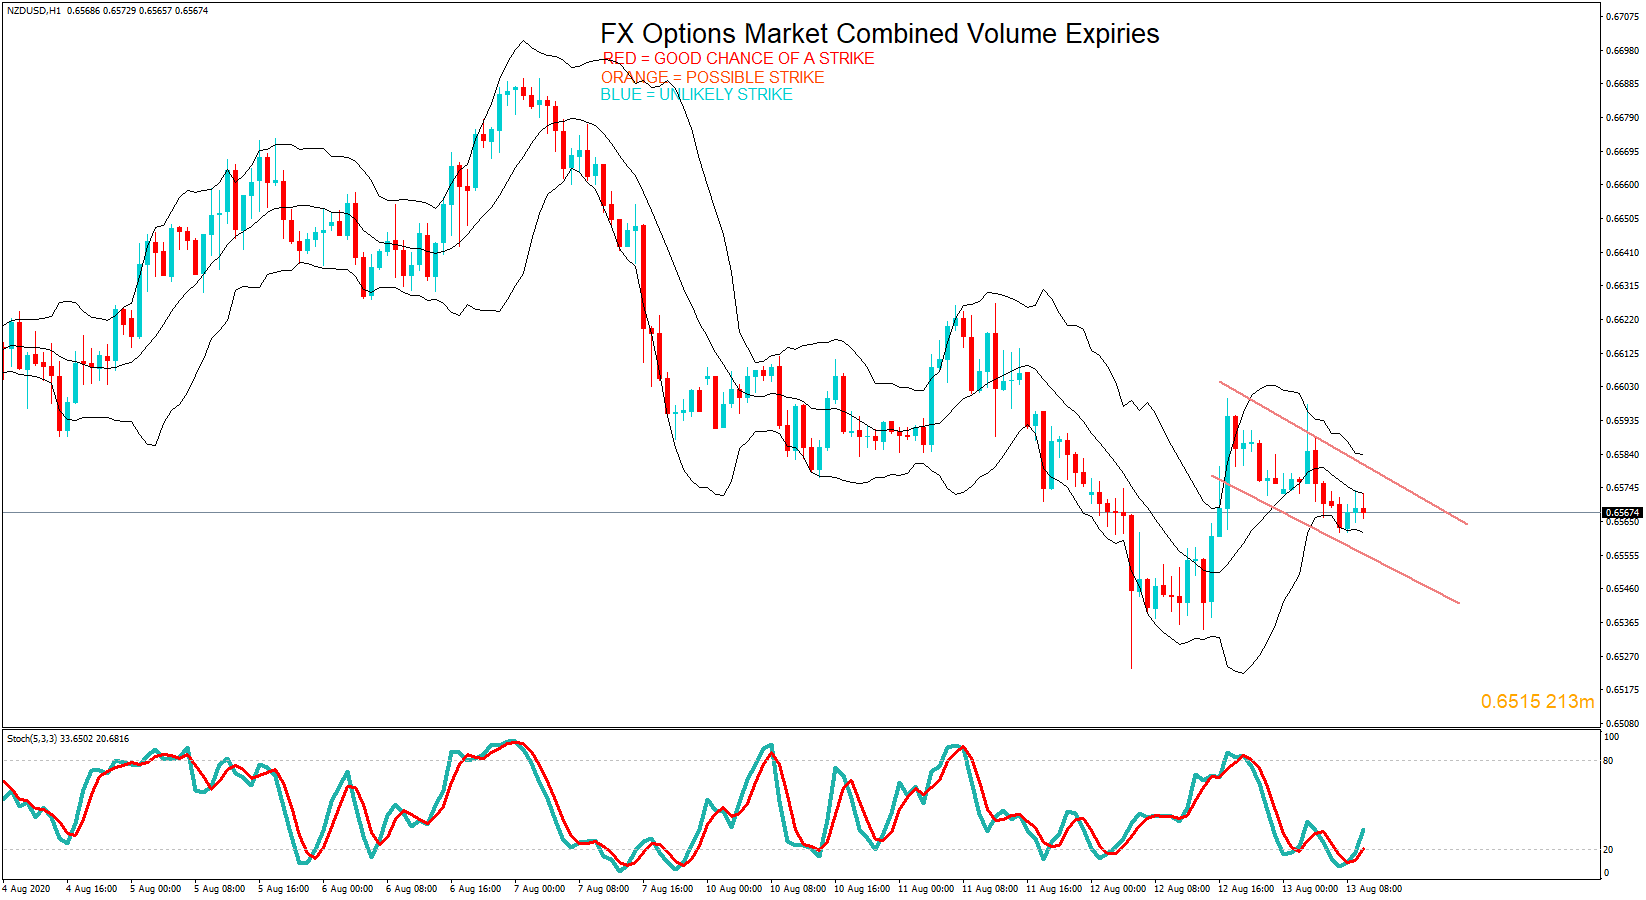
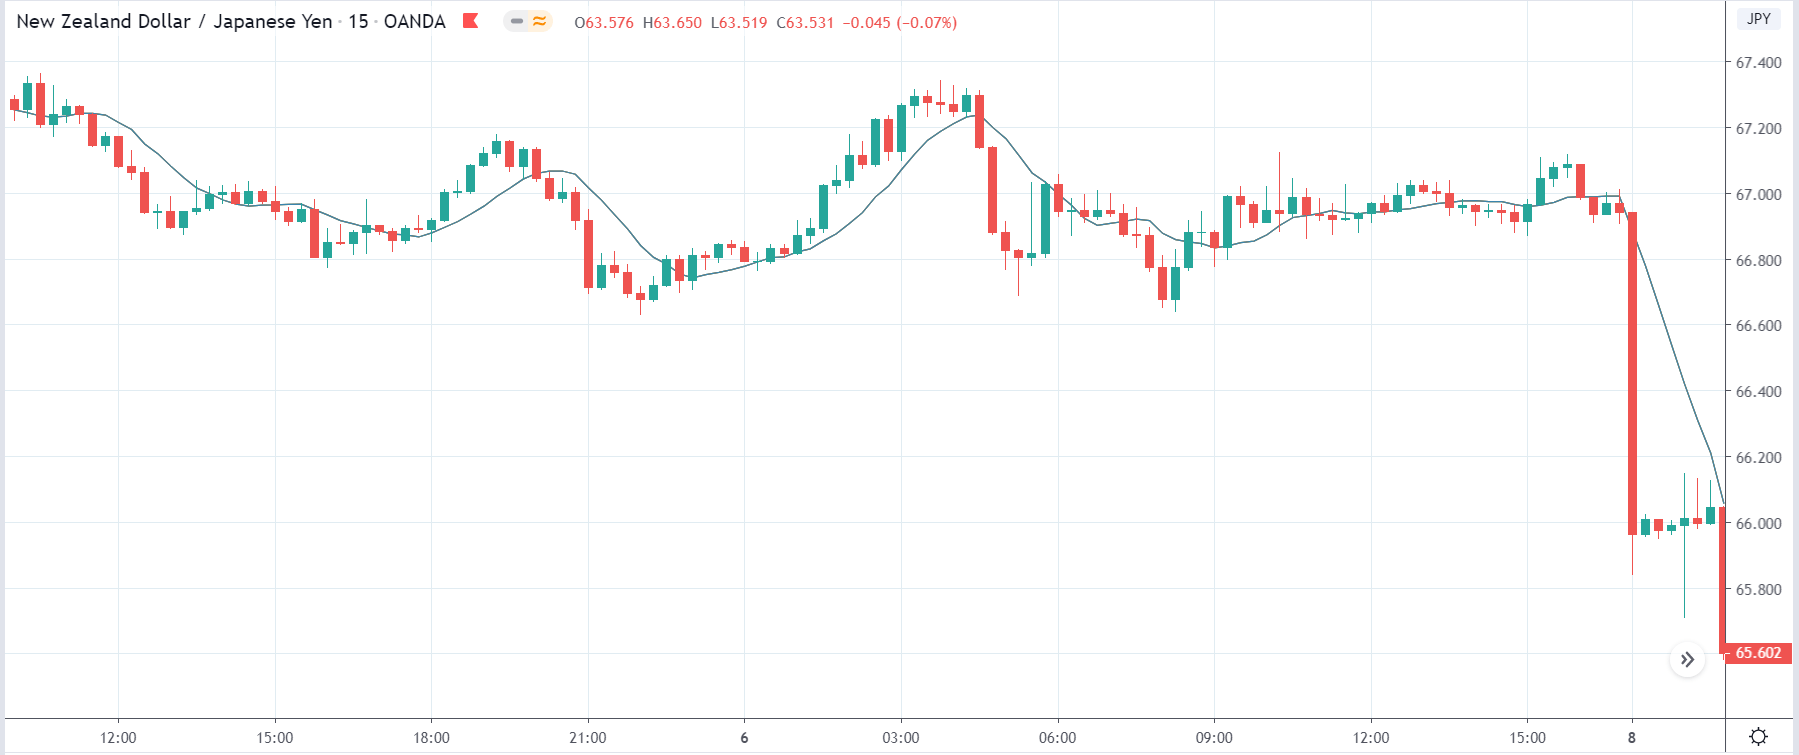
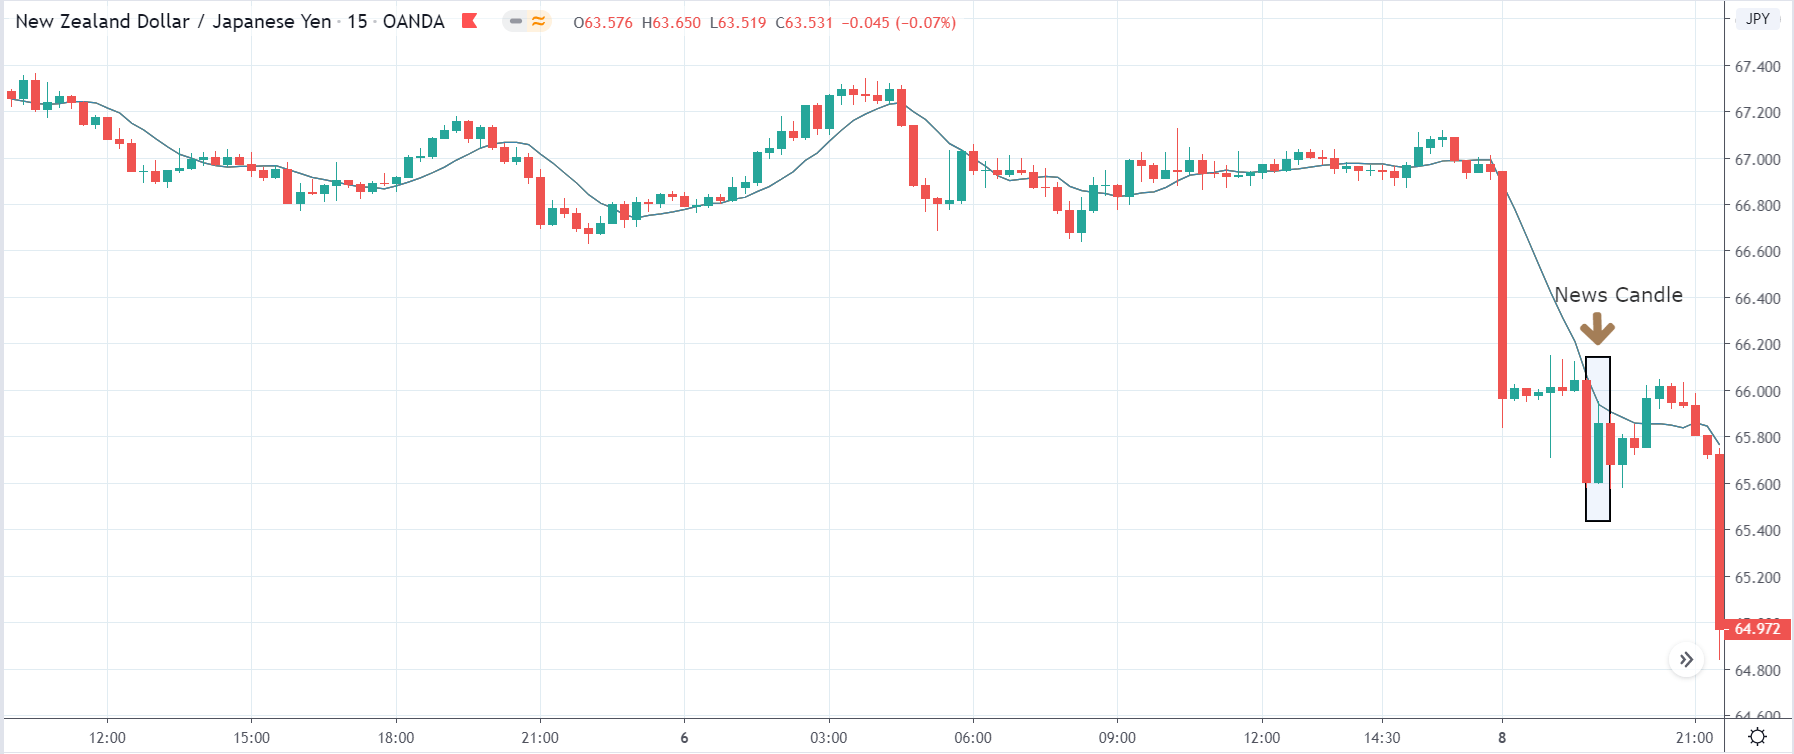
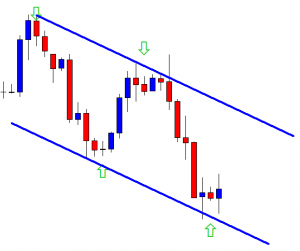
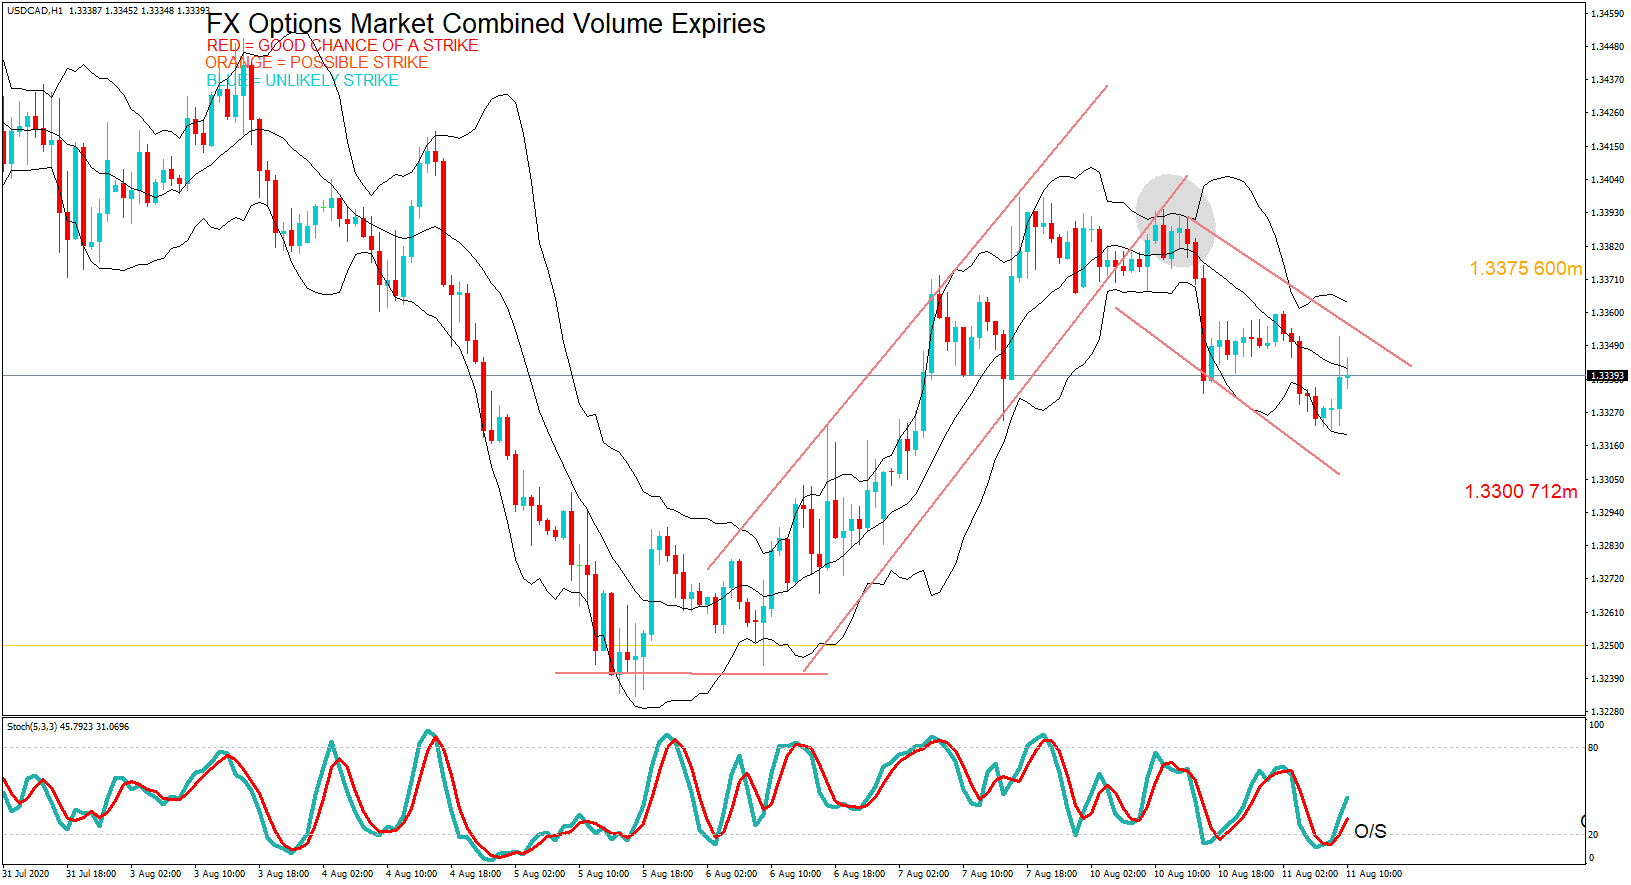
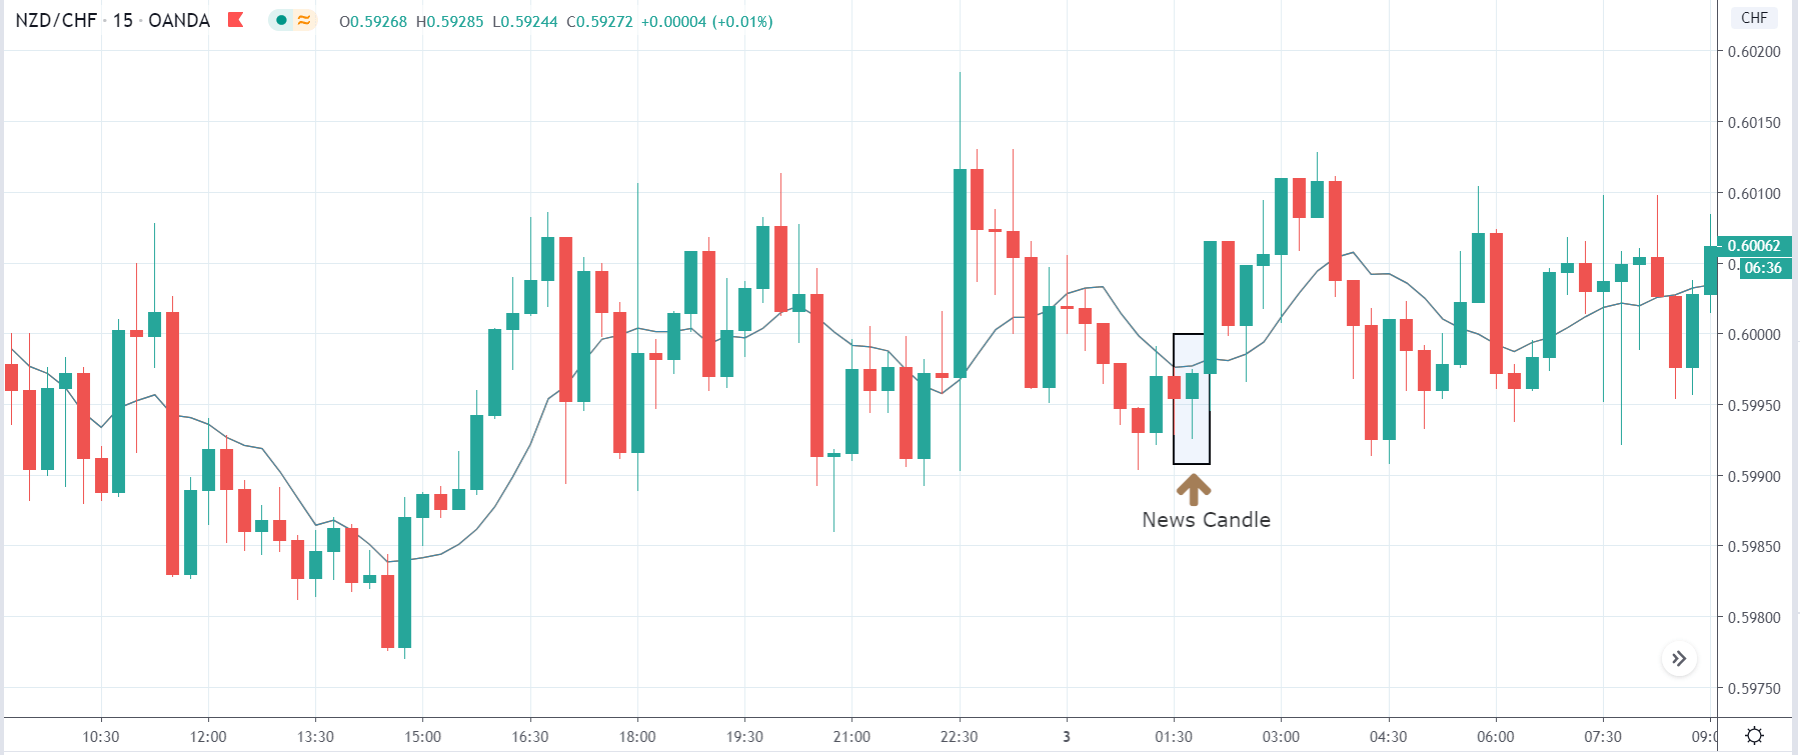
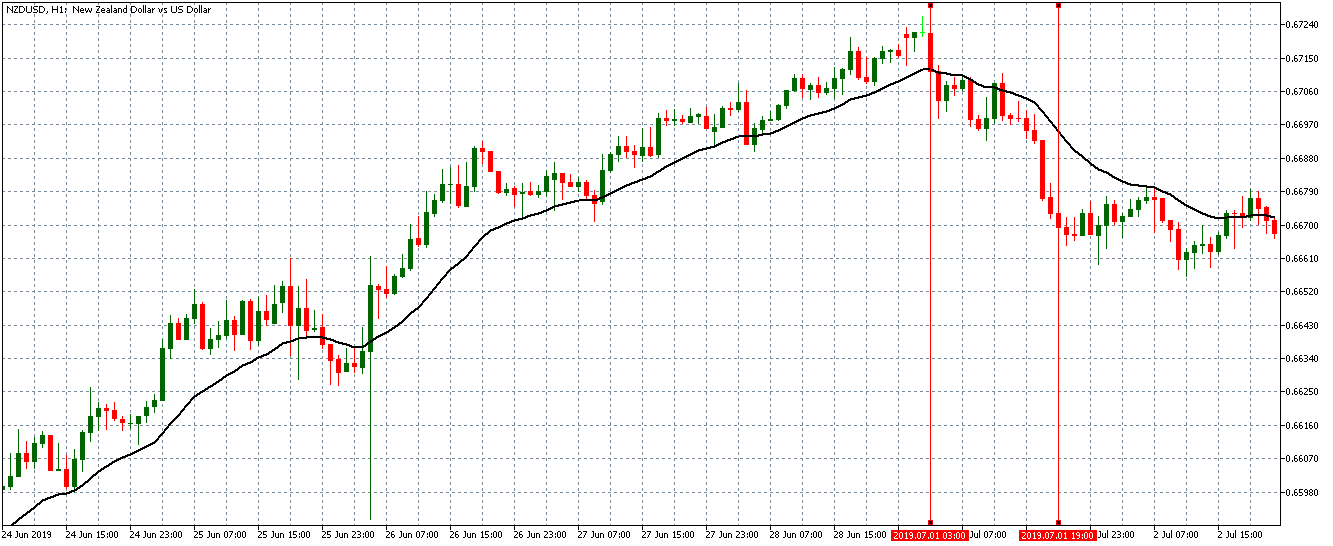
For the NZ/USD, the pair is on a steady downtrend for hours preceding the news release. This trend is shown in the chart below.

NZD/USD: Before Washington Sales tax rate release July 1, 2020

For long-term forex traders, the pattern offers an excellent opportunity to go long on the EUR/USD and AUD/USD pairs while short on NZD/USD, since the prevailing market trends would favor them. Let us now see how the price action responded to the release of the sales tax rate in Washington State.

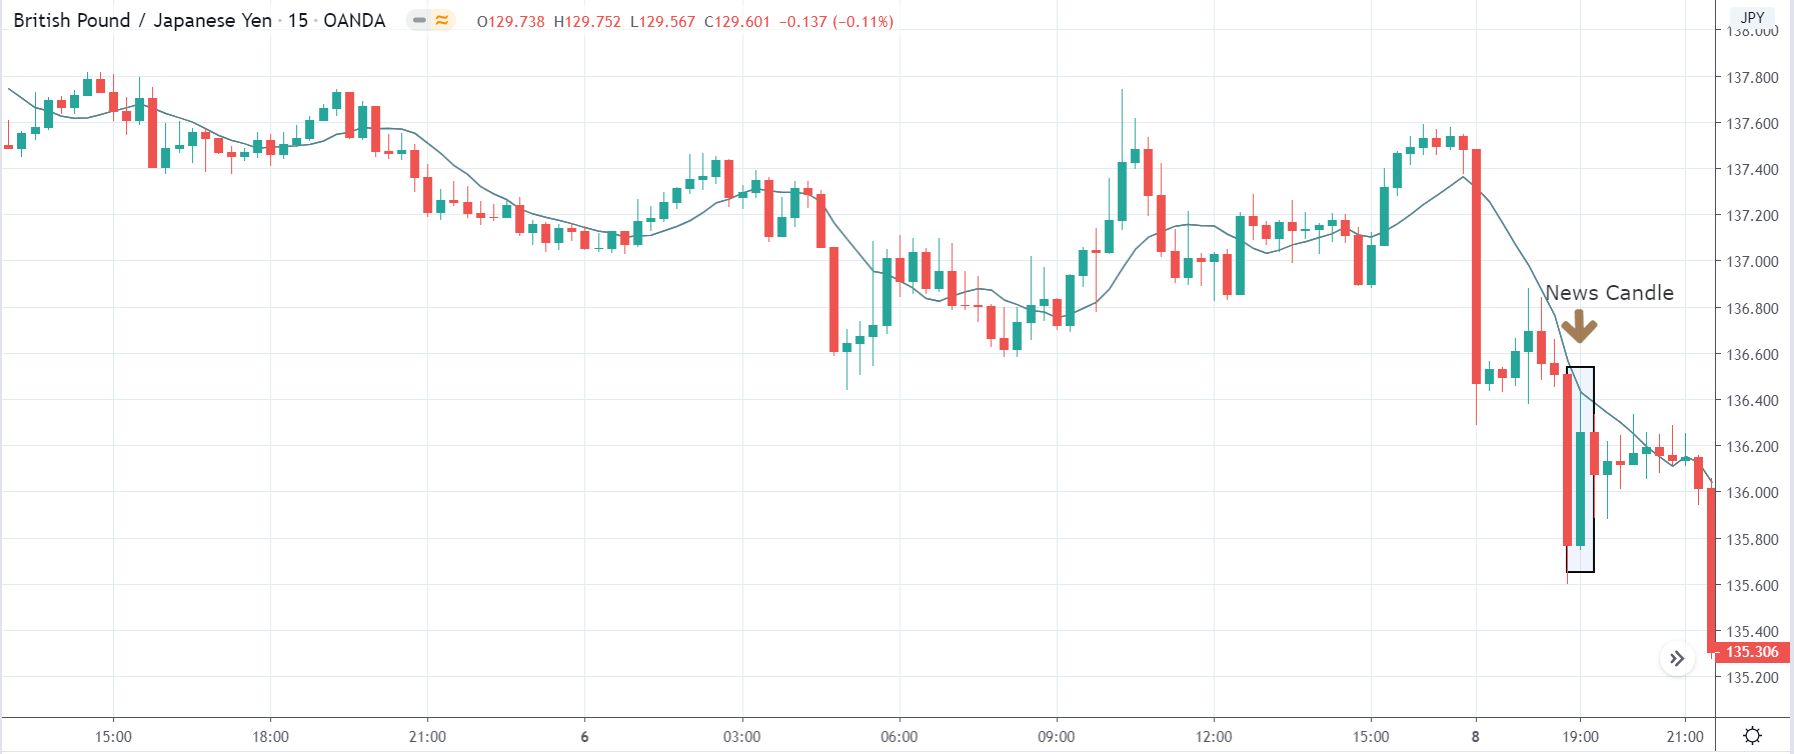
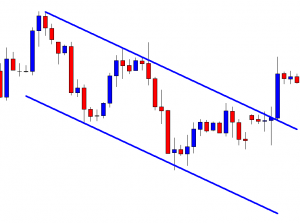
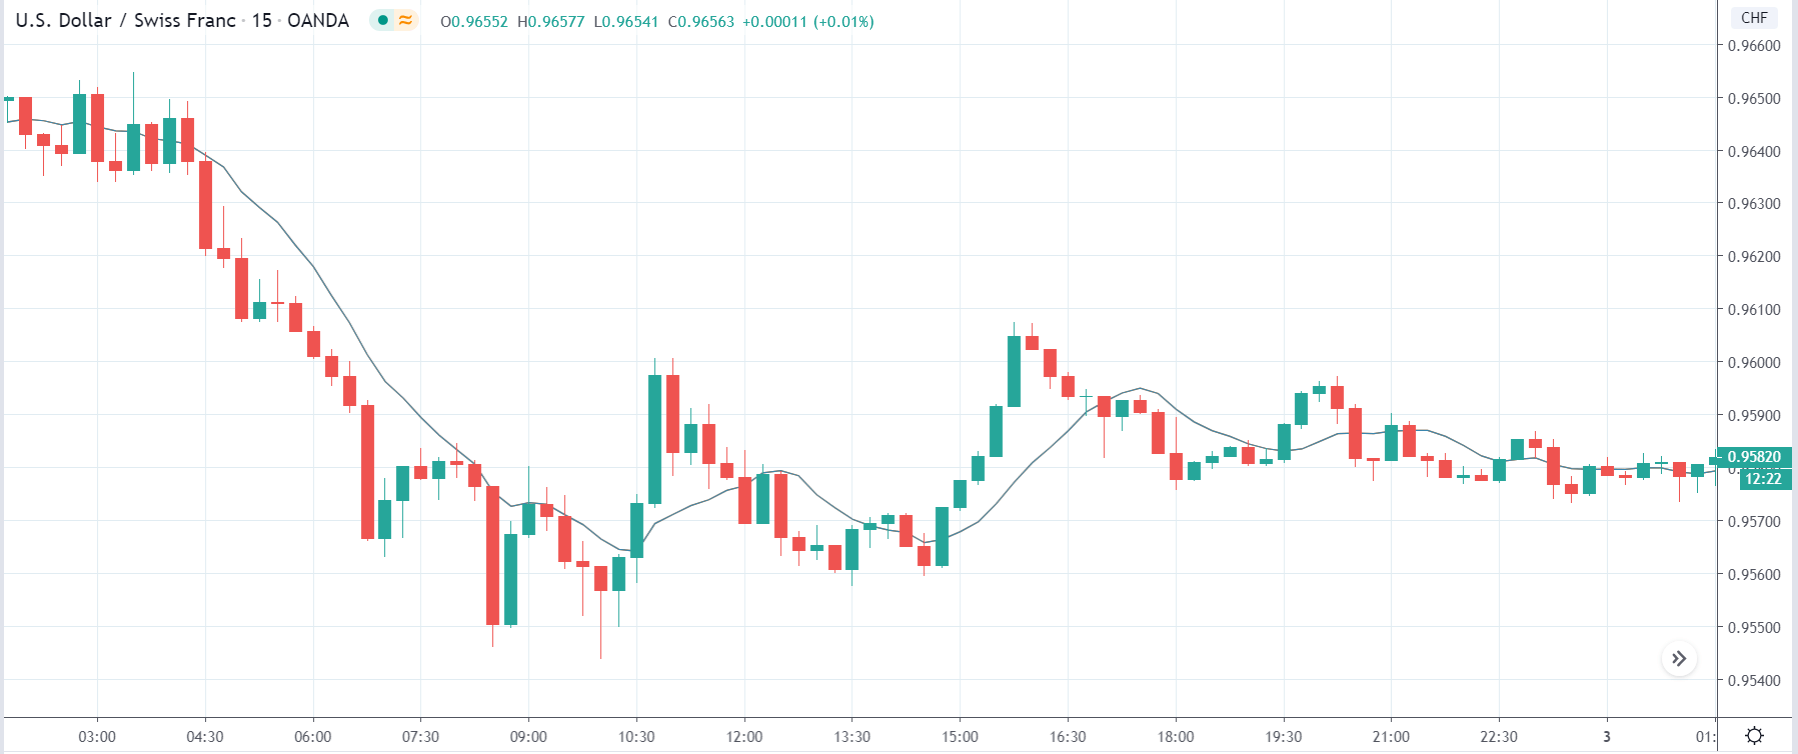
EUR/USD: After the sales tax rate release July 1, 2020

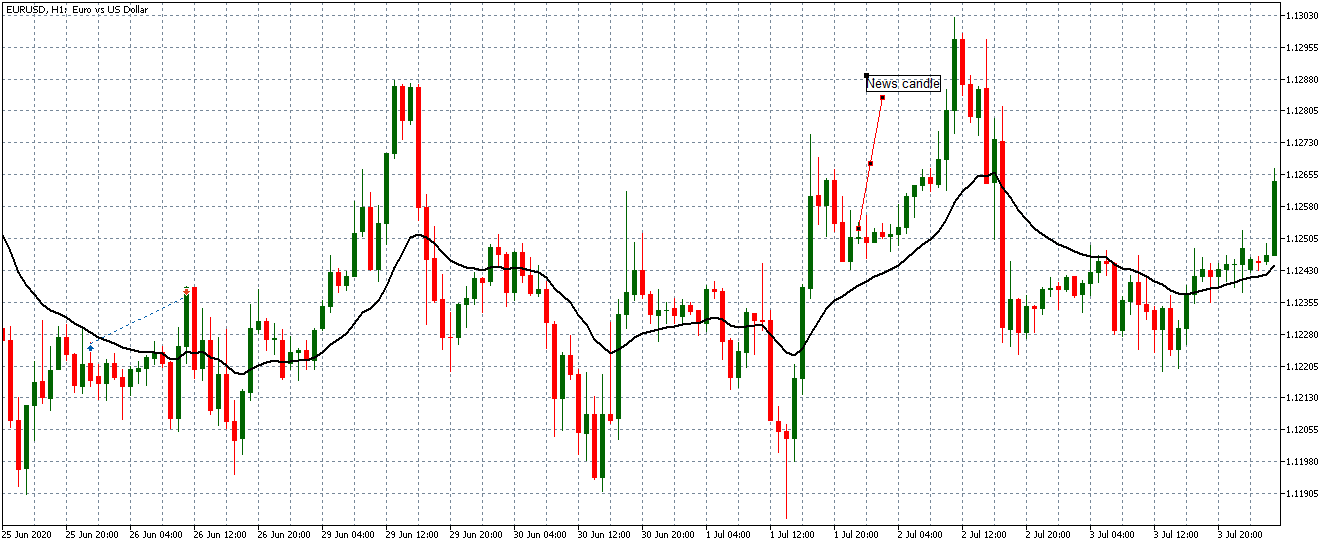
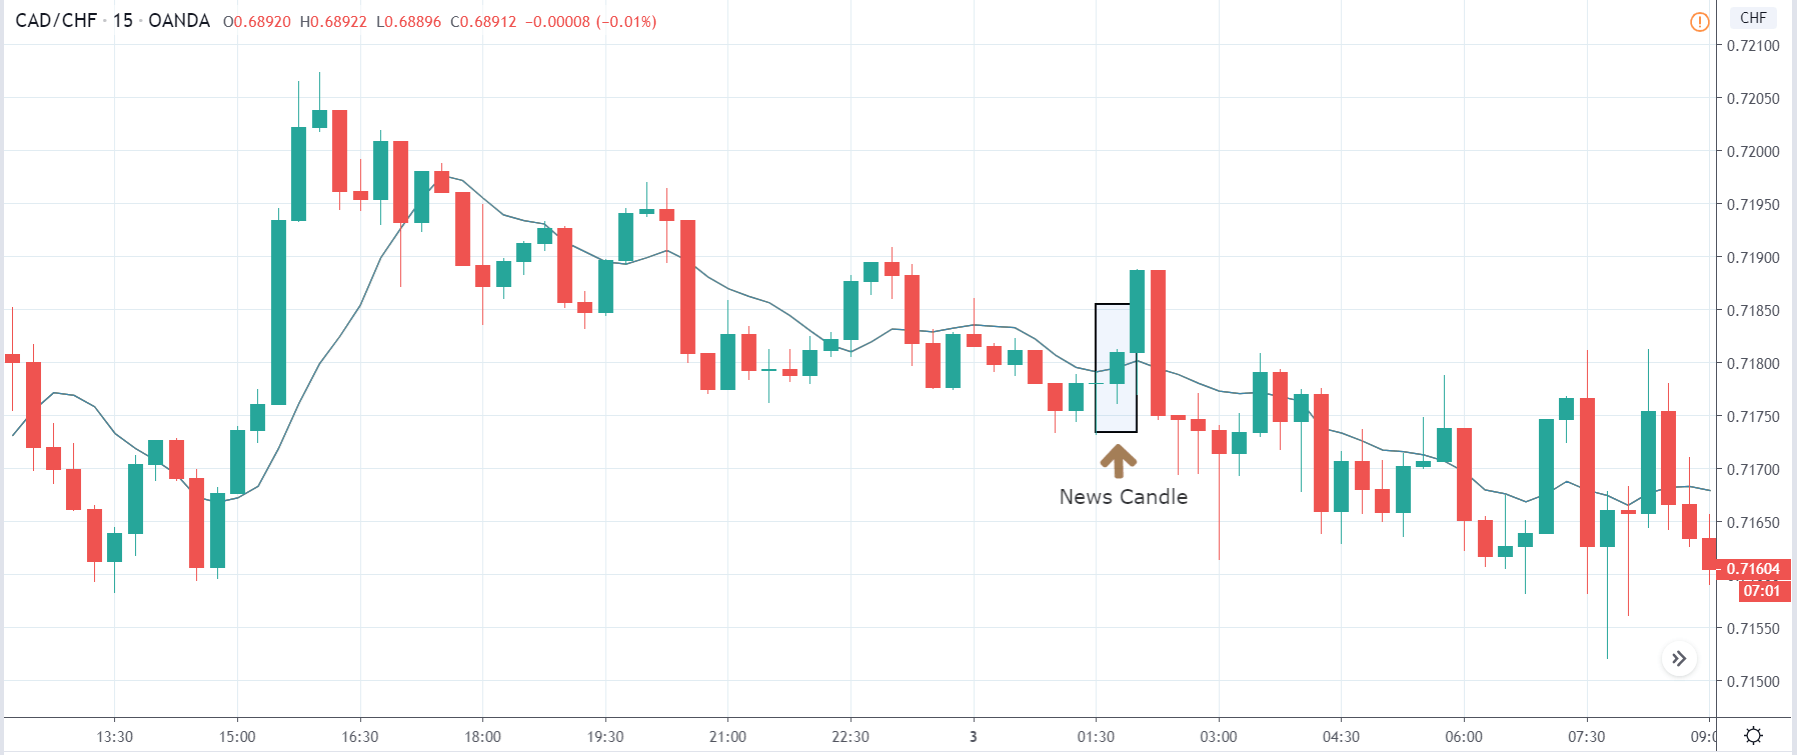
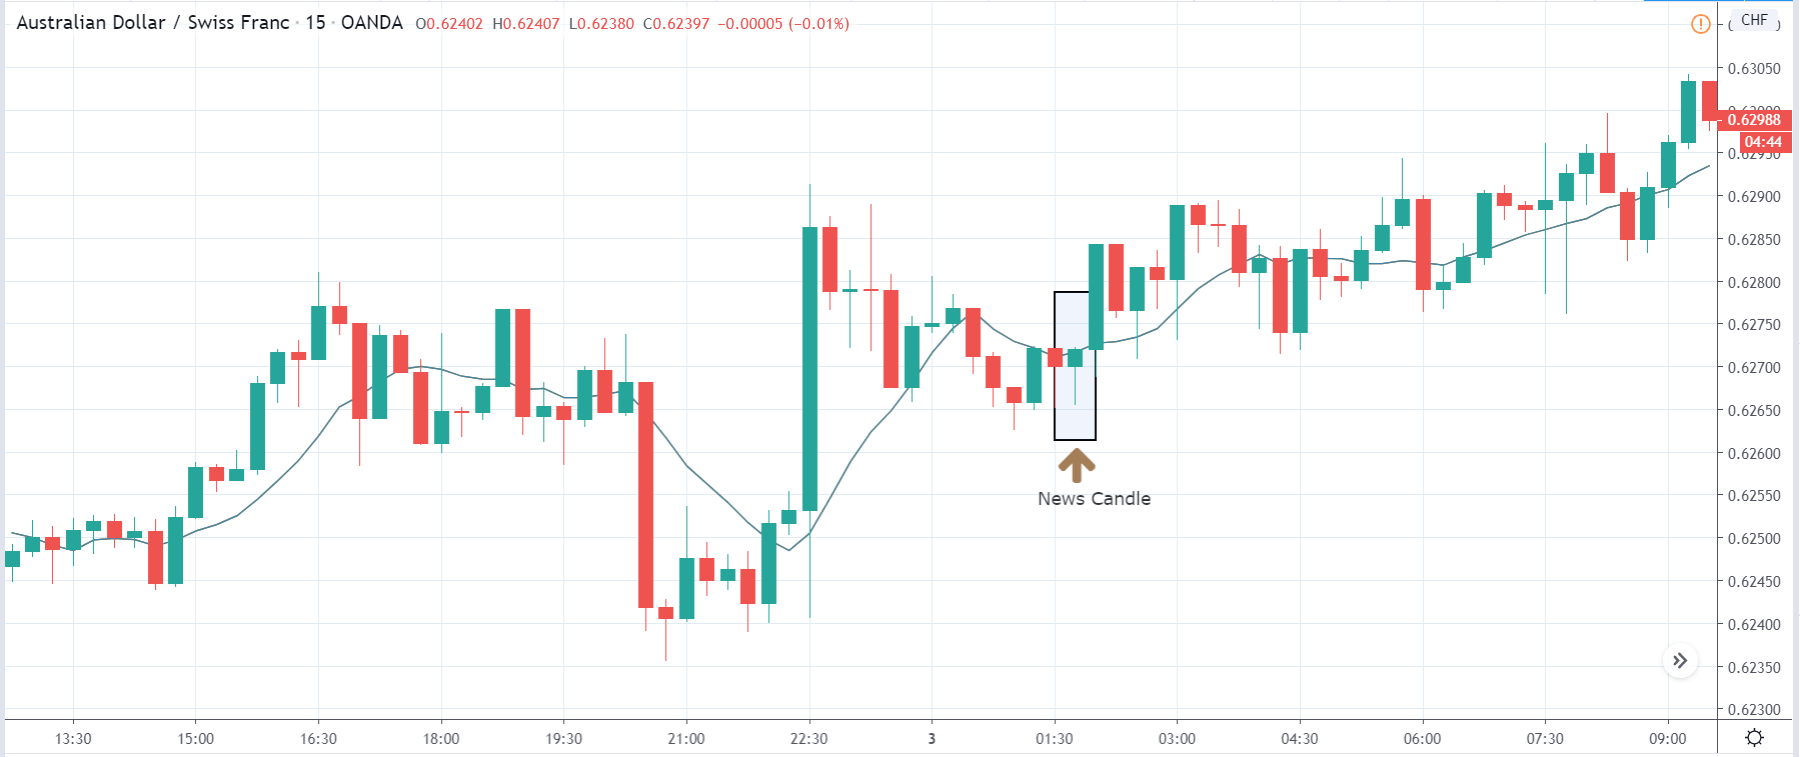
Lowering the sales tax rate should have a strengthening effect on the USD. However, as shown in the chart above, the news release of the sales tax rate had no impact on the EUR/USD since the uptrend continued with the same magnitude as before. The same trend can be observed on the AUD/USD and NZD/USD pairs since the previous trends were no reversed. This trend is shown in the charts below.

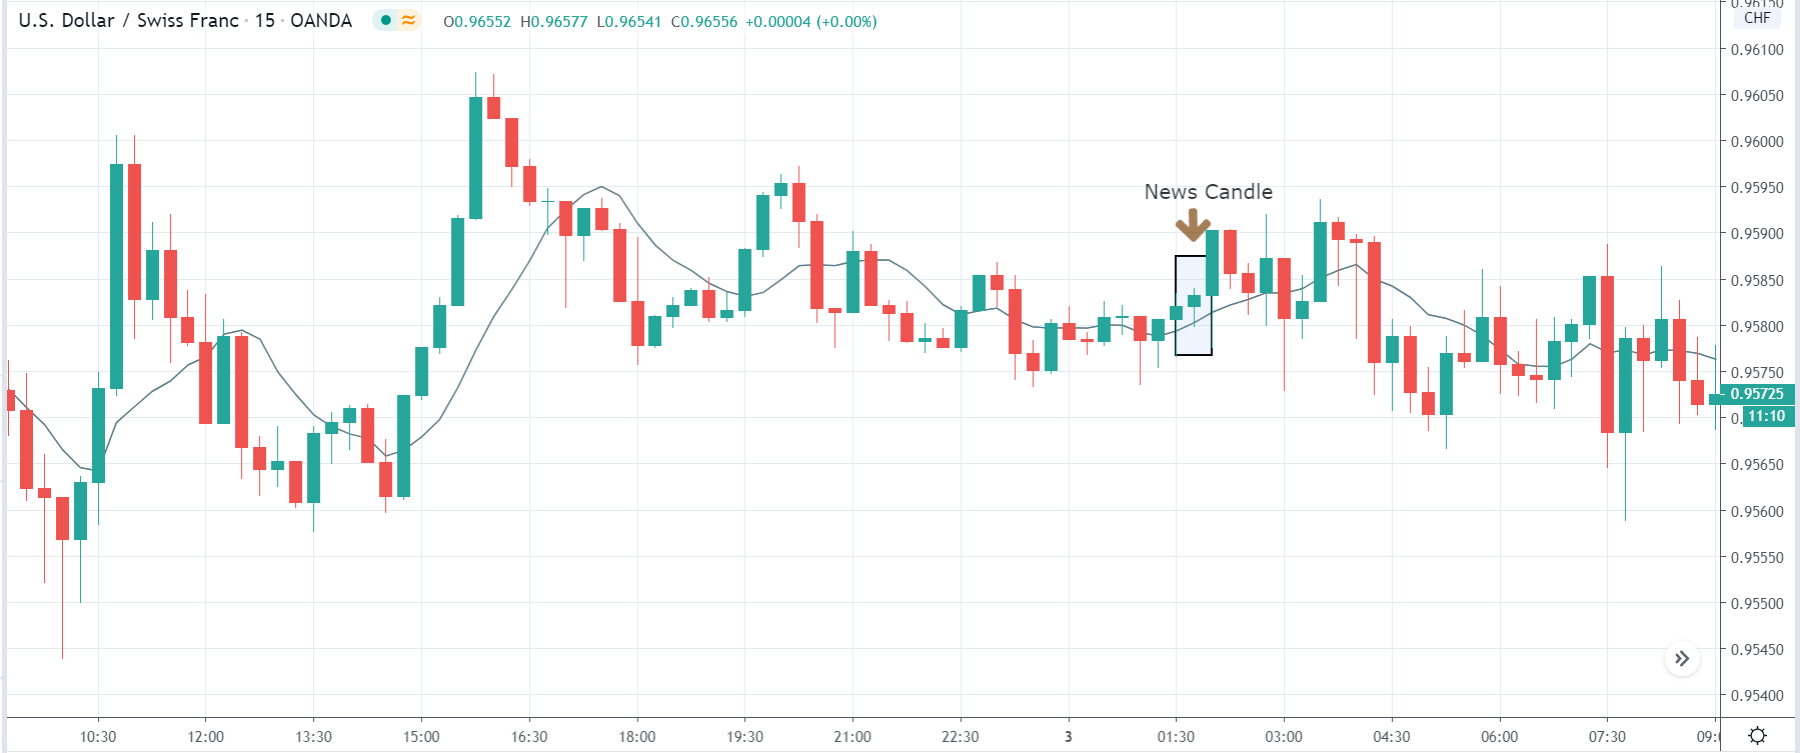
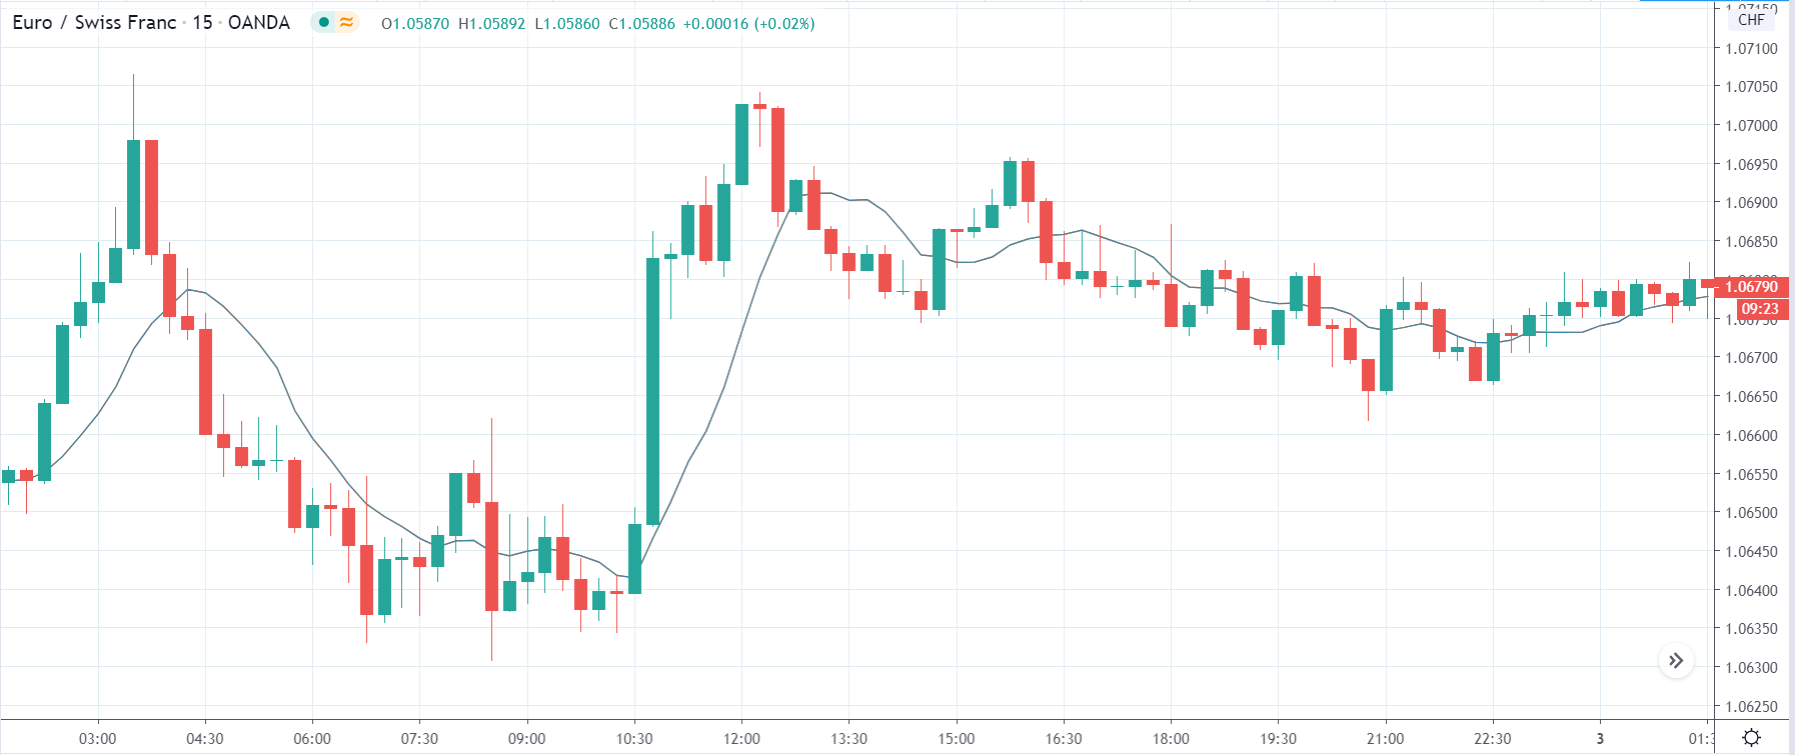
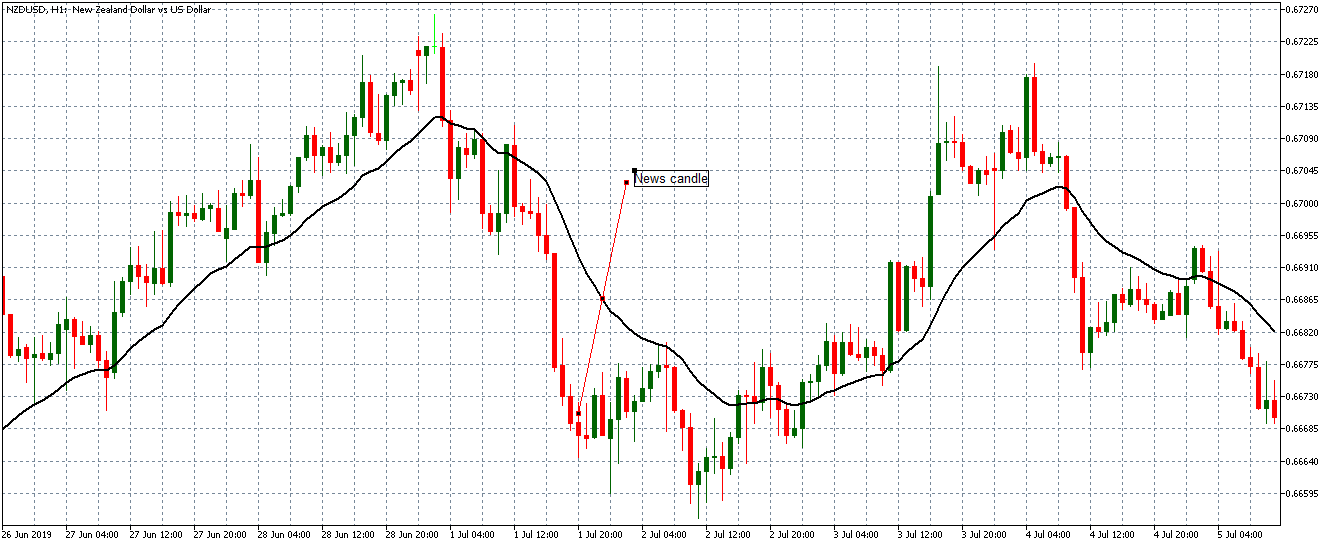
NZD/USD: After the sales tax rate release July 1, 2020

AUD/USD: After the sales tax rate release July 1, 2020

It is evident from the after-news charts that the release of the sales tax rate does not have any impact on the price action. Although it is has a significant impact on the GDP, it is a low-level economic indicator in the forex market. Cheers!

Categories
Forex Market Analysis

Daily F.X. Analysis, August 17 – Top Trade Setups In Forex – Eyes Technical Levels! 

On the news front, the market isn’t offering any high impact on market-moving fundamentals. Therefore, we have to focus on the market’s technical side to drive further movements in the market.

Economic Events to Watch Today   


EUR/USD – Daily Analysis

The EUR/USD pair closed at 1.18409 after placing a high of 1.18503 and a low of 1.17815. Overall the movement of the EUR/USD pair remained bullish throughout the day. The EUR/USD pair on Friday remained in a tight range in European trading hours after the release of GDP figure from the Eurozone, and in American trading session, it started to post gains and ended its day on a positive note.

At 11:45 GMT, the French Final CPI in July remained flat with the expectations of 0.4%. At 14:00 GMT, the Flash Employment Change in the second quarter was recorded as -2.8%, and the Flash GDP in the second quarter fell as expected -12.1%. The Trade Balance from Europe in June declined to 17.1B from the forecasted 18.0 B and weighed on single currency Euro.

The GDP data confirmed the fears and dropped by 12.1% showed the biggest contraction since the quarterly GDP calculation began in 1970 for Germany. It was even more pronounced than during the financial market and economic crisis. The macroeconomic data from Europe weighed on EUR and dragged the pair EUR/USD with itself.

The U.S. Dollar held steady against its rival currency as positive risk sentiment continues to weigh on the safe-haven greenback. The Core Retail Sales in July increased to 1.9% from the forecasted 1.3% and supported the U.S. dollar. At the same time, the Retail Sales data declined to 1.2% against the expected 2.0% and weighed on the U.S. dollar.

In August, the Prelim UoM Consumer Sentiment increased to 72.8 against the forecasted 72.0 and supported the U.S. dollar. The data failed to provide any significant trend to the pair, however as the consumer sentiment improved, the U.S. dollar started to pick up its pace against its rival currencies.

Meanwhile, the delay in the release of the next U.S. Stimulus aid package was getting longer day by day. It raised concerns as President Donald Trump accused that U.S. Congressional Democrats had refused to negotiate on the next bill. The pair was also higher on Friday as the risk sentiment improved ahead of the US-China trade deal review meeting scheduled for August 15.

Furthermore, the U.S. Dollar was higher on the ground as the 10-year U.S. Treasury rose continuously from past days. At the same time, the Euro was under pressure because of the massive selling bias in Turkish lira from recent weeks. The Euro underperformed during the lira crisis in 2018, and downside risks suggest that Euro might face sell-off if history was repeated.

The upcoming week will bring the minutes from both the U.S. Federal Reserve and the European Central Bank. Meanwhile, the pair will continue to follow the global risk sentiment; any progress in trade-deal will be beneficial for EUR/USD pair; however, if any tension arises and the US-China issue continues to escalate, the greenback could rise against its counterpart as a safe-haven asset.

Daily Technical Levels

Support Pivot Resistance
1.1745 1.1805 1.1900
1.1650 1.1960
1.1591 1.2054

EUR/USD– Trading Tip

The EUR/USD is facing resistance at 1.1865 level, which is extended by a double top level. Below this, the EUR/USD can extend selling bias until 1.1820 and 1.1782 level. However, the bullish breakout of the 1.1865 level can continue selling until 1.1908. On the hourly timeframe, the EUR/USD has formed an ascending triangle pattern, which may extend resistance at 1.1866 level. The closing of candles beneath this level is expected to drive selling bias until the 1.1819 level. Let’s keep an eye on 1.1866 level to stay bullish above and bearish below this level today. 


GBP/USD – Daily Analysis

The GBP/USD closed at 1.30824 after placing a high of 1.31426 and a low of 1.30452. Overall the movement of GBP/USD pair remained bullish throughout the day. The GBP/USD pair struggled to hold gains as both the U.S. dollar and Sterling has gloomy outlook. Both the U.S. & U.K. economies have suffered from the coronavirus pandemic, and the outlook of GBP/USD pair suggests that it was dominated by the pandemic induced gloomy economic condition.

This week, the GBP/USD pair has jumped between highs of 1.32123 and lows of 1.3007. The high was not too far from the previous week’s high of 1.3176, that was the best level for the GBP/USD pair in six months.

We can say that the GBP/USD pair has managed to sustain the impressive July gains; however, further gains seem unlikely. As the negotiations between the U.K. and Japan came to a halt this week. This came in after U.K. pretended to have better trade conditions than those it had as part of the E.U. Another factor weighed on U.K. currency this week was the biggest contraction in the U.K.’s economy in the second quarter by 20.4%.

The contraction was derived as a terrible consequence of the coronavirus induced lockdown measures. The U.K. government is still struggling with the reopening schedule, and PM Boris Johnson has pledged to open schools from next month.

As worries of the second loop of coronavirus worsened across the globe, the concerns raised over the question of how the government would react. There are speculations that if Britain’s coronavirus situation does not improve, the whole nation could see continuous lockdown.

On Brexit front, although both countries E.U. and the U.K. remain far apart on several crucial issues, Britain’s chief negotiator David Frost said on Thursday that a Brexit deal could be reached in September.

The next round of the talks between both countries will take place on August 18, and comments from both sides suggested that they remain committed to reaching a deal. This has been supportive of Sterling, and hence GBP/USD raised.

Meanwhile, on the data front, there was no data to be released from Great Britain, and as for the U.S., the Retail Sales dropped to 1.2% from the expected 2.0% in July and weighed on the U.S. dollar.

The Core Retail Sales, however, improved to 1.9% in July against the anticipated 1.3% and supported the U.S. dollar. The Prelim UoM Consumer Sentiment also raised to 72.8 points against the expected 72 and supported the U.S. dollar that kept the gains in GBP/USD pair limited on Friday. The risk sentiment also supported the GBP/USD pair on Friday as the traders were cautious ahead of the US-China trade deal review meeting scheduled to be released on August 15.

Daily Technical Levels

Support Pivot Resistance
1.3010 1.3077 1.3150
1.2938 1.3216
1.2871 1.3289

GBP/USD– Trading Tip

The GBP/USD is trading at 1.3106 level, holding above the 50 periods EMA support level 1.3080. The bearish breakout of the 1.3080 support level can extend selling unto 1.3019 level. The upward channel also supports the GBPUSD at 1.3080, which provides resistance at 1.3134 level. The GBP/USD should confer a bearish crossover of 1.3082 level confirm a strong selling bias in the Cable until then; we should wait and watch. On the higher side, Sterling may find resistance at 1.3175 and 1.3224. Let’s consider selling below 1.3080 and buying over the same with minor stop loss. 


USD/JPY – Daily Analysis

The USD/JPY pair was closed at 106.573 after placing a high of 107.036 and a low of 106.433. Overall the movement of the USD/JPY pair remained bearish throughout the day. The U.S. Congress has failed to boost the economy and health care system, and it caused the U.S. President Donald Trump on Friday to stress for a coronavirus aid package. Trump pushed for state and local government aid and assistance regarding rental payments, more direct payments, and small business loans.

On the US-China front, both countries have delayed a review of their phase-1 trade deal that was initially scheduled for August 15. U.S. granted this time to China to increase the purchases of U.S. exports. The meeting was scheduled to take place on Saturday at the six-month anniversary of the phase one trade deal. The deal took its effect from February 15 as the global spread of coronavirus pandemic started.

On Friday, US President Donald Trump told us that the trade deal was intact and doing very well, but he did not mention anything about the delay in the review meeting. According to some sources familiar with the plans, the U.S. wanted to give more time to China to increase the purchases of the U.S. farm products that were part of the agreed deal. America’s favor given to China was provided to increase the review’s political optics as the U.S. Presidential elections were near.

On the negative side, there was news that Trump has said in a news conference that he was looking at banning other China-owned companies like Alibaba. This raised the fears of renewed conflicts and weighed on the market sentiment that dragged the USD/JPY pair on the downside.

Meanwhile, the Chinese Vice Foreign Minister Zheng Zeguang said that the relationship between the U.S. and China was at a critical juncture, and efforts should be made from both sides to maintain and stabilize the bilateral ties between both nations.

On the data front, at 09:30 GMT, the Tertiary Industry Activity in June from Japan rose to 7.9% from the forecasted 6.4% and supported the Japanese Yen that contributed to USD/JPY pair’s losses of the day.

At 17:30 GMT, the Core Retail Sales in July from the U.S. rose to 1.9% from the forecasted 1.3% and supported the U.S. dollar. At the same time, the Retail Sales in July dropped to 1.2% from the anticipated 2.0% and weighed on the U.S. dollar.

The core retail sales data exclude automobile sales that include about 20% of the retail sales data. The positive core retail sales and negative retail sales indicated that the automobile sector had suffered more than other sectors. The Prelim Nonfarm Productivity for the second quarter raised to 7.3% from the anticipated 1.5% and weighed on the U.S. dollar. The Prelim Unit Labor Cost for the second quarter rose to 12.2% against the forecasted 6.5% and supported the U.S. dollar.

At 18:15 GMT, the Capacity Utilization Rate also increased to 70.6% from the expected 70.3% and supported the U.S. dollar. The Industrial Production in July dropped to 3.0% from the anticipated 3.1% and weighed on the U.S. dollar. At 19:00 GMT, the Prelim UoM Consumer Sentiment in August rose to 72.8 from the anticipated 72.0 and supported the U.S. dollar. However, the Business Inventories in June came in as expected -1.1%. The Prelim UoM Inflation Expectations in August also remained flat at 3.0%.

After the release of U.S. economic data on Friday, the U.S. Dollar Index that rose to 93.40 earlier in the day, lost its traction and fell by 0.15% to 93.10 level. This weighed on USD/JPY pair, and the pair started to post losses on the day.

Daily Technical Levels

Support Pivot Resistance
105.8400 106.4500 107.1900
105.1000 107.8000
104.4900 108.5500

USD/JPY – Trading Tips

The USD/JPY consolidates in a sideways range, holding over resistance to become a support level of 106.428 level. Over this level, the USD/JPY is opening further room for buying until 107.450 level, but below this, the USD/JPY pair can trigger sharp selling until 105.752. The RSI and MACD are also supporting bearish bias in the pair. The current market price (CMP) of USDJPY is holding above 50 EMA, which extends support at 106.484 and may push the pair higher. Let’s consider buying above 106.480 level and selling below the same today. Good luck! 

Categories
Forex Options

FX Options Market Combined Volume Expiries for 17th August 2020

Thank you for visiting the Forex Academy FX Options market combined volume expiries section. Each day, where available, we will bring you notable maturities in FX Options of amounts of $100 million-plus, and where these large combined maturities at specified currency exchange rates often have a magnetic effect on price action, especially in the hours leading to their maturities, which happens daily at 10.00 AM Eastern time. This is because the big institutional players hedge their positions accordingly. Each option expiry should be considered ‘in-play’ with a good chance of a strike if labelled in red, still in play and a possible strike if labelled in orange and ‘out of play’ and an unlikely strike if labelled in blue, with regard to the likelihood of price action meeting the strike price at maturity.

…………………………………………………………………………………………………………

FX option expiries for Aug 17 NY cut at 10:00 Eastern Time, via DTCC, can be found below.

– EUR/USD: EUR amounts

  • 1.1900 937m

EURUSD is in a bull trend and just 40 pips short of the huge 1.1900 option expiry today. Price action seems to be flagging during the early European session. Upside remains favourite.

– GBP/USD: GBP amounts

  • 1.3090 623m

GBPUSD is close to a defined area of resistance with a large option expiry within reach of a pullback.

– USD/JPY: USD amounts

  • 105.50 534m
  • 105.65 624m
  • 106.02 438m

USDJPY is testing a support line. If breached it will leave the door open for the 106.02 option expiry.

– NZD/USD: NZD amounts

  • 0.6575 301m

NZDUSD is currently bouncing off of a confirmed area of support leaving a possible strike for the only option expiry for the pair at 0.6575 today.

………………………………………………………………………………….

As you can see on the preferred 1-hour chart(s), we have also plotted the expiration levels at the various exchange rate maturities and we have also labelled in red, orange and blue.  Therefore, if you see option expiry exchange rates labelled in red these should be considered in-play, because we believe there is a greater chance of the expiry maturing at these levels based on technical analysis at the time of writing. There is still a lesser possibility of a strike if they are in orange and so these are ‘in-play’ too. However, if we have labelled them in blue, they should be considered ‘not in-play’ and therefore price action would be unlikely to reach these levels, which are often referred to as Strikes, at the time of the 10 AM New York cut.

Our technical analysis is based on exchange rates which may be several hours earlier in the day and may not reflect price action at the time of the maturities. Also, we have not factored in economic data releases or keynote speeches by policymakers, or potential market volatility leading up to the cut.

Although we have added some technical analysis, we suggest you take the levels and plot them onto your own trading charts and incorporate the information into your own trading methodology in order to use the information to your advantage. Remember the higher the amount, the larger the gravitational pull towards the exchange rate maturity at 10:00 AM Eastern time.

If you want to learn how forex option expiries affect price action in the spot FX market see our educational article by clicking here: https://bit.ly/2VR2Nji

DISCLAIMER: Please note that this information is for educational purposes. Also, the maturities will look more or less likely to become a strike at 10 AM NY time due to exchange rate fluctuations resulting in a different perspective with regard to technical analysis, and also due to upcoming economic data releases for the associated pairs.

Categories
Crypto Market Analysis

Daily Crypto Review, August 17 – DeFi Craze Continues: More BTC Tokenized Than Mined

The cryptocurrency market spent most of its weekend consolidating, with only a couple of cryptocurrencies moving significantly. Bitcoin is currently trading for $11,817, which represents a decrease of 0.64% on the day. Meanwhile, Ethereum lost 1.27% on the day, while XRP lost 0.47%.

 Daily Crypto Sector Heat Map

When talking about top100 cryptocurrencies, OMG Network gained 50.69% on the day, making it the most prominent daily gainer. Waves (26.69%) and Ren (24.74%) also did great. On the other hand, Quant lost 6.55%, making it the most prominent daily loser. It is followed by Divi’s loss of 5.80% and Ampleforth’s drop of 5.08%.

Top 10 24-hour Performers (Click to enlarge)

Bottom 10 24-hour Performers (Click to enlarge)

Bitcoin’s dominance level has decreased slightly and dropped under the 60% mark, with its value currently at 59.17%. This value represents a 0.91% difference to the downside when compared to our last report.

Daily Crypto Market Cap Chart

The cryptocurrency market cap experienced a slight increase in value over the weekend. Its current value is $373.40 billion, which represents an increase of $5.33 billion when compared to our previous report.

_______________________________________________________________________

What happened in the past 24 hours?

_______________________________________________________________________

_______________________________________________________________________

Technical analysis

_______________________________________________________________________

Bitcoin

Bitcoin was on a slightly upward slope over the course of the weekend, trying to reach $12,000 before attempting a strong push. The largest cryptocurrency by market cap saw good support in the 21-period moving average, which kept it on its path. The descending RSI and incredibly low volume indicate that the cryptocurrency will move very soon. Meanwhile, Bitcoin’s hashrate reached its new all-time high of 129 EH/s.

BTC traders should look for a trade when a volume spike happens.

BTC/USD 4-hour Chart

Technical factors:
  • Price is above its 50-period EMA and its 21-period EMA
  • Price is at its middle B.B
  • RSI is neutral (52.88)
  • Volume is decreasing (Low)
Key levels to the upside          Key levels to the downside

1: $12,000                                1: $11,630

2: $12,300                                2: $11,460

                                                 3: $11,090

Ethereum

Unlike Bitcoin, Ethereum was not moving slow throughout the weekend. After breaking the $415 mark, Ethereum needed to consolidate above it and show strength, which it did. The second-largest cryptocurrency by market cap retested its support (successfully) and is now safely at the $425 mark.

Traders should look for a trade when ETH regains volume.

ETH/USD 4-hour Chart

Technical Factors:
  • Price is currently above its 21-period and its 50-period EMA
  • Price is above its top B.B.
  • RSI is neutral (52.85)
  • Volume is below average
Key levels to the upside          Key levels to the downside

1: $445                                      1: $415

2: $496                                     2: $400

                                                  3: $361

Ripple

XRP spent its weekend consolidating between the $0.285 and $0.31 support and resistance levels. Low volatility, as well as volume, made XRP virtually untradeable over the course of the weekend. However, as much as XRP doesn’t seem like it doesn’t have the strength to push through $0.31 by itself (without Bitcoin moving first), the state it is currently in is still more bullish than bearish.

Traders can look for a trade after XRP increases its volume and heads towards $0.31.

XRP/USD 4-hour Chart

Technical factors:
  • Price is currently above the 21-period and 50-period EMA
  • Price is between its middle and top B.B.
  • RSI is neutral (55.30)
  • Low volume
Key levels to the upside          Key levels to the downside

1: $0.31                                     1: $0.285  

2: $0.32                                     2: $0.266

3: $0.245


Categories
Forex Market Analysis

CAC 40 Advances in a 20-Year Triangle

Overview

The French index CAC 40 develops an incomplete triangle pattern that began in late August 2000. This year, CAC 40 underperforms 17.51% (YTD), recovering from the losses that dragged it to plunge until 3,632.1 pts, losing over 39.6%. The long-term outlook leads us to foresee a potential limited upside before to resume its drops corresponding to the incomplete bearish sequence in progress.

Market Sentiment Overview

The CAC 40 index, in its daily chart, unveils the advance mostly sideways since the price found resistance in the June’s high located at 5,213.7 pts. The current trading zone coincides with the mid-region of the 52-week high and low range, which leads us to observe that the market sentiment remains with a weak bullish sentiment. At the same time, we distinguish the French Index moving between the 60-day and 200-day moving average, which confirms the consolidation sequence that the French index remains in progress.

Nevertheless, considering that CAC 40 underperforms 17.51% (YTD), we observe that the Fresh index remains under bearish pressure, on the other the consolidation above the 4,871.7 pts., that corresponds to the 50% of the 52-week high and low range, the sideways formation could drive to CAC 40 to develop a limited upside before to resume a new decline.

Elliott Wave Outlook

The French stock market tracked by the CAC 40 index moves in a triangle pattern that began in late August 2000 when the market participants carried up the price until its record high at 6,944.8 pts. Once the price found resistance below the 7,000 pts, the French index started to move sideways, developing a triangle formation that remains incomplete.

The next figure illustrates to CAC 40, in its 2-week chart and log scale, under the Elliott wave perspective. The French index develops an incomplete triangle pattern (3-3-3-3-3), which moves in wave ((4)) of Primary degree identified in black.

The corrective structural series that remains in progress since the French index topped at 6,944.8 pts in late August 2020, currently develops its wave (E) of Intermediate degree identified in blue. Simultaneously, according to the Elliott wave theory, wave (E) must have three internal segments. In this context, from the figure, we distinguish that the price action completed the first bearish leg corresponding to wave A of Minor degree identified in green, which found a bottom at 3,632.1 pts on last March from where the price started to bounce, developing the wave B that remains in progress.

Currently, CAC 40 advances in its wave B of Minor degree labeled in green. Once completed this internal leg, the French index should resume its declines, with a possible support level located at 3,600 pts, even if it could extend until 2,957 pts.

Finally, once completed the long-term corrective sequence corresponding to wave ((4)), CAC 40 should start a new long-term rally corresponding to the fifth wave of Primary degree.

Categories
Forex Market Analysis

Daily F.X. Analysis, August 14 – Top Trade Setups In Forex – Eyes U.S. Retail Sales!

On the news side, the eyes will remain on the U.S. retail sales data and the Prelim UoM Consumer Sentiment from the United States. Both of the events are expected to drop from their previous figures. Typically such kind of data drives bearish movement in the U.S. dollar. Therefore, the market can trade a weaker dollar sentiment today.

Economic Events to Watch Today   


EUR/USD – Daily Analysis

The EUR/USD currency pair succeeded to extended its previous session bullish rally and hit the fresh intra-day highs towards 1.1800 level. However, the reason for the gains in currency pair could also be attributed to the broad-based U.S. dollar bearish bias, backed by fears that U.S. economic recovery from COVID-19 continuing to diminish. The on-going U.S. Congress’ failure to reach an agreement for the country’s latest COVID-19 stimulus package also added a burden to the greenback and contributed to the currency pair gains. 

On the contrary, the growing cases of coronavirus in Germany became the key factor that kept the lid on any additional gains in the currency pair. At the moment, the EUR/USD currency pair is currently trading at 1.1831 and consolidating in the range between 1.1781 – 1.1838.

The on-going uncertainty surrounding the much-awaited U.S. fiscal stimulus or the second wave of coronavirus (COVID-19), not to forget the latest tension between America and China over TikTok, weighed on the broad-based U.S. dollar and contributed to the currency pair gains. It should be noted that the Democrats and Republicans are still struggling to approve an additional stimulus package as authorities hinted that additional stimulus is needed to control the negative impact of the recent wave of the coronavirus.

At the coronavirus front, the number of reported coronavirus cases increased to 219,964, with a total of 9,211 deaths tolls, as per the German disease and epidemic control center, Robert Koch Institute (RKI), on Thursday. Meanwhile, the Cases rose by 1,445 in Germany on Thursday against Wednesday’s +1,226. Whereas the death toll increased by 4, the tally showed. Despite this, the shared currency did not give any major attention to it and remains unperturbed by the renewed virus concerns.

The market players will keep their eyes on the Retail Sales m/m, Core Retail Sales m/m, and Prelim UoM Consumer Sentiment, which is scheduled to be released during the New York session. 

Daily Technical Levels

Support Pivot Resistance
1.1773 1.1819 1.1857
1.1735 1.1903
1.1689 1.1942

EUR/USD– Trading Tip

The EUR/USD is trading neutral on Friday, as traders seem to wait for major economic data to help drive a breakout. The bullish sentiment seems dominant as the EUR/USD pair trades at 1.1818 level, holding right below an immediate resistance level of 1.1820. Below this, the pair is likely to trade bearish until 1.1783 and 1.1745 level. Conversely, the bullish breakout of the 1.1820 level can lead the pair to be further higher until 1.1860 and the 1.1890 levels.


GBP/USD – Daily Analysis

The GBP/USD currency pair succeeded in stopping its previous-day losing streak and rose closer to 1.3100 level, mainly due to the broad-based U.S. dollar weakness. That was triggered by the coronavirus crisis in the U.S., which continued to fuel worries that the second wave of COVID-19 cases could undermine the U.S. economy.

The repeated inability over the much-awaited stimulus also adds pressure on the U.S. dollar and further pushed the currency pair. On the other hand, the fresh optimism over the UK-US relations also added strength around the Pound currency and contributed to the currency pair gains. On the other hand, the on-going pessimism of coronavirus (COVID-19) second wave in the U.K., and the UK-Japan lingering trade talks became the major factors that kept the lid on any further gains in the currency pair. Currently, the GBP/USD currency pair is currently trading at 1.3084 and consolidating in the range between 1.3031 – 1.3093.

The U.K. Trade Secretary Liz Truss declared that she is very satisfied as the United States has not implemented additional tariffs, which gave some support to the local currency and extended further upside momentum in the pair.

The U.K. formally started to face recession the previous day, with over 20% of GDP drop across the pond. In turn, the British business leaders and trade unions urged the extension of furlough scheme beyond October expiry; Chancellor Rishi Sunak sees promising signs off-late.

At the Brexit front, the Brexit jitters remain on the card as the fisheries and level-playing field being the tardiest obstacle. However, the policymakers from both sides are set to resume the sixth round in the next week. Apart from this, the U.S. criticized the European Union (E.U.) due to its lack of action regarding the airbus case. Elsewhere, the U.S. added some French and German goods to the tariff list while removing a few from the U.K. and Greece.

On the other hand, the rising COVID-19 cases, especially in the U.S., Australia, Japan, and some of the notable Asian nations like India, fueled concerns that the economic recovery could halt once again, which ultimately drags the broad-based U.S. dollar under pressure. The on-going uncertainty surrounding the much-awaited U.S. fiscal stimulus and the latest tension between America and China over TikTok also weighed on the broad-based U.S. dollar and contributed to the currency pair gains.

As a result, the broad-based U.S. dollar reporting losses on the day amid the failure of the U.S. stimulus package, as well as the United States still facing virus woes, ultimately crushed hopes for a quick economic recovery. Nevertheless, the losses in the U.S. dollar helped the currency pair to stay higher.  


Daily Technical Levels

Support Pivot Resistance
1.3021 1.3073 1.3116
1.2977 1.3169
1.2925 1.3212

GBP/USD– Trading Tip

The GBP/USD consolidates at 1.3070 level, holding right above the 50 periods EMA support area of 1.3040 level while the bearish breakout of 1.3040 level can extend selling unto 1.2918 level. Recently as we can see in the chart above that the GBPUSD pair has violated its upward trendline that supported the pair around 1.3130 level, and now below this, we can expect GBP/USD to continue trading bearish. The GBP/USD should show a bearish crossover to confirm a strong selling bias in the Cable. On the higher side, Sterling may find resistance at 1.3105 and 1.3175. Let’s consider selling below 1.3045 level today. 


USD/JPY – Daily Analysis

The USD/JPY currency pair failed to extend its previous 4-day bullish bias and dropped just above the mid-106.00 level, mainly due to the broad-based U.S. dollar weakness triggered by the worries that the second wave of COVID-19 cases in the United States could ruin the recovery in the world’s biggest economy. The on-going doubts over the U.S. Stimulus Package also weighed on the American currency and contributed to the pair losses. On the other hand, the concerns about intensifying US-China relations and U.S. Trade Representative Robert Lighthizer’s verbal attack on Europe extended some additional support to the safe-haven Japanese yen, which exerted an additional burden on the currency pair. Apart from this, the upbeat performance of Japanese PPI also underpinned the Japanese yen and pushed currency pair further lower. At this particular time, the USD/JPY currency pair is currently trading at 106.91 and consolidating between 106.57 – 106.94.

Despite the reduction in coronavirus cases, the fears about the U.S. economic recovery still hover all over the market and keep the U.S. dollar bulls defensive. As per the latest report, the figures have crossed almost 5.2 million cases in the U.S. alone as of August 13, as per the Johns Hopkins University and millions unemployed.

Meanwhile, the risk-off market sentiment was further bolstered by the long-lasting disappointment over the lack of progress in the much-awaited fiscal package. U.S. President Donald Trump accused Democrats that they are not willing to negotiate over the package.

As in result, the broad-based U.S. dollar failed to gain any positive traction on the day and reported losses as the United States crisis of virus could break hopes for a quick economic recovery, which kept the investors careful. However, the losses in the U.S. dollar kept the currency pair bearish. 

Also weighing on the market trading sentiment could be the U.S. Central Command’s statement suggesting the Iranian Navy overtaking a ship called “Wila.” Besides, the U.S. Trade Representative Robert Lighthizer’s verbal attack on Europe also adds a burden to the market trading sentiment.

Across the Pound, the losses in the currency pair could also be associated with Japanese PPI’s upbeat performance, which eventually underpinned Japanese yen and contributed to the currency pair declines. At the data front, Japan’s July month Producer Price Index (PPI) grew past-0.3% forecast on MoM to 0.6%. Further, the yearly figures slipped less than -1.1% expected level to -0.9%.

Daily Technical Levels

Support Pivot Resistance
106.6400 106.8500 107.1400
106.3500 107.3500
106.1400 107.6400

USD/JPY – Trading Tips

The USD/JPY trades sideways over resistance become a support level of 106.628 level. Above this, the USD/JPY pair is opening further room for buying until 107.450 level. The RSI and MACD are also supporting bullish bias in the pair. A recent bullish breakout of 106.450 level can extend the buying trend until 107.390. The current market price of USDJPY is staying over 50 EMA, which extends support at 105.950 and may push the pair higher. Let’s consider buying above 106.480 level today. Good luck! 

Categories
Forex Options

FX Options Market Combined Volume Expiries for 14th August 2020

Thank you for visiting the Forex Academy FX Options market combined volume expiries section. Each day, where available, we will bring you notable maturities in FX Options of amounts of $100 million-plus, and where these large combined maturities at specified currency exchange rates often have a magnetic effect on price action, especially in the hours leading to their maturities, which happens daily at 10.00 AM Eastern time. This is because the big institutional players hedge their positions accordingly. Each option expiry should be considered ‘in-play’ with a good chance of a strike if labelled in red, still in play and a possible strike if labelled in orange and ‘out of play’ and an unlikely strike if labelled in blue, with regard to the likelihood of price action meeting the strike price at maturity.

…………………………………………………………………………………………………………

FX option expiries for Aug 14 NY cut at 10:00 Eastern Time, via DTCC, can be found below.

– EUR/USD: EUR amounts

  • 1.1700 544m
  • 1.1750 1.1bn
  • 1.1800 988m
  • 1.1825 1.1bn
  • 1.1850 1.1bn
  • 1.1900 2.1bn
  • 1.1950 653m

EURUSD upward momentum has been muted by better than expected jobs data from the USA and upbeat comments referring to a V-shaped recovery from Fed members. Price action is currently consolidating.

– USD/JPY: USD amounts

  • 105.50 579m
  • 105.85 452m
  • 106.00 907m

USDJPY failed to gain into 107.00 and beyond and the bears are currently in charge.

– AUD/USD: AUD amounts

  • 0.7100 712m

AUSUSD is unable to find traction to reach the 0.7200 level and is consolidating and going by the strength or weakness of the US dollar

– USD/CAD: USD amounts

  • 1.3175 1.2bn
  • 1.3200 501m
  • 1.3250 1.5bn

USDCAD is consolidating with price action fading to the upside. The 1.3250 Option looks like a favourite for the New York cut.

– EUR/GBP: EUR amounts

  • 0.9005 400m

EURGBP is in a tight consolidation phase lookout for the breach of the support area before moving on to the key 0.900 level and option expiry.

………………………………………………………………………………….

As you can see on the preferred 1-hour chart(s), we have also plotted the expiration levels at the various exchange rate maturities and we have also labelled in red, orange and blue.  Therefore, if you see option expiry exchange rates labelled in red these should be considered in-play, because we believe there is a greater chance of the expiry maturing at these levels based on technical analysis at the time of writing. There is still a lesser possibility of a strike if they are in orange and so these are ‘in-play’ too. However, if we have labelled them in blue, they should be considered ‘not in-play’ and therefore price action would be unlikely to reach these levels, which are often referred to as Strikes, at the time of the 10 AM New York cut.

Our technical analysis is based on exchange rates which may be several hours earlier in the day and may not reflect price action at the time of the maturities. Also, we have not factored in economic data releases or keynote speeches by policymakers, or potential market volatility leading up to the cut.

Although we have added some technical analysis, we suggest you take the levels and plot them onto your own trading charts and incorporate the information into your own trading methodology in order to use the information to your advantage. Remember the higher the amount, the larger the gravitational pull towards the exchange rate maturity at 10:00 AM Eastern time.

If you want to learn how forex option expiries affect price action in the spot FX market see our educational article by clicking here: https://bit.ly/2VR2Nji

DISCLAIMER: Please note that this information is for educational purposes. Also, the maturities will look more or less likely to become a strike at 10 AM NY time due to exchange rate fluctuations resulting in a different perspective with regard to technical analysis, and also due to upcoming economic data releases for the associated pairs.

Categories
Crypto Market Analysis

Daily Crypto Review, August 14 – ETH Price Skyrocketing; BitMEX Implementing KYC Procedures

The cryptocurrency market had mad a slight rally in the past 24 hours, with Ethereum leading the way with a price gain of almost 8%. Bitcoin is currently trading for $11,723, which represents an increase of 1.33% on the day. Meanwhile, Ethereum gained 7.61% on the day, while XRP gained 4.96%.

 Daily Crypto Sector Heat Map

When talking about top100 cryptocurrencies, Waves gained 36.29% on the day, making it the most prominent daily gainer. Algorand (34.02%) and Reserve Rights (25.27%) also did great. On the other hand, Ampleforth lost 14.74%, making it the most prominent daily loser. It is followed by Aragon’s loss of 12.46% and yearn.finance’s drop of 11.04%.

Top 10 24-hour Performers (Click to enlarge)

Bottom 10 24-hour Performers (Click to enlarge)

Bitcoin’s dominance level has decreased slightly since we last reported, with its value currently at 60.08%. This value represents a 0.76% difference to the downside when compared to yesterday’s value.

Daily Crypto Market Cap Chart

The cryptocurrency market cap experienced an increase in value since we last reported. Its current value is $368.07 billion, which represents an increase of $9.15 billion when compared to yesterday’s value.

_______________________________________________________________________

What happened in the past 24 hours?

_______________________________________________________________________

_______________________________________________________________________

Technical analysis

_______________________________________________________________________

Bitcoin

Bitcoin spent the day trying to get back near $12,000 after a day of consolidation. Its price made a sharp move towards the upside and broke the $11,630 resistance level, but stopped at $11,850 and then started to retrace. This retracement is most likely a test of the newly-passed resistance (now support). If Bitcoin’s price holds up above it, there is a good chance that we can see another move towards the $12,000 mark in the near term.

BTC traders should look for an opportunity when BTC spikes after the confirmation of its position.

BTC/USD 4-hour Chart

Technical factors:
  • Price is currently above its 50-period EMA and its 21-period EMA
  • Price is above its middle B.B
  • RSI is neutral (54.81)
  • Volume is decreasing
Key levels to the upside          Key levels to the downside

1: $12,000                                1: $11,630

2: $12,300                                2: $11,460

                                                 3: $11,090

Ethereum

Ethereum is the star of the day, as its price has skyrocketed over the course of the last 24 hours. The second-largest cryptocurrency by market cap saw a massive increase in volume while its price went from below-$400 levels all the way up to $432. Ethereum is now consolidating at around $420 and trying to test the $415 support level.

Traders should look for a trade when Ethereum confirms its position above $415 (or fails to do so).

ETH/USD 4-hour Chart

Technical Factors:
  • Price is above its 21-period and its 50-period EMA
  • Price is above its top B.B.
  • RSI is overbought (71.94)
  • Volume is average (one-candle spike)
Key levels to the upside          Key levels to the downside

1: $415                                     1: $$400

2: $496                                     2: $361

                                                  3: $340

Ripple

XRP had a great day and outperformed Bitcoin as well. The third-largest cryptocurrency by market cap ended up gaining almost 5% on the day after breaking above the $0.285 resistance level. As we noted in our previous report, breaking this level is key to pushing further towards the upside, and XRP’s future moves towards $0.31 are a bit more realistic now. However, for the time being, the current progress got stopped by the top B.B. at $0.3, and XRP started consolidating and (possibly) testing $0.285 as support.

Traders can look for an opportunity right after XRP increases in volume and heads towards $0.31.

XRP/USD 4-hour Chart

Technical factors:
  • Price is above the 21-period and 50-period EMA
  • Price is between its middle and top B.B.
  • RSI is neutral (57.75)
  • Low volume
Key levels to the upside          Key levels to the downside

1: $0.31                                     1: $0.285  

2: $0.32                                     2: $0.266

3: $0.245


Categories
Forex Videos

An Introduction To Forex Options Part 2- Step Up Your Game!

An Introduction To Forex Options Part 2- Step Up Your Game!


The price of the option, at least theoretically, is determined by a complex computation using the Black-Scholes model. The Black-Scholes equation aims to compute the fair value of the contract, based on the asset’s volatility, the time in days to the expiration, and the distance of the strike price to the spot price of the underlying.
But, the market may and do set a different price. Since strike price and expiring date are fixed, the difference of the market price with the theoretical price, computed using historical volatility, is attributed to a different perception of the asset’s volatility, which is called “implied volatility.”

The greeks

The running price of an option depends on several factors, as we can see: The volatility, the distance of the strike to the current price, and the time to the expiration. The greeks are four factors that define the risk of the option: Delta, Gamma, Vega, and Theta.

Delta

Delta measures the change in the price of an option that results from a change in the underlying’s price. The value of delta ranges from – 100 to zero on puts and from 0 to 100 on calls. For example, the delta of a call at the money ( when the strike and spot prices are equal) is 50, which means the option’s value changes 50% of the change on the underlying’s price. Delta is also a measure of the probability of being profitable at expiration.
We have to pay attention to the following:
– Deltas increase as the expiration date gets closer
– Delta’s rate of change is measured by Gamma
– Implied volatility changes can also change the Delta.

Gamma

Gamma measures the rate at which Delta changes. Gamma is small for out of the money options and gets higher as the option moves at the money. Gamma is positive ( 0-100) for calls and negative ( -100-0) for puts.
A low gamma suggests that even a large movement on the underlying will have a small effect on the Delta and, therefore, on the option’s price.

Vega

Vega is the measure of the volatility of the underlying asset. As the Vega increases, so do the odds of the price moving larger ranges. Hence, an increase in Vega it rises the price of the option, while a shrinking vega will lower it. Thus, option sellers benefit from the shrinkage of Vega. Vega reflects the price action of the market. An increasing Vega shows a trend, while a decreasing vega may show a trading range. Also, since Vega reflects the implied volatility, it can increase or decrease without any price changes on the underlying asset. Of course, a quick change in the price increases it. Also, Vega drops as the option gets closer to its expiration.

Theta

Theta shows the time decay of the option and is related to its distance to the expiration date. As time passes, Theta drops. Theta is always negative since time moves in the same way for calls and puts. Consequently, Theta decay is good for sellers and bad for buyers. Theta is highest for the at-the-money option, and its value drops to its negative limit with an increasing rate near expiration.


Recommended reading:
THE OPTION TRADER’S GUIDE TO PROBABILITY, VOLATILITY, AND TIMING , by Jay Kaeppel

Categories
Forex Options

FX Options Market Combined Volume Expiries for 13th August 2020

Thank you for visiting the Forex Academy FX Options market combined volume expiries section. Each day, where available, we will bring you notable maturities in FX Options of amounts of $100 million-plus, and where these large combined maturities at specified currency exchange rates often have a magnetic effect on price action, especially in the hours leading to their maturities, which happens daily at 10.00 AM Eastern time. This is because the big institutional players hedge their positions accordingly. Each option expiry should be considered ‘in-play’ with a good chance of a strike if labelled in red, still in play and a possible strike if labelled in orange and ‘out of play’ and an unlikely strike if labelled in blue, with regard to the likelihood of price action meeting the strike price at maturity.

…………………………………………………………………………………………………………

FX option expiries for Aug 13 NY cut at 10:00 Eastern Time, via DTCC, can be found below.

– EUR/USD: EUR amounts

  • 1.1650 518m
  • 1.1700 1.6bn
  • 1.1725 602m
  • 1.1760 589m
  • 1.1775 521m
  • 1.1825 634m

EURUSD current price action is in the range of a large cluster of option expiries and should contain price action. US data up later will be the next test.

– USD/JPY: USD amounts

  • 105.50 1.0bn
  • 106.00 1.1bn
  • 106.70 888m
  • 107.00 850m
  • 107.20 651m
  • 107.30 378m

USDJPY is in a bull trend pullback having failed an earlier test to hit 107.00. The bulls will want another crack at it.

– GBP/USD: GBP amounts

  • 1.3000 750m

GBPUSD saw price action fail to reach the 1.30 level even after the worst UK recession data in decades. Only good news in the form of US data or an agreed Covid relief package will cause another test of this level.

– AUD/USD: AUD amounts

  • 0.7100 1.2bn

AUDUSD is in consolidation mode. The bulls will be looking for a test of 0.72. The option expiry is out of play.

– NZD/USD: NZD amounts

  • 0.6515 213m

NZDUSD is oversold but remains in a bear channel.

………………………………………………………………………………….

As you can see on the preferred 1-hour chart(s), we have also plotted the expiration levels at the various exchange rate maturities and we have also labelled in red, orange and blue.  Therefore, if you see option expiry exchange rates labelled in red these should be considered in-play, because we believe there is a greater chance of the expiry maturing at these levels based on technical analysis at the time of writing. There is still a lesser possibility of a strike if they are in orange and so these are ‘in-play’ too. However, if we have labelled them in blue, they should be considered ‘not in-play’ and therefore price action would be unlikely to reach these levels, which are often referred to as Strikes, at the time of the 10 AM New York cut.

Our technical analysis is based on exchange rates which may be several hours earlier in the day and may not reflect price action at the time of the maturities. Also, we have not factored in economic data releases or keynote speeches by policymakers, or potential market volatility leading up to the cut.

Although we have added some technical analysis, we suggest you take the levels and plot them onto your own trading charts and incorporate the information into your own trading methodology in order to use the information to your advantage. Remember the higher the amount, the larger the gravitational pull towards the exchange rate maturity at 10:00 AM Eastern time.

If you want to learn how forex option expiries affect price action in the spot FX market see our educational article by clicking here: https://bit.ly/2VR2Nji

DISCLAIMER: Please note that this information is for educational purposes. Also, the maturities will look more or less likely to become a strike at 10 AM NY time due to exchange rate fluctuations resulting in a different perspective with regard to technical analysis, and also due to upcoming economic data releases for the associated pairs.

Categories
Crypto Market Analysis

Daily Crypto Review, August 13 – Crypto Loans Entering the Market; Bitcoin Temporarily Stuck at $11,600

The cryptocurrency market had a day where almost no cryptocurrencies ended up in the red. Even though the gains were mostly small, only five cryptocurrencies lost in the past 24 hours. Bitcoin is currently trading for $11,582, which represents an increase of 1.88% on the day. Meanwhile, Ethereum gained 4.37% on the day, while XRP gained 1.11%.

 Daily Crypto Sector Heat Map

When talking about top100 cryptocurrencies, Numeraire gained 161.01% on the day, making it the most prominent daily gainer. Aragon (90.43%) and BitShares (41.67%) also did great. On the other hand, Divi lost 4.38%, making it the most prominent daily loser. It is followed by Compound’s loss of 2.5% and Aave’s loss of 1.85%.

Top 10 24-hour Performers (Click to enlarge)

Bottom 10 24-hour Performers (Click to enlarge)

Bitcoin’s dominance level has decreased slightly since we last reported, with its value currently at 60.84%. This value represents a 0.53% difference to the downside when compared to yesterday’s value.

Daily Crypto Market Cap Chart

The cryptocurrency market cap experienced a major increase in value since we last reported. Its current value is $358.92 billion, which represents an increase of $13.32 billion when compared to yesterday’s value.

_______________________________________________________________________

What happened in the past 24 hours?

_______________________________________________________________________

_______________________________________________________________________

Technical analysis

_______________________________________________________________________

Bitcoin

After a day of sharp decline, Bitcoin spent the day trying to restore the lost value. However, while the largest cryptocurrency by market cap did gain a few percent and rose to $11,600 levels, the $11,630 resistance seems to be holding the price in place quite well. Bitcoin will need to pass this level confidently (and soon), or BTC bears will consider this the start of a bear move.

BTC traders should look for an opportunity when BTC crosses $11,630.

BTC/USD 4-hour Chart

Technical factors:
  • Price is currently below its 50-period EMA but above its 21-period EMA
  • Price is slightly above its middle B.B
  • RSI is neutral (48.49)
  • Volume is decreasing
Key levels to the upside          Key levels to the downside

1: $11,630                                 1: $11,460

2: $12,000                                 2: $11,090

3: $12,300                                  3: $10,850

Ethereum

Ethereum had a slightly better day than its rival Bitcoin in terms of gains, as it returned to the level it was on the night before the selloff. However, the $400 level seems like it has great resistance, and it is yet unknown whether ETH will be able to break it. The move that will break $400 needs to be extremely strong, and it will most likely be caused by BTC’s move to the upside.

Traders should look for an opportunity when Ethereum breaks $400 or collapses after failing to do so.

ETH/USD 4-hour Chart

Technical Factors:
  • Price is above its 21-period EMA and its 50-period EMA
  • Price is between its middle and top B.B.
  • RSI is elevated (58.91)
  • Volume is average
Key levels to the upside          Key levels to the downside

1: $400                                     1: $361

2: $415                                     2: $340

3: $496                                      3: $302

Ripple

Unlike Bitcoin and Ethereum, XRP did not have such a good day today. The third-largest cryptocurrency by market cap did end up in the green on the day, but it failed to break the $0.285 level. Breaking this level is key to pushing further towards the upside, but the 21-period and 50-period moving average are also above the price and very near $0.285, making it incredibly difficult for XRP to move towards the upside.

Traders can look for an opportunity right after XRP breaks $0.285.

XRP/USD 4-hour Chart

Technical factors:
  • Price is below its 21-period and 50-period EMA
  • Price is slightly below its B.B.
  • RSI is neutral (42.19)
  • Low volume
Key levels to the upside          Key levels to the downside

1: $0.285                                    1: $0.266  

2: $0.31                                     2: $0.245

3: $0.32                                    3: $0.235


Categories
Forex Basic Strategies

Let’s Learn Some Momentum Trading Techniques Using The Awesome Oscillator

Introduction

Bill Williams was the one to first developed the Awesome Oscillator, and it essentially indicates the market momentum. On the other hand, RSI (Relative Strength Index) is a trading indicator that provides an idea of the overbought and oversold zone. In the Awesome Oscillator based trading strategy, we will use the Awesome Oscillator to determine the market direction and use the RSI to increase the probability by eliminating unwanted market movements.

The Awesome Oscillator

Bill Williams has created the Awesome Oscillators to identify the market momentum of a currency pair. Besides the forex market, this trading strategy works well in all financial markets, including the stock, indices, cryptocurrencies, and commodities. The elements of this trading indicator are pointed out in the image below.

  • The first element of Awesome Oscillator is the 34 period’s simple moving average indicating the median of the last 34 candlesticks.
  • 5-period simple moving averages indicate the median of the last five candlesticks.
  • Histogram and Zero Line.

Let’s have a look at how these elements represent in a market:

  • When the Awesome Oscillator is below the zero lines, we should focus on the short term moving average. If the 5 SMA moves below the 34 SMA, it will indicate a downtrend.
  • If the position of Awesome Oscillator is above the zero lines, we can consider the trend as an uptrend.
  • If the Awesome Oscillator histogram moves to the green zone, we can consider the candlestick that moved higher than the previous candle.
  • We will consider the histogram at the red zone that is smaller than the previous candlestick.
  • The rules mentioned above are not exact buying and selling signals. Instead, it provides a trading opportunity where traders should consider other confirmations.

We can also identify the divergence between the price and the Awesome Oscillator to find a trading opportunity.

If you see the price of a currency pair to make a lower low from the left side to the right side, but the Awesome Oscillator makes the opposite, you can find a potential divergence. In divergence, the Awesome Oscillator should create two peaks above the zero lines considering the market condition.

Awesome Oscillator with RSI Trading Strategy

In this trading strategy, we will combine the Awesome Oscillator to identify the market momentum and the Relative Strength Index to get the overbought or oversold zone. If we can combine these accurately, we can make a trading strategy that can provide a good profit.

This strategy works very well in most of the currency pairs and time frames. Therefore, we can take swing trade, day trade, and even position trade. Besides the technical formation using these two indicators, we will use price action to enter the trade. Moreover, we will use stop loss and take profit as a risk management tool before taking the trading decisions.

Now let’s move to the trading strategy. In the image below, we can see the visual representation of how to trade using the Awesome Oscillator RSI trading strategy. The rules for buying and selling of a currency pair are mentioned below:

Buy Trade Setup

  • At first, the RSI should be below the 30 levels and point to an upward reversal.
  • When the RSI moves above the 30 levels, we will consider buying signals only if the Awesome Oscillator shows a green bar.
  • When the green bar appears, we can place a buy stop about 2- 5 pips above the current candlestick and allow the price to take our trade automatically.
  • Sometimes RSI might signal 1-2 candlestick later than the Awesome Oscillator. In that case, we can consider trading entry by taking a smaller lot.

Sell Trade Setup

  • At first, the RSI should be above the 70 levels and point to a downward reversal.
  • When the RSI moves below the 70 levels, we will consider selling signals only if the Awesome Oscillator shows a red bar.
  • When the red bar appears, we can place a sell stop about 2- 5 pips below the current candlestick and allow the price to take our trade automatically.
  • Sometimes RSI might signal 1-2 candlestick later than the Awesome Oscillator. In that case, we can consider trading entry by taking a smaller lot.

In this strategy, we did not consider the histogram crossing zero lines. However, suppose you want to increase the probability of your trading. You can look at the zero line cross as a further trading condition that will indicate the overbought and oversold zone.

Stop Loss And Take Profit Idea

The stop loss and take profit idea is a vital element of any trading strategy. There are many ways to set take profit and stop-loss depending on the market swing low and Sewing high. In a buy trade setup, the stop loss should be below the recent swing low with 10 to 15 pips buffer. Similarly, in a sell trade, the stop loss should be above the recent swing high with 10 to 15 pips buffer.

Another idea of a stop-loss plan is to set it at 1.5X ATR. It will indicate the actual volatility of the currency pair that you are trading. Besides the stop-loss setting, take profits can be set with a multiple-level approach. You can hold your position until the Awesome Oscillator crossed above or below the zero lines. Later on, you can monitor the momentum of the price to identify the next take profit level.

Summary

Let’s summarise the awesome oscillator and RSI trading strategy:

  • If the RSI is above the 70 levels and points downward movement, we will consider selling setups only, and if the RSI starts to move from the 30 levels, we will consider buying only.
  • To enter the trade, we can take a pending order above or below the previous candle if other conditions meet.
  • The stop loss should be below the swing low or swing high with some buffer or at 1.5 X ATR.
  • For setting take profit, you can hold the trade until the Awesome Oscillator crosses above or below the zero lines. Moreover, if the market conditions allow you to extend the take profit.

In every trading strategy, trade management is an essential tool that a trader should not ignore. In the forex market, we anticipate the price based on our technical and fundamental analysis. As we trade on probabilities, there will be conditions where the market will hit our stop loss. Therefore, strong trade management is the only way to keep your balance steady growth.

Categories
Forex Fundamental Analysis

GDP from Construction – Exploring The Fundamental Forex Driver

Introduction

Construction is the very first phase of an expected economic growth, which is more evident in the developing economies compared to the developed economies. New buildings, infrastructures, renovations are an indication of an expanding economy. GDP from construction is an important economic indicator to assess financial health and future economic expansion trends.

Construction

It is a part of the Secondary (Industry) Sector of an economy.  Construction refers to building and infrastructure works in all areas. The Construction Sector includes all physical making of infrastructures like bridges, transportation systems (roads, railways), dams, irrigation systems, naval ports, airports, pipelines, apartments, buildings, houses, commercial buildings, corporate structures, etc.

How can the GDP from Construction numbers be used for analysis?

The Construction Industry’s Economic Output is a significant economic indicator that is closely watched by both the private and public sectors. It is especially crucial for developing economies like China, as it is their main contributor to GDP. The GDP from Construction figures assist Central Authorities in policy reforms & economic-decisions.

Growth is essentially a process of invention of new things and discarding the old inefficient ones. Construction, in this sense, is nothing but that. It involves the erection of new buildings, renovations, expansions of the infrastructures that are currently existing. Increased GDP from Construction involves more people getting employed, better wages in the sector, and the extra demand for raw materials, etc. Hence we can say that the act of construction itself has a ripple effect on the economy.

Secondly, the GDP from the construction of corporate infrastructures or commercial structures implies that the constructed structures will be used for further economic activities. For example, a company doubling its company size is planning to double its staff and correspondingly the business that it generates. Hence, GDP from Construction figures improvement is indicative of an improvement in many other sectors.

All these improvements correlated with GDP overall also stimulate consumer confidence and encourages consumer spending, which further stimulates the economy and boosts growth. The Secondary Sector is composed of Industrial Output and Construction Output. For most countries, Industrial Output will be the dominant contributor to the GDP from the Secondary Sector.

We analyze GDP from Construction to understand the associated implications that more economic growth will be followed. For example, the construction of new power plants, or manufacturing industries, would show higher GDP from Construction this year. But the subsequent years, we will see higher GDP due to the newly added Industrial Outputs.

Hence, GDP from Construction figures can be used to assess future economic growth. Everything that is constructed is most likely to bring revenue through its usage in the future. Hence, GDP from Construction improvements can be a leading indicator for further improvements in GDP down the line.

The global Construction Industry makes up 13% of the World GDP, which is more than the Agriculture sector, which is about 7% of the World GDP. It means, overall, the global economy is improving at a rapid pace, with the Industrialization of many economies. It is forecasted to grow to 15% in 2020. China, India, and Japan are flourishing in this era with rapid Industrialization and achieving high GDP Growth Rates ranging from 5-20% in recent years.

GDP from construction can be used by investors to know which countries are transitioning from Developing Economies to Developed Economies. As GDP from Construction increases, it would be followed by GDP growth through increased Industrialization. Further down the line, the economies would transition to the services Sector as their main contributor to GDP.

Impact on Currency

The GDP from Construction is not a high impact indicator when compared to measures like GDP and GDP Growth Rates. GDP from construction does not portray the entire picture of the economy. However, it can be an essential tool for the Central Authorities to keep track of Construction Sector performance and its relative implications over the economy.

What construction is occurring can also serve as an indication of the economy type going to be built over the coming years. But, for the international currency markets, it does not serve as a useful indicator. It is a proportional and lagging indicator. Higher GDP from Construction is great for the economy and its corresponding currency, and vice-versa.

Sources of GDP from Construction

For the US, the corresponding reports are available here – GDP -BEA, GDP by Industry – BEA, and Construction – GDP. World Bank also maintains the Construction and Industrial Sector as a percentage of GDP on its official website, which can be found here – Industrial Sector (including construction) – World % of GDP. GDP from construction can also be found here – GDP Construction – World – Trading Economics.

GDP from Construction Announcement – Impact due to news release

The construction sector is one of the fastest-growing sectors today that has a great impact on the economy of any nation. Construction is one crucial sector that contributes to the economic growth of a country. The government and other regulatory authorities have always shown interest in this segment by investing significantly in various parts of the sector. Naturally, it will contribute to the GDP of a country and influence the reading released quarterly and monthly. When talking about the fundamental analysis of a currency or stock, investors make investment decisions based on the GDP and not on contributions made by individual sectors.

Now let’s analyze the impact of GDP on different pairs and witness the change in volatility due to the news release. For this purpose, we have gathered the latest GDP data of Japan, where the below image shows the fourth quarter’s GDP data released in March.

AUD/JPYBefore the announcement

We will first look at the AUD/JPY currency pair to observe the impact of GDP announcement on the Japanese Yen. In the above picture, we see the market has crashed lower due to some other news release, and currently, the price is at its lowest point. This means there is a great amount of selling pressure in the market, or sellers are dominant. In such a market situation, it is advised not to carry any position in the market before the news release.

AUD/JPY | After the announcement

After the news announcement, the price sharply moves higher and closes as a long bullish candle. This means traders sold Japanese Yen soon after the news release as it was below expectations and lower than the previous quarter. The volatility did increase to the upside for a while, but it did not sustain as the Japanese Yen was showing a lot of strength. One should trade after the market shows signs of trend continuation or reversal and not just based on the GDP data.

GBP/JPY | Before the announcement

GBP/JPY | After the announcement

The above images represent the GBP/JPY currency pair, where we see that the market has strongly moved lower as indicated by two big bearish candles before the news announcement. This means the Japanese Yen has gotten strong recently due to some other fundamental reason, and we cannot ascertain if this will continue or not. As volatility is very high, one should not take a position in the currency before the news release.

After the news announcement, volatility spikes to the upside, and the ‘news candle’ closes with a great amount of bullishness. Even though the price moves higher by a lot, it did not go above the moving average. The market has reacted adversely to the news announcement as the GDP was lower than last time and also below what was forecasted. If the price does cross moving average, this means the downtrend is still intact.

NZD/JPY | Before the announcement

NZD/JPY | After the announcement

The above pictures are that of the NZD/JPY currency pair, where we see a major crash in the market before the news announcement, which is visible in the first image. This pair also shows similar characteristics as in the above currency pairs, where the Japanese Yen has strengthened greatly. Ideally, we should be looking to sell the currency pair after a suitable price retracement.

After the news announcement, the market goes higher so much that it almost retraces the previous bearish candle, resulting in some weakness in the Japanese Yen. As the GDP data was weak, it brought disappointment in the market where traders sold the Japanese Yen and bought the base currency. Cheers!

Categories
Forex Videos

The US Printed More Money in June Than In Two Centuries!

The US Printed More Money in June Than in Two Centuries

Dan Morehead, CEO of Pantera Capital, expressed his opinion on the US, printing a shocking amount of money to support the economy during the COVID-19 pandemic.
His letter to investors states that “The United States printed more money in June alone than in the first two centuries after its creation.” Morehead continued saying that “In June, the US budget deficit, which counted $864 billion, was larger than the total debt that was incurred from 1776 through the end of 1979, which is shocking.”

Bitcoin is the way out

Morehead made it extremely clear that Pantera Capital sees Bitcoin and cryptocurrencies as a whole as the solution for the current crisis. He also highlighted the contrast of the effects of money printing in recent months, to the effects it had over the centuries:
“With that first trillion USD printed, the US defeated British imperialists, bought Alaska and made the Louisiana Purchase, defeated fascism, built the Interstate Highway System, ended the Great Depression, and went to the Moon.”
Morehead showed his distrust towards how the US handles its finance, citing the resulting inflation as the main reason any person should “get out of fiat money and get into Bitcoin.”

BTC Going to zero

Not everyone is, however, as bullish when it comes to Bitcoin as Morehead is. Goldbug Peter Schiff is also extremely concerned about the effects of money printing the US has done. He predicts that “The US is about to experience one of the greatest inflationary periods in the history of the world.”
However, he isn’t fond of Bitcoin and says that an asset with no intrinsic value will eventually go to $0. He suggests that people move their funds into gold and other precious metals.

Inflated prices 

Despite widespread fears over USD inflation, many experts actually predict that consumer prices will go into a period of deflation.
However, many believe the inflation is, at the moment, actually hidden in asset prices rather than consumer prices.
Pantera Capital revealed a simple investment strategy it has when it comes to non-fiat assets:
“Stay long on crypto until schools and daycares open. Until then, the economy won’t function properly and money will be continuously printed.”

Categories
Forex Videos

The End Of The Retail Forex Trader?


Is the Forex market creaking at the seams?


Retail forex traders take for granted, or do not know, or simply forget, that the retail sector of this market is derived from and only operates on the back of the institutional foreign exchange market place, where currencies are physically sold and bought, and need to be electronically delivered, on behalf of their institutional accounts and where these trades are growing again after a short period of decline to over $6.6 trillion in value per day in spot FX and the forward FX market.

If not for the continual success of the institutional forex market, there would be no retail market, where retail traders trade on the difference in price, contracts for difference or spread betting, and do not take physical delivery of the currencies they trade in.

In 2002, under the direction of the Federal Reserve, a company called CLS group which stands for continuous linked settlement was formed to act as the middleman in a large and ever-growing portion of institutional forex trades and where it was their role to authenticate and match trades to ensure that correct currencies or payments are placed into correct accounts.

CLS has prepared a report which was recently published by the global FX committee, or GFXC,  which was set up in 2017 as a forum for bringing together central Banks and private sector participants with the aim to promote a bus fare liquid open and appropriately transparent foreign exchange.

CLS is set up to deal in 18 currencies, most of which are from major economies. In the report, the chief executive, Marc Bayle de Jesse, mentioned a worrying statement, and I quote, ‘’ given the way in which FX trading has evolved, we have to think of additional ways to solve the problems of systemic risk’’.

He added that the market had previously seen payment failure in 1974 when Herstatt Bank in Germany, which was a privately owned bank in the city of Cologne, failed in the delivery of German Deutsche marks and US Dollars in a forex transaction because of time zone differences between Germany and the USA. This, coupled with the fact that they had made losses in betting against the dollar, caused the bank to be put into administration. The knock-on effect was significant, where the counterparty banks did not receive their US dollar payments.

Other entities, such as the bank for international settlements and GFXC themselves, have also expressed potentially very significant risks due to the amounts involved.

And while the payment cost of some clearinghouses is deemed to be expensive, some banks and institutions prefer to settle FX trades directly with their trading counterparts based on trust.

With the forex market growing and where emerging economies will be relying more and more on foreign exchange transactions, it is worrying to see that major clearinghouses are worried that there could be a breakdown in settlements  If this were to happen on large transactions it could cause utter panic in the foreign exchange markets, with a possibility of a halt in market makers offering liquidity to the market, this could cause a spill over into the retail market with disruption to pricing, liquidity and even temporary suspension in trading. As if retail traders didn’t have enough to worry about! Let’s hope those clever people in clearing can develop extra fail-safe mechanisms to protect international settlements.

Categories
Forex Market Analysis

Daily F.X. Analysis, August 12 – Top Trade Setups In Forex – Stronger Dollar Continues to Play! 

On the news side, the eyes will remain on the UK GDP and U.S. CPI figures. U.S. inflation is expected to drop, and it can impact the U.S. dollar negatively. Conversely, the UK GDP figures are anticipated to have improved, but the prelim GPD seems to perform badly. A mixed response can be seen in news releases.

Economic Events to Watch Today  


EUR/USD – Daily Analysis

The EUR/USD pair was closed at 1.17393 after placing a high of 1.18078 and a low of 1.17217. Overall the movement of the EUR/USD pair remained flat throughout the day. 

In the first session of Tuesday, EUR/USD pair took bids and surged above 1.18050 level, but after the release of U.S. economic data, the EUR/USD pair started to decline and posted losses. The pair ended its day on the same level it started its day with and hence, gave a smooth movement throughout the day.

The fresh risk appetite droved the rise in the EUR/USD pair amid the registration of the first coronavirus vaccine from Russia. Russia became the first country to register its vaccine for coronavirus, and this news gave a push to heavy risk appetite in the market.

The stock markets rushed to their higher level on this news, and the riskier currency Euro also gained from it in the early trading session. The gains continued after the release of macroeconomic data from the European side.

At 14:00 GMT, the ZEW Economic Sentiment for Eurozone in August surged to 64.0 against the expected 55.3 and supported the single currency. The ZEW Economic Sentiment for Germany surged to 71.5 from the anticipated 57.0 and supported Euro. The better than expected economic sentiment for the month gave strength to a single currency and pushed EUR/USD pair above 1.18050 level.

However, the gains could not last for long as the U.S. President Donald Trump announced that he was very seriously considering a capital gains tax cut to help job creation. If Trump gave another executive order on capital taxation, it would likely face legal challenges as it would push the boundaries of the President’s executive orders.

Daily Technical Levels

Support Pivot Resistance
1.1704 1.1756 1.1790
1.1670 1.1842
1.1618 1.1876

EUR/USD– Trading Tip

The EUR/USD pair is trading at 1.1720 level, testing the triple bottom support level of 1.1714 level. Closing of candles below 1.1710 level can drive more selling in the pair until 1.1639 level. On the higher side, the EUR/USD pair may find resistance at 1.1793 level. Three black crows on the 4-hour timeframe are suggesting odds of selling trend continuation in the EUR/USD.


GBP/USD – Daily Analysis

The GBP/USD pair was closed at 1.30470 after placing a high of 1.31318 and a low of 1.30413. Overall the movement of GBP/USD pair remained bearish throughout the day. The GBP/USD pair dropped on Tuesday and posted losses as the unemployment benefits claims surged in the local country and also because of the strength of the U.S. dollar onboard.

At 04: 01 GMT, the BRC Retail Sales Monitor from Great Britain surged to 4.3% from the expected 2.5% and supported British Pound. At 11:00 GMT, the Claimant Count Change for July rose to 94.4K from the expected 9.7K and weighed heavily on British Pound. The Unemployment Rate from the U.K. came in as 3.9% in June and fell short of expectations of 4.2% and supported GBP.

The most important data on Tuesday was the clamant count change from the U.K. that showed that more people applied for unemployment benefits in July. According to the Office of National Statistics, around 730,000 people have become unemployed since March this year, and since June, further 114,000 people have lost their jobs.

However, the jobless rate remained flat at 3.9% in June; this reflected that the number of people who had given up looking for work increased.

The ONS Deputy national statistician, Jonathan Athow, said that the labor market had continued its recent fall in employment and significantly reduced work hours because many people were furloughed.

The people without a job and those who were not even looking for a job but wanted to work increased as the demand for workers was depressed.

It is also believed that the full extent of Britain’s’s job problems has been hidden under the Government’s furlough scheme, which promised to cover 80% of the salaries of workers who could not work due to lockdown.

Daily Technical Levels

Support Pivot Resistance
1.3016 1.3074 1.3107
1.2983 1.3165
1.2925 1.3197

GBP/USD– Trading Tip

On Tuesday, the GBP/USD consolidates at 1.3067 level, holding right above the 50 periods EMA support area of 1.3040 level while the bearish breakout of 1.3040 level can extend selling unto 1.2918 level. Recently as we can see in the chart above that the GBPUSD pair has violated its upward trendline that supported the pair around 1.3130 level, and now below this, we can expect GBP/USD to continue trading bearish. The GBP/USD should show a bearish crossover to confirm a strong selling bias in the Cable. On the higher side, Sterling may find resistance at 1.3105 and 1.3175. Let’s consider selling below 1.3045 level today. 


USD/JPY – Daily Analysis

The USD/JPY pair was closed at 106.491 after placing a high of 106.682 and a low of 105.870. Overall the movement of the USD/JPY pair remained bullish throughout the day. The USD/JPY pair extended its previous day gains and rose for the 3rd consecutive day on Tuesday amid increased risk appetite in the market. The Russian vaccine, U.S. Stimulus package, Trump’s executive orders, and the rise of the equity market drove Tuesday’s move of USD/JPY pair.

In the early session of Tuesday, the President of Russia, Vladimir V. Putin, announced that the Russian government had approved the world’s first coronavirus vaccine. Putin said that his daughter had taken the vaccine in a cabinet meeting, and it has worked adequately enough to declare it safe.

However, global health authorities have said that the vaccine has to complete the last stage of clinical trials to be approved. Despite this, Mr. Putin thanked the scientists in a congratulatory note to the nation who developed the vaccine. He also said that it was “the first” very important step for Russia and generally for the whole world.

Scientists in Russia and other countries said that rushing to offer the vaccine before final-stage testing could backfire. Tens of thousands of people are included in the final stage of trials, and it could take months to prove its effectiveness.

However, investors cheered the news of the vaccine as it was long-awaited, and as in result, the risk appetite of the market rose. The equity markets surged that weighed on the safe-haven Japanese Yen, which ultimately pushed the USD/JPY pair higher, which keeps challenges the upbeat market tone. In the meantime, the White House National Security Adviser Robert O’Brien blamed China while saying that the “Chinese hackers have been targeting U.S. election infrastructure ahead of the 2020 presidential election.” These gloomy updates capped further upside in the currency pair by giving support to the safe-haven Japanese yen.

As a result of the upbeat U.S. data, the broad-based U.S. dollar succeeded in gaining some positive traction on the day. Still, the bullish bias in the U.S. dollar is expected to be short-lived as doubts remain about the U.S. economic recovery amid on-going coronavirus cases. However, the gains in the U.S. dollar became the key factor that kept the currency pair higher.

Daily Technical Levels

Support Pivot Resistance
106.0400 106.3700 106.8200
105.5900 107.1500
105.2600 107.6000

USD/JPY – Trading Tips

The USD/JPY trades sharply bullish to break out of the sideways trading range of 106.480 – 105.440. Bullish crossover of 106.480 level is opening further room for buying until 107.450 level. The RSI and MACD are also supporting bullish bias in the pair. A recent bullish breakout of 106.450 level can extend the buying trend until 107.390. The current market price of USDJPY is staying over 50 EMA, which extends support at 105.950 and may push the pair higher. Let’s consider buying above 106.480 level today. Good luck! 

Categories
Forex Options

FX Options Market Combined Volume Expiries for 12h August 2020

Thank you for visiting the Forex Academy FX Options market combined volume expiries section. Each day, where available, we will bring you notable maturities in FX Options of amounts of $100 million-plus, and where these large combined maturities at specified currency exchange rates often have a magnetic effect on price action, especially in the hours leading to their maturities, which happens daily at 10.00 AM Eastern time. This is because the big institutional players hedge their positions accordingly. Each option expiry should be considered ‘in-play’ with a good chance of a strike if labelled in red, still in play and a possible strike if labelled in orange and ‘out of play’ and an unlikely strike if labelled in blue, with regard to the likelihood of price action meeting the strike price at maturity.

…………………………………………………………………………………………………………

FX option expiries for Aug 12 NY cut at 10:00 Eastern Time, via DTCC, can be found below.

– USD/JPY: USD amounts

  • 105.75 365m
  • 106.00 620m

USDJPY is in a bull trend but overbought and may see a pullback before the next move to 107.00 and beyond. The current option expiries are out of play.

– NZD/USD: NZD amounts

  • 0.6525 1.0bn
  • 0.6600 285m

NZDUSD is consolidating after a bearish push lower and finding support at 0.6538 with a possible retest of this area and a breach to this will leave the door open for the option expiry.

………………………………………………………………………………….

As you can see on the preferred 1-hour chart(s), we have also plotted the expiration levels at the various exchange rate maturities and we have also labelled in red, orange and blue.  Therefore, if you see option expiry exchange rates labelled in red these should be considered in-play, because we believe there is a greater chance of the expiry maturing at these levels based on technical analysis at the time of writing. There is still a lesser possibility of a strike if they are in orange and so these are ‘in-play’ too. However, if we have labelled them in blue, they should be considered ‘not in-play’ and therefore price action would be unlikely to reach these levels, which are often referred to as Strikes, at the time of the 10 AM New York cut.

Our technical analysis is based on exchange rates which may be several hours earlier in the day and may not reflect price action at the time of the maturities. Also, we have not factored in economic data releases or keynote speeches by policymakers, or potential market volatility leading up to the cut.

Although we have added some technical analysis, we suggest you take the levels and plot them onto your own trading charts and incorporate the information into your own trading methodology in order to use the information to your advantage. Remember the higher the amount, the larger the gravitational pull towards the exchange rate maturity at 10:00 AM Eastern time.

 If you want to learn how forex option expiries affect price action in the spot FX market see our educational article by clicking here: https://bit.ly/2VR2Nji

DISCLAIMER: Please note that this information is for educational purposes. Also, the maturities will look more or less likely to become a strike at 10 AM NY time due to exchange rate fluctuations resulting in a different perspective with regard to technical analysis, and also due to upcoming economic data releases for the associated pairs.

Categories
Crypto Market Analysis

Daily Crypto Review, August 12 – Crypto Selloff Brings Bitcoin to $11,000 Mark; What’s Next?

The cryptocurrency market was in the red in the past 24 hours, with most altcoins’ prices falling down over 5%. Bitcoin is currently trading for $11,375, which represents a decrease of 4.05% on the day. Meanwhile, Ethereum lost 4.84% on the day, while XRP lost 7.59%.

 Daily Crypto Sector Heat Map

When talking about top100 cryptocurrencies, Compound gained 31.08% on the day, making it the most prominent daily gainer. Swipe (16.13%) and Maker (12.37%) also did great. On the other hand, Band Protocol lost 16.42%, making it the most prominent daily loser. It is followed by yearn.finance’s loss of 14.86% and Nervos Network’s loss of 14.41%.

Top 10 24-hour Performers (Click to enlarge)

Bottom 10 24-hour Performers (Click to enlarge)

Bitcoin’s dominance level has increased slightly since we last reported, with its value currently at 61.39%. This value represents a 0.17% difference to the upside when compared to yesterday’s value.

Daily Crypto Market Cap Chart

The cryptocurrency market cap experienced a major decrease in value since we last reported. Its current value is $345.60 billion, which represents an increase of $7.98 billion when compared to yesterday’s value.

_______________________________________________________________________

What happened in the past 24 hours?

_______________________________________________________________________

_______________________________________________________________________

Technical analysis

_______________________________________________________________________

Bitcoin

Bitcoin experienced a large selloff as a result of bulls failing to successfully break the $12,000 mark. The largest cryptocurrency by market cap fell to $11,090 support level before rallying slightly to $11,400 levels. However, Bitcoin might have another bullish move as the RSI is dangerously close to the oversold territory while the volume is high, and since the $11,090 support level held up nicely, Bitcoin confirmed it almost certainly will not go below.

BTC traders should look for an opportunity when BTC makes another move towards the upside and breaks $11,460.

BTC/USD 4-hour Chart

Technical factors:
  • Price is currently below its 50-period EMA, as well as its 21-period EMA
  • Price is above its lower B.B
  • RSI is near the oversold territory (35.52)
  • Volume is decreasing from above-average levels
Key levels to the upside          Key levels to the downside

1: $11,460                                 1: $11,090

2: $11,630                                 2: $10,850

3: $12,000                                  3: $10,500

Ethereum

Ethereum also experienced a selloff, partly because of not being able to go past $400 and partly because of Bitcoin’s move towards the downside. The price broke the triangle formation to the downside (as we said in the previous article) as there was not enough pressure for it to get past the $415 mark. The second-largest cryptocurrency by market cap tested the $361 support, which held up nicely and did not let ETH fall below. Ethereum is now at the $375 mark and is showing no signs of dropping further below.

Traders should look for a trade opportunity when Ethereum makes a bounce towards the upside or falls below $361.

ETH/USD 4-hour Chart

Technical Factors:
  • Price is below its 21-period EMA and its 50-period EMA
  • Price is at its bottom B.B.
  • RSI is near the oversold territory (33.99)
  • Volume is average
Key levels to the upside          Key levels to the downside

1: $400                                     1: $361

2: $415                                     2: $340

3: $496                                      3: $302

Ripple

XRP was no different than Bitcoin and Ethereum in terms of the direction of its movement throughout the day, but it did differ in terms of intensity of the move. The third-largest cryptocurrency by market cap lost over 8% of its value at one point, as bears took over the market when XRP couldn’t break $0.31. The price fell to as low as $0.266 but quickly recovered to its current position ($0.278).

Traders can look for an opportunity to trade after XRP breaks $0.285.

XRP/USD 4-hour Chart

Technical factors:
  • Price is below its 21-period and 50-period EMA
  • Price is slightly above its bottom B.B.
  • RSI is near the oversold territory (35.64)
  • Low volume (slightly increased)
Key levels to the upside          Key levels to the downside

1: $0.285                                    1: $0.266  

2: $0.31                                     2: $0.245

3: $0.32                                    3: $0.235


Categories
Forex Assets

How Expensive Is It To Trade The NZD/MYR Currency Pair

Introduction

The abbreviation of NZD/MYR is the New Zealand Dollar paired with the Malaysian Ringgit. Here, NZD is the official currency of New Zealand and many others like the Pitcairn Islands and the Cook Islands. It is also to be the tenth most traded currency in the Foreign exchange market. MYR stands for the Malaysian Ringgit, and it is the official currency of Malaysia, which is further divided into 100 sens.

Understanding NZD/MYR

In NZD/MYR currency pairs, NZD is the base currency (First Currency), and the MYR is the quote currency (Second Currency). In the foreign exchange market, while we sell the currency pair, we always trade the base currency and simultaneously purchase the quote currency and vice versa. The market value of NZD/MYR helps us to understand the intensity of MYR against the NZD. So if the exchange value for the pair NZD/MYR is 2.7977, it means we need 2.7977 MYR to buy 1 NZD.

Spread

Foreign brokers hold two different prices for currency pairs: the ask and bid price. The ask (offer) price is the price in which we sell an asset, and bid(purchase) is the cost at which we buy it. The difference between the ask-bid price is called the spread. Below are the spread values for the NZD/MYR Forex pair.

ECN: 38 pips | STP: 43 pips

Fees

A Fee is the costs that we tradesmen pay to the broker for initiating a trade. This fee differs on the type of broker (ECN/STP) we use.

Slippage

When we want to achieve a trade at an appropriate price, but instead, if the trade gets fulfilled at a distinctive price, we call that distinction as Slippage. The Slippage can occur at any point in time, but often we can counter a volatile market.

Trading Range in NZD/MYR

As a trader, our main interest should be to prevent losses and minimize risks. The trading range here will ascertain the amount of income we will make or lose within a timeframe. ATR is a technical indicator that suggests the price movement in a currency pair. In the lower table, we have the interpretation of the minimum, average, and maximum pip movement in a currency pair. We will assess it merely by using the ATR indicator merged with 200-period SMA.

Procedure to assess Pip Ranges

  1. Add the ATR indicator to your chart
  2. Set the period to 1
  3. Add a 200-period SMA to this indicator
  4. Shrink the chart so you can assess a large time period
  5. Select your desired timeframe
  6. Measure the floor level and set this value as the min
  7. Measure the level of the 200-period SMA and set this as the average
  8. Measure the peak levels and set this as Max.

NZD/MYR Cost as a Percent of the Trading Range

The price of trade differs on the type of brokers and varies based on the volatility of the market. The full cost of trade involves fees, spread, and sometimes Slippage if the volatility is higher.

ECN Model Account

Spread = 38 | Slippage = 5 |Trading fee = 8

Total cost = Slippage + Spread + Trading Fee = 5 + 38 + 8 = 51 

STP Model Account

Spread = 43 | Slippage = 5 | Trading fee = 0

Total cost = Slippage + Spread + Trading Fee = 5 + 43 + 0 = 48

The Ideal way to trade the NZD/MYR

With the assistance of the above tables, let us estimate these two factors to the trade the NZD/MYR pair. Volatility and cost are two aspects a trader must contemplate for trading any currency pair in the foreign exchange market.

In several timeframes, we can see the pip movement is tremendously elevated between the min volatility and the avg volatility. As a day trader, the objective is to attain profits from the pip variation of the market. It becomes challenging to make profits from the market if there is no variation in the pip value. Hence, trading this pair can be considered both profitable and risky. The answer to the question if trading this pair is expensive, is yes.

Trading using Limit Orders (STP Account Model)

To decline our expenses of trade, we can place the trades using limit orders as a substitute for market orders. In doing so, we can avoid the Slippage that will help lower the total cost of the trade. An instance of a Limit order is given below using the STP model.

Spread = 43 | Slippage = 0 | Trading fee = 0

Total cost = Slippage + Spread + Trading Fee = 0 + 43 + 0 = 43

Categories
Forex Price Action

Equidistant Channel: An Excellent Price Action Trading Tool

In today’s lesson, we are going to demonstrate a trade setup with Equidistant Channel. Price action traders rely on Equidistant Channel a lot. It is one of the best price action trading tools. However, Forex traders’ life is not as easy as it seems. Like other trading tools, Equidistant Channel needs adjustment. To be able to do that traders need enough knowledge and experience. Let us now proceed to find out what a trader may need to do to make it work for him.

To draw the equidistant channel, we need to find out at least four points. Two swing highs and two swing lows are the best combinations. It works with three swing highs and one swing low or vice versa. In the chart above, we have two swing highs and two swing lows. In naked eyes, it seems that we will be able to draw an equidistant channel here.

We have drawn an equidistant channel. The price is now at the resistance. Some traders go long from here. Ideally, to get a good risk-reward, traders should wait for the price to go at the level of resistance and produce a bearish reversal candle to go short in the pair. Let us find out what happens next.

The chart does not produce a bearish reversal candle. It breaches the level instead. It means this is not a valid equidistant channel anymore. The sellers must be disappointed. What do you think is there any twist in the tail?

The chart makes the new lowest low. It gives three swing highs and one swing low. It means we can draw another equidistant channel. Look at the above chart where the price getting a bounce at the level of support. The price again heads towards the North. Traders may wait for the price to get a rejection at the level of resistance and produce a bearish reversal candle to go short in the pair again.

Here it comes. The level of resistance produces a bearish engulfing candle right at the level of resistance. Traders may trigger a short entry right after the last candle closes. To set take profit, they may use the level of equidistant support. The price often keeps going down with a down-trending equidistant channel. However, the best practice is closing down the trade at the first bounce in case of down-trending equidistant channel trading. Let us find out how the trade goes.

The price hits take profit level like a rocket. Some may regret that they should hold the position and close it manually. Do not forget the rule of sticking with the rule in forex trading. We have seen that the chart does not produce a signal on the first occasion. It rather breaches and lets traders draw another equidistant channel. Yes, it does offer an excellent entry for the sellers too.

Categories
Forex Fundamental Analysis

What Is ‘GDP from Mining’ and What Should You Know About This Economic Indicator?

Introduction

The tracking of GDP from Mining can give us many economic conclusions. GDP from Mining’s importance comes from the fact that the final output of Mining Production is the primary input for many industries. Therefore, it is the core part of the business activity related to many industries.

Fluctuations in the GDP from Mining data will eventually translate to all the industries that are dependent on Mined resources for their production process. This effect can be many-fold, and hence it is a vital economic indicator for investors, economists, and government authorities.

Mining Production

It refers to the entire process of searching for, extraction, beneficiation (purification), and processing of naturally occurring minerals from the Earth. Minerals that are typically mined can be Coal, metals like Copper, Iron, Zinc, or industrial minerals like limestone, potash, and other crushed rocks.

Coal is considered as one of the primary sources of energy across the world. Metals like Iron, Bauxite, and Copper have a wide range of usage in various industries. Limestone and other rocks are being used in cement industries, which contribute a lot to the construction and related industries.

How can the GDP from Mining numbers be used for analysis?

The developing economies are primarily achieving their growth through exports of essential commodities like Food, Minerals, etc. For example, Australia primarily exports Iron Ore and Coal, due to which the economic growth and currency value are tightly linked to the Mining of these natural resources. When the GDP from Mining starts to recede, currency devaluation and slowing economic growth are inevitable.

Developed economies are more resilient to changes in GDP from Mining, as their growth is tied to multiple sectors and are not heavily dependent on any individual sector. The availability of modern technology and skilled labor contribute to the GDP from Mining figures positively. Mining is a labor-intensive task. Hence, it is obvious that Mining lies at the heart of all industrial activities. A decrease in GDP from Mining can adversely affect all the dependent industries, and correspondingly the effects will pass onto unemployment, layoffs, wages, economic slowdown, etc.

Impact on Currency

The GDP from Mining is a low impact indicator, as the Mining Production reports are published monthly by the Federal Reserve in the United States that are leading indicators. It is a proportional and lagging indicator. Hence, changes in GDP from Mining would have already been priced into the market through monthly Mining Production reports.

Also, GDP from Mining numbers does not give us a complete picture of the economy. However, it can be an important tool for the Central Authorities to keep track of the performance of the Mining Sector and its implications for the economy. As established, the Mining Sector is a significant contributor, due to many industries dependent on its output.

Hence, changes in this sector widely affect the overall economic health, and all the dependent industries therein. In general, Higher GDP from Mining is good for the economy and its currency, and vice-versa.

Sources of GDP from Mining

For the US, the BEA reports are available here – GDP -BEAGDP by Industry – BEA. For the world data below, two are useful references – Mineral Rents  – World % of GDPGDP from Mining – Trading Economics. The monthly Mining Production statistics can be found on the official website of the Federal Reserve for the United States, which can be found here – G7 Industrial Production and Capacity Utilization

GDP from Mining Announcement – Impact due to news release

Mining is an extremely important economic activity in any country. The benefits of Mining have been widely promoted by the industry and institutions such as the World Bank. In several low and middle-income countries rich in non-fuel resources, Mining makes significant contributions to the national economic development as measured by the Mining Contribution Index (MCI-Wr).

The contribution of Mining and Minerals to GDP reached a maximum at the peak of the mining boom in 2011. Now, the figures indicate a decline in the Mining’s contribution but are still considerably higher than before. This is one of the reasons why it not a major determinant of economic growth. Thus, investors do not give importance to the mining data when it comes to investing in an economy.

In today’s lesson, we will try to examine the impact of GDP on various currency pairs and see the volatility change due to the news release. The below snapshot shows the previous, predicted, and actual GDP data of Switzerland released in the month of March. As this is the quarter on quarter GDP data, we can expect moderate to high volatility in the currency during the announcement.

GBP/CHF | Before the announcement

Let’s review the GBP/CHF currency pair to observe the impact of the news release. We see that the market has made a ‘descending triangle‘ candlestick pattern before the news announcement, which essentially is a trend continuation pattern. Depending on the impact of the news release, we will take a suitable position in the currency pair.

GBP/CHF | After the announcement:

After the news announcement, we see a sudden surge in the price indicating bullishness in the currency. The bullish ‘news candle’ suggests a negative reaction to the GDP data as it was on expected lines with no major increase or decrease. The market appears to have broken above the ‘descending triangle’ pattern, which is why we should need to wait for clear signs from the market with respect to the direction it is heading.  

CAD/CHF | Before the announcement

CAD/CHF | After the announcement

The above images represent the CAD/CHF currency pair, where we see that the market seems to be in a downward channel before the news announcement with the price at the bottom of the channel. Since the impact of GDP is high, there is a high chance that the news release could result in a break down if the data comes out to be weak for the economy. Therefore we need to wait for confirmation from the market before we can take a trade.

After the news release, the price moves higher and volatility increases on the upside. Since the GDP data was pretty much equal to the forecasted number, it did not result in bullishness in the currency, and it ultimately weakened the currency for a while. One who takes a ‘buy’ trade should take profits at the top of the channel and not wait for too long. 

AUD/CHF | Before the announcement

AUD/CHF | After the announcement

The above charts belong to the AUD/CHF currency pair, where we see that before the news announcement, the market is moving within a ‘range.’ This means the price is not moving in any single direction, which can make trading a bit challenging in such an environment. The news release can effectively move the market in any direction, which is why we need to wait for the announcement to happen in order to get clarity.

After the news release, the price moves lower, but this gets immediately bought, and the ‘news candle’ closes with a wick on the bottom. We witness buying pressure in the market soon after the news release. we to be cautious before taking a ‘long’ position since the price is at the top of the ‘range.’ All the best!

Categories
Forex Basic Strategies

Forex Momentum Trading With The Help of RSI & MA Indicators

Introduction

If you are a trader, you should have some good ideas about the forex market. After having the basic knowledge and related stuff, you, as a trader, need to find a profitable forex strategy. After that, you need to find a proven track record of your strategy.

Therefore, you can easily implement it and start earning through your trades within a short time. However, it would help if you kept in mind that the forex is an uncertain and unstable trading market. Therefore, you must have a profitable and excellent trading strategy if you want to sustain here.

If you search on the internet, you will find thousands of proven strategies out there. The good thing is that experienced traders or mathematicians have created most of the strategies. You have to choose the best one for you.

However, the momentum-based strategy is profitable and famous too. Lots of traders are using this one as their primary trading strategy. However, if you find another suitable strategy, you can go for it besides the momentum trading strategy to boost your probability.

What is The Momentum Trading Strategy?

Momentum is a term that refers to buying a currency pair when it goes up and selling when it goes down. It is a very popular trading strategy among most professional traders.

When a big volume starts a movement, it creates a reliable market trend. Therefore, market momentum will be towards the trend that we can identify by reading the chart. In a strong bullish momentum, the price will aggressively create higher highs with a constant speed.

Similarly, in a strong bearish momentum, the price will create lower lows. After identifying the market momentum, we will move to one timeframe lower to take the trade.

However, forex trading always has an uncertain environment. No one can guarantee a 100% movement of price. However, when the market is in a trend, we can make a decent profit by using the momentum-based trading strategy.

Momentum Trading Strategy

Here is the most important part that you are looking for passionately. You will find the best momentum trading strategy for both the newbie and experienced traders. This guideline will answer all your queries.

Let’s have a look at the step by step approach of the momentum trading strategy.

Select the Currency Pair

First, you need to determine the price change from the last three months of some selected currency pairs. Also, don’t forget to do this calculation for the weekend. Once you find the last three months’ price changes, you need to research the last 13 weeks’ price movement.

In terms of currency pair, there is no clear indication of how much pair you should choose. Nevertheless, the ideal and wise option is to go through seven major currency pairs and cross pairs. It is better to put less importance on exotic pairs as they are risky because of their volatility.

After calculating the last three months’ price changes, it’s time to select the currency pair that moved much more than the others. As it is a proven profitable trading strategy, a currency pair can provide a 17% average annual profit. As per the last seven years of market observation, three months’ price has become a reliable factor while selecting the momentum-based strategy.

Entry

As we have a predetermined trend, you need to implement a trend continuation trading strategy to improve your overall trading result better. Moreover, many trend continuation strategies are there for you; you need to select a suitable one. In this trading strategy, we will use 20 Dynamic Exponential Moving Average (EMA) as a trend continuation indicator.

You should enter the trade towards the direction based on market momentum once the price rejects the 20 EMA with its body. Moreover, there is a good and effective solution for determining the trends’ strength: RSI. RSI is a good indicator, as well.

RSI stands for the Relative Strength Index. It has a 0-100 levels indicator. If the price goes below 30 levels, the price is likely to reverse towards the upside. On the other hand, if the price moves above the 70 RSI, it is likely to move down.

For a sell trade follow the following condition:

  • The price is moving towards the direction set in the market momentum.
  • The RSI is moving down from the 70 or 80 levels.
  • Price rejects the 20 EMA with a reversal candlestick formation.

Similarly, for a buy trade follow the following condition:

  • The price is moving towards the direction set in the market momentum.
  • The RSI is moving up from the 20 to 30 levels.
  • Price rejects the 20 EMA with a reversal candlestick formation.

Later on, enter the trade as soon as the candle closes above or below the dynamic level.

Stop Loss and Take Profit

After taking a trade, you need to determine the strength of the trend. You can set the stop loss 15 pips above or below the reversal candle or 20 days Average True Range (ATR).

To set the take profit, you need to determine how strong the running trend is. Moreover, impulsive pressure will indicate that the price may break the near-term support or resistance level. In that case, you can increase your take profit level. Alternatively, you can book some profit once you see the price stalling at the support or resistance levels.

Summary

In a nutshell, the summary of the entire guideline is here-

  • Find out the direction by calculating the last 13 weeks of market momentum.
  • Follow the market direction using a dynamic and hourly candle level of 20 EMA with a proper candlestick pattern.
  • According to the price action or ATR, set your stop-loss.
  • Following the market movement, you can set your take profit.

In this momentum trading strategy, trade management is the most challenging part as it requires to follow the market trend strongly. Since we know the forex market is uncertain, we should follow the market trend robustly. Moreover, you should follow an appropriate money management system that goes with your personality, and for each trade, it is wise to take less than 2% risk.

Categories
Forex Education

Starting to Build a Trading System

Introduction

A trading system is a set of rules to enter and exit a financial market without human intervention. It could also generate entry signals even when the discretionary trader could not enter the market. However, what should be the first step to create and design a trading system? In this educational post, we will review how to start to create a trading system.

Getting Started

Similarly to any business project, a trading system starts with an idea. This idea could arise from different sources, such as seminars, forum conversations, or specialized magazines, among other sources. 

Once the idea is defined, the developer should create a conceptual model of the trading system, where the developer should describe the basic criteria the system should include. After this process, the programming task must incorporate the following rules:

  • An entry method, 
  • The exit criteria, and
  • The money management formula.

The exit criteria must contain rules corresponding to “risk management” as the initial stop loss level, the final stop or a trailing stop rule, the exit profit target level, and how much money will risk in each trade. Also, they must contain “money management” rules as the position size on each trade. In other words, the system developer must consider that a viable trading system should provide an adequate risk and money management criterion.

The next question to address is, what timeframe should be traded? In general, retail traders tend to think that intraday trading involves less risk than swing trading. However, as the Dow Theory states, the primary trend tends to prevail over the secondary and minor trends. In this context, an intraday trading system might require more monitoring than a swing trading system.

Once a timeframe to trade is chosen, the next decision is what market to trade? The market to trade should be determined in terms of its liquidity and volatility. The systematic investor should consider which liquidity and volatility fit best the trading system so that orders sent to the market hold the needed volatility to ensure a movement in an adequate time lapse.

The Importance of Data Provider

Once the systematic investor chose the market to trade, the developer must define which market data provider will be used by the system to perform market analysis/testing and trade execution. 

A market data provider without a trustable price data could drive the system investor toward problems in the trading system execution, such as in the orders execution process. For instance, Jaekle and Tomasini, in their work, comment that the most popular commodities data providers are CSI (www.csidata.com) and Pinnacle (www.pinnacledata.com); however, both the trading system investor and system developer must evaluate which data provider is best for the market to be traded.

Conclusions

In this educational article, we presented the firsts steps to build a trading system, which, as any business project, starts with an innovative idea or is the result of the investor’s creativity. Once the conceptual model is developed and the programming tasks completed, the trading developer must evaluate and validate the trading system, through back and forward tests analysis, before using real money. This stage will be presented in the next educational article.

 Finally, the following figure summarizes the process of developing a trading system.

Suggested Readings

  • Jaekle, U., Tomasini, E.; Trading Systems: A New Approach to System Development and Portfolio Optimisation; Harriman House Ltd.; 1st Edition (2009).
Categories
Forex Market Analysis

Daily F.X. Analysis, August 11 – Top Trade Setups In Forex – Stronger Dollar In Play! 

On the news front, the economic calendar is a bit light and may not be offering any major economic release. Therefore, we need to trade based upon stronger dollar sentiment, as traders are likely to price better than expected NFP data from last week.

Economic Events to Watch Today  


EUR/USD – Daily Analysis

The EUR/USD pair was closed at 1.17363after placing a high of 1.18005 and a low of 1.17358. Overall the movement of the EUR/USD pair remained bearish throughout the day. The EUR/USD pair extended its previous day’s losses on Monday amid the strong U.S. dollar and increasing US-China tensions. The main driver of the EUR/USD pair on Monday was the U.S. dollar.

The U.S. Dollar was strong across the board with the U.S. Dollar Index at 93.5 level, with investors taking comfort from President Donald Trump’s move to boost the economy in the wake of coronavirus pandemic.

Over the weekend, U.S. President Trump signed a series of executive orders aimed at enhancing the economic condition. The orders included an extension of expanded jobless benefits at a lower rate of $400 a week. It was down from the previous $600 a week. The State government will pay 1/4th of the bill, which was also included in Trump’s order.

However, it is not clear that the executive orders can withstand court scrutiny as the power relies on Congress. Nevertheless, the President’s orders were an attempt to play his part in breaking the impasse. Though the talks between Republicans & Democrats on August 7 broke some of the differences, they still did not show any consensus. The new round of talk is expected to resume at some point, but the date is not yet confirmed.

The chances for a $3 trillion stimulus package have been compromised to $2 trillion by Democrats, but that is still a trillion more than the framework that the ruling party aimed for. Additionally, the JOLTS Job Openings data from the U.S. on Monday came in as 5.89 M in June in comparison to 5.30M of forecasts and supported the U.S. dollar that weighed on EUR/USD pair.

From the Europe side, the Sentix Investor Confidence for August dropped to -13.4 from the anticipated -16.0 and the previous -18.2 and supported Euro that kept the losses of EUR/USD pair limited on Monday.

Meanwhile, early on Monday, the Defence Ministry of Taiwan said that a Chinese jet fighter crossed the median of the Taiwan Strait line, possibly in response to the U.S. Health Secretary Alex Azar’s visit to Taipei.

Any form of American recognition of the island nation Taiwan that China claimed its own make Beijing angry, and hence, it responded. The tensions in Taiwan have grown since the Hong Kong clash between the U.S. & China.

Besides this, the world’s biggest nations are also clashing over the technological front; recently, the U.S. banned American firms from dealing with TikTok and WeChat app. However, the most important matter between both countries lies with the fulfillment of the phase-one trade deal. Negotiators from both sides are scheduled to meet this week to analyze the achievements of the deal. The risk-off market sentiment was picking its pace after the escalation of US-China tensions, and it has weighed on the riskier pair EUR/USD.

Daily Technical Levels

Support Pivot Resistance
1.1713 1.1758 1.1780
1.1691 1.1825
1.1646 1.1848

EUR/USD– Trading Tip

The single currency Euro slipped against the U.S. dollar amid increased USD demand as traders started to price in stronger than expected NFP data released on Friday. The EUR/USD is now bouncing off the support level of the 1.1728 level. It may head higher towards 23.6% Fibonacci retracement level of 1.1768, and above this, the next resistance can stay at 1.1765 level, which marks 38.2% Fibonacci retracement level.


GBP/USD – Daily Analysis

The GBP/USD pair was closed at 1.30730 after placing a high of 1.31032 and a low of 1.30188. Overall the movement of GBP/USD pair remained bullish throughout the day. The GBP/USD pair rose on Monday ahead of key data due later this week, despite the U.S. dollar’s strength. The risk sentiment favored some of the factors, and investors believe that further upside could be on the horizon.

The latest higher move in the Pound was because of the key economic data, including the update of the labor market and second-quarter GDP scheduled to be released later this week. Moreover, the GBP/USD pair was also supported by the improving risk sentiment in the market after the hopes about the US-China phase-one trade deal became optimistic.

The U.S. trade representative and U.S. Treasury Secretary will meet the Chinese Vice Premier later this week to evaluate the implementation of the phase-one trade deal by China. China has assured that it will fulfill its promises made under the agreement that include the increased U.S. farm purchases and the better protection of Intellectual property rights.

This faded some of the risk-off market sentiment and caused GBP/USD to surge.

The risk sentiment was backed by the comments of WHO Chief Scientist Dr. Soumya Swaminathan, who praised the global efforts in the development of the COVID-19 vaccine. She reported that almost 200 vaccines were being developed globally and were in the stage of clinical or pre-clinical trials. According to her, 24 vaccines had entered the clinical trials in human beings.

The unprecedented global efforts to develop the coronavirus vaccine triggered the risk-on market sentiment as various potential paths to the end of coronavirus gave hope to the investors. The improved risk appetite gave a push to GBP/USD pair on Monday.

On Brexit front, the U.K. media has suggested that David Frost remain the U.K.’s chief Brexit negotiator and will stay on committed to securing an agreement with the European Union even if a deal is not secured by the end of September.

The U.K. formally left the E.U. in January after voting to leave in 2016, and negotiations to reach post-Brexit trade deal are currently deadlocked because both sides have failed to reach a consensus on various matters.

As the end of the transition periods is getting closer day by day, Prime Minister Boris Johnson has vowed to end the year with or without a deal, outside Europe. David Frost is set to take up a new position as National Security Advisor (NSA) in September. However, his position as Chief Brexit Negotiator will remain in place.

Meanwhile, the U.K. government pledged a further 20 Million Pounds in aid to Lebanon following Tuesday’s deadly explosion in Beirut. The U.K.’s support will directly go to the injured and people displaced by the explosion. It will also provide food, medicine, and urgent supplies to the needy in Lebanon affected by the explosion.

The U.K. government has already given 5 Million Pound to the emergency relief effort and said that it would stand by the Lebanese people in the hour of need. This also helped GBP in recovering its position and pushed GBP/USD pair higher on Monday.

Daily Technical Levels

Support Pivot Resistance
1.3024 1.3064 1.3110
1.2978 1.3150
1.2938 1.3196

GBP/USD– Trading Tip

On Tuesday, the GBP/USD consolidates at 1.3067 level, holding right above the 50 periods EMA support area of 1.3040 level while the bearish breakout of 1.3040 level can extend selling unto 1.2918 level. Recently as we can see in the chart above that the GBPUSD pair has violated its upward trendline that supported the pair around 1.3130 level, and now below this, we can expect GBP/USD to continue trading bearish. The GBP/USD should show a bearish crossover to confirm a strong selling bias in the Cable. On the higher side, Sterling may find resistance at 1.3105 and 1.3175. Let’s consider selling below 1.3045 level today. 


USD/JPY – Daily Analysis

The USD/JPY currency pair succeeded to break its previous session thin trading range and rose above 106.00 marks mainly due to the broad-based U.S. dollar fresh strength, buoyed by the Friday’s better-than-expected employment report, which eventually helped the U.S. dollar to put the bids. 

On the other hand, the upbeat market sentiment, backed by the optimism that the U.S. policymakers are showing signs to resume talks about the stimulus package, undermined the safe-haven Japanese yen and contributed to the pair’s gains. In the meantime, the risk-on market sentiment was further bolstered by the upbeat key U.S. and China data, which tends to urge buyers to invest in riskier assets instead of safe-have assets. Currently, the USD/JPY currency pair is currently trading at 106.00 and consolidating in the range between 105.72 – 106.06.

Despite concerns about the ever-increasing coronavirus cases across the world and worsening US-China relations, the investors continued to cheer the hopes of the U.S. fiscal stimulus package triggered by the signs that White House officials and congressional Democrats showed a willingness to compromise on another stimulus package to bolster the stalled economy. 

On the other hand, U.S. President Donald Trump fulfilled his promise to take executive action as the U.S. Congress failed to offer any outcome over the country’s latest stimulus measures. As a result, U.S. President Trump’s signed four executive orders to release unemployment claim benefits, help with student loans, and aid those living in a rented house, which also exerted a positive impact on the market trading sentiment and contributed to the currency pair losses.

Moreover, the upbeat market sentiment was being supported by Friday’s better-than-expected employment report. Details suggested Non-farm payrolls increased by 1.763 million in July month, vs. the estimated 1.6 million increase. The unemployment rate also declined to 10.2% in July, compared to June’s reading of 10.5%.

Despite the positive data, the doubts remain about the U.S. economic recovery amid the on-going surge in the coronavirus cases. As per the latest report, the U.S. crossed the five million COVID-19 cases as of August 10, according to Johns Hopkins University. Whereas Australia’s 2nd-most populous state, the epicenter of the pandemic, Victoria, reported the biggest single-day rise in deaths. As per the latest figures, Australia’s coronavirus death losses crossed 314 as Victoria announces a daily record of 19 deaths and 322 new cases in the past 24 hours. 

Apart from the virus woes, the long-lasting struggle between the world’s two largest economies remained on the cards as U.S. President Donald Trump turned off the business tap for China’s TikTok and WeChat. As well as, the U.S. imposed sanctions on the Hong Kong Leader Carry Liam, which keeps challenges the upbeat market tone. In the meantime, the White House National Security Adviser Robert O’Brien blamed China while saying that the “Chinese hackers have been targeting U.S. election infrastructure ahead of the 2020 presidential election.” These gloomy updates capped further upside in the currency pair by giving support to the safe-haven Japanese yen.

As a result of the upbeat U.S. data, the broad-based U.S. dollar succeeded in gaining some positive traction on the day. Still, the bullish bias in the U.S. dollar is expected to be short-lived as doubts remain about the U.S. economic recovery amid on-going coronavirus cases. However, the gains in the U.S. dollar became the key factor that kept the currency pair higher.

Daily Technical Levels

Support Pivot Resistance
105.6900 105.9500 106.1900
105.4500 106.4500
105.1900 106.7000

USD/JPY – Trading Tips

The USD/JPY has made a slight bullish recovery from 105.780 to 106.150 area, especially after examining the 38.2% Fibonacci support level of 105.650. A bullish breakout of 106.467 resistance level can drive more buying until the next resistance area f 107.198. On the lower side, the USD/JPY may find support at 105.600 and 105.078, extended by the 38.2% and 61.8% Fibonacci retracement level. The current market price of USDJPY is staying over 50 EMA, which extends support and may push the pair higher. Let’s consider buying above 105.750 level today. Good luck! 

Categories
Forex Options

FX Options Market Combined Volume Expiries for 11th August 2020

Thank you for visiting the Forex Academy FX Options market combined volume expiries section. Each day, where available, we will bring you notable maturities in FX Options of amounts of $100 million-plus, and where these large combined maturities at specified currency exchange rates often have a magnetic effect on price action, especially in the hours leading to their maturities, which happens daily at 10.00 AM Eastern time. This is because the big institutional players hedge their positions accordingly. Each option expiry should be considered ‘in-play’ with a good chance of a strike if labelled in red, still in play and a possible strike if labelled in orange and ‘out of play’ and an unlikely strike if labelled in blue, with regard to the likelihood of price action meeting the strike price at maturity.

…………………………………………………………………………………………………………

FX option expiries for Tuesday, August 11 at the 10am NY cut

-EUR/USD (euro amount)

  •  1.1800 674m

EURUSD is in a bearish consolidation phase with a test of 1.1700 on the cards. Eurozone and US data will play a role in the next push with the US dollar sentiment looking favourite at the moment.

-USD/JPY (USD amount)

  •  105.20 722m
  •  106.00 766m

USDJPY is in a bull channel but approaching overbought. There is potential for a pullback before a continuation to 106.50 and beyond.

-USD/CAD (USD amount)

  •  1.3300 712m
  •  1.3375 600m

USDCAD is in a bear channel and is oversold. A Firmer US dollar should leave the door open for the 1.3300 option expiry at the New York cut.

………………………………………………………………………………….

As you can see on the preferred 1-hour chart(s), we have also plotted the expiration levels at the various exchange rate maturities and we have also labelled in red, orange and blue.  Therefore, if you see option expiry exchange rates labelled in red these should be considered in-play, because we believe there is a greater chance of the expiry maturing at these levels based on technical analysis at the time of writing. There is still a lesser possibility of a strike if they are in orange and so these are ‘in-play’ too. However, if we have labelled them in blue, they should be considered ‘not in-play’ and therefore price action would be unlikely to reach these levels, which are often referred to as Strikes, at the time of the 10 AM New York cut.

Our technical analysis is based on exchange rates which may be several hours earlier in the day and may not reflect price action at the time of the maturities. Also, we have not factored in economic data releases or keynote speeches by policymakers, or potential market volatility leading up to the cut.

Although we have added some technical analysis, we suggest you take the levels and plot them onto your own trading charts and incorporate the information into your own trading methodology in order to use the information to your advantage. Remember the higher the amount, the larger the gravitational pull towards the exchange rate maturity at 10:00 AM Eastern time.

If you want to learn how forex option expiries affect price action in the spot FX market see our educational article by clicking here: https://bit.ly/2VR2Nji

DISCLAIMER: Please note that this information is for educational purposes. Also, the maturities will look more or less likely to become a strike at 10 AM NY time due to exchange rate fluctuations resulting in a different perspective with regard to technical analysis, and also due to upcoming economic data releases for the associated pairs.

Categories
Crypto Market Analysis

Daily Crypto Review, August 11 – yEarn Finance Token Explodes After Binance Listing; BTC Hashrate Unaffected by the Price Upswing

The cryptocurrency market tried to catch up to Bitcoin after it pushed up yesterday. Bitcoin is currently trading for $11,938, which represents an increase of 1.26% on the day. Meanwhile, Ethereum gained 1.27% on the day, while XRP lost 4.73%.

 Daily Crypto Sector Heat Map

When talking about top100 cryptocurrencies, yearn.finance gained 50.03% on the day, making it the most prominent daily gainer. JUST (39.71%) and Terra (28.27%) also did great. On the other hand, Balancer lost 13.90%, making it the most prominent daily loser. It is followed by Band Protocol’s loss of 9.52% and iExec RLC’s loss of 6.35%.

Top 10 24-hour Performers (Click to enlarge)

Bottom 10 24-hour Performers (Click to enlarge)

Bitcoin’s dominance level has decreased slightly since we last reported, with its value currently at 61.22%. This value represents a 0.56% difference to the downside when compared to yesterday’s value.

Daily Crypto Market Cap Chart

The cryptocurrency market cap has increased since we last reported. Its current value is $363.58 billion, which represents an increase of $0.89 billion when compared to yesterday’s value.

_______________________________________________________________________

What happened in the past 24 hours?

_______________________________________________________________________

_______________________________________________________________________

Technical analysis

_______________________________________________________________________

Bitcoin

Bitcoin has spent the day trying to regain what’s been lost after the failed attempt to break the $12,000 mark. However, the price doesn’t seem like it will be able to push past this level unless a surge in volume and bull pressure happens. Meanwhile, Bitcoin is locked between $11,630 and $12,000. When it comes to moves towards the downside, Bitcoin is well protected by the 21-period and 50-period moving averages.

BTC traders should look for an opportunity when BTC makes another push and breaks $12,000.

BTC/USD 4-hour Chart

Technical factors:
  • Price is currently above its 50-period EMA, as well as its 21-period EMA
  • Price between its middle B.B (20-period SMA) and its top B.B.
  • RSI is neutral (56.12)
  • Volume is decreasing
Key levels to the upside          Key levels to the downside

1: $12,000                                 1: $11,630

2: $12,330                                 2: $11,460

3: $13180                                   3: $11,090

Ethereum

Ethereum was quite stable in the past 24 hours, making small gains in an attempt to catch up to Bitcoin’s gains that happened yesterday. However, if we take a look at this month’s price movement, we can interpret the moves as a triangle formation, which will make a breakout very soon. It is more likely that the second-largest cryptocurrency by market cap will break the triangle formation towards the downside unless Bitcoin’s move pushes it up.

Traders should look for a trade opportunity when Ethereum breaks the formation.

ETH/USD 4-hour Chart

Technical Factors:
  • Price is above its 21-period EMA and its 50-period EMA
  • Price is slightly below its top B.B.
  • RSI is neutral (56.42)
  • Volume decreasing
Key levels to the upside          Key levels to the downside

1: $400                                     1: $361

2: $415                                     2: $340

3: $496                                      3: $302

Ripple

XRP is the cryptocurrency that gained the most in the past 24 hours (when compared to Bitcoin and Ethereum) as its price increased close to 5% on the day. The third-largest cryptocurrency by market cap made another push towards the $0.31 resistance level, but the move failed to even reach the level, let alone break it.

Traders can look for an opportunity to trade XRP within the range it is currently in.

XRP/USD 4-hour Chart

Technical factors:
  • Price is above its 21-period and 50-period EMA
  • Price is above its top B.B.
  • RSI is slightly elevated (58.52)
  • Low volume (slightly increased)
Key levels to the upside          Key levels to the downside

1: $0.31                                     1: $0.285  

2: $0.32                                     2: $0.266

3: $0.3328                                3: $0.245


Categories
Forex Videos

How do public holidays affect the Forex market?

How do public holidays affect the Forex market?

Thank you for joining the forex academy educational video. In this video presentation, we will be looking at how public holidays affect the forex market.
Public holidays have various effects on the financial markets, including forex trading. For example, in institutional forex trading where banks, hedge funds, and institutions physically buy and sell currencies, which have to be delivered into bank accounts, in some situations, public holidays may require that settlement dates are postponed for one business day.
But in the world of retail currency trading, where traders trade contracts for difference or spread betting, this, of course, does not apply.
Bank holidays mean that the banks in the country where the holiday is taking place will be very unlikely to be trading in the forex market. And because banks are the biggest single participants in the forex markets, if they are on holiday, then the volume of transactions is typically reduced. When volume is reduced, this can have the effect of making the market static in the given currency pair are involved. But this thinning can also cause voids and gaps, which can also have the effect of creating spikes in price action.

As an example, when the Japanese have a public holiday, it is not unusual to see the USD JPY pair have periods of extra and volatility. While, if for example, the Euro area and the US shared a public holiday, such as the Christmas period, you would typically find thin market conditions and little volatility, especially when those two currencies are paired.
Another thing to consider, which most retail traders do not, is that there can often be extra volatility in price action in the 24 or 48 hours before a public holiday, and also so a day or two after a public holiday. This is known as the public holiday effect and is well-known, particularly in the stock market, where investors see extra volatility and usually extra buying during the run-up to public holidays.
Sometimes this is not quite so evident within the forex market; however, things to be considered are that large institutions do not like large exposed trading positions over weekends and public holidays. Often you will find that banks, institutions, and traders like to adjust positions by closing them out or switching between assets, for example, out of a currency and into a more stable asset such as gold, which is very bullish in the current market. This is known as hedging. Certainly, the longer the public holiday, the more likely you will see thinning in markets and where Christmas is the best example.
This type of situation can lead to extra price volatility in the run-up to public holidays, and you should bear this in mind before you place trades before, during, and after a public holiday.

And so, bank holidays can cause the forex market, on occasion, to act erratically and where fundamental and technical analysis sometimes has little or no bearing on price action. In other words, trade during public holidays at your peril. If you insist on trading during these periods, you should expect the unexpected and always maintain tight stop losses. And take note, the bigger the country, the less the volume going through, for example, the most widely traded currency in the United States dollar and if they are on holiday volume crashes, similarly with Europe with regard to the Euro currency.
Ensure that you have a good public holiday calendar which you can refer to in order to trade around public holidays
Here are the public holidays for August, September, and October 2020.

Categories
Forex Videos

Forex GBPUSD Breakdown 14th-24th July 2020


A detailed look at Cable price action 14th to 24th July 2020


What is going on with the GBPUSD pair, AKA Cable?

Thank you for joining the forex academy educational video. In this session, we will be looking at what has been happening with the Great British pound US Dollar pair, also known as Cable between the 14th to the 24th of July 2020.
The idea behind this video is to show you what professional traders look for in their technical analysis in order to try and determine the future movement of price action.


This is a 1-hour chart of Cable for the period of the 14th to the 24th of July 2020.
One of the biggest mistakes that new traders make is that they do not look at historical price action before putting on a trade. Technical analysis is a trader’s best friend and should be looked at holistically before for taking on a trade. Technical charts should be looked at from left to right because they tell a story.

We can see that the price action of this pair was bid up to position A, which was a new recent high and, importantly, above the key figure of 1.2600, a multi-month high for the pair. Traders will have taken some profits after this push, and we see price action fall back to the support line, before a second push higher to position B, and where position B is lower than position A. This tells us that the strong bull move was running out of steam. Buyers were worried about a possible double top rejection of position A, and this left the door open for sellers to come in because the price could not be sustained above the key 1.26 level.

We then have a period of sideways consolidation between the support and resistance line and more importantly between the two key levels of 1.25 and 1.26, however, there is a breakout of this consolidation period at position D, where the bulls gain control and where the resistance line becomes support and we see an aggressive move higher from here position E. support lines often become resistance lines and vice versa. The other critical component of this bull move was the fact that the EU Brexit negotiator Mr. Barnier was holding talks with a British government regarding the future trading arrangements, post-Brexit, and a potential new trade deal. The market was expecting that a possible deal could be reached, and this was seen as positive for the British pound.
Meanwhile, profit-taking was taking place at position E and where subsequent price action began to fall back to position F and where technical analysis traders saw a bear formation and pushed pair down to position G, which is an important round number of 1.2650.

Looking for an opportunity to enter the market, bears again took control and pushed the pair higher. However the fading arch formation was reflective of uncertainty, and where the market was braced for an EU press conference, where Michael Barnier, the lead negotiator for a new EU/UK trade deal, said that a deal was unlikely with the British government due to substantial differences and so-called red lines around fishing rights and possible divergences in standards, which would likely prevent a deal being reached. This was seen by the markets as bad for the British pound and activated an initial sell-off in the pair, which was only stopped in its tracks when the United States released worse than expected initial jobless claims data for June, which reversed the pair at position H, coupled with the fact that Mr. Barnier said that there was still an opportunity to secure a deal with a British government and that talks would resume again in August. This gave a more positive sentiment to the pound, and the pair lifted to the second period of support and resistance, importantly, this was above the key 1.27 level.

In thin trading on Friday evening, BST, after the European and London sessions had finished, and with China and US tensions rising because of a breakdown in relations and a lack of trust growing on either side, the US dollar was generally sold off across the board and Cable lifted to a new multi-month high of 1.2800.
A large part of the bid tone in this pair is because of a bad sentiment for the United States economy due to the growing number of Covid cases which is seen as being almost out of control, and where are Great Britain has largely surpassed the worst of the disease and whereby the economy is opening up, and things are returning to some kind of normal.

The scope is for further upside in this pair due to the ever-increasing bad sentiment for the United States dollar and slightly better sentiment for the British pound, where there is still hope that an EU UK trade deal can be completed by December.

Categories
Forex Basic Strategies

Combining Moving Averages with Parabolic SAR To Generate Accurate Trading Signals

Introduction

Trend trading is a great way to earn money from the forex market. Any retail trading strategy based on a trend continuation pattern works well when it moves within a trend.  Therefore, in this trading strategy, we will take trades from minor corrections using the parabolic SAR towards the trend.

Furthermore, we will use a 100-period exponential moving average to determine the trend. If the price is trading above the 100 exponential moving average, we will consider the trend as an uptrend. If the price is trading below the 100-period exponential moving average, it will consider it a downtrend. We will follow a simple logic by considering buying trades when the market moves up and considering sell trades when the market is moving to drown.

However, there are no specific rules about the period of your moving average. Some traders are comfortable with 100 EMA, while some traders are compatible with 20 EMA or SMA. Therefore, if you’re trading in a lower timeframe, you can use any moving average from 20 to 100 periods. However, we will focus on 100 EMA as it provides good profitability based on swing trading ideas.

Why Should We Use Parabolic SAR?

Parabolic SAR is a forex trading indicator that stands for “stand and reverses.” This trading indicator was devised by J Welles, represented by some dots below and above the candlestick. In an uptrend, dots remain below the price and indicates a bullish pressure once the price is rejected from these dots. Similarly, in a downtrend, the dots form above the price, and the price starts to move once it gets rejected from the parabolic SAR.

In the image below, we can see a clear chart of the candlestick pattern.

Let’s plot the parabolic SAR in the price chart and see how it looks like.

It is visible that in an uptrend, Parabolic SAR is below the price, and in a downtrend, the parabolic SAR is above the price. This is why the parabolic SAR is considered as a stop and reverse indicator.

Furthermore, the parabolic SAR has a built-in stop-loss function. Once the price moves up or down with a new candle, the parabolic SAR changes with the price. Therefore, you can move your stop loss once the price creates a new higher or lower low. Furthermore, you can edit the primary parameter of Parabolic SAR from the indicator’s setting, but in this trading strategy, we will use the default format.

Moving Average with Parabolic SAR

If we use a 100-period exponential moving average, we can catch the major trend direction from the minor correction. The forex market Moves Like a zigzag. Therefore, there is a minor correction in a major bullish trend and minor bullish correction in a major downtrend. If we know the major trend, we can quickly enter the trade from a correction to get the maximum reward from the minimum risk.

In the forex market, parabolic SAR usually provides trading signals earlier than expected, which might create a negative impact on your trading result. Overall, any trend following indicator does not provide a good result when the price moves within a range. In most of the cases, markets follow the trend of about 35% of the time. Therefore, it is essential to filter out the conditions where the market is moving within a range.

We can eliminate the unexpected market behavior by using the 100 moving average as it will provide a more significant trend that will prevent over-trading. In the image below, we can see how the parabolic SAR provides false trading signals when the market moves within a range.

In the ranging market, it would be difficult to make a profit using this trading strategy. Therefore, it is better to use the 100 moving average to get the overall direction of the trend.

Moving Average With Parabolic SAR Trading Rules

Every trading strategy has its unique rules. In the moving average with the Parabolic SAR trading strategy, our main aim is to follow the trend towards the direction of 100 EMA.

Overall, we will follow simple rules as Complex trading rules make it challenging to implement it on the chart. You can make good profits with a simple trading strategy if you can utilize it well with appropriate trade management and money management rules.

Timeframe

The moving average with the Parabolic SAR trading strategy works well in all timeframes from 5 minutes to weekly charts. The longer timeframe will provide better trading results. However, it is better to stick to the 1 hour to daily chart as it can cover fresh moves driven by banks and financial institutes.

Currency Pair

There is no obligation to use a currency pair. However, it is better to use a currency pair that does not remain within a range for a long time like EURCHF. Therefore, all major and minor pairs are good to go with this trading strategy.

Buy Entry (Inverse for Sell Entry)

  • Identify the price above the 100 periods moving average. If the price is choppy at the 100 EMA, Ignore the price chart, and move to another market.
  • Identify the parabolic SAR to point dots below the candlestick, which will be a buy signal (above the candlestick is a sell signal).
  • Later on, place a buy stop order above the candlestick high.
  • Put your stop loss below the printed dot with some buffer.

Example of Parabolic SAR Strategy

At the image below and see how parabolic SAR provided a buy trade setup.

  • Notice that the price is moving in a range at the 100 EMA area with a violation. The blue horizontal line represents the support and resistance level, where the price is consolidating. In this consolidation, we will not take any trade.
  • If you look at the price structure, you can see the price is moving within a range from their resistance to support. On the price move above the 100 exponential moving average, you should put a pending order above the range, projecting that it will break out from the resistance level and create an impulsive bullish pressure.

Stop Loss and Take Profit Set

When you put the pending order above the resistance level, you should put a stop loss below red dots that have appeared below the candlestick. While setting the stop-loss, make sure to use some buffer of 10 to 15 pips.

Later on, hold the price until it points red dots above the price. The red dot above the price will indicate that sellers are entering the market, and there is a possibility to create a new lower low. Furthermore, while sitting the stop loss and take profit, you should follow the basic rules of price action, including the breakout and pullback.

Summary

Let’s summarize the moving average with the Parabolic SAR trading strategy:

  • You should look for a fresh trending movement above or below 100 exponential moving average.
  • Parabolic dots below the price will provide buy-entry, and parabolic dots above the price will indicate sell-entry.
  • You should avoid ranging markets where the price might violate parabolic dots.

Moreover, trade management and good trading psychology are mandatory for every trading strategy. You cannot make a decent profit until you know how to minimize the risk to get the maximum benefit from trade.

Categories
Forex Market Analysis

Daily F.X. Analysis, August 10 – Top Trade Setups In Forex – Market Prices In NFP Outcome! 

On the news front, eyes will be on the low impact events such as Sentix Investor Confidence from Eurozone and JOLTS Job Openings from the U.S. Besides, the stronger NFP data may keep dollar bullish.

Economic Events to Watch Today  


EUR/USD – Daily Analysis

The EUR/USD prices were closed at 1.17849 after placing a high of 1.18829 and a low of 1.17550. Overall the movement of the EUR/USD pair remained bearish throughout the day. The EUR/USD pair broke under the 1.1800 level and reached 1.175 the lowest in 3 days after the U.S. dollar took its pace and outperformed in the market. The greenback rebounded from its two years low and trimmed its weekly losses on Friday that weighed on EUR/USD pair.

The rising tensions between the U.S. & China have already driven the U.S. dollar higher, and the U.S. jobs data on Friday added further strength to it. The latest development in the US-China conflict was the U.S. imposed sanctions on officials in Hong Kong and China, including Hong Kong leader Carrie Lam, over the suspension of protests in the territory.

On the data front, at 11:00 GMT, the German Industrial Production for June increased to 8.9% from the forecasted 8.3% and supported Euro. The German Trade Balance also came in positive as 14.5 B against the expected 10.3 B. At 11:45 GMT, the French Industrial Production for June increased to 12.7% against the forecasted 8.6% and supported Euro. The French Prelim Private Payrolls for the quarter came in as -0.6% against the anticipated -1.0%.

The French Trade Balance for June came in negative as 8.0B against the projected -7.1B and weighed on Euro. The Italian trade Balance at 13:00 GMT came in line with the expectations of 6.23 B.

Investors failed to cheer the positive data from Europe as the U.S. dollar was stronger on Friday, and the sharp decline in Turkish Lira over the past week exerted downside pressure on Euro.

A sharp selloff triggered the Euro’s correction in Turkish Lira that dropped it to the lowest of 2 years, the historic currency crisis of August 2018. The reserves of Central Banks of Turkey (CBRT) went negative for a couple of weeks, which caused a surge in the Turkish Lira’s selloff. However, last month, CBRT made a massive purchase of gold and overtook Russia as the world’s largest gold purchaser. In the lira currency crisis of 2018, Euro underperformed during that time period, and this has raised fears that if the history repeated, then downside risks for Euro can be seen.

However, on the U.S. front, at 17:30 GMT, the Average Hourly Earnings for June increased to 0.2% from the forecasted -0.5% and supported the U.S. dollar. The Non-Farm Employment Change suggested that 1.8M jobs were created in June against the expectations of 1.6B and supported the U.S. dollar. In the month of June, the Unemployment Rate also fell to 10.2% from the expected 10.5% and weighed on the U.S. dollar. The strong U.S. dollar weighed heavily on EUR/USD pair and dragged its prices to the level below 1.8000 on Friday.


Daily Technical Levels

Support Pivot Resistance
1.1773 1.1783 1.1792
1.1764 1.1802
1.1754 1.1812

EUR/USD– Trading Tip

The EUR/USD pair retraced lower to trade at 1.1793 level. On the upside, the EUR/USD may encounter resistance at 1.1865 and 1.1909 mark. A bullish breakout at this level can extend the buying trend to 1.2050. Today, the EUR/USD is likely to find support at 1.17650 level, and below this, further selling can be seen until the 1.1713 level. Let’s keep a focus on 1.1805 level to stay bearish below this in the EUR/USD pair.


GBP/USD – Daily Analysis

The GBP/USD pair was closed at 1.30521 after placing a high of 1.31492 and a low of 1.30092. Overall the movement of GBP/USD pair remained Bearish throughout the day.

The Pound to U.S. dollar exchange rate fell by -0.3% on Friday to a low of 1.3000. The Sterling fell against the U.S. dollar after the concerning comments from the UK Chancellor Rishi Sunak, who warned that the extended furlough scheme would only give false hopes to the people. Mr. Sunak said that it was wrong to trap the people in a situation and pretended that there was always a job that they can go back to.

However, apart from this downbeat comment, Mr. Sunak also raised hopes for a possible Brexit deal and said that he was confident that there was a possibility to get an agreement with the E.U. by September. As in result, GBP investors became hopeful that there was possible progress in the EU-UK trade talks.

On the data front, the Halifax House Price Index for July rose from 0% to 1.6% and beat the expectations of 0.2%. However, the GBP investors failed to cheer the U.K.’s positive data as the U.S. dollar was strong across the board on Friday.

The U.S. dollar gained traction on the board on Friday after the release of better than expected U.S. jobs data. The latest US Non-Farm Employment Change suggested an increase in the number of jobs created in June by the U.S. Department of Labor & Statistics to 1.8M from the expected 1.5M and helped the U.S. dollar gain traction.

The Average Hourly Earnings from the U.S. also rose to 0.2% from the previous -1.3% and the expected -0.5% and supported the U.S. dollar. The Unemployment Rate for June dropped to 10.2% against the expected 10.5% and May’s 11.1%. The less unemployment rate from the U.S. showed that the U.S. economy was moving on the recovery side even after the widespread coronavirus cases across the country.

The better than expected U.S. jobs data weighed heavily on GBP/USD pair and dragged it to 1.3000 level on Friday. The Sterling traders will be looking ahead to Monday’s release of the latest Retail Sales figures from the U.K. Any improvement in the U.K.’s retail sector would provide strength to Sterling.

The U.S. Dollar Investors will be looking at the publication of the US NFIB business optimism index for July. The demand for safe-have greenback can be lifted after any improvement in the outlook for the American economy. On Tuesday, the release of the U.K.’s ILO unemployment rate report for June. If the figures came in equal to 3.9% or less, we could see the GBP/USD pair go on the upward as fears of high unemployment will be diminished.

Daily Technical Levels


Support Pivot Resistance
1.3037 1.3052 1.3065
1.3024 1.3080
1.3010 1.3093

GBP/USD– Trading Tip

The GBP/USD consolidates at 1.3067 level, holding right above the 50 periods EMA support area of 1.3040 level while the bearish breakout of 1.3040 level can extend selling unto 1.2918 level. Recently as we can see in the chart above that the GBPUSD pair has violated its upward trendline that supported the pair around 1.3130 level, and now below this, we can expect GBP/USD to continue trading bearish. The GBP/USD should show

a bearish crossover in order to confirm a strong selling bias in the Cable. On the higher side, Sterling may find resistance at 1.3105 and 1.3175. Let’s consider selling below 1.3045 level today. 


USD/JPY – Daily Analysis

The USD/JPY pair was closed at 105.912 after placing a high of 106.055 and a low of 105.478. Overall the movement of the USD/JPY pair remained bullish throughout the day. After falling for two consecutive days and staying flat for a day, USD/JPY pair rose and posted gains on Friday amid strong U.S. dollar comeback.

Since two years after U.S. President Donald Trump decided to ban U.S. transactions with two popular Chinese apps, the U.S. dollar rebounded from the lowest level. During the occasions of massive conflicts between the U.S. & China, the U.S. dollar has often preferred as a refuge, and on Friday, the U.S. dollar again used this status.

The U.S. President Donald Trump officially banned American companies from working with TikTok, the video streaming app, and WeChat, the social messaging app. the action to ban these companies was taken in response to the widespread fears of data privacy. However, the chances that the US-China conflict will rise further increased after this move, and hence, the U.S. dollar gained.

Meanwhile, the U.S. Treasury imposed sanctions on 10 top officials from Hong Kong and China, including the Hong Kong Leader Carrie Lam, as the protests arose in the territory against the new security law in Hong Kong.

Furthermore, the U.S.’s macroeconomic data also remained supportive of the U.S. dollar when it came to better than expectations on Friday. 

At 17:30 GMT, the highlighted Average Hourly Earnings rose to 0.2% in June from the negative expectations of -0.5% and supported the U.S. dollar. The Non-Farm Employment Change rose to 1763K from the forecasted 1530K and came in favor of the U.S. dollar. The greenback was also supported after the Unemployment rate for June also dropped to 10.2% from the expected 10.5%. In June, the better-than-expected U.S. jobs data gave a push to the U.S. dollar that added further strength to USD/JPY pair on Friday.

However, the gains remained limited as the data from Japan was also supportive of its local currency. At 04:30 GMT< the Average Cash Earnings for the year from Japan came in as -1.7% against the forecasted -3.0% and supported the Japanese Yen. The Household Spending for the year from Japan also came in as -1.2% against the expectations of -7.8% and supported the Japanese Yen. However, the Leading Indicators from Japan were released at 10:00 GMT, came in line with the expectations of 85.0%.

The positive data from Japan supported Japanese Yen on Friday that kept a check on USD/JPY pair gains. On the vaccine front, the risk sentiment was supported by the news that Russia was all set to register the world’s first COVID-19 vaccine next week. The Russian vaccine third phase trials were currently in progress, and Russia announced to disclose them on August 12. This vaccine was developed by the collaboration of the Russian Defence Ministry and the Gamaleya Research Institute.

The improvement in risk sentiment weighed on safe-haven Japanese Yen and contributed to the USD/JPY pair’s gains.

Daily Technical Levels

Support Pivot Resistance
105.8200 105.8900 105.9300
105.7800 106.0000
105.7200 106.0400

USD/JPY – Trading Tips

The USD/JPY continues to trade at 105.780 area with the bullish sentiment, especially after testing the 38.2% Fibonacci support level of 105.650. On the lower side, the USD/JPY may find support at 105.600 and 105.078 level, which is extended by the 38.2% and 61.8% Fibonacci retracement level. A bullish breakout of 106.467 resistance level can drive more buying until the next resistance area f 107.198. The current market price of USDJPY is staying over 50 EMA, which extends support and may push the pair higher. Let’s consider buying above 105.600 level today. Good luck! 

Categories
Forex Options

FX Options Market Combined Volume Expiries for 10th August 2020

Thank you for visiting the Forex Academy FX Options market combined volume expiries section. Each day, where available, we will bring you notable maturities in FX Options of amounts of $100 million-plus, and where these large combined maturities at specified currency exchange rates often have a magnetic effect on price action, especially in the hours leading to their maturities, which happens daily at 10.00 AM Eastern time. This is because the big institutional players hedge their positions accordingly. Each option expiry should be considered ‘in-play’ with a good chance of a strike if labelled in red, still in play and a possible strike if labelled in orange and ‘out of play’ and an unlikely strike if labelled in blue, with regard to the likelihood of price action meeting the strike price at maturity.

…………………………………………………………………………………………………………

FX Options Market Combined Volume Expiries for 10th August 2020

FX option expiries for Aug 10 NY cut at 10:00 Eastern Time, via DTCC, can be found below.

– EUR/USD: EUR amounts

  • 1.1800 3.0bn

EURUSD is looking at a possible double bottom around the 1.1750 level. The 1.1800 option remains in play. It will all be about the US dollar sentiment today as the economic calendar is light.

– GBP/USD: GBP amounts

  • 1.2900 353m

GBPUSD will find strong resistance at 1.3000. The 1.2900 option is out of play.

– USD/JPY: USD amounts

  • 105.00 675m
  • 105.03 400m
  • 105.50 1.7bn
  • 107.05 400m

USDJPY is in a sideways consolidation with the 105.50 option just below the support line and upward price action looking muted.

– USD/CAD: USD amounts

  • 1.3315 715m

USDCAD is in a bull trend with a recent failure of a break in that trend we should presume more upside leaving the option expiry out of play.

………………………………………………………………………………….

As you can see on the preferred 1-hour chart(s), we have also plotted the expiration levels at the various exchange rate maturities and we have also labelled in red, orange and blue.  Therefore, if you see option expiry exchange rates labelled in red these should be considered in-play, because we believe there is a greater chance of the expiry maturing at these levels based on technical analysis at the time of writing. There is still a lesser possibility of a strike if they are in orange and so these are ‘in-play’ too. However, if we have labelled them in blue, they should be considered ‘not in-play’ and therefore price action would be unlikely to reach these levels, which are often referred to as Strikes, at the time of the 10 AM New York cut.

Our technical analysis is based on exchange rates which may be several hours earlier in the day and may not reflect price action at the time of the maturities. Also, we have not factored in economic data releases or keynote speeches by policymakers, or potential market volatility leading up to the cut.

Although we have added some technical analysis, we suggest you take the levels and plot them onto your own trading charts and incorporate the information into your own trading methodology in order to use the information to your advantage. Remember the higher the amount, the larger the gravitational pull towards the exchange rate maturity at 10:00 AM Eastern time.

If you want to learn how forex option expiries affect price action in the spot FX market see our educational article by clicking here: https://bit.ly/2VR2Nji

DISCLAIMER: Please note that this information is for educational purposes. Also, the maturities will look more or less likely to become a strike at 10 AM NY time due to exchange rate fluctuations resulting in a different perspective with regard to technical analysis, and also due to upcoming economic data releases for the associated pairs.

Categories
Crypto Market Analysis

Daily Crypto Review, August 10 – Chainlink Surpasses LTC’s Market Cap Despite Major Bearish Signals

The cryptocurrency market had an interesting weekend, with Bitcoin pushing towards 12,000 and actually passing it at the time of writing. Bitcoin is currently trading for $12,003, which represents an increase of 2.24% on the day. Meanwhile, Ethereum gained 0.18% on the day, while XRP lost 0.11%.

 Daily Crypto Sector Heat Map

When talking about top100 cryptocurrencies, Balancer gained 45.17% on the day, making it the most prominent daily gainer. Band Protocol (32.27%) and Nervos Network(26.64%) also did great. On the other hand, Flexacoin lost 16.27%, making it the most prominent daily loser. It is followed by Decentraland’s loss of 9.91% and Elrond’s loss of 6.81%.

Top 10 24-hour Performers (Click to enlarge)

Bottom 10 24-hour Performers (Click to enlarge)

Bitcoin’s dominance level has increased slightly since we last reported, with its value currently at 61.78%. This value represents a 0.28% difference to the upside when compared to Friday’s value.

Daily Crypto Market Cap Chart

The cryptocurrency market capitalization has increased since we last reported. Its current value is $362.67 billion, which represents an increase of $3.77 billion when compared to Friday’s value.

_______________________________________________________________________

What happened in the past 24 hours?

_______________________________________________________________________

_______________________________________________________________________

Technical analysis

_______________________________________________________________________

Bitcoin

Bitcoin has spent the weekend pushing towards $12,000 and finally passing it in a major push just a couple of hours ago. However, the price didn’t fully (or at all) establish itself above the major mark. Bitcoin will need to confirm its position above $12,000 (and confidently) before being considered as officially above it. For now, this level is still a resistance level.

BTC traders should look for an opportunity to make a trade when BTC confirms its position above or below $12,000.

BTC/USD 4-hour Chart

Technical factors:
  • Price is currently above its 50-period EMA, as well as its 21-period EMA
  • Price above its top B.B.
  • RSI is elevated (65.89)
  • Volume elevated (on the increase)
Key levels to the upside          Key levels to the downside

1: $12,000                                 1: $11,630

2: $12,330                                 2: $11,460

3: $13180                                   3: $11,090

Ethereum

Unlike Bitcoin, Ethereum spent the weekend without much movement towards the upside. However, the second-largest cryptocurrency by market cap did fall back to the $361 level and tested its support, which held up quite nicely. Once the price bounced back to its previous highs, it continued slowly moving towards the upside, but without any real strength. Ethereum still has a way to go before it reaches past $400.

Traders should look for a trade opportunity when Ethereum increases its volume.

ETH/USD 4-hour Chart

Technical Factors:
  • Price is above its 21-period EMA and its 50-period EMA
  • Price is slightly below its top B.B.
  • RSI is elevated (58.51)
  • Volume increasing slightly
Key levels to the upside          Key levels to the downside

1: $400                                     1: $361

2: $415                                     2: $340

3: $496                                      3: $302

Ripple

XRP had quite a turbulent weekend, with its price failing to stay above the previously broken triangle formation levels. This happened as, even though XRP managed to break the triangle formation to the upside, it did not reach past the $0.31 resistance level. Instead, bears stepped into the market and brought the price down to below $0.285 levels (at one point). However, the $0.285 level held up and XRP has confirmed its position above this support.

Traders can look for an opportunity to trade when XRP reaches the $0.31 mark and decides if it will reach above it or fall below once again.

XRP/USD 4-hour Chart

Technical factors:
  • Price is above its 21-period and 50-period EMA
  • Price is slightly above its middle B.B. (20-period SMA)
  • RSI is neutral (51.45)
  • Low volume
Key levels to the upside          Key levels to the downside

1: $0.31                                     1: $0.285  

2: $0.32                                     2: $0.266

3: $0.3328                                3: $0.245


Categories
Forex Videos

Making Huge Profits In Gold buying the dips!

Gold, buy the dips

Welcome to this forex academy educational video. In this session, we will be looking at the uptrend in gold prices with regard to the possibility of a continuation in this bull trend.

Gold, buy the dips.


In this historical chart going back to 1998 where prices were just 200.00, we can see an almost exponential rise in the value of gold to its current levels.
Gold, which is the oldest currency on earth, is traded primarily by people looking to invest by taking ownership of the physical product however it is used in the markets four trading on speculation for hedging against swings peaks and troughs in the general financial markets which is pretty much what we are seeing today. The most recent rise in the value of go gold is attributed to the uncertainties in the global financial markets pertaining to the onset of the covid virus.
The recent rise in the value of gold should be attributed to a risk-off event in the financial markets where people are bailing out of certain riskier assets and moving into gold. This includes general speculators who are enjoying the recent bull trend to these historic highs.


In this 5-day chart, we can see peaks, troughs, and spikes in prices, plus pullbacks and price flattening followed by a slight sell-off, and then continuations to the current highs. Price has generally been able to stay above 1900.00

Analysts at Goldman Sachs have increased their 12-month price outlook for gold to $2,300 a troy ounce. And while stock markets around the world are looking exposed to the continuation in the covid virus with potential falls on the horizon, and where yields are considered to be low in the bond market, it is no surprise that investors are looking for ways to offset their exposure to these assets and recently, for many, gold stands out. The bull trend speaks for itself.

Morning show institutions wrestle with the incredible amounts of stimulus being unleashed into the market by the federal reserve, and well they worry about the potential knock-on effect with regard to rising inflation; as a result, markets tend to reflect on previous similar situations such as the market crash in 2008 and other virus outbreaks in order to predict future price movement. While the big guns worry about the intricacies of the continuing financial crisis, shrewd investors will be following the money. With that in mind, gold is looking like a safe investment, in which case some major analysts are suggesting should continue looking for entries into this gold trend as it nudges up towards 2000.

Categories
Forex MT4 Platform

The Forex Markets & The Covid Effect!

Markets, the Covid effect


This is a 5-day chart of the Great British pound US Dollar pair, where we can see a rise of price from 1.2790 to a high of 1.3170 before the pair fell back at the end of trading on the 31ST July. Much of the move higher has been due to an overall decrease in the performance of the United States dollar and where extreme volatility crept into the market on Wednesday 29th August, when the federal reserve held are interest rates on hold but where the FOMC comments at the press conference were extremely rubbish regarding the outlook for the American economy as the continuation of the covered virus escalates within the United States.
The volatility continued on Thursday, when unemployment data in the form of continuing jobless claims in the United States showed an increase, and more importantly, the annualised second-quarter gross domestic product figure was released for the US at – 32.9%, the biggest such drop in history. The US dollar was heavily battered as a result, giving an uplift to the pound, Euro, AUD, NZD, and others.


Incredibly, this is a Dow Jones industrial average daily chart, which shows that while the Dow took a dip down to just above 26,000 on the last day of trading for July, it subsequently rallied to 26,482 at the close. Naturally, analysts, market commentators’ and traders alike are bewildered by the fact that the United States posted its biggest loss in gross domestic product in such a short time frame in history, and yet the Dow Jones remained unscathed.

So, what can we expect in the ensuing weeks? With regard to the Dow Jones, it’s pretty much being driven by technical analysis and where the big numbers such as 26,000 seem to be holding as support and where the recent attempt to breach 27,000 failed and can therefore for the assumed to be a resistance level. Larger sized institutions are looking at the long term rather than the short term. They believe that a v-shaped recovery is possible and that when suitable medical solutions are found to minimise the impact of Covid on individuals to perhaps where it can be managed to almost like cold virus, or flu symptoms levels, the American economy can return to normal very quickly. However, pessimism is more and more creeping into the markets as top analysts scratch their heads and talk up the possibility of another crash in US equities. However with regard to the United States dollar, we should expect a toing and froing effect, with more volatility, and where bad news will affect the US dollar performance during certain times of the days and weeks and whereby bad news regarding the UK and Europe, such as what we are seeing at the moment regarding further lockdown measures being implemented by the British government as cases of Covid escalate, and whereby further outbreaks in covid are being seen across Europe can be considered to be bad for both the UK and the Eurozone economies, in which case you might expect a reversal in the euro and the British pound such as we saw on the last day of trading for July when these major currency pairs reversed from sharp rallies.

Sentiment is playing a large role in the majors, with USDJPY bouncing off of multi-month lows, as seen on this monthly chart, as investors buy yen as a safe haven currency.


Similarly, for the USDCHF pair, which has been sold heavily to a low at the end of July, as seen on this monthly chart, to 0.9100, again a multi-month low as investors buy the Swiss franc for its safe-haven status.


Categories
Forex Basic Strategies

Trading The Forex Market Using ‘Price Action With Context’ Strategy

Introduction

Price action with context is a process to predict a currency pair’s movement by reading the chart. The key price driver of a currency pair is fundamental events, but we can predict the future movement based on the present and past activity of the chart.

Central banks and financial institutes drive the forex market. Therefore, when they make the price move, they left some signs of their activity. As a price action trader, we will read their activity and anticipate what they might do in the future.

What is Price Action?

Price action is a process to inquiry about a currency pair’s price development. The main aim of the price action trading is to understand buyers’ and sellers’ sentiment in the price and predict future movement based on these. The price action trading is based on the combination of several trading indicators and price behaviors. Therefore, you might have to use multiple trading tools as a price action weapon.

The price of a currency pair moves based on the sentiment of buyers’ and sellers’. Therefore, using price action is logical that can provide accurate trading signals. In the price action with context trading strategy, we will identify a market direction by reading the chart and then enter a trade from the correction to get the maximum return with a minimum risk.

What are Price Action Weapons?

There are many parts in the price action trading that a trader should know, like- candlestick, support and resistance, trend, market flow, event level, key Level, and market context.

Candlestick

Candlestick represents the price movement of a currency pair for a specific timeframe. The four major parts of candlestick trading are- opening price, closing price, high price, and low price. Candlestick represents both continuation and reversal price direction based on the opening, closing, high and low. There are many candlestick patterns in the market, but in this trading strategy, we will focus on reversal candlesticks only.

Example of reversal candlestick – Pinbar, Engulfing Bar, and Two Bar, etc.

Support & Resistance

Support and resistance are a price zone from where the price is likely to change the direction. When the price is moving up, it will reverse as soon as it finds resistance. On the other hand, the price will stop moving down as soon as it finds a support level. There is more to know about the support and resistance in this trading strategy-

Event Level – Event level is a price zone that works as both support and resistance. It is the most important Level as both buyers and sellers put attention to it.

Key Level – key levels are a significant level in the daily or weekly timeframe to understand the price’s top and bottom.

Dynamic Level – Dynamic levels move with the price rather than a specific horizontal zone. In this trading strategy, we will use 20 Exponential Moving Average as the dynamic Level.

Market Context

Market context is a process to identify the nature of a trend. It has four elements:

Impulsive – When the price aggressively creates new highs and lows, it is considered as an impulsive trend. It indicates that the price will continue the current trend.

Corrective – In a corrective market structure, price barely creates new higher highs or lower lows. It is an indication of market reversal.

Volatile Trend – In volatile trends, the market follows the corrective structure and indicates a market reversal.

Non Volatile Trend – Non-volatile trend appears with the impulsive market momentum when the price tries to continue the current movement.

Bullish Price Action Trade Setups

Find the market in an impulsive bullish pressure in H4 or daily timeframe. Identify the Key support level and consider buy trades only as soon as the price is trading above it.

Entry

To enter the trade, you have to wait until the price comes down towards an event level with a corrective structure in 1 Hour timeframe. Enter the trade as soon as the price rejects and closes above the event level with a reversal candlestick.

Stop Loss

Put the stop loss below the recent swing low with 10-15 pips buffer. Here the buffer means you should put the stop loss 15 pips below the swing low.

Take Profit

The primary target of the take profit would be the next event level. However, if the bullish trend remains impulsive, you can extend the take profit. On the other hand, you can close earlier if the price barely creates new higher highs.

In the example below, we can see a visual representation of how to take the entry with stop loss and take profit level.

Bearish Price Action Trade Setups

Find the market in an impulsive bearish pressure in H4 or daily timeframe. Identify the key resistance level and consider sell trades only as soon as the price is trading below it.

Entry

To enter the trade, you have to wait until the price comes down towards an event level with a corrective structure in 1 Hour timeframe. Enter the trade as soon as the price rejects and closes below the event level with a bullish reversal candlestick.

Stop Loss & Take Profit

Put the stop loss above the recent swing high with 10-15 pips buffer. Here the buffer means you should put the stop loss 15 pips above the swing high.

The primary target of the take profit would be the next event level. However, if the bearish trend remains impulsive, you extend the take profit. On the other hand, you can close earlier if the price barely creates new Lower lows.

In the example below, we can see a visual representation of how to take the sell entry with stop loss and take profit level.

Final Thoughts – Trade Management Idea

In the above section, we have seen how to trade using the price action with context. In this trading strategy, buy and sell trades come after filtering out unusual market movements from the volatile market conditions.

However, no forex trading strategy in the world can guarantee a 100% profit, so your trades might go wrong even if you strictly followed all rules. If you want to grow your account with a consistent profit, you should follow strong trade management tools, as mentioned below:

  • Ensure that you are not taking over a 2% risk per trade of your trading balance.
  • Move your stop loss at breakeven as soon as the price creates a new higher high or lower low.
  • If you face a 3 or 4 consecutive losses, take a break and observe the market until it follows the trend accurately.
  • Make sure to keep your mind free from any bias while you are analyzing the market.

Overall, price action is the core element of trading that every trader should know. There are many trading strategies combining price action and other trading tools. The strategy we have seen above has a good history of providing profitable trades. Therefore, if you can implement it properly, you can consistently grow your trading account.

Categories
Forex Basic Strategies

Trading The Most Popular ‘Head and Shoulders’ Pattern Forex Strategy

Introduction

Head and shoulder is a famous market reversal pattern. Most of the new and experienced traders use this pattern to identify the potential market reversal trade. Traders can use this pattern in every market, including forex, cryptocurrency, stock, indices, and commodities.

In this pattern, there is an indication that the price is trying to make a new higher but cannot do it. In the forex market, it is essential to understand the sentiment of buyers and sellers. In that sense, head and shoulder is a prominent price pattern indicating what buyers and sellers are doing in the market and how buyers got rejected from a potential zone.

What is the Head and Shoulder Pattern?

Head and shoulder is a price pattern that usually appears in an uptrend and indicates a price zone from where buyers are going to lose their momentum. A complete head and shoulder pattern indicates the start of a bearish trend. Therefore, if you want to join the bearish trend as early as possible, you should take trading decisions based on this pattern to have a better risk: reward ratio.

The head and shoulder pattern has three elements, as marked in the below chart.

The left shoulder is the ordinary swing high of a bullish trend. Later on, the head indicates another swing high indicating the continuation of the bullish trend. However, the right shoulder indicates that the price is unable to make another high above the head, which is an indication that buyers are losing their momentum.

On the other hand, the inverse head and shoulder are like the head and shoulder pattern that appears after a bearish trend. It indicates a potential market reversal from a bearish trend to the upside.

In the image below, we can see how an inverse head and shoulder looks like.

How to Identify the Head and Shoulder Pattern?

The head and shoulder pattern is prevalent in the chart that does not require any effort to see. You can easily spot it with the naked eye. Moreover, there are some Expert Advisors (EAs) or trading indicators that automatically show the head and shoulder pattern.

You can draw the head and shoulder pattern using the trendline (without ray) despite the automotive process. Later on, we should focus on the location of the pattern. If the head and shoulder pattern appears near any significant support level, it might not work well due to the lack of space for further price decline.

Overall, the head and shoulder pattern from a significant resistance level or key resistance level can provide a potential market reversal opportunity. Furthermore, head and shoulder patterns with significant economic events often make the level important among traders.

Head and Shoulder Pattern Trading Strategy

If you have read the above section, you would know that it is not difficult to find the price’s head and shoulder pattern. The profitability ratio of this pattern is very high, based on the previous trading result. There are several ways to make trades based on the head and shoulder trading strategy. However, the most reliable way to take the trade is from the neckline breakout.

Timeframe

The head and shoulder price pattern in a daily chart is more reliable than the head and shoulder pattern in a 5 minutes timeframe. The accuracy of this trading strategy increases if you move to a higher timeframe. However, it is often difficult for traders to take trades based on a weekly or monthly timeframe as it requires a lot of time and balance. Based on the retail and institutional traders, any time frame from 1 hour to a daily chart is perfect for this trading strategy.

Currency Pair

The head and shoulder trading strategy works well in all financial markets, including forex, cryptocurrency, stocks, indices, and commodities. Therefore, there is no barrier to use it on specific currency pairs. However, it is recommended to trade in major currency pairs as there is enough liquidity to provide a substantial movement without any unnecessary spike.

Entry

After forming the head and shoulder pattern, it is crucial to measure the price action at the neckline area. The neckline is a support level based on the lowest swing point of two shoulders and one head. In this trading strategy, you should wait for the price to break below the neckline with a big candle breakout. The strength of the breakout will indicate how reliable the upcoming bearish pressure is.

Later on, wait for the price to correct towards the neckline again with a corrective speed and enter the trade as soon as the price rejects the neckline with a bullish reversal candlestick.

Stop Loss

The stop loss will depend on two categories. If you are an aggressive trader, you can put the stop loss above the reversal candlestick with 10-15 pips buffer. In case the market moves above the neckline and hits your stop loss, it would indicate that the price made a false break below the neckline. However, the conservative approach is to put the stop loss above the left shoulder with some buffer. It would save your trading balance from the unusual market noise.

Take Profit

The first take profit level should be based on the 1:1 risk: reward ratio. You can close 50% of the position at the first take profit level and wait for the 100% of neckline to head for the final take profit.

Moreover, you should be more cautious in setting the take profit level by considering the near-term support and resistance levels. In the example below, we can see how the price broke below the neckline and retested it again to create a trading opportunity. Moreover, this image refers to how to set the stop loss and take profit levels.

Conclusion

The forex market is the world’s biggest financial market, which is very uncertain. Therefore, no trading strategy can guarantee a 100% profit. There is some possibility that your trade might hit the stop loss after taking the entry, instead of moving down. In that case, you should take the loss and wait for further trading opportunities.

The best way to keep yourself profitable in the market is to use appropriate money management and trade management rules for trading. Therefore, if you take 1% or 2% risk per trade, any unusual stop loss might not affect the overall balance.

Categories
Forex Videos

Forex! GBPUSD/Cable looks towards 1.3200!

Cable looks towards 1.3200

Thank you for joining this forex academy educational video. In this session, we will be looking at the GBPUSD pair, also known as cable.
The idea is to show you recent price action on a 1-hour chart so that you can apply the related methodology to your own trading style.


Always read your chart from left to right because it tells a story of historical price action key levels and what potentially is driving a particular currency pair.
Here we can see that price action remained bullish from the 27th of July, and moved up to a significant key level at 1.300. It Immediately found some sellers at the position, and where 1.300 was then seen as an area of resistance. After such a bullish move, traders will typically take some profit and wait for the next significant move in price action before they re-join. Here on our chart, we can see that at position B, here was a retest of the 1.300 and where this level subsequently became an area of support. Again, we see a nice bull rally before price action falls back to the key level at 1.30 at position C and D, where subsequently, the bulls finally start buying the pair ad where 1.300 is then seen as a significant area of support.
Price action goes on to breach the 1.3100 key level, and then at position E Andrew Bailey, Governor of the Bank of England left its interest rates on hold for the August meeting and left its policy unchanged. Importantly all nine members of the monetary policy committee voted to leave interest rates and changed.

Because there was market speculation that the Bank of England might introduce negative interest rates to try and mitigate against the negative economic effects of the covid pandemic, this was largely discounted by the governor of the Bank of England who said after the announcement that negative interest rates would be useful and remain in the toolbox, but they have no plan to introduce them at the moment.
Again, this provided a lift for cable, which was driven up on the good news to 1.3183. 1.3200 will be on traders’ minds as the next significant test.
Things to consider are that growth forecasts have been upgraded with positive data releases in recent weeks for Great Britain. And Mr. Bailey said that “The British economy is still set to contract in 2020 – COVID-19 is taking its toll. Nevertheless, this decline has now been trimmed to single digits – 9.5% against 14% beforehand. That is a substantial upgrade. While the BoE also trimmed growth forecasts for the next two years – a slower recovery – it is hard to foresee too far into the future given the high uncertainty surrounding the virus.” However, the Bank of England remains wary of further outbreaks of the virus, hampering the economic recovery for the United Kingdom.
Cable will need to push up and find a support area above 1.3170 in order for a sustained push up to the 1.3200 level. We would imagine an initial rejection of this key exchange rate, however, if the market goes on to attack it on a number of occasions, it could be breached and leave the door open for a push-up to 1.3250. Failure will see a push down to the low 1.30’s

Categories
Forex Videos

Where Next for The Dow Jones Industrial Average!


Where Next for The Dow Jones Industrial Average?

Where next for the day jones industrial average?
Thank you for joining the forex academy educational video. In today’s session, we will be looking at the dow jones industrial average, which is closely watched and considered to be the main united states benchmark indices.
It is price-weighted and tracks the performance of 30 of America’s largest companies, which are mostly listed on the New York stock exchange.


The Dow Jones index reached a record high of over 29,000 in February, before tanking to just above 18,000 in march during the worst of the Covid pandemic in the United States. And then rallied back up to 27,500 in June while the United States was still severely impacted by the outbreak of the virus. The amazing recovery was largely driven. I hope that the pandemic would soon be over and that a recovery would quickly happen within the United States with regard to the economy getting back to normal. The Fed was calling this a V-shaped recovery. Straight down and then straight up. However, this has not exactly transpired, and although the federal reserve has implemented monetary policies to prop up their ailing economy and help those individuals who have been impacted, including support for companies, all of this is just adding to America’s debt burden. The typical analysis of the stock market being driven up by growth is, therefore, flying in the face of the fundamentals.
And while every single good news regarding vaccines has tended to keep the Dow Jones index propped up, almost artificially, another aspect which has been holding it up to levels above 26,000 points and more recently a pop above 27,000 points has been the expectation that tech stocks would perform very well during this time. This has been backed up by strong performances from companies such as Microsoft and apple Intel NVIDIA and Amazon, which are listed on the alternative index, the National Association of Securities Dealers Automated Quotations, or Nasdaq, of which there are two variant indices; the 100 and the composite.


Worryingly Wall Street closed in the red, which was largely triggered by buy tech stocks falling potentially bursting the bubble that the American economy will be driven higher by such stocks leading to a v-shaped recovery.
Even more alarming is the continuing spat between China and the United States, which could lead to tariffs being implemented on either side and potential sanctions. Any breakdown in trade between the two nations, especially China buying from the United States at the moment, would also impact on the so-called v-shaped recovery. And, of course, America just does not seem to be getting a handle on the number of cases of Covey, which are escalating in some States.
The pullback from 27,000 points on the Dow to the current level of 26,470, at the time of writing, and a simultaneous drop on the s&p 500 of 20 points and a shed of 98 points on the NASDAQ on Friday the 24th July, has set alarm bells ringing with investors and traders who have been concerned that stock markets in the United States are overvalued and about to crash for a second time since March.

Categories
Forex Fundamental Analysis

Everything About GDP From Transport & Its Impact On The Forex Price Charts

Introduction

The Transportation Industry’s contribution to GDP is both direct and indirect. The real contribution of Transportation to overall economic growth goes beyond what the GDP can measure. Hence, Understanding the Role of Transportation in economic activity and its underlying importance that is both visible and subtle is essential for our overall fundamental analysis.

What is GDP from Transport?

Transportation

Transportation includes the types of services that are provided through operating vehicles, moving goods, or people over public transport systems like roads, railways, waterways, airways, etc.

The supply side of the Transportation system is called the Transportation Industry. It is also essential to note that the Standard Industrial Classification (SIC) and North American Industrial Classification System (NAIC) both consider Transportation as a separate industry. They do so through a standard set of definitions and criteria. Hence, not all Transportation services come under the Transportation Industry.

The Transportation services’ contribution to GDP can be measured in the following ways:

Final Demand: It is calculated by adding all the expenditures by households, private firms, and the government on Transportation related goods and services.

Value Added: It is calculated as the GDP contribution by the Transportation services overall. Transportation Value Added is a gauge of the transportation sector’s contribution to GDP. It is based on the difference between transportation services sold value and the goods and services used to produce Transportation.

The Bureau of Economic Analysis (BEA) takes industry value added to be a measure of an industry’s contribution to GDP.

From measurement viewpoint, three types of transportation operations can be distinguished:

  • For-hire operations: It includes those services conducted by transportation industries on a fee basis. A trucking company’s trucking operations is an instance of for-hire operations. 
  • In-house operations: also called, own-account operations, is conducted by non-transportation industries for their use. For instance, the Coca-cola company may transport its beverages to its local warehouse for storage through its trucks. 
  • Final user operations: Final users include the general population (end consumers) and the government who purchase transportation services like cars, trucks for their use.

Transportation Satellite Accounts: The Satellite industry segregates data by focusing on types of economic activity. Hence, the TSAs depict the contribution of for-hire, in-house, and household transportation services as they all form part of the Transportation Industry.

How can the GDP from Transport numbers be used for analysis?

The Transportation-related Final Demand metric is useful to compare the expenditures incurred on other industries like healthcare or housing. For sector-wise, growth analysis, investors can use this to gauge, which industries are experiencing increasing demand that can help them to invest accordingly.

On the other hand, it is not an accurate metric to measure the Transportation needed to support and sustain economic activity. For instance, if the investment into Transportation infrastructure is underfunded, then correspondingly, it will underestimate the final demand due to low economic output. The Transportation industry’s contribution in the year 2019 and 2018 has stayed around 3.2% of GDP as per BEA.

The value-added contribution of Transportation Industry to GDP is, however, understated for the following two reasons:

  • It only includes the contribution of for-hire transportation services. Many industries use transportation services for their use. In-house services do not contribute to GDP.
  • The extent to which industries depend on Transportation is not depicted in these figures. Mobility and interconnectivity between industries, states, and countries are critical factors in business growth in today’s interconnected international markets.

Accessibility to resources, end consumers are all enabled through Transportation and are heavily impacted with poor transportation infrastructure. The US Department of Transportation – Bureau of Transportation Statistics accounts for the TSA reports, and they, by far, depict the contribution of the Transportation industry better than other measures published.

Impact on Currency

GDP from transport does not paint the full picture of the economy but tells us the direct contribution of the Transport industry to the overall GDP. Still, for the International Markets, it does not serve as a useful indicator. It is a proportional and lagging indicator. Higher GDP from Transport is good for the economy and its corresponding currency, and vice-versa.

Sources of GDP from Transport

For the United States, the BEA reports are available here – GDP -BEA

We can use the GDP by Industry to get the transport’s contribution to GDP here –

GDP by Industry – BEATransportation Statistics –Annual Report – BTS

Transportation’s contribution to GDP for the world can be found here –

GDP from Transportation – Trading Economics

GDP from Transport Announcement – Impact due to news release

The main role of transport is to provide access to different locations to individuals and businesses. Transport facilitates a wider range of social and economic transactions than would otherwise be possible. Transport is an important sector in its own weight. Transport infrastructure and transport operations together account for more than 5% of the country’s GDP. In developed countries, further investment in that infrastructure will not only result in economic growth but also improve the quality of life, lower costs to access resources and markets, and improve safety.

Therefore, the transport sector is an important sector of the economy that many long-term benefits associated with it. Fundamentally speaking, investors would not invest based on a currency based on the contribution made by the transport sector alone, as its direct influence on the GDP is less. The transport industry indirectly helps in boosting the GDP by assisting in all business activities.

In today’s article, we will observe the impact of GDP on various currency pairs and observe the change in volatility because of its news announcement. For illustration, we have collected the latest GDP data of Switzerland, which was released in March. The below image shows that the GDP in the fourth quarter was slightly better than expectations and higher than the previous quarter.

USD/CHF | Before the announcement

Let us start with the USD/JPY currency pair in order to analyze the impact of GDP on the Swiss Franc. In the above Forex price chart, we see that the overall trend of the market is down where recently the price is moving in a ‘range.’ After the occurrence of a trend continuation pattern, a ‘sell’ trade can be taken with less risk. Conservative traders should wait for news releases and trade after the volatility settles down.

USD/CHF | After the announcement

After the news announcement, the price marginally increases that takes the market higher by just a few pips. We can argue that the GDP data had the least impact on the currency pair and did not induce any volatility in the market. As the data was as expected, it did not turn the market downside, and it moves as usual.

EUR/CHF | Before the announcement

EUR/CHF | After the announcement

The above images represent the EUR/CHF currency pair, it is clear that before the news release, the market is in an uptrend, and few minutes before the release, the price has been moving within a ‘range.’ This means the news event could either result in a continuation of the trend or a reversal of the trend.

Hence it is recommended to wait for the news announcement to watch the impact it makes on the price chart. After the news announcement, there is a slight increase in volatility to the downside after the close of news candle resulting in strengthening of the Swiss Franc. However, the ‘news candle’ itself appears to be impact-less, where there is hardly any change in price during the announcement.

NZD/CHF | Before the announcement

NZD/CHF | After the announcement

The above images are related to the NZD/CHF currency pair, where we see that the market is moving sideways before the news announcement. Just before the release, the price is close to the bottom of the ‘range.’ As the impact of these numbers is less, aggressive traders can take ‘long’ positions when technically the location is supporting for a ‘buy.’

After the news announcement, the market moves higher, and there is an increase in volatility to the upside. Since the GDP was not extremely bullish or bearish, the market did not react violently to the news release. Therefore, in such times we need to look at the charts from a technical angle. All the best!

Categories
Forex Basic Strategies

Dynamic Channel Trading Using The Concepts Of Price Action!

Introduction

In forex, the dynamic channel trading is a profitable strategy that forms with standard trendlines. It indicates a potential move to identify the market direction both to the downside and upside. On the other hand, price action is a method to identify the price direction based on price behavior. Therefore, we can create a profitable trading strategy by reading the price action from any channel support and resistance level.

In general, traders use price channel as a technical analysis tool that helps to identify the potential market movement. The dynamic channel moves like a zigzag by creating lower lows and higher highs. In Forex trading, we usually have two types of dynamic channels:

  • An upward or ascending channel
  • Downward or descending channel

Dynamic Channel Identification

We can easily identify the dynamic channel by connecting the swing lows or swings highs they create. In an upwards dynamic channel, it will move with the price with a higher high formation.

Similarly, in a downward dynamic channel, it will move with the price by creating lower lows.

In the image above, we can see that the higher highs and the lower lows connected through straight lines. The dynamic price channel shows a significant movement from down to upside in the trend line. The trendline below the price may work as a dynamic support level, and the trendline above the price may work as a dynamic resistance level.

Besides the dynamic channel, we will use the concept of price action by measuring what buyers and sellers are doing in the market. Any slower and corrective movement from the dynamic channel support and resistance would indicate a possibility of a potential market reversal.

Later on, we will use the appropriate reversal candlestick from that area to enter a trade. In this trading strategy, we can make a profit when the price is trading within the channel, or it breaks out from the channel. However, we will filter out the unusual false movement by reading the price action.

Bullish Dynamic Channel Trading Strategy

In the bullish channel continuation trade setup, we will identify the price that is moving upside within the channel.

Identify the Price Location

Central banks and big financial institutes drive the price of a currency pair. Therefore, institutional traders focus on long timeframes mostly, as it provides the most reliable price direction. Therefore, we will move to the daily or weekly timeframe and identify the location of the price. We will consider channels that only meets the following condition:

⚠️ An upward channel should move within an uptrend above a key support level.

Entry

In an upside movement of a price channel, there will be new higher highs. Therefore, we need to identify a price channel where the price moves down towards channel support with a corrective speed. We will enter the trade as soon as the price rejects the channel support with a reversal candlestick formation.

Stop Loss

In a bullish channel trading, the stop loss would be below the reversal candlestick with 10 to 15 pips buffer.

Take Profit

The primary aim of the taking profit would be the immediate channel resistance. However, we have to read the price action to make a trading decision regarding the take profit.

If the price starts to move with an impulsive bullish pressure, it can go beyond the channel resistance. In that case, we can take some partial closing 10-15 pips below the channel resistance and wait for the price to test any event level.

Bearish Dynamic Channel Trading Strategy

In the bearish channel continuation trade setup, we will identify the price that is moving downside within the channel.

Identify the Price Location

Based on the price action context, we will move to the daily or weekly timeframe and identify the price’s location. We will consider channels that only meets the following conditions:

⚠️ A downward channel should move within a downtrend from a key resistance level.
Entry

In the downward price channel, there will be lower lows. Therefore, we need to identify a price channel where the price is moving down towards a channel resistance with a corrective speed. Therefore, we will read the price action and enter the trade as soon as it rejects the channel resistance with a reversal candlestick pattern.

Stop Loss

In the bearish channel trading, the stop loss would be above the reversal candlestick with 10 to 15 pips buffer.

Take Profit

The primary aim of the taking profit would be the immediate channel support. However, we have to read the price action to make a trading decision regarding the take profit.

If the price starts to move with an impulsive bearish pressure, it can go beyond the channel support. In that case, we can take some partial closing 10-15 pips above the channel support and close the rest of the amount at the next event level.

Channel Breakout Trading Strategy

In forex trading, when the price crossed (above or below) the channel, there is a profitable trading strategy. For making the trade sustainable, we need to identify the speed of the breakout. When institutions or banks enter the market, we see such massive breakout from the channel support or resistance.

Entry

After a massive breakout from a dynamic channel, we will wait for a correction. The correction indicates that the massive breakout would be strong. We will wait until the price moves to the channel support or resistance level with a corrective speed and enter the trade as soon as it rejects the level with a reversal candlestick formation.

Stop Loss

Setting a stop loss is similar to the channel continuation trade setup. You can put your stop loss above or below the reversal candlestick with 10 to 15 pips buffer.

Take Profit

The primary target of the channel breakout is the immediate event level. However, you can extend the take profit by reading the price action. If the power of the breakout is strong, the price may move beyond the immediate event level.

Conclusion

The Forex market is a competitive trading market where trade management is a key element for a forex trader. No trading strategy can assure you a confirmed profit. Therefore, it is recommended to use not more than 2% risk per trade and move the stop-loss at breakeven as soon as the price creates new lows or highs.

Categories
Forex Market Analysis

Daily F.X. Analysis, August 07 – Top Trade Setups In Forex – Big Day, NFP is Here! 

The Non-farm payrolls will extend clarity over the damage in the labor market last month, and traders will keenly await its release. Overall, economists expect a slight improvement in the U.S. unemployment rate from 11.1% to 10.5%, while the Average Hourly Earnings are expected to improve from -1.2% to -0.5%%. The NFP itself is expected to report 1530K (negative for a dollar) vs. 4800K figures beforehand.

Economic Events to Watch Today  


EUR/USD – Daily Analysis

The EUR/USD closed at 1.18640 after placing a high of 1.19048 and a low of 1.17927. The EUR/USD once again saw a bullish movement after a brief U.S. dollar recovery attempt earlier this week. Despite worsened coronavirus cases in some Eurozone nations, the bloc’s outlook remained much more optimistic than the U.S. outlook.

While the advances in the Euro have slowed, the EUR/USD pair has continued to trend higher over the past week. EUR/USD pair climbed slightly from 1.1656 to 1.1778 last week. After U.S. Dollar attempted to recover, the pair EUR/USD saw a brief dip at the beginning of this week. However, the EUR/USD pair is eventually rising again as the U.S. dollar’s weakness persists. Whereas, the potential for advances in the currency pair was limited as coronavirus concerns rose on Sunday. The Euro remained broadly appealing overall. Throughout the coronavirus pandemic, the E.U. and the European Central Bank have handled the crisis well compared to other major economies like the U.K. & U.S.

As a result, Euro’s losses in response to a rebounding U.S. dollar have been limited. The Euro and U.S. dollar has a negative correlation, and the Euro often gains from the U.S. dollar weakness. It means that the rally of the EUR/USD pair is set to continue even a rise in worsening coronavirus cases’ concerns.

The Euro appeal was also down after Spain saw a surge in coronavirus cases, and speculations arose that the Eurozone could face fresh lockdowns in Spain to support the Eurozone economy. On the U.S. dollar front, the greenback attempted recovery earlier this week; however, the gloomy outlook persisted and kept investors from mounting much of a recovery rally in the currency.

The number of coronavirus cases in the United States has increased to its highest, and the U.S. government and Federal Reserve have only taken mixed action to limit the virus spread and protect the U.S. economy. Attempts to push further stimulus have been stuck in U.S. Congress, and Federal Reserve may become more dovish.

On the data front, at 12:15 GMT, the Spanish Services PMI fell short of expectations of 52.3 and came in as 51.9. The Italian Services PMI for July came in as 51.6 against the expectations of 51.6 and supported Euro.

At 12:50 GMT, the French Final Services PMI for July dropped to 57.3 against the expected 57.8 and weighed on Euro. At 12: 55 GMT, the German Final Services PMI dropped to 55.6 against the forecasted 56.7. The Final Services PMI for the whole bloc fell to 54.7against the forecasted 55.1and weighed on EURO.

Later today, eyes will remain on the Non-farm payrolls will extend clarity over the damage in the job market last month, and traders will eagerly await its release. Overall, economists expect a slight improvement in the U.S. unemployment rate from 11.1% to 10.5%, while the Average Hourly Earnings are expected to improve from -1.2% to -0.5%%. The NFP itself is expected to report 1530K (negative for a dollar) vs. 4800K figures beforehand.

Daily Technical Levels

Support Pivot Resistance
1.1802 1.1854 1.1915
1.1740 1.1968
1.1688 1.2029

EUR/USD– Trading Tip

The EUR/USD pair retraced lower to complete 38.2% Fibonacci retracement at 1.1817 level. On the higher side, the EUR/USD pair may find resistance at 1.1909 level, and the closing of candles below this level can keep bearish pressure on EUR/USD. A bullish breakout of this level can extend the buying trend until 1.2050. Today, the EUR/USD is likely to find support at 1.1800 level. Let’s keep an eye on NFP as it may drive sharp price action in the EUR/USD pair.


GBP/USD – Daily Analysis

The GBP/USD closed at 1.31133 after placing a high of 1.31614 and a low of 1.30528. The pound rose on Wednesday to remain on course for a third-straight weekly gain against the U.S. dollar and ignored weaker than expected economic data ahead of the Bank of England meeting on Thursday. Previously, the Final Services PMI in July came in as expected 56.5 points and indicated expansion in the services sector in the U.K.

This Thursday, the focus will be on the Bank of England’s monetary policy decision and Andrew bailey’s speech. England’s central bank is anticipated to keep interest rates unchanged but will roll out its forecasts on a range of economic measures, including Inflation, GDP, and unemployment. In recent weeks, debates have been under discussion about the BoE’s cutting of rates below zero, but Thursday’s meeting is unlikely to offer detailed insight.

The NIRP (Negative Interest Rate Policy) has been under active review at the Bank of England, but it seems like a little too early for the central bank to make any decisive move. Some analysts expect that the Bank of England will prefer to use a negative interest rate until the EU-UK relationship for 2021 gets cleared.

On the U.S. front, the ADP Non-Farm Employment Change dropped to 167K from the expected 1200K in July. It means that the U.S. government introduced 167K jobs only while that weighed on the U.S. dollar and added strength to the GBP/USD pair gains.

However, in July, the Final Services PMI rose to 50.0 from expected 49.6, and the ISM Non-Manufacturing PMI rose to 58.1 from expected 55.0. This showed an expansion in America’s services sector in July and supported the U.S. dollar that weighted on additional gains in GBP/USD pair.

Another reason for the rise in GBP/USD pair was the weakness of the U.S. dollar. The ever increasing numbers of coronavirus cases dampened the prospects for a swift economic recovery in the U.S. and forced investors to continue dumping the greenback. This, coupled with the delay in the U.S. fiscal stimulus package’s announcement and further pressurized the U.S. dollar.

The U.S. dollar was so under pressure that even the goodish rebound in the U.S. Treasury bond yields failed to support the U.S. dollar.

Apart from this, the rising number of coronavirus cases in the U.K. and the renewed fears of no-deal Brexit, as both sides were lagging in securing a deal, held investors to place any aggressive bullish position in the GBP/USD pair ahead of BoE monetary policy.

Daily Technical Levels

Support Pivot Resistance
1.3060 1.3111 1.3166
1.3005 1.3217
1.2954 1.3271

GBP/USD– Trading Tip

The GBP/USD consolidates at 1.3127 level, holding right above the double bottom support area of 1.3103 level while the bearish breakout of 1.3105 level can extend selling unto 1.3058 level. Recently as we can see in the chart above, the GBPUSD pair has violated the upward trendline, which supported the pair around 1.3130 level. At the same level, the 50 EMA was extending support, but the GBP/USD showed a bearish crossover, suggesting further odds of selling in the Cable. On the higher side, Sterling may find resistance at 1.3176. Let’s consider selling below 1.3105 level today. 

USD/JPY – Daily Analysis

A day before, the USD/JPY closed at 105.592 after placing a high of 105.871 and a low of 105.318. Overall the movement of the USD/JPY pair remained bearish throughout the day. The USD/JPY pair extended the decay on the back of the weaker U.S. dollar across the board and bank of Japan governor Kuroda’s speech telling that Japan’s economy will improve in the second half of the year.

The Bank of Japan Governor Haruhiko Kuroda warned that in order to contain the spread of public health measures were re-introduced, then the economic activity could be significantly constrained. He also affirmed that Japan was not slipping into deflation and that the central bank would continue with its efforts to achieve the inflation target of 2%. Kuroda again assured that the Bank of Japan would be ready to ramp up the monetary stimulus without hesitation if needed to aid the economy through the pandemic crisis.

Kuroda also said that Japan’s financial system was quite safe and stable and countered the fears that the banking sector would fall out from COVID-19. He also warned that there would be risks to Japan’s financial stability if pandemic prolonged longer than expected.

He said that Japanese and overseas economies would gradually improve from the second half of this year despite extremely high uncertainties. However, the pace of growth is expected to be moderate as the preventive measures to control the virus spread has its effects on economic activity.

On the other hand, the greenback was the worst performer in the currency market. It was so under pressure that it could not benefit from the latest round of economic data that showed an improvement in the Service Sector of the U.S. The rebound in the U.S. Treasury yield also could not support the U.S. dollar. The U.S. Dollar Index (DXY) was testing the 92.60 level lowest since last week.

On the data front, the ADP Non-Farm Employment Change showed that the U.S. created 167,000 jobs in July against the estimated 1200K. This weighed on the U.S. dollar and added further in the losses of the USD/JPY pair.

The Trade Balance from the U.S. fell in line with the expectations of -50.7B. The Final Services PMI rose to 50.0 points in July than the expectations of 49.6 and supported the U.S. dollar. At the same time, the ISM Non-Manufacturing PMI also rose to 58.1 points from the forecasted 55.0 and came in favor of the U.S. dollar.

However, USD bulls did not cheer the positive data, and the U.S. dollar remained under stress to post losses on the day. On the US-China front, China’s ambassador to Washington said that China did not want to see a Cold War break out between China and the U.S. He suggested that both countries need to work to repair their relations that were under extraordinary stress.

Daily Technical Levels

Support Pivot Resistance
105.3100 105.6000 105.8800
105.0300 106.1700
104.7400 106.4500

USD/JPY – Trading Tips

Technically, the USD/JPY hasn’t changed much as USD/JPY continues to consolidate at 105.680 with bearish sentiment, especially after violating the 38.2% Fibonacci support level of 105.650. On the lower side, the USD/JPY may find support at 105.078 level, which is extended by the 61.8% Fibonacci retracement level. A bearish breakout of 61.8% level can drive more selling until the next support area f 104.200. The current market price of USDJPY is staying below 50 EMA, which extends resistance at 105.650 level. Let’s consider selling below 105.650 level today. Good luck! 

Categories
Forex Market Analysis

Dow Jones – Long-Term Technical Overview

This year, The Dow Jones Industrial Average performance went down more than 36% during the first quarter collapse that dragged to the global stock market. Although the recovery experienced by the Industrial Average after March 23th keeps its performance on the negative side, the DJ-30 index could still reach a new all-time high.

Market Sentiment Overview

During the first quarter of 2020, the Coronavirus spread attained the status of a global pandemic, which triggered an economic crisis, originated from a worldwide lockdown. The economic context took down the stock markets. In particular, the U.S. stock market led the Industrial Average to plummet until the 18,213.5 pts, its worst level since November 2016. 

Once Dow Jones found support in its lowest level of the year, after losing over 36%, the Industrial Average began to recover partially from of its losses, advancing near 49% from its March’s low to date.

Under this context, the upper figure illustrates the Dow Jones moving in the 52-week high and low range’s strong bullish sentiment zone. At the same time, we distinguish its price moving above the 26-week moving average, which leads us to anticipate more advances in the short-term.

On the other hand, the Institutional Net Positions (green curve) informed in the latest CFTC report unveils that the speculative bull traders increased their positioning on the long side. However, the institutional sentiment remains on the bearish side.

In summary, the short-term sentiment remains on the long side. In this context, a potential recovery could make it advance toward the 28,595.2 pts, which corresponds to the opening price of 2020. On the other hand, if the Dow Jones Industrial Average develops a new bearish movement, the next key supports are located at 26,749.9 pts and 23,904.4 pts.

Elliott Wave Outlook

Under an Elliott Wave perspective, the big picture of the Dow Jones Industrial Average reveals its advance on an incomplete fourth wave of Primary degree identified in black.

The current bull market began in early March 2009, when the Industrial Average found fresh buyers at 6,466.6 pts. In the next figure, we distinguish that the third wave corresponds to an extended movement, which ended in early February when the Blue Chip U.S. stock market index found resistance at 29,595.3 pts.

Currently, the Dow Jones index advances in its fourth wave of Primary degree, which progress on its wave (B) of Intermediate degree identified in blue. On the other hand, we noticed that the second wave (identified in black on the left of the chart) developed a simple correction in a brief lapse of time. In this context, and considering the alternation principle, the fourth wave should be a complex correction that should take longer than the second wave,  for instance, in the form of a triangle formation, or a double three pattern. After this corrective wave formation, the price action should continue the bullish trend developing a fifth wave of Primary degree with a potential target at the psychological barrier of 30,000 pts.

Finally, with the completion of the five-wave upward sequence of Primary degree, the Industrial Average would complete a motive wave of Cycle degree. Hence, the end of the current bull market will give way to a downward corrective sequence in three waves of Primary degree.


Categories
Forex Options

FX Options Market Combined Volume Expiries for 7th August 2020

Thank you for visiting the Forex Academy FX Options market combined volume expiries section. Each day, where available, we will bring you notable maturities in FX Options of amounts of $100 million-plus, and where these large combined maturities at specified currency exchange rates often have a magnetic effect on price action, especially in the hours leading to their maturities, which happens daily at 10.00 AM Eastern time. This is because the big institutional players hedge their positions accordingly. Each option expiry should be considered ‘in-play’ with a good chance of a strike if labelled in red, still in play and a possible strike if labelled in orange and ‘out of play’ and an unlikely strike if labelled in blue, with regard to the likelihood of price action meeting the strike price at maturity.

…………………………………………………………………………………………………………

FX option expiries for Aug 7 NY cut at 10:00 Eastern Time, via DTCC, can be found below.

– EUR/USD: EUR amounts

  • 1.1750 517m
  • 1.1850 1.1bn
  • 1.1900 1.5bn
  • 1.1925 594m
  • 1.2000 568m

EURUSD is finding support t 1.1820 but is capped at 1.1900. Price is likely to remain in this range until the US session where the next test will be US Non-Farm payrolls.

– GBP/USD: GBP amounts

  • 1.3000 425m

GBPUSD finding support above 1.3100. The option expiry is out of play.

– USD/JPY: USD amounts

  • 104.25 388m
  • 104.50 400m
  • 105.00 481m
  • 105.50 792m
  • 105.80 750m
  • 106.00 485m
  • 107.00 668m

USDJPY is in a narrow consolidation range. US data up later will most likely the next catalyst for a change in direction.

– USD/CAD: USD amounts

  • 1.3180 530m
  • 1.3200 1.5bn
  • 1.3400 1.2bn

USDCAD upside bull run may be attributed to Pres. Trump’s threats of 10% aluminium import tariffs yesterday. Data from both sides later today will likely cause fresh volatility and direction for the pair. Right now, the 1.3400 option is in play.

– NZD/USD: NZD amounts

  • 0.6650 229m

NZDUSD is in a descending wedge formation with the single option in play.

………………………………………………………………………………….

As you can see on the preferred 1-hour chart(s), we have also plotted the expiration levels at the various exchange rate maturities and we have also labelled in red, orange and blue.  Therefore, if you see option expiry exchange rates labelled in red these should be considered in-play, because we believe there is a greater chance of the expiry maturing at these levels based on technical analysis at the time of writing. There is still a lesser possibility of a strike if they are in orange and so these are ‘in-play’ too. However, if we have labelled them in blue, they should be considered ‘not in-play’ and therefore price action would be unlikely to reach these levels, which are often referred to as Strikes, at the time of the 10 AM New York cut.

Our technical analysis is based on exchange rates which may be several hours earlier in the day and may not reflect price action at the time of the maturities. Also, we have not factored in economic data releases or keynote speeches by policymakers, or potential market volatility leading up to the cut.

Although we have added some technical analysis, we suggest you take the levels and plot them onto your own trading charts and incorporate the information into your own trading methodology in order to use the information to your advantage. Remember the higher the amount, the larger the gravitational pull towards the exchange rate maturity at 10:00 AM Eastern time.

If you want to learn how forex option expiries affect price action in the spot FX market see our educational article by clicking here: https://bit.ly/2VR2Nji

DISCLAIMER: Please note that this information is for educational purposes. Also, the maturities will look more or less likely to become a strike at 10 AM NY time due to exchange rate fluctuations resulting in a different perspective with regard to technical analysis, and also due to upcoming economic data releases for the associated pairs.

Categories
Crypto Market Analysis

Daily Crypto Review, August 7 – Goldman Sachs Launching its Own Stablecoin; DeFi Platforms Traffic Surging

The cryptocurrency market ended up mostly in the green, with Bitcoin continuing its path towards $12,000. Bitcoin is currently trading for $11,831, which represents an increase of 1.34% on the day. Meanwhile, Ethereum lost 0.18% on the day, while XRP gained 1.4%.


 Daily Crypto Sector Heat Map

When talking about top100 cryptocurrencies, Balancer gained 23.90% on the day, making it the most prominent daily gainer. Aave (20.29%) and Decentraland (15.99%) also did great. On the other hand, Aurora lost 12.10%, making it the most prominent daily loser. It is followed by Ampleforth’s loss of 7.98% and The Midas Touch’s loss of 5.50%.

Top 10 24-hour Performers (Click to enlarge)

Bottom 10 24-hour Performers (Click to enlarge)

Bitcoin’s dominance level has increased slightly since we last reported, with its value currently at 61.50%. This value represents a 0.02% difference to the upside when compared to yesterday’s value.

Daily Crypto Market Cap Chart

The cryptocurrency market capitalization has increased since we last reported. Its current value is $358.90 billion, which represents an increase of $5.42 billion when compared to the value it had yesterday.

_______________________________________________________________________

What happened in the past 24 hours?

_______________________________________________________________________

_______________________________________________________________________

Technical analysis

_______________________________________________________________________

Bitcoin

The largest cryptocurrency by market capitalization kept increasing in price slowly throughout the day as sentiment turned even more bullish. However, the path towards $12,000 will not be easy, as the sell wall at the resistance is not small. On the other hand, if Bitcoin fails to break $12,000, it will create a double top and most likely fall down towards $11,630 and then $11,460 as well.

BTC traders should look for an opportunity to make a trade when BTC breaks $12,000 or fails to break it.

BTC/USD 4-hour Chart

Technical factors:
  • Price is currently above its 50-period EMA, as well as its 21-period EMA
  • Price is near its top B.B.
  • RSI is elevated (65.50)
  • Volume elevated (stable)
Key levels to the upside          Key levels to the downside

1: $11,630                                 1: $11,460

2: $12,000                                 2: $11,090

                                                  3: $10,855

Ethereum

Ethereum spent the day flattening out its movement and mostly trading sideways. The second-largest cryptocurrency by market capitalization stayed below the $400 mark and couldn’t get past it. However, with volume dying down and such low volatility, we may expect an attempt to break the $400 (and then $415) level soon.

Traders should look for a trade opportunity when Ethereum increases its volume.

ETH/USD 4-hour Chart

Technical Factors:
  • Price is above its 21-period EMA and its 50-period EMA
  • Price is slightly above its middle B.B. (20-period SMA)
  • RSI is elevated (58.42)
  • Descending volume
Key levels to the upside          Key levels to the downside

1: $400                                     1: $362

2: $415                                     2: $340

3: $496                                      3: $302

Ripple

XRP broke out from its triangle formation to the upside, but couldn’t reach past $0.31 mark. However, the pullback from a failed move didn’t discredit XRP’s break from the triangle formation, as the cryptocurrency managed to stay above the triangle. With the confirmed break, traders can expect XRP to either stay near $0.31 or push above it in the short-term unless some other catalyst sparks a movement to the downside.

Traders can look for an opportunity to trade when XRP breaks $0.31.

XRP/USD 4-hour Chart

Technical factors:
  • Price is above its 21-period and 50-period EMA
  • Price is below its middle B.B. (20-period SMA)
  • RSI is neutral (55.99)
  • Low volume
Key levels to the upside          Key levels to the downside

1: $0.31                                     1: $0.285  

2: $0.32                                     2: $0.266

3: $0.3328                                3: $0.245


Categories
Forex Basic Strategies

You Must Know This ‘7-Day Period’ Forex Trading Strategy!

Introduction

Trying to pick the top or bottom is one of the favorite things a trader likes to do. We tried to do that using the ‘Dolphin Strategy.’ We did that with no indicator support. We are again going to unveil a strategy that does pick a top or bottom with no indicator support. This strategy is called the 7-Day period strategy. Let us take a step back and think, indicators are nothing but a mathematical representation of prices, which are calculated in different ways.

Therefore, sometimes it is important to look at prices alone. The 7-day period strategy is based on the idea that after every seven days of consecutive strength, a currency pair’s move is due for a retracement. The question arises, why seven days? This number is derived after constantly watching the market for years. Often, a new trend emerges at the beginning of the week, and if the trend is strong, it can last for several days with no retracement.

Many psychologists believe that human beings have the best retention rates on numbers that are in groups of seven or less. This is one of the reasons why phone numbers in the U.S. only have seven digits, aside from the area code. We have seen that the seven-day reversal pattern is more accurate in a trending market. We gave occasionally seen those periods when the market continues to move in the same direction after seven days of the exhaustive movement, i.e., from the 8th day onwards. Even though the setup is rare, when it does occur, it is significant.

Time Frame

As the name of the strategy suggests, it can be traded only in the daily time frame.

Indicators

In this strategy, no indicators are used. Simple Moving Average (SMA) can put on the chart to get a clear idea of the trend.

Currency Pairs

This strategy can be applied to all the currencies in the forex market. Exotic pairs should be avoided.

Strategy Concept 

The basic idea of the strategy is that when the market is strongly trending on the hourly chart, the retracement does not last more than seven days and changes its direction at the sixth or seventh day. This retracement is considered to over-extended, which leads to a strong reversal in the pair.

If the sixth or seventh candle coincides with a key technical level, the ‘move’ may very well stall at that level and continue its major trend. To implement the strategy effectively, we need to know trends and trend retracement. Since this strategy is based on fixed rules and price action, it is not necessary to know about technical indicators. However, SMA and ATR can be used for trend identification and measuring the momentum of the market.

Trade Setup

In order to understand how the strategy works, we will apply it on the USD/CAD currency pair and execute a ‘short’ trade using the strategy.

Step 1

The first step is to identify the direction of the market. As this is a trend trading strategy, we should be able to identify the major direction of the market. If the market is making higher highs and higher lows, it is an uptrend, or if the market is making lower lows and lower highs, it is a downtrend. A trend can also be determined using the Simple Moving Average (SMA) indicator. Very simply, if the price is below SMA, we say that the market is in a downtrend, and if the price is above the SMA, the market is said to be in an uptrend.

In the example we have considered, from the below image, it is clear that the market is in a strong downtrend.

Step 2

Next, wait for a retracement from the highest or the lowest point, which we will be evaluated based on our strategy rules. The retracement should be such that there are seven consecutive candles of the same color. One or two candles of the opposite color are okay, but we need to make sure that it does not impact the structure of the retracement. These seven candles represent an extended pullback, which can lead to reversal any moment.

In the below image, we can see seven days of the up movement, which is exactly the kind of retracement which we need for the strategy.

Step 3

In this step, we need to check the position of the price after seven straight days of the movement. The strategy works best if the price coincides with a key technical level of support and resistance. This is because, in these areas, the price action is very strong, and market moves as per expectations. But it is important to make sure that no step of the strategy is used individually. All of them need to be used collectively.

We enter the market once we get confirmation after the 7-day period. The confirmation is nothing but a bullish candle in case of a ‘long’ setup and a bearish candle in case of a ‘short’ setup.

In our example, we see that the price has approached the previous ‘lower high’ of the downtrend. This is an area where we can expect sellers to get active and take the price lower.

Step 4

Finally, we need to determine the ‘stop-loss’ and ‘take-profit‘ for the strategy. We place the stop-loss a little higher than the bullish candle when entering for a ‘long’ and little lower the bearish candle if entering for a ‘short.’ We take profit at two places in this strategy. The first take-profit is set at the previous higher high or lower low, while the second take-profit is set at 1:2 risk to reward.

Strategy Roundup

As there are many conditions associated with the strategy, the setup might be rare, but when it does occur, it is significant. We have seen trends where the retracement occurs for just a few days before it starts moving in the direction of the major trend. But these setups are not reliable. The most important condition of this setup is the continuous appearance of bullish or bearish candles for seven days.

Categories
Forex Basic Strategies

Divergence Trading – MACD Regular Divergence Forex Strategy

Introduction

MACD regular divergence is a trading strategy that considers the relationship between Moving Average Convergence Divergence and the price.

MACD, a technical indicator, invented by Gerald Appel in 1979. It is very famous among professional and institutional traders; therefore, it can provide a reliable trading opportunity. On the other hand, divergence is a significant concept in trading that happens between the price and oscillator.

In most of the cases, oscillators like MACD or RSI move with the price. However, there is some condition where MACD does not follow the same direction of the price and creates divergence.

What is the MACD Divergence Strategy?

MACD is a Momentum based indicator that shows the correlation between two moving averages. Traders use this indicator in stocks, bonds, and forex trading as a trend continuation and reversal indicator. If you want to become a successful forex trader, MACD would be the best indicator to follow.

If you use a momentum-based strategy, MACD is the best available technical indicator for you. If you trade using the MACD divergence strategy, it will show you the proper entry and exit points.

There are several types of divergence, but in most cases, investors use the following types of divergences:

Hidden Divergence

It happens when the MACD histogram creates divergence with the price. It indicates a minor market reversal and significant trend continuation.

Regular Divergence

It happens when MACD EMA moves to the opposite direction of the price. Regular divergence from a significant support or resistance level indicates a potential market reversal.

In the example below, we can see a naked chart with a MACD indicator.

If you look at the image, you can see several lower lows, and higher highs in the price and MACD EMA also followed the same direction. However, there is some point where the price and MACD did not follow the same direction as indicated in the image below.

This is how divergence forms in the price. It indicates a potential market reversal if it happens from significant support or resistance levels.

Bullish MACD Regular Divergence Trading Strategy

Bullish MACD regular divergence happens when the price of a currency pair moves to the opposite direction of the MACD histogram from a significant support level. Therefore, bullish MACD divergence strategy is considered as the positive divergence signal.

Timeframe

In this trading strategy, there is no specification of the timeframe. However, this trading strategy works well in H1 and H4 timeframe.

Currency Pair

The MACD divergence trading strategy works well in most major and minor currency pairs, including EURUSD, GBPUSD, USDJPY, and AUDUSD.

Location of the Divergence

It is essential to identify the location of the price. In this bullish divergence trading strategy, the price should form the divergence in a critical support level. Any divergence from a random place rather than a vital level would not provide good profitability. Before moving to the entry point, we should find Negative Positive and Negative (NPN) MACD histogram to form.

Entry

After forming the divergence, we should wait for a bearish reversal candlestick to enter the trade. Make sure to enter the trade as soon as the candle closes.

Stop Loss and Take Profit

In the bullish divergence trading strategy, stop loss would be below the reversal candlestick candle with 10-15 pips buffer.

The first take profit level would be based on 1:1 risk: reward, where you should close 50% of the trade and move the stop loss at breakeven. Later on, the 2nd take profit level would be based on near term event level from where the market is expected to show some correction.

However, as part of the trade management, you can extend the take profit level based on the market momentum. If the price shows an impulsive bullish pressure near the resistance level, it may break the level by creating a new high. In that case, you can extend the take profit level if your trade management system allows.

Bearish MACD Regular Divergence Trading Strategy

Bearish MACD regular divergence happens when the price of a currency pair moves to the opposite direction of the MACD histogram from a prominent resistance level. It is also considered as a negative divergence signal.

Timeframe

Similar to the bullish divergence, this trading strategy works well in H1 and H4 timeframe. You can use this trading strategy in all timeframes, but the higher timeframe provides a reliable result. On the other hand, traders often find it challenging to observe the price in daily and weekly timeframes. Therefore, H1 and H4 are ideal for swing traders.

Currency Pair

The bearish MACD divergence trading strategy works well in most major and minor currency pairs, including EURUSD, GBPUSD, USDJPY, and AUDUSD.

Location of the Divergence

It is essential to identify the location of the price. In this bearish regular divergence trading strategy, the divergence should format a significant resistance level. Any divergence from a random place would not provide good profitability.

Before moving to the entry point, we should find Positive Negative Positive (PNP) MACD histogram to form.

Entry

After forming the divergence, we should wait for a bullish reversal candlestick to enter the trade. Make sure to enter the trade as soon as the candle closes.

Stop Loss and Take Profit

In the bullish divergence trading strategy, stop loss would be above the reversal candlestick candle with 10-15 pips buffer.

The first take profit level would be based on 1:1 risk: reward, where you should close 50% of the trade and move the stop loss at breakeven. Later on, the 2nd take profit level would be based on the near term event level.

Summary

Let’s summaries the MACD regular divergence trading strategy:

  • Find the divergence based on NPN and PNP from a significant level.
  • Enter the trade after a reversal candlestick formation.
  • Stop-loss should be below or above the reversal candlestick with 10 to 15 pips buffer.
  • The first take profit would be based on 1:1 risk: reward ratio, and the second take profit would be based on the price action on the next event level.

There are more ways to use divergence as a trading strategy. Besides the divergence formation, you should focus on how the price is approaching a critical level. Any weakness at a significant level would indicate the first impression of market reversal. Later on, the divergence would indicate the final try of the opposite party. Happy Trading!

Categories
Crypto Market Analysis

Daily Crypto Review, August 6 – ‘Ethereum Is a Ponzi Scheme’ – Adam Back; ETC Suffers Yet Another 51% Attack

The cryptocurrency market ended up mostly in the green, with (of course) a few exceptions. Bitcoin is currently trading for $11,665, which represents an increase of 3,46% on the day. Meanwhile, Ethereum gained 1.6% on the day, while XRP gained 1.41%.

 Daily Crypto Sector Heat Map

When talking about top100 cryptocurrencies, Band Protocol gained 36.21% on the day, making it the most prominent daily gainer. Travala.com (24%) and Bancor (22.19%) also did great. On the other hand, Nexohas lost 21.32%, making it the most prominent daily loser. It is followed by The Midas Touch’s loss of 8.47% and THORChain’s loss of 7.70%.

Top 10 24-hour Performers (Click to enlarge)

Bottom 10 24-hour Performers (Click to enlarge)

Bitcoin’s dominance level has increased since we last reported, with its value currently at 61.48%. This value represents a 0.31% difference to the upside when compared to yesterday’s value.

Daily Crypto Market Cap Chart

The cryptocurrency market capitalization has increased since we last reported. Its current value is $353.48 billion, which represents an increase of $12.09 billion when compared to the value it had yesterday.

_______________________________________________________________________

What happened in the past 24 hours?

_______________________________________________________________________

_______________________________________________________________________

Technical analysis

_______________________________________________________________________

Bitcoin

The largest cryptocurrency by market capitalization continued its move towards the upside after a few days of indecisiveness and consolidation. Bitcoin saw a slight increase in volume, which brought the price above the $11,460 resistance level and up to $11,820. However, the move stopped there (for now), and Bitcoin is currently consolidating above the $11,460 level, testing it as support.

BTC traders should look for an opportunity to make a trade when BTC confirms or fails to confirm its position with $11,460.

BTC/USD 4-hour Chart

Technical factors:
  • Price is currently above its 50-period EMA, as well as its 21-period EMA
  • Price is near its top B.B
  • RSI is elevated (62.37)
  • Volume is increasing
Key levels to the upside          Key levels to the downside

1: $11,460                                 1: $11,090

2: $11,630                                 2: $10,855

 3: $12,000                                 3: $10,505

Ethereum

Ethereum seems to be back on its steady upwards path, which began on July 21. The second-largest cryptocurrency by market cap rose steadily throughout the day, trying to reach past the $415 resistance. While the price did not yet reach this mark, it did increase slightly, supported by the 21 and 50-period moving averages.

Traders should look for a trade opportunity within the range ETH is currently in.

ETH/USD 4-hour Chart

Technical Factors:
  • Price is above its 21-period EMA and its 50-period EMA
  • Price is slightly above its middle B.B. (20-period SMA)
  • RSI is elevated (60.26)
  • Descending volume
Key levels to the upside          Key levels to the downside

1: $415                                     1: $362

2: $496                                     2: $340

                                                  3: $302

Ripple

XRP experienced sideways movement on low volume throughout the day. The third-largest cryptocurrency by market capitalization was trading near the top of its triangle formation, unable to break it yet. However, the decreasing volume, as well as the price approaching the 80% mark of the formation, indicate a move which will take XRP out of the triangle formation. While it is too early to speculate, XRP seems to have a better chance of breaking to the upside.

Traders can look for an opportunity to trade when XRP breaks its triangle formation.

XRP/USD 4-hour Chart

Technical factors:
  • Price is above its 21-period and 50-period EMA
  • Price is below the middle B.B. (20-period SMA)
  • RSI is neutral (55.62)
  • Low volume
Key levels to the upside          Key levels to the downside

1: $0.32                                    1: $0.285  

2: $0.3328                                2: $0.266

                                               3: $0.245


Categories
Forex Options

FX Options Market Combined Volume Expiries for 6 th August 2020

Thank you for visiting the Forex Academy FX Options market combined volume expiries section. Each day, where available, we will bring you notable maturities in FX Options of amounts of $100 million-plus, and where these large combined maturities at specified currency exchange rates often have a magnetic effect on price action, especially in the hours leading to their maturities, which happens daily at 10.00 AM Eastern time. This is because the big institutional players hedge their positions accordingly. Each option expiry should be considered ‘in-play’ with a good chance of a strike if labelled in red, still in play and a possible strike if labelled in orange and ‘out of play’ and an unlikely strike if labelled in blue, with regard to the likelihood of price action meeting the strike price at maturity.

…………………………………………………………………………………………………………

FX option expiries for Aug 6 NY cut at 10:00 Eastern Time, via DTCC, can be found below.

– EUR/USD: EUR amounts

  • 1.1700 1.2bn
  • 1.1725 1.1bn

EURUSD has 2 option expiries today. The exchange rate is still elevated and they are both out of play

– GBP/USD: GBP amounts

  • 1.3000 708m

GBPUSD no change in interest rates this morning and the policy decisions remained unchanged which should keep cable elevated to the current levels with 1.3200 in range.

– USD/JPY: USD amounts

  • 105.00 2.8bn
  • 105.25 660m
  • 105.60 385m
  • 105.65 630m
  • 105.75 467m
  • 105.85 380m
  • 106.00 444m
  • 106.25 945m
  • 106.50 715m
  •  106.75 680m

USDJPY is in a descending wedge formation and many option expiries are within range. As such, expect price action to be focussed within the red cluster of options.

– AUD/USD: AUD amounts

  • 0.7150 520m

AUDUSD has a clearly defined area of consolidation. US dollar strength/weakness will rule price direction for the rest of today’s play. A breach of the support line to the downside will leave the door open for the 0.7150 option.

………………………………………………………………………………….

As you can see on the preferred 1-hour chart(s), we have also plotted the expiration levels at the various exchange rate maturities and we have also labelled in red, orange and blue.  Therefore, if you see option expiry exchange rates labelled in red these should be considered in-play, because we believe there is a greater chance of the expiry maturing at these levels based on technical analysis at the time of writing. There is still a lesser possibility of a strike if they are in orange and so these are ‘in-play’ too. However, if we have labelled them in blue, they should be considered ‘not in-play’ and therefore price action would be unlikely to reach these levels, which are often referred to as Strikes, at the time of the 10 AM New York cut.

Our technical analysis is based on exchange rates which may be several hours earlier in the day and may not reflect price action at the time of the maturities. Also, we have not factored in economic data releases or keynote speeches by policymakers, or potential market volatility leading up to the cut.

Although we have added some technical analysis, we suggest you take the levels and plot them onto your own trading charts and incorporate the information into your own trading methodology in order to use the information to your advantage. Remember the higher the amount, the larger the gravitational pull towards the exchange rate maturity at 10:00 AM Eastern time.

If you want to learn how forex option expiries affect price action in the spot FX market see our educational article by clicking here: https://bit.ly/2VR2Nji

DISCLAIMER: Please note that this information is for educational purposes. Also, the maturities will look more or less likely to become a strike at 10 AM NY time due to exchange rate fluctuations resulting in a different perspective with regard to technical analysis, and also due to upcoming economic data releases for the associated pairs.

Categories
Forex Market Analysis

Daily F.X. Analysis, August 06 – Top Trade Setups In Forex – A Day Before NFP! 

It’s going to be a busy day from a news perspective, especially for the GBP pairs. The Bank of England is scheduled to publish its Monetary policy with bank rates. Although economists are not expecting BOE to change interest rates, the MPC Asset Purchase Facility Votes is expected to change. Nine out of nine members have voted to increase the asset purchase program to accommodate the economy.

Economic Events to Watch Today  


EUR/USD – Daily Analysis

The EUR/USD closed at 1.18640 after placing a high of 1.19048 and a low of 1.17927. The EUR/USD once again saw a bullish movement after a brief U.S. dollar recovery attempt earlier this week. Despite worsened coronavirus cases in some Eurozone nations, the bloc’s outlook remained much more optimistic than the U.S. outlook.

While the advances in the Euro have slowed, the EUR/USD pair has continued to trend higher over the past week. EUR/USD pair climbed slightly from 1.1656 to 1.1778 last week. After U.S. Dollar attempted to recover, the pair EUR/USD saw a brief dip at the beginning of this week. However, the EUR/USD pair is eventually rising again as the U.S. dollar’s weakness persists. Whereas, the potential for advances in the currency pair was limited as coronavirus concerns rose on Sunday.

The Euro remained broadly appealing overall. Throughout the coronavirus pandemic, the E.U. and the European Central Bank have handled the crisis well compared to other major economies like the U.K. & U.S.

As a result, Euro’s losses in response to a rebounding U.S. dollar have been limited. The Euro and U.S. dollar has a negative correlation, and the Euro often gains from the U.S. dollar weakness. It means that the rally of the EUR/USD pair is set to continue even a rise in worsening coronavirus cases’ concerns.

The Euro appeal was also down after Spain saw a surge in coronavirus cases, and speculations arose that the Eurozone could face fresh lockdowns in Spain to support the Eurozone economy. On the U.S. dollar front, the greenback attempted recovery earlier this week; however, the gloomy outlook persisted and kept investors from mounting much of a recovery rally in the currency.

The number of coronavirus cases in the United States has increased to its highest, and the U.S. government and Federal Reserve have only taken mixed action to limit the virus spread and protect the U.S. economy. Attempts to push further stimulus have been stuck in U.S. Congress, and Federal Reserve may become more dovish.

On the data front, at 12:15 GMT, the Spanish Services PMI fell short of expectations of 52.3 and came in as 51.9. The Italian Services PMI for July came in as 51.6 against the expectations of 51.6 and supported Euro.

At 12:50 GMT, the French Final Services PMI for July dropped to 57.3 against the expected 57.8 and weighed on Euro. At 12: 55 GMT, the German Final Services PMI dropped to 55.6 against the forecasted 56.7. The Final Services PMI for the whole bloc fell to 54.7against the forecasted 55.1and weighed on EURO.

From US Side, the ISM Non-Manufacturing PMI rose in July to 58.1 from the expected 55.0 and supported the U.S. dollar. Though the data was against the movement of EUR/USD pair, however, pair still moved in the upward direction.

Daily Technical Levels

Support Pivot Resistance
1.1802 1.1854 1.1915
1.1740 1.1968
1.1688 1.2029

EUR/USD– Trading Tip

The technical side of the EUR/USD remains mostly the same as it’s trading with a bullish bias around 1.1880 level. On the higher side, the EUR/USD pair may find resistance at 1.1909 level, and the closing of candles below this level can keep bearish pressure on EUR/USD. A bullish breakout of this level can extend the buying trend until 1.2050. Today, the EUR/USD is likely to find support at 1.1800 level.


GBP/USD – Daily Analysis

The GBP/USD closed at 1.31133 after placing a high of 1.31614 and a low of 1.30528. The pound rose on Wednesday to remain on course for a third-straight weekly gain against the U.S. dollar and ignored weaker than expected economic data ahead of the Bank of England meeting on Thursday. On Wednesday, the Final Services PMI in July came in as expected 56.5 points and indicated expansion in the services sector in the U.K.

This Thursday, the focus will be on the Bank of England’s monetary policy decision and Andrew bailey’s speech. The central bank of England is anticipated to keep interest rates unchanged but will roll out its forecasts on a range of economic measures, including Inflation, GDP, and unemployment. In recent weeks, debates have been under discussion about the BoE’s cutting of rates below zero, but Thursday’s meeting is unlikely to offer detailed insight.

The NIRP (Negative Interest Rate Policy) has been under active review at the Bank of England, but it seems like a little too early for the central bank to make any decisive move. Some analysts expect that the Bank of England will prefer to hold off on using a negative interest rate until the EU-UK relationship for 2021 gets cleared.

On the U.S. front, the ADP Non-Farm Employment Change dropped to 167K from the expected 1200K in July. It means that the U.S. government introduced 167K jobs only while that weighed on the U.S. dollar and added strength to the GBP/USD pair gains.

However, in July, the Final Services PMI rose to 50.0 from expected 49.6, and the ISM Non-Manufacturing PMI rose to 58.1 from expected 55.0. This showed an expansion in America’s services sector in July and gave support to the U.S. dollar that weighted on additional gains in GBP/USD pair.

Another reason for the rise in GBP/USD pair was the weakness of the U.S. dollar. The ever increasing numbers of coronavirus cases dampened the prospects for a swift economic recovery in the U.S. and forced investors to continue dumping the greenback. This, coupled with the delay in the U.S. fiscal stimulus package’s announcement and further pressurized the U.S. dollar.

The U.S. dollar was so under pressure that even the goodish rebound in the U.S. Treasury bond yields failed to support the U.S. dollar.

Apart from this, the rising number of coronavirus cases in the U.K. and the renewed fears of no-deal Brexit as both sides were lagging in the progress of securing a deal, held investors to place any aggressive bullish position in the GBP/USD pair ahead of BoE monetary policy.

Daily Technical Levels

Support Pivot Resistance
1.3060 1.3111 1.3166
1.3005 1.3217
1.2954 1.3271

GBP/USD– Trading Tip

The GBP/USD is trading at 1.3085 level, holding right below the triple top resistance area of 1.3101 level while the bullish breakout of 1.3105 can drive more buying in the GBP/USD pair. On the higher side, the GBP/USD may find resistance at 1.3175, while support can be found around 1.3056 and 1.3022 level. Let’s keep an eye on 1.3125 to extract a bearish bias in the GBP/USD pair today. A bearish breakout of 1.3050 can drive more selling until 1.3005.


USD/JPY – Daily Analysis

The USD/JPY pair was closed at 105.592 after placing a high of 105.871 and a low of 105.318. Overall the movement of the USD/JPY pair remained bearish throughout the day. The USD/JPY pair extended the decline on the back of the weaker U.S. dollar across the board and bank of Japan governor Kuroda’s speech telling that Japan’s economy will improve in the second half of the year.

The Bank of Japan Governor Haruhiko Kuroda warned that in order to contain the spread of public health measures were re-introduced, then the economic activity could be significantly constrained. He also affirmed that Japan was not slipping into deflation and that the central bank would continue with its efforts to achieve the inflation target of 2%. Kuroda again assured that the Bank of Japan will be ready to ramp up the monetary stimulus without hesitation if needed to aid the economy through the pandemic crisis.

Kuroda also said that Japan’s financial system was quite safe and stable and countered the fears that the banking sector would fall out from COVID-19. He also warned that if pandemic prolonged longer than expected, there will be risks to Japan’s financial stability.

He said that Japanese and overseas economies would gradually improve from the second half of this year despite extremely high uncertainties. But the pace of improvement is likely to be moderate as the preventive measures to control the virus spread has its effects on economic activity.

On the other hand, the greenback was the worst performer in the currency market on Wednesday. It was so under pressure that it could not benefit from the latest round of economic data that showed an improvement in the Service Sector of the U.S. The rebound in the U.S. Treasury yield also could not support the U.S. dollar. The U.S. Dollar Index (DXY) was testing the 92.60 level lowest since last week.

On the data front, the ADP Non-Farm Employment Change showed that the U.S. created 167,000 jobs in July against the estimated 1200K. This weighed on the U.S. dollar and added further in the losses of the USD/JPY pair.

On Wednesday, U.S. President Donald Trump said that big jobs were coming on Friday. However, private payroll data by ADP reported on Wednesday that just 167,000 jobs were created in July.

 The Trade Balance from the U.S. fell in line with the expectations of -50.7B. The Final Services PMI rose to 50.0 points in July than the expectations of 49.6 and supported the U.S. dollar. At the same time, the ISM Non-Manufacturing PMI also rose to 58.1 points from the forecasted 55.0 and came in favor of the U.S. dollar.

However, USD bulls did not cheer the positive data, and the U.S. dollar remained under stress on Wednesday to post losses on the day.

On the US-China front, China’s ambassador to Washington said that China did not want to see a Cold War break out between China and the U.S. He suggested that both countries need to work to repair their relations that were under extraordinary stress.

Daily Technical Levels

Support Pivot Resistance
105.3100 105.6000 105.8800
105.0300 106.1700
104.7400 106.4500

USD/JPY – Trading Tips

The USD/JPY is trading with the bearish sentiment, especially after violating the 38.2% Fibonacci support level of 105.650. On the lower side, the USD/JPY may find support at 105.078 level, which is extended by the 61.8% Fibonacci retracement level. A bearish breakout of 61.8% level can drive more selling until the next support area f 104.200. The current market price of USDJPY is staying below 50 EMA, which extends resistance at 105.650 level. Let’s consider selling below 105.650 level today. Good luck! 

Categories
Forex Basic Strategies

Everything About The ‘RSI Rollercoaster’ Forex Trading Strategy

Introduction

Sometimes it is best to choose the simplest path of trading. The Relative Strength Index (RSI), invented by Welles Wilder, is one of the oldest and most popular technical analysis tools. If best traders in the world were asked to rank the technical indicators, RSI would certainly be accorded in the top five. It has the unique ability to measure turns in price by measuring the momentum of the turn, which is impossible by any other technical tool in technical analysis.

The standard RSI setting of 70 and 30 serves as a clear sign of overbought and oversold, respectively. The RSI rollercoaster is a strategy that we have developed to take advantage of these turns in the market. The purpose of RSI rollercoaster is to make money from range-bound currency pairs.

Time Frame

This strategy is suitable for trading on the ‘daily’ time frame. It can also be used on the smaller time frames, but the success rate is not very encouraging.

Indicators

As the name suggests, we will be using the RSI indicator for the strategy. No other indicators will be used. Sime knowledge of price action will be helpful.

Currency Pairs

This strategy applies to all the currency pairs listed on the broker’s platform. If trading on the lower time frame, we need to look for highly liquid currency pairs.

Strategy Concept

The key to the RSI rollercoaster strategy versus the traditional RSI strategy is the way of trading the overbought and oversold levels. Here we look for a reversal candle, which provides a sign of exhaustion before taking the trade. This way, we prevent ourselves from picking the top or bottom of a ‘range’ by waiting for an indicator confirmation.

This strategy works best in a ‘ranging’ market where overbought and oversold signals are far more true indications of change in direction. Furthermore, from experience, we have observed that the setup is much more accurate on the ‘daily’ charts than on the smaller time frames such as the 4 hours or 1 hour.

The primary reason for this difference is that ‘daily’ charts include far more data points into their subset and, therefore, change in momentum tends to be more meaningful on longer time frames. Nevertheless, the disproportionate risk to reward ratio in this setup makes even the shorter time frame trades worth considering. We keep in mind that although the setup will fail more frequently on the shorter time frames, the losses will generally be smaller, keeping the overall risk manageable.

Trade Setup

In order to explain the strategy, we have considered an example of such a trade that was carried out on the USD/CAD pair. As the strategy produces a better result on the ‘daily’ time frame, we will be applying it to the ‘daily’ time frame chart. Let us see the steps to execute the strategy.

Step 1

The first step of the strategy is to open the ‘daily’ (preferable) time frame chart of the desired currency pair. Identify key levels of ‘support’ and ‘resistance.’ A ‘support’ or ‘resistance’ is only valid if the price has reacted off from this area at least twice. If the price has reacted only once, that means a ‘range’ has not yet been established.

The below image shows the clear formation of a ‘range’ where the price has reacted multiple times from the ‘ends.’

Step 2

In this step, we wait for the RSI indicator to cross above the 70 ‘mark ‘when the price is near ‘resistance’ or cross below the 30 marks when the price is near ‘support.’ During this time, the price action of the chart is not of much importance. Once the RSI shows a reading below 70 after crossing it, we will look for ‘sell’ opportunities depending on the price action. Similarly, when the RSI shows a reading above 30 after crossing below it, we will look for ‘buy’ opportunities depending on the price action.

In this case, we can see that the price breaks down below ‘support,’ which is an indication of ‘sell’ as per the theory of support and resistance. But as per our strategy, we will not be looking at the price action in this step, and we will focus only on the RSI indicator.

A few days later, we see that the RSI goes below the 30 ‘mark’ for a moment and starts moving higher. This is our first indication of going ‘long’ in the market.

Step 3

We ‘enter’ for a ‘sell’ when the price moves back into the ‘range’ after the indication from RSI. Similarly, we enter for a ‘buy’ when the price moves back into the ‘range’ after the indication from RSI. This price action indicates a false breakout or breakdown, which is identified rightly with the help of an indicator.

In our case, we are entering ‘long’ in the currency pair after we get a confirmation in the form of a bullish candle, as we can see in the below image.

Step 4

In this step, we determine the ‘stop-loss’ and ‘take-profit‘ levels for the strategy. When executing a ‘long’ trade, the stop-loss will be placed just above the ‘high’ where the price created a false breakout. And when executing a ‘sell’ trade, the ‘stop-loss’ will be placed just below the ‘low’ from where the price created a false breakdown. The ‘take-profit’ depends on the major trend of the market. If we are trading against the trend, it should be kept at 1:1 risk to reward or even a little lesser than that. If the ‘trade’ is taking place with the trend, it can be kept at 1:2 risk to reward.

Strategy Roundup

The RSI rollercoaster strategy is designed to squeeze as much profit as possible out of the turns at ‘support’ and ‘resistance.’ Instead of immediately entering into a position when the market moves into an overbought or oversold zone, the RSI, along with a little bit of price action, keeps us away from the market until we get a confirmation sign of the exhaustion. The RSI rollercoaster is almost always in the market, as long as we see wild moves on either side of the ‘range’ to stop-out traders.