Categories
Forex Videos

Forex Options Part 15 Delta Neutral Strategies!

Forex Options XV – Delta Neutral Strategies
The Delta

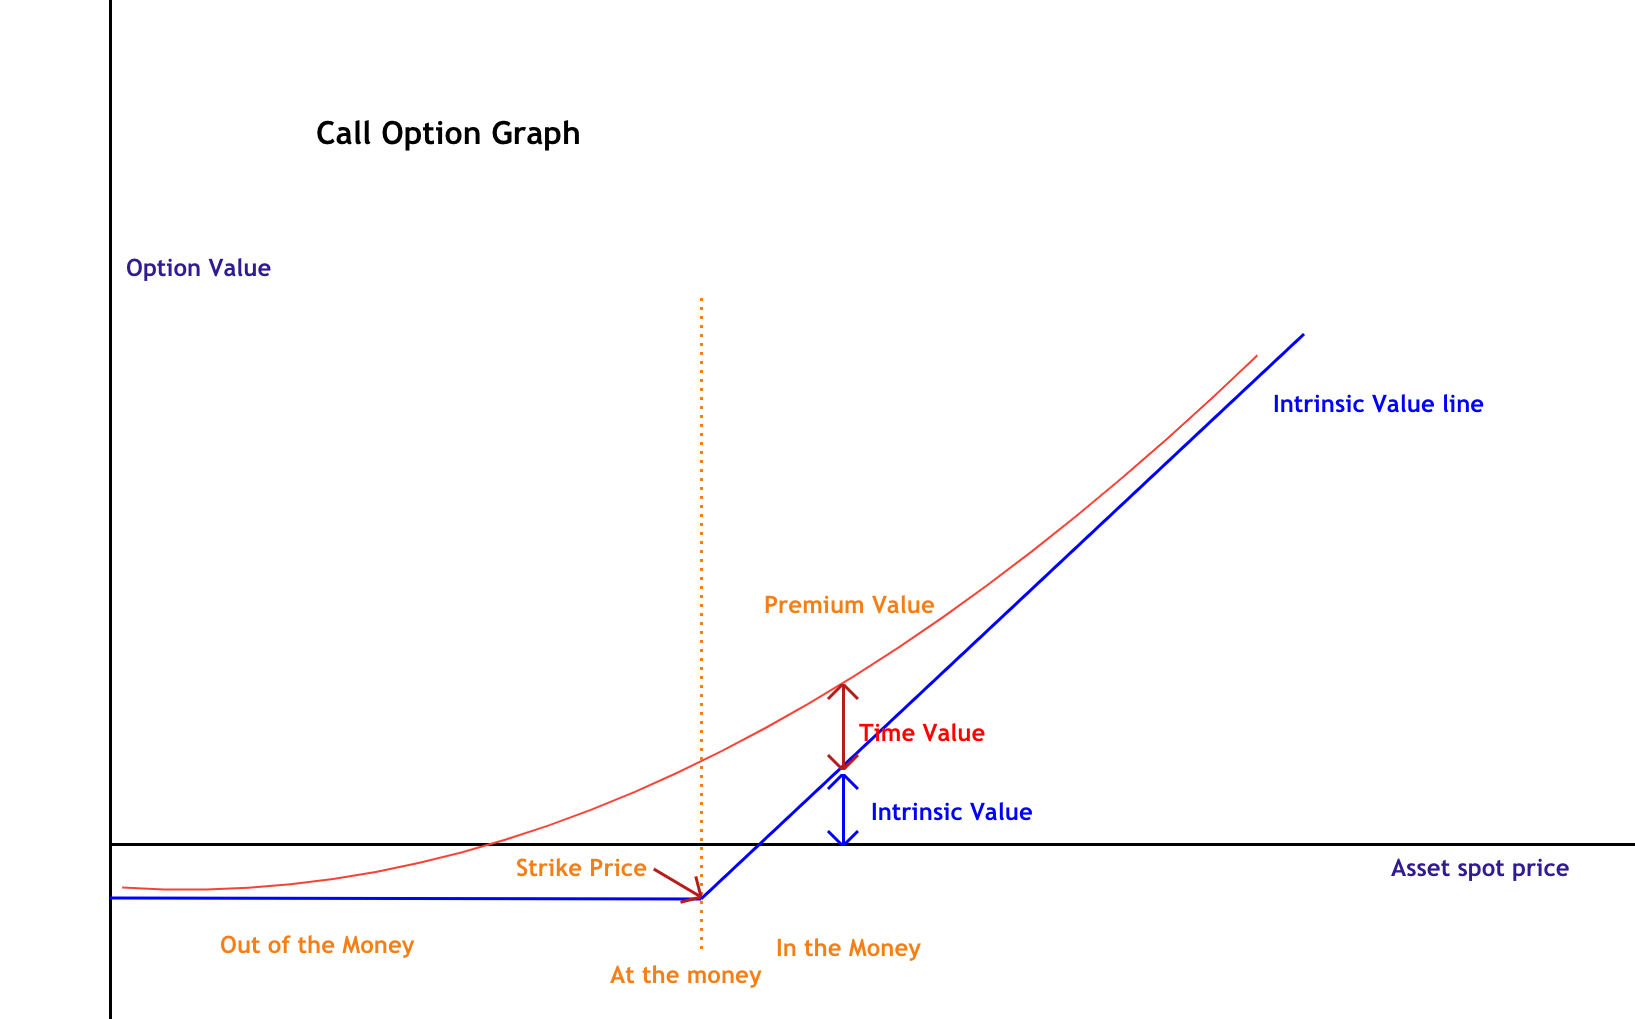
To be proficient with Delta-neutral strategies, one obviously needs to understand Delta. The option Delta can be considered the ratio of change in the option premium relative to the underlying spot price movement.
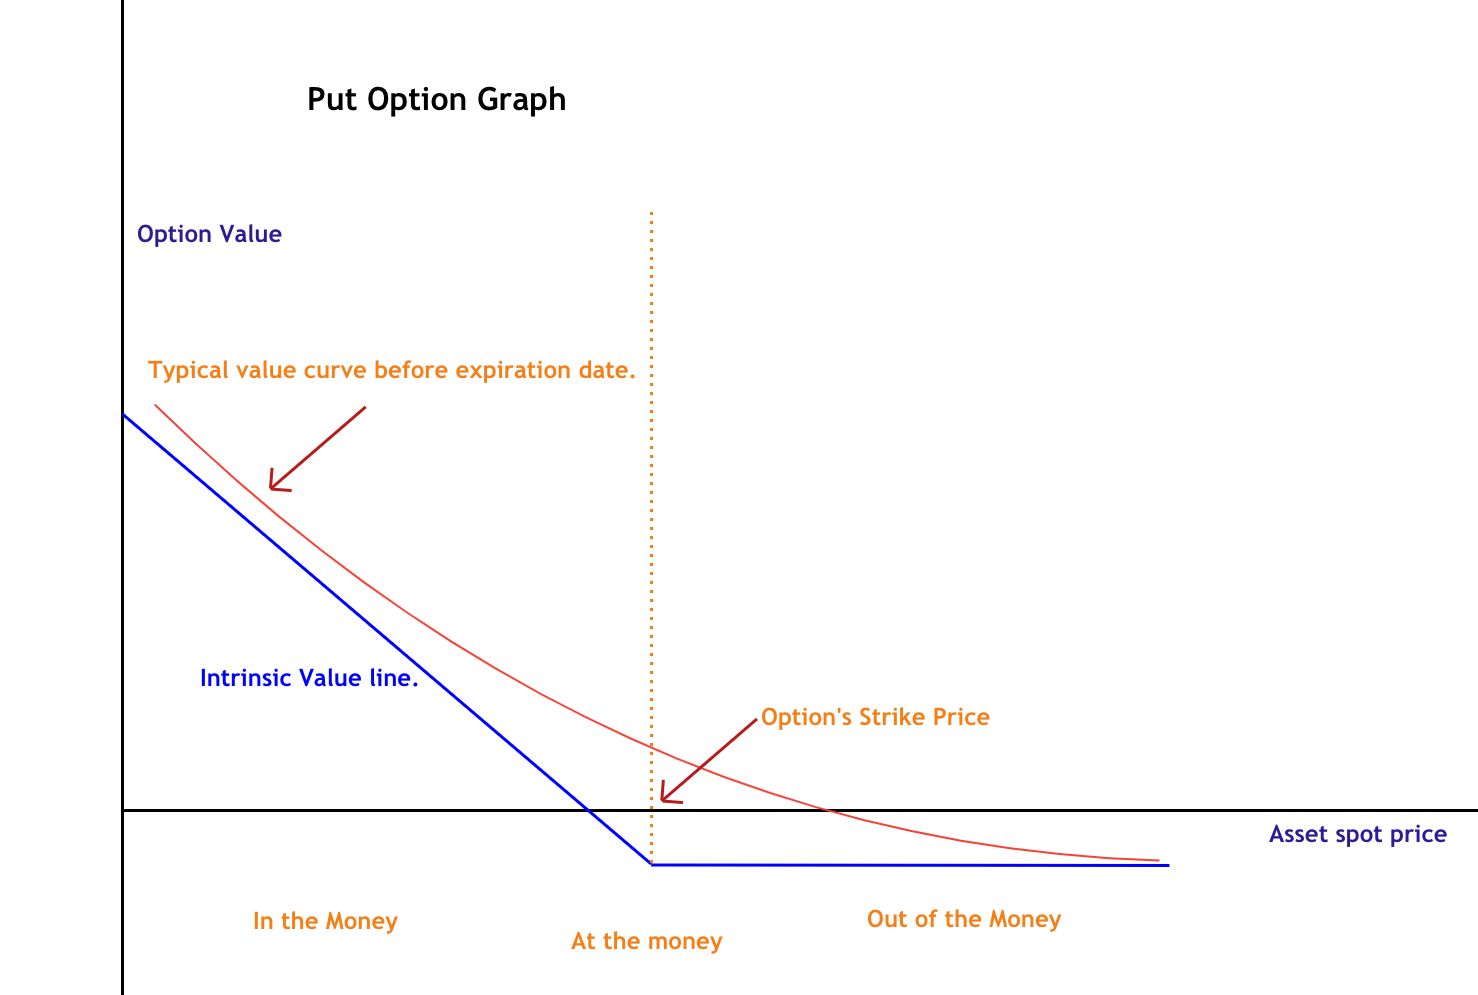
Delta’s range is 0 to100 for Calls and -100 to 0 for Puts. Thus, on a combination of options, it may range from -100 to 100. Bullish strategies will show positive Deltas, whereas bearish positions will present negative Deltas. Bullish strategies include long the underlying, long calls, and short puts. Also, short the underlying, short calls and long puts are bearish strategies.
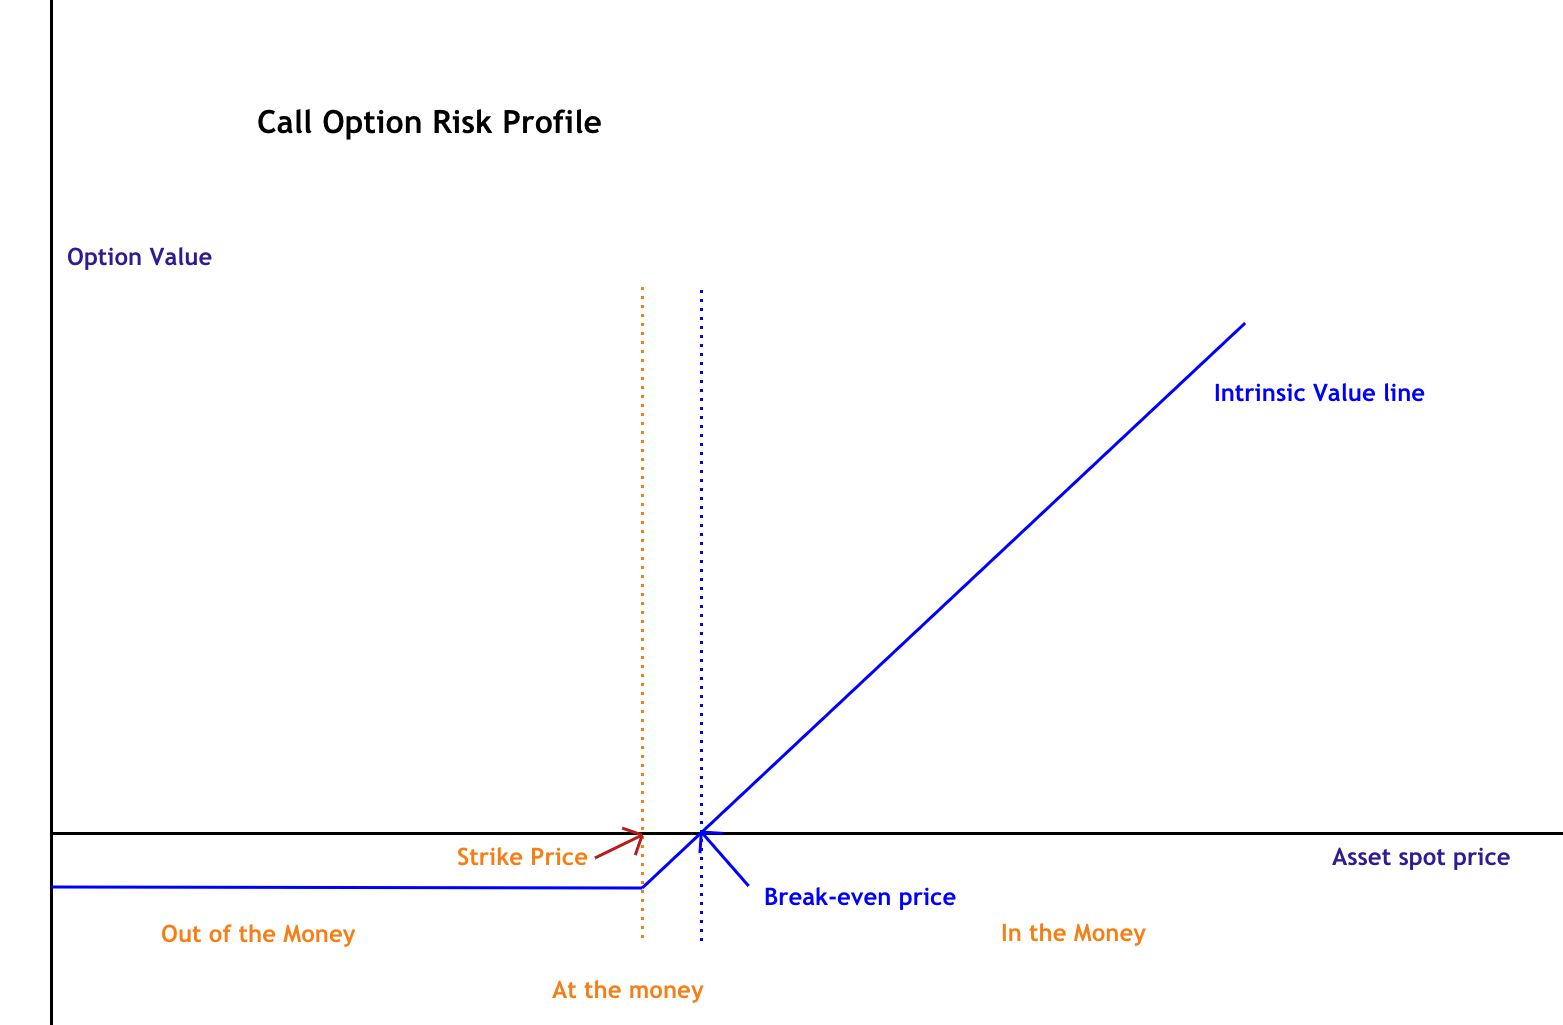
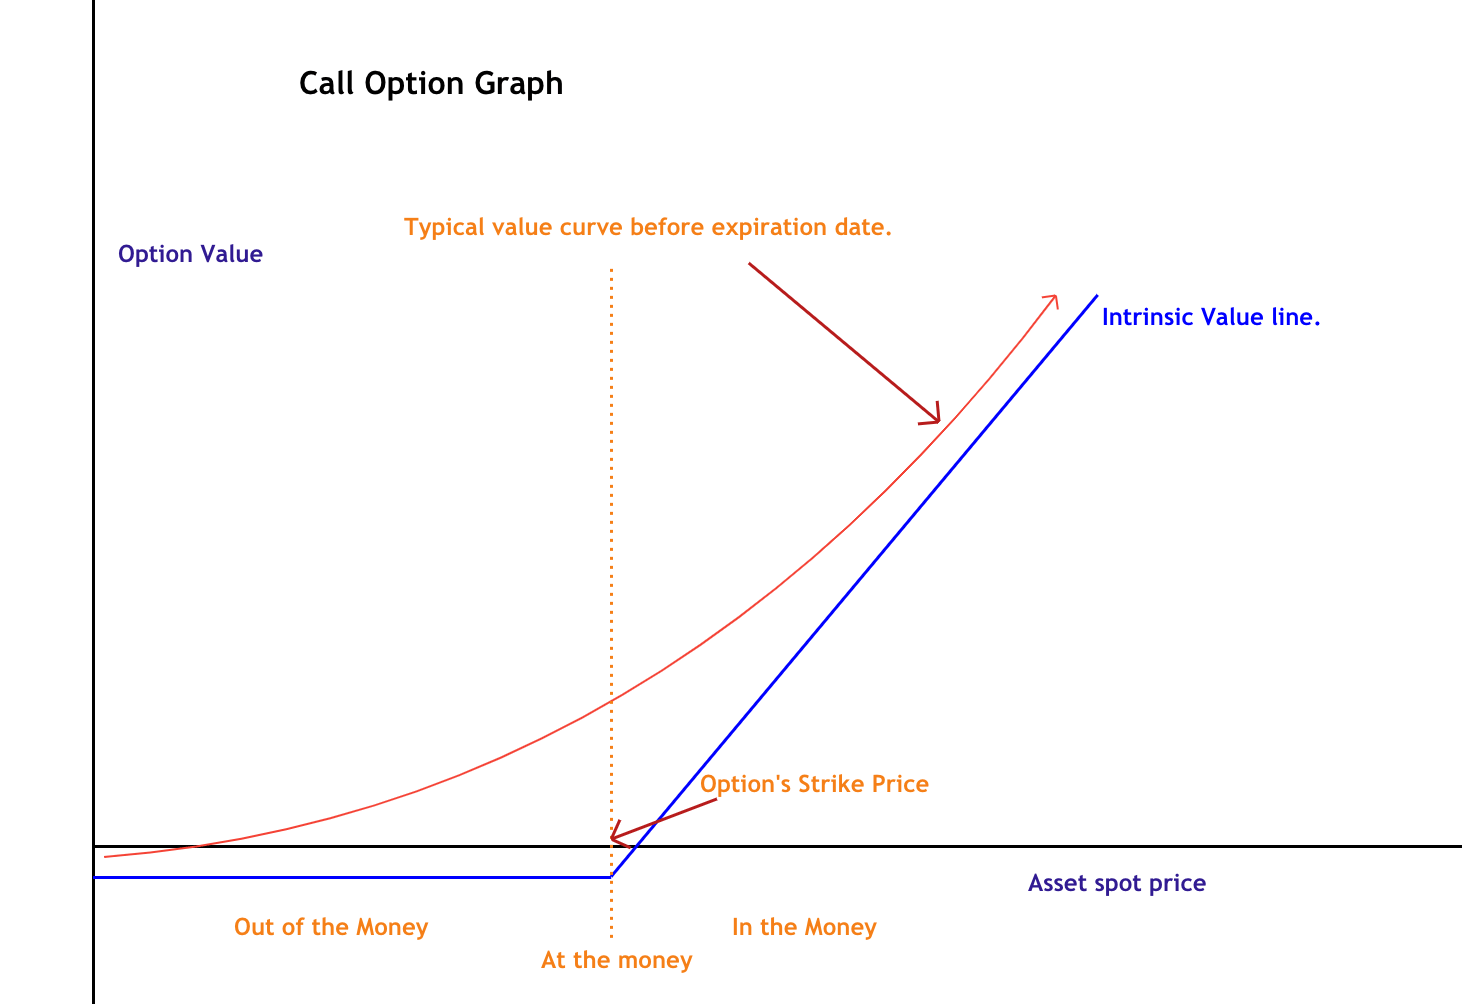
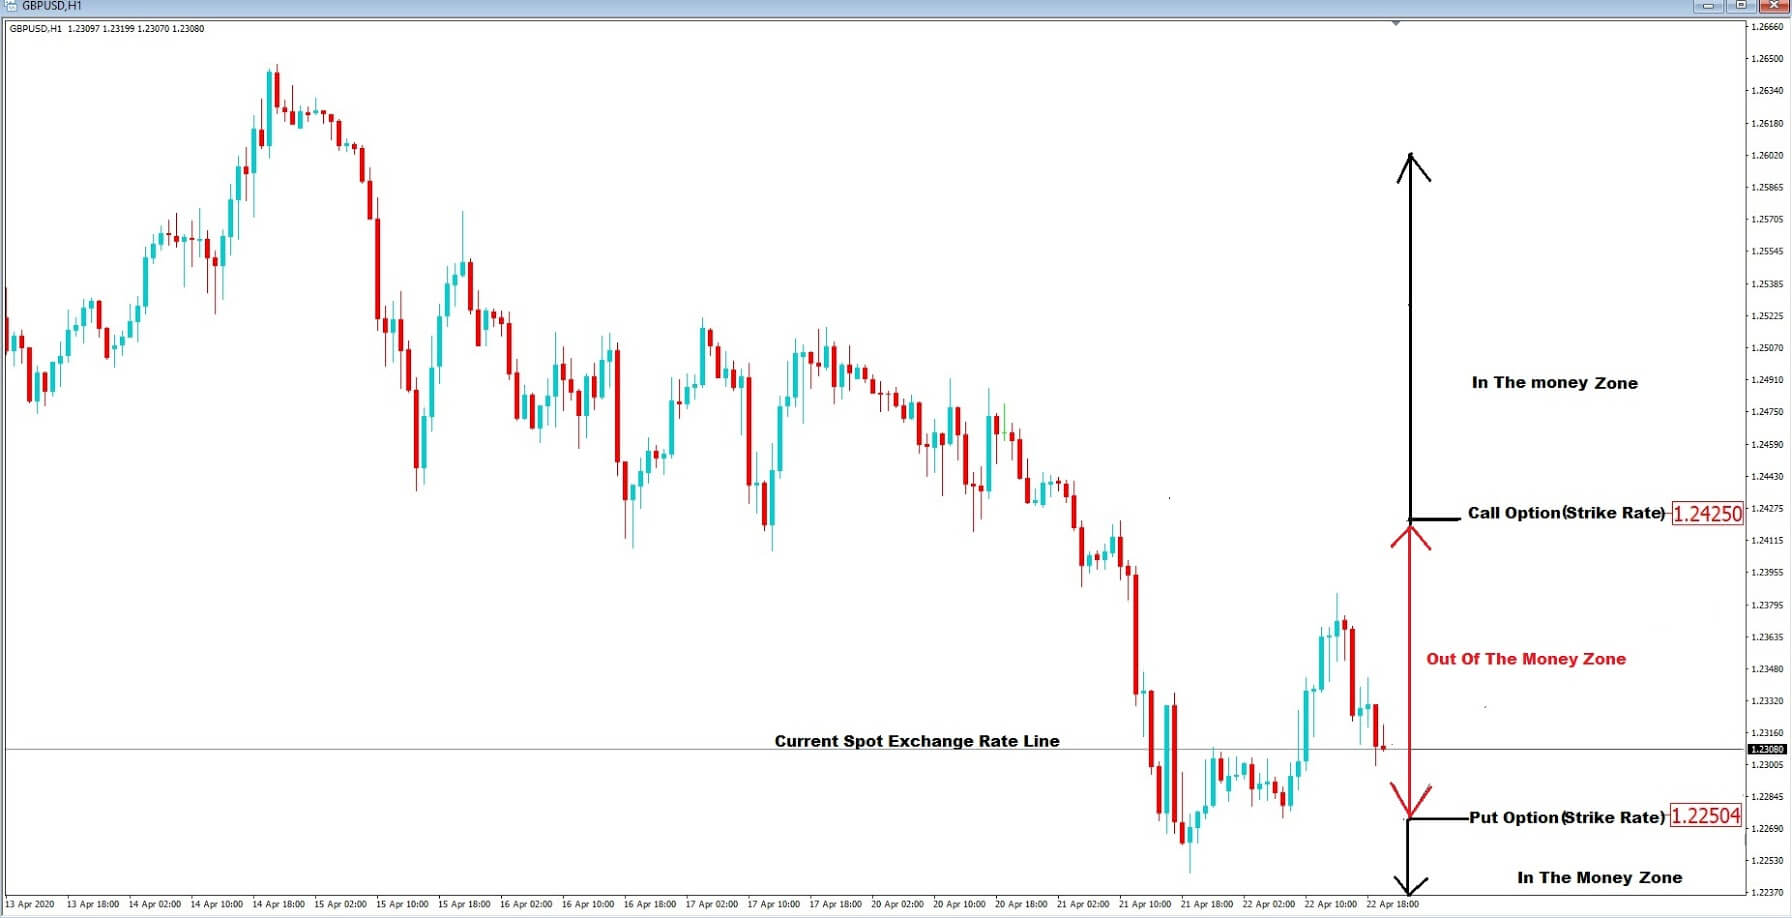
The deeper in-the-money a strategy is, the higher its Delta (regardless of the sign). Out-of- the-money options present Delta values below 50. The farther out, the less its Delta will be. As already explained, the Delta is a proxy to the probability of an option to end in the money at expiration. An option with Delta of 10 has a 10 percent probability of being in-the-money at expiration. An option very deep in-the-money acts very similarly to its underlying. Its time value shrinks while its intrinsic value increases.
On the other hand, out-of-the-money options are almost unaffected even by a significant movement in the underlying. For example, if you were holding that option with a delta of 10, it would catch only 10 percent of the underlying movement. Therefore, a 10-Delta option is cheap, but it captures a tiny portion of market action.

Delta Features

 Are estimates of the option’s price change against the underlying changes in price
 Defines the probability of it expiring with profits
 Delimits the number of options needed to equal the movement of the asset

Relationship between Volatility and Deltas

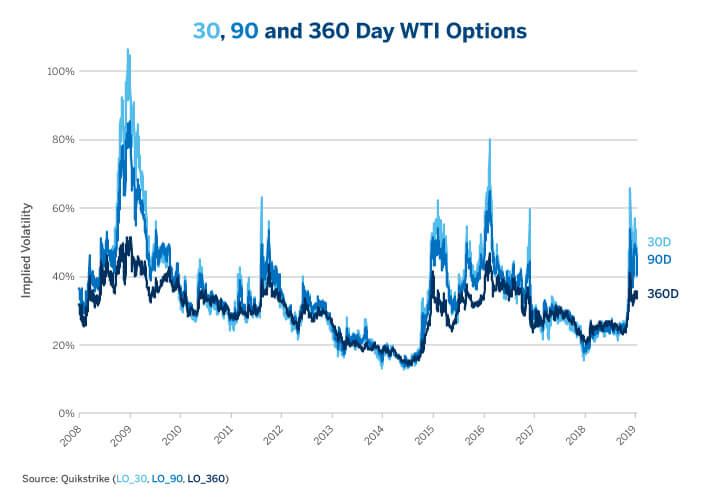
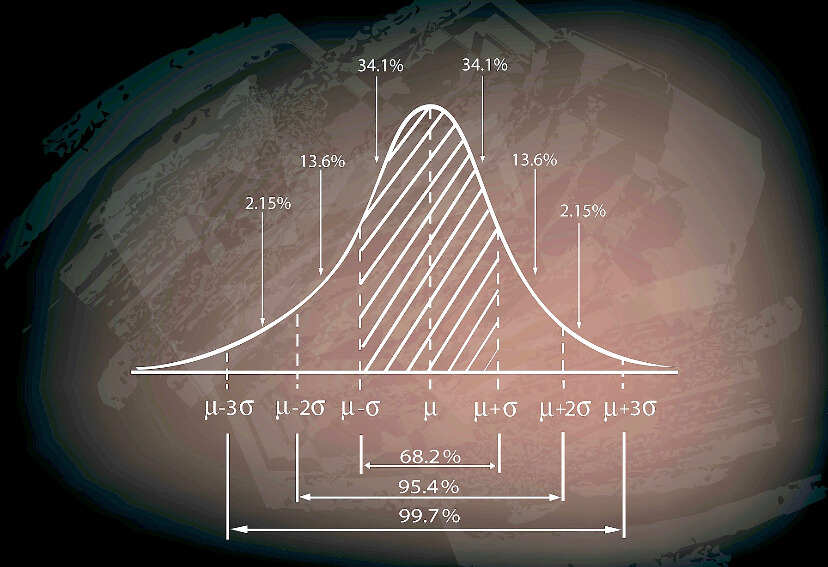
As we have already understood, Volatility is a measure of the uncertainty of the markets and the degree to which the prices of an asset are expected to move over time. Also, Delta can be considered as the sensitivity of an option to its underlying price movement. An increase in Volatility causes all option deltas to move toward 50. For in-the-money options, Deltas will decrease, and for out-of-the-money options, Deltas will increase. Since Deltas are related to the probability of expiring in-the-money, when Volatility grows, probabilities move towards 50-50.

Volatility is a crucial element for Delta-neutral strategies, and knowing how Deltas behave due to Volatility changes and price movements in the underlying is critical.

The Delta Neutral Strategy

A Delta Neutral Strategy is a combination of securities to create a position with a total Delta of zero. It can be a combination of asset plus options or only options whose total delta summation is close to zero. The key idea is to profit from the Volatility changes while covering the position from the movement of the underlying.

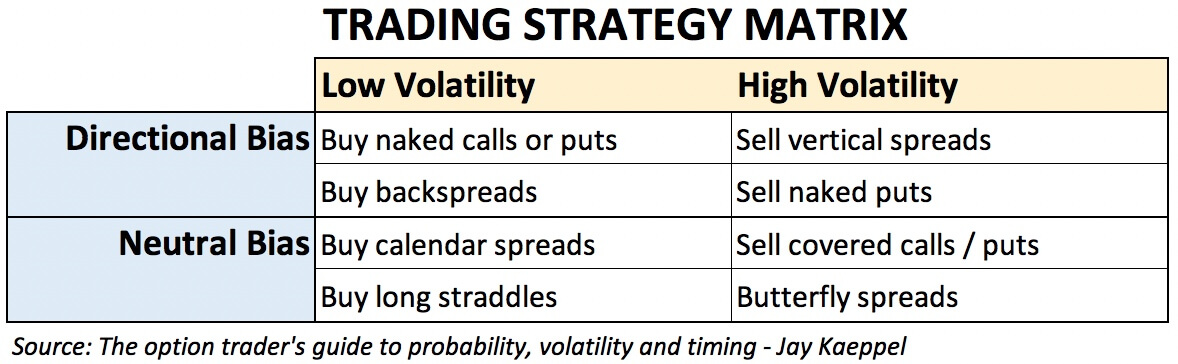
Professional traders think in terms of option spreads, and they hedge their trades to stay neutral on the market direction. To them, the direction of the asset is less critical than the Implied Volatility. Implied Volatility will define when to buy or when to sell options, as it will determine if the option’s price is cheap or expensive.

The second key element is to manage the trade when needed. If the position becomes too bullish or too bearish, the trader should act without hesitation and adjust it back to neutral. The beauty of this concept is that it naturally makes you do the right thing: buy cheap and sell expensive.

Think about it. You start your options trade delta neutral. If your position goes to the bullish side after some time, it means your options betting to the bullish side gained value, whereas your bearish side lost it. What should you do under these circumstances? To move back to neutral, you should sell. Thus, you’re selling high. Imagine then that the price turns and go bearish. Then you must buy some assets to balance the position back to neutral, and you’ll do that when the price is relatively low. We can see that buying and selling come naturally from the need to balance the position, not by market timing considerations, but this happens to be the right strategy.

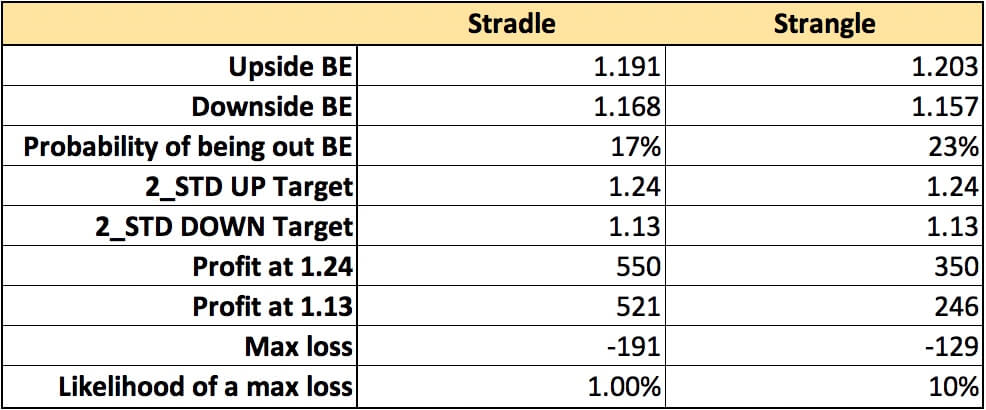
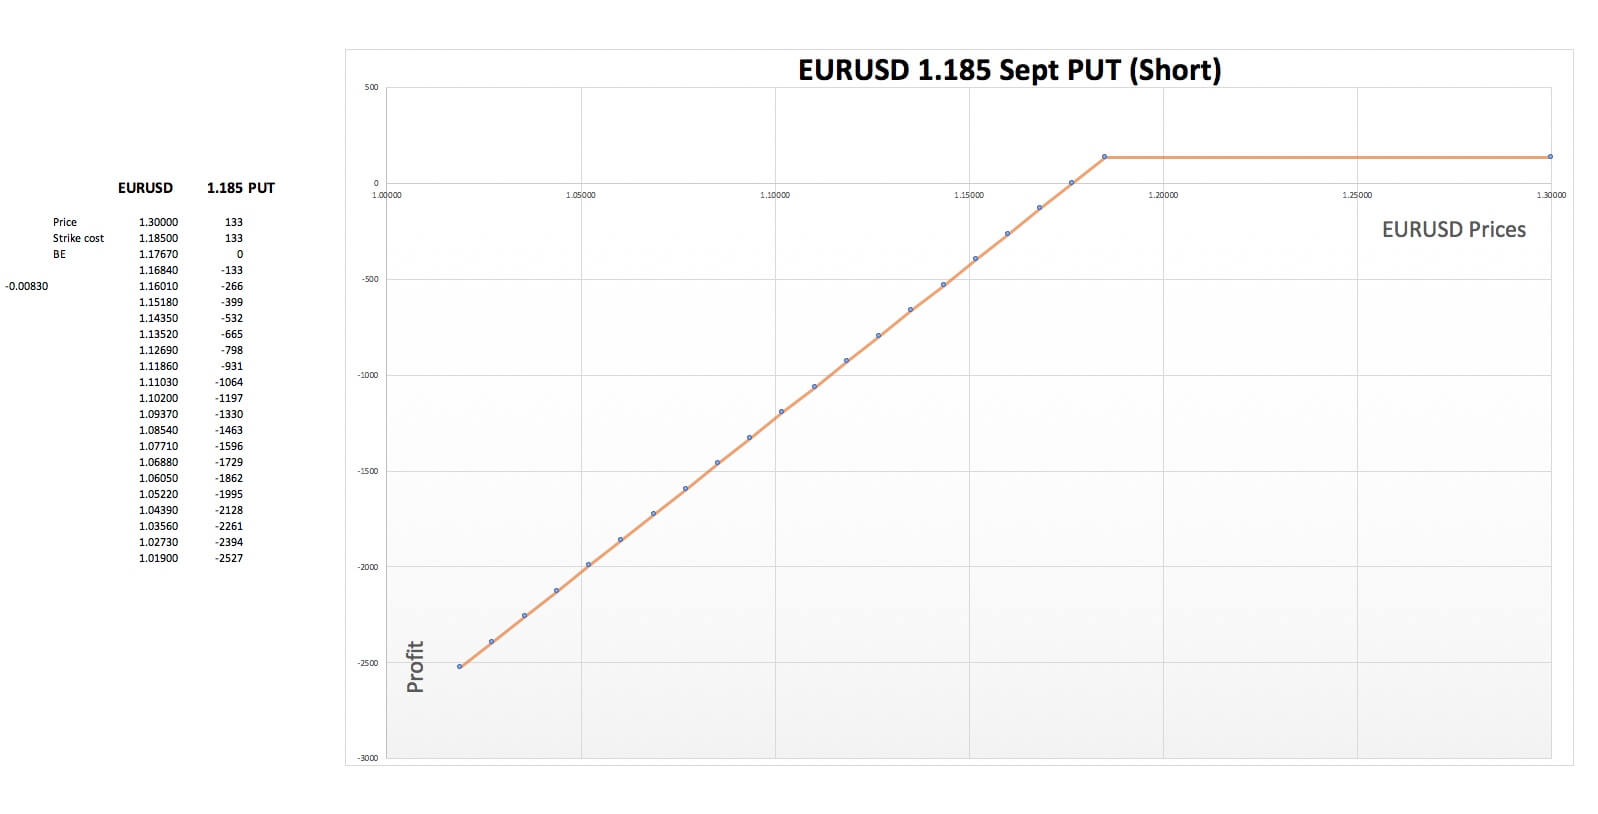
As with other strategies, the upside and downside break-evens must be computed to identify the profit range. The maximum profit and loss potential should be understood by a trader to see if the trade is viable, modified, or discarded. You’re not timing the market, but on mean- reverting markets such as in Forex, this strategy is quite profitable.

Usual Delta Neutral Strategies

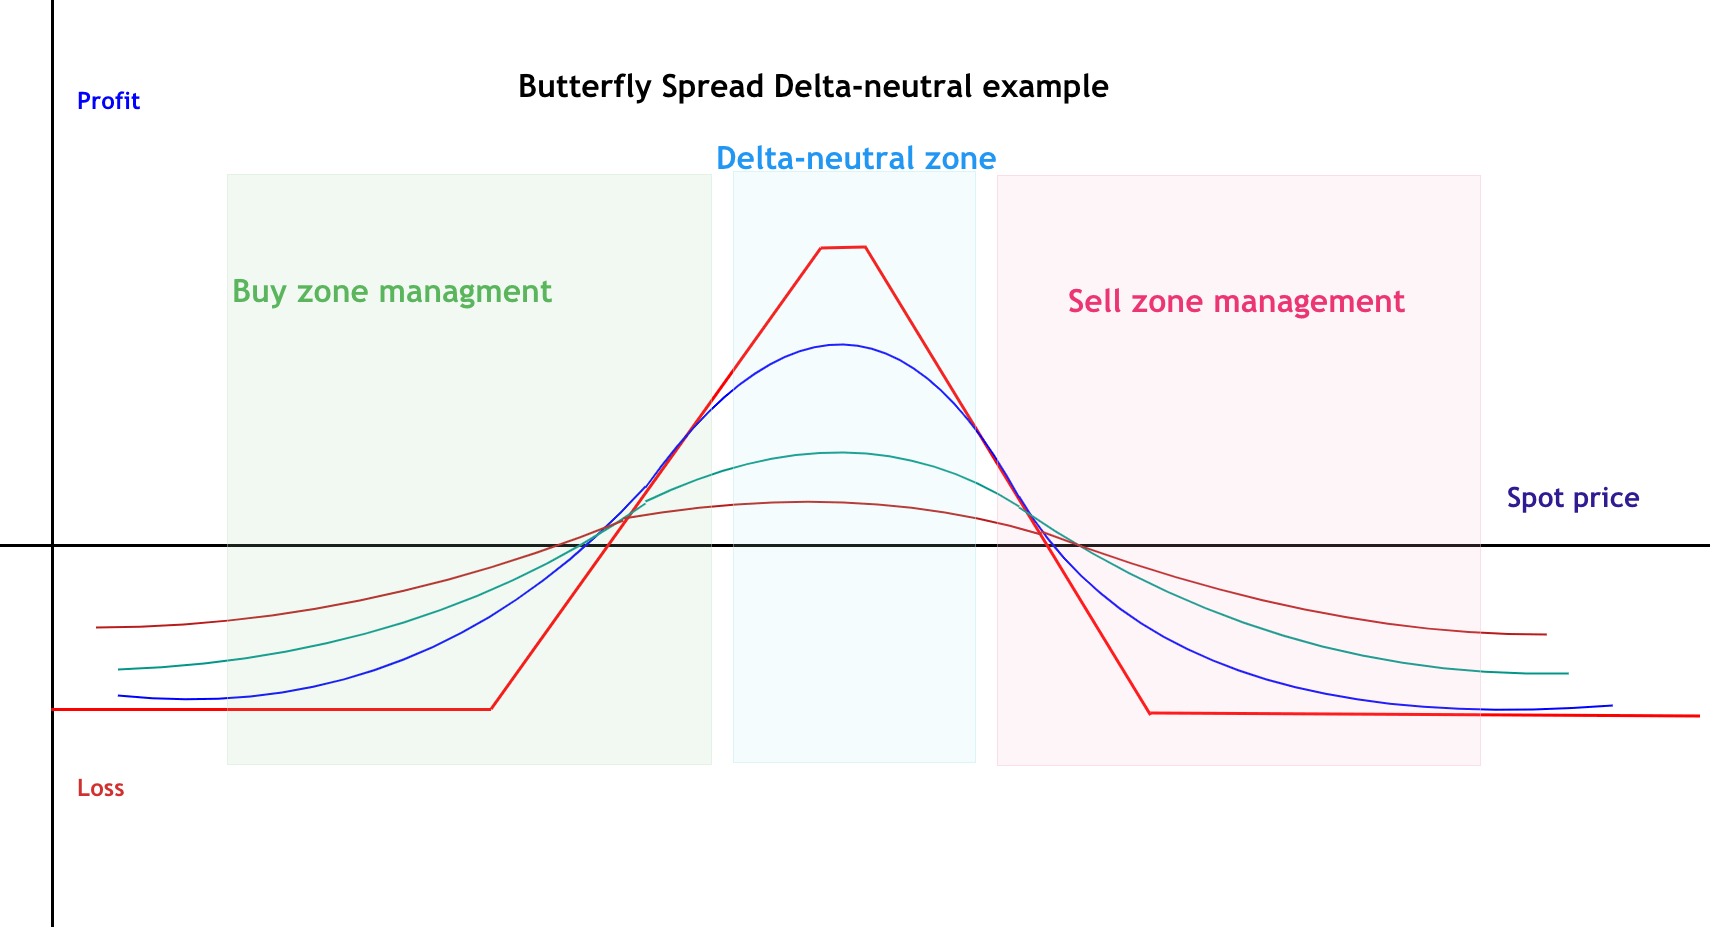
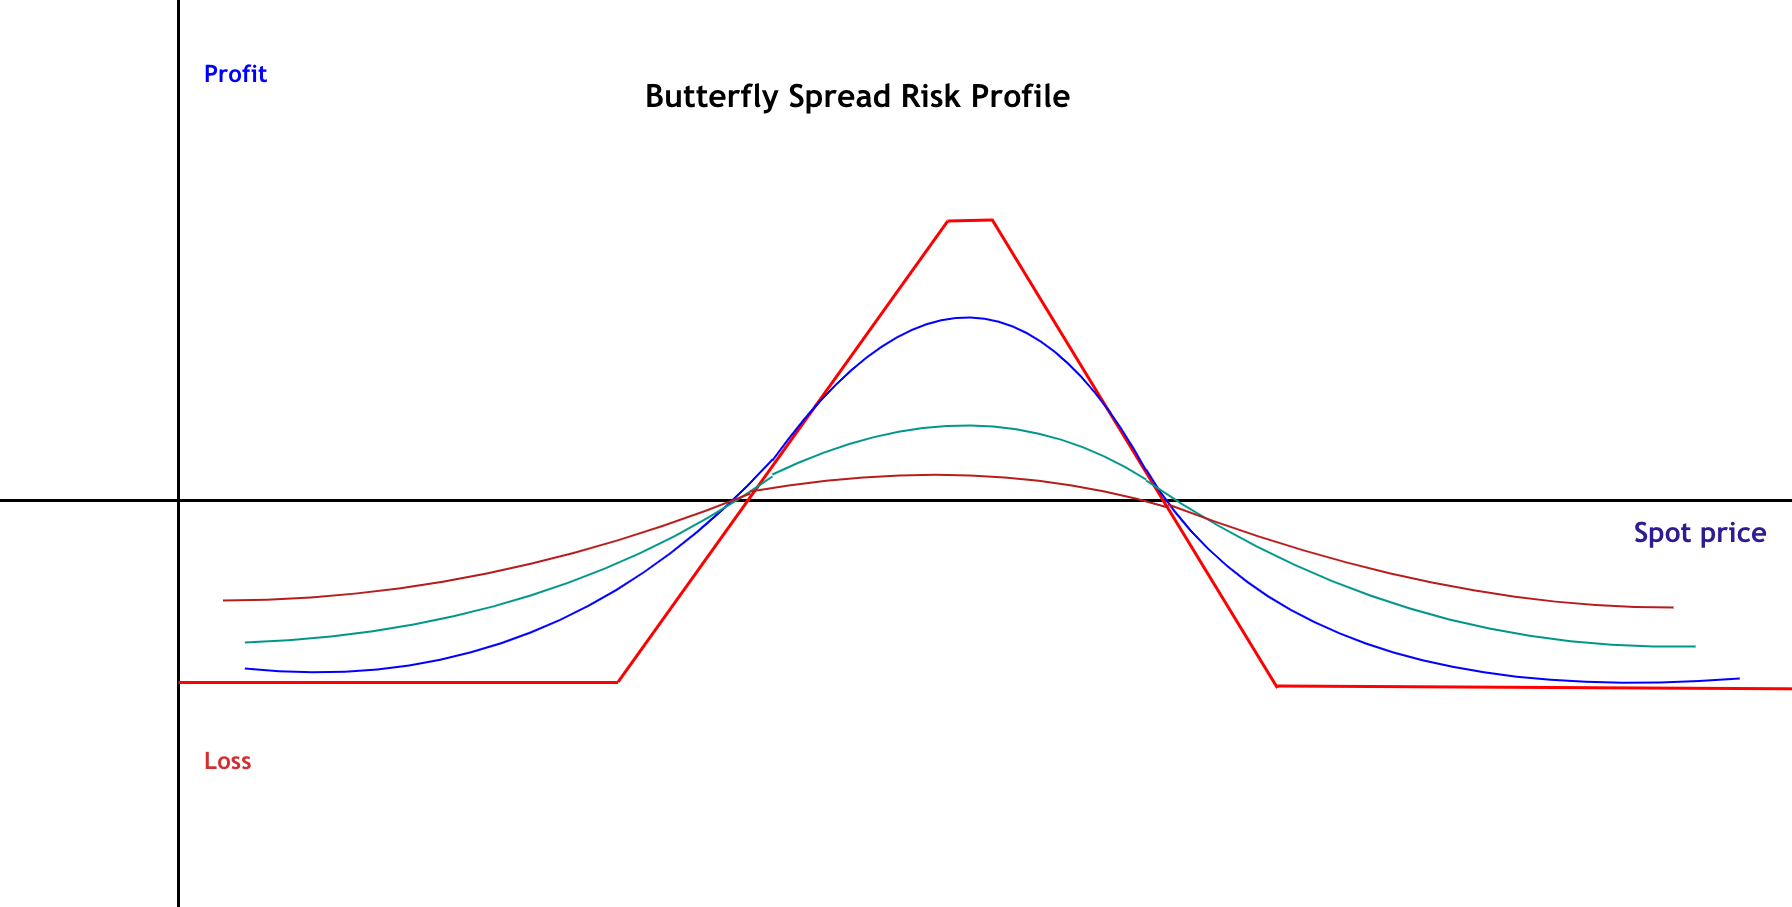
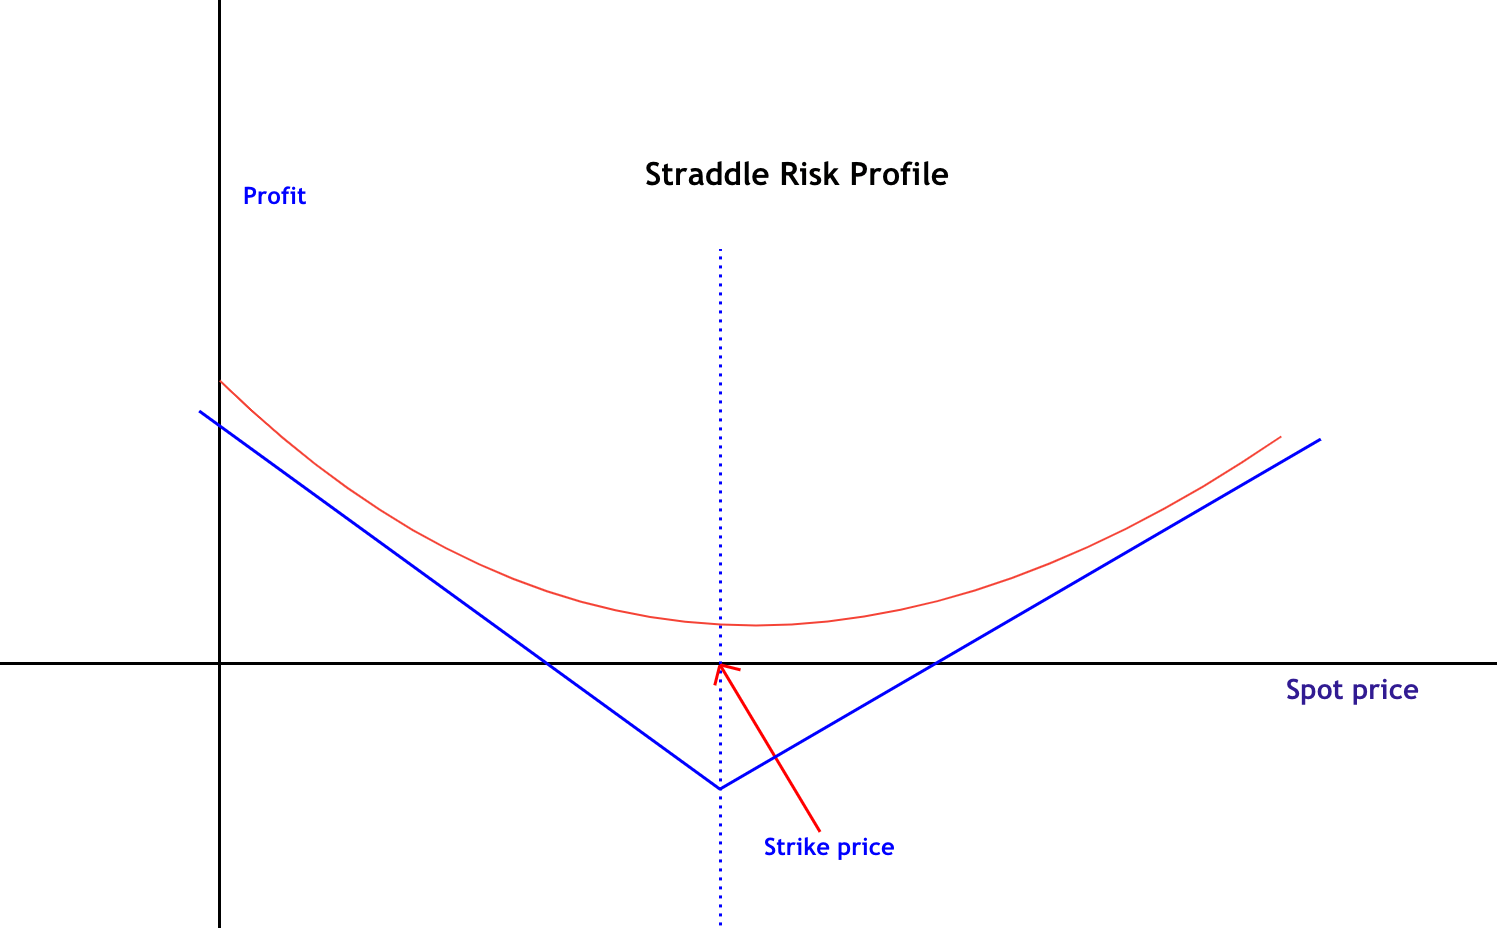
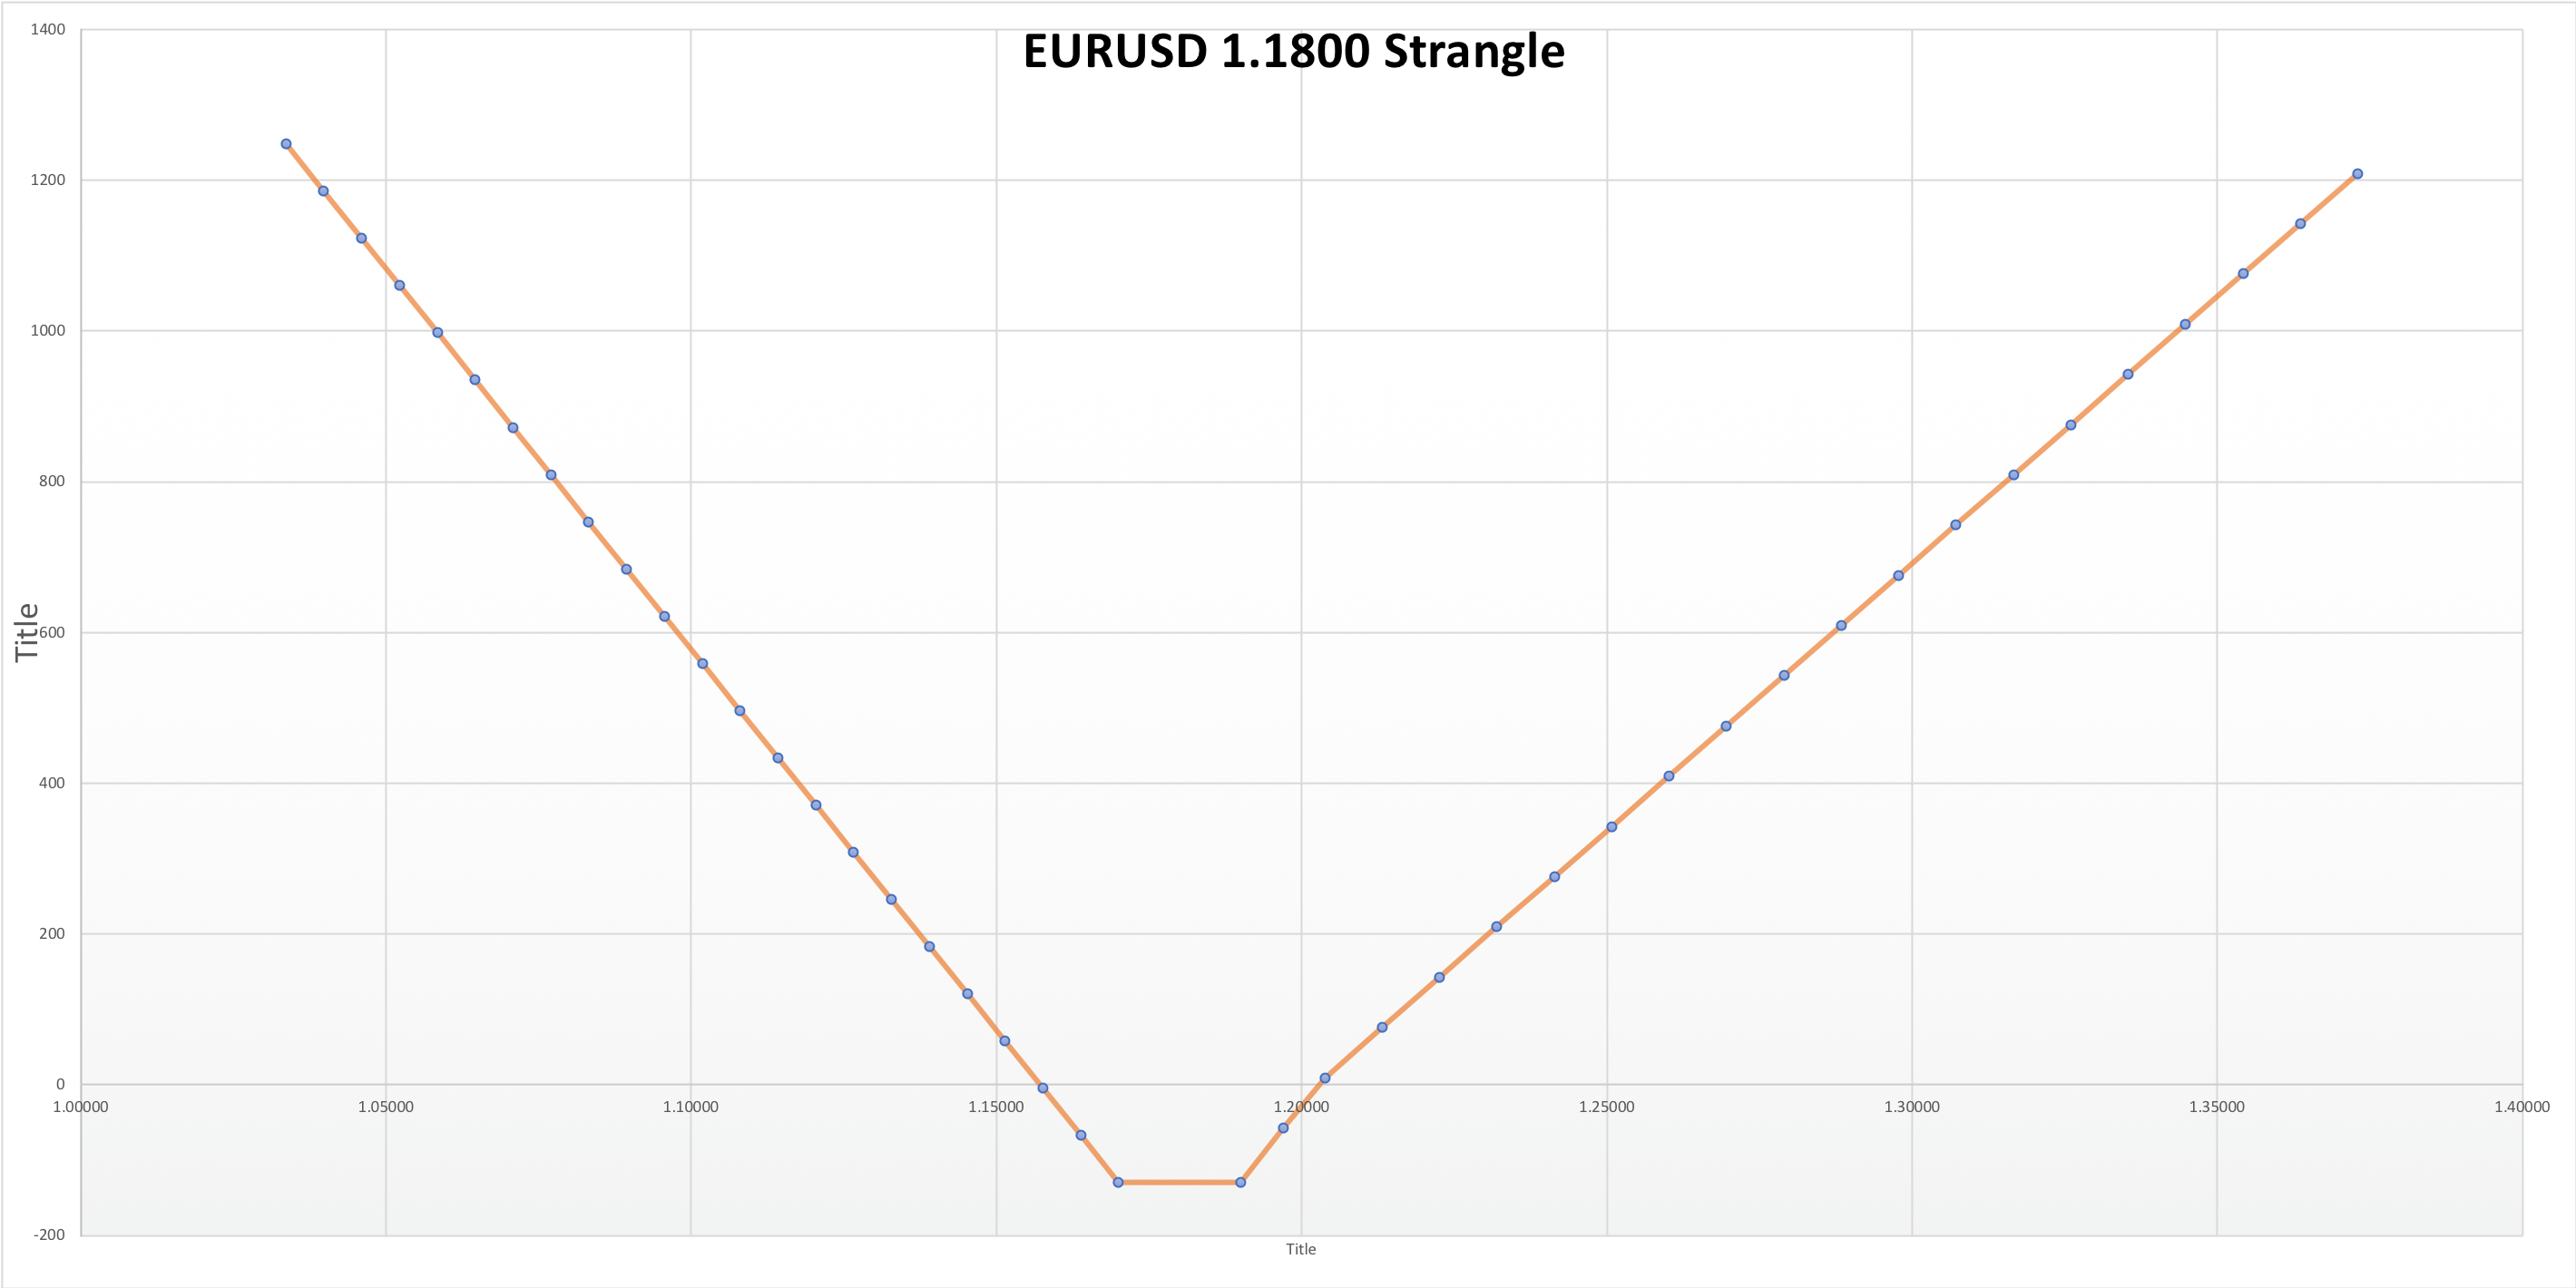
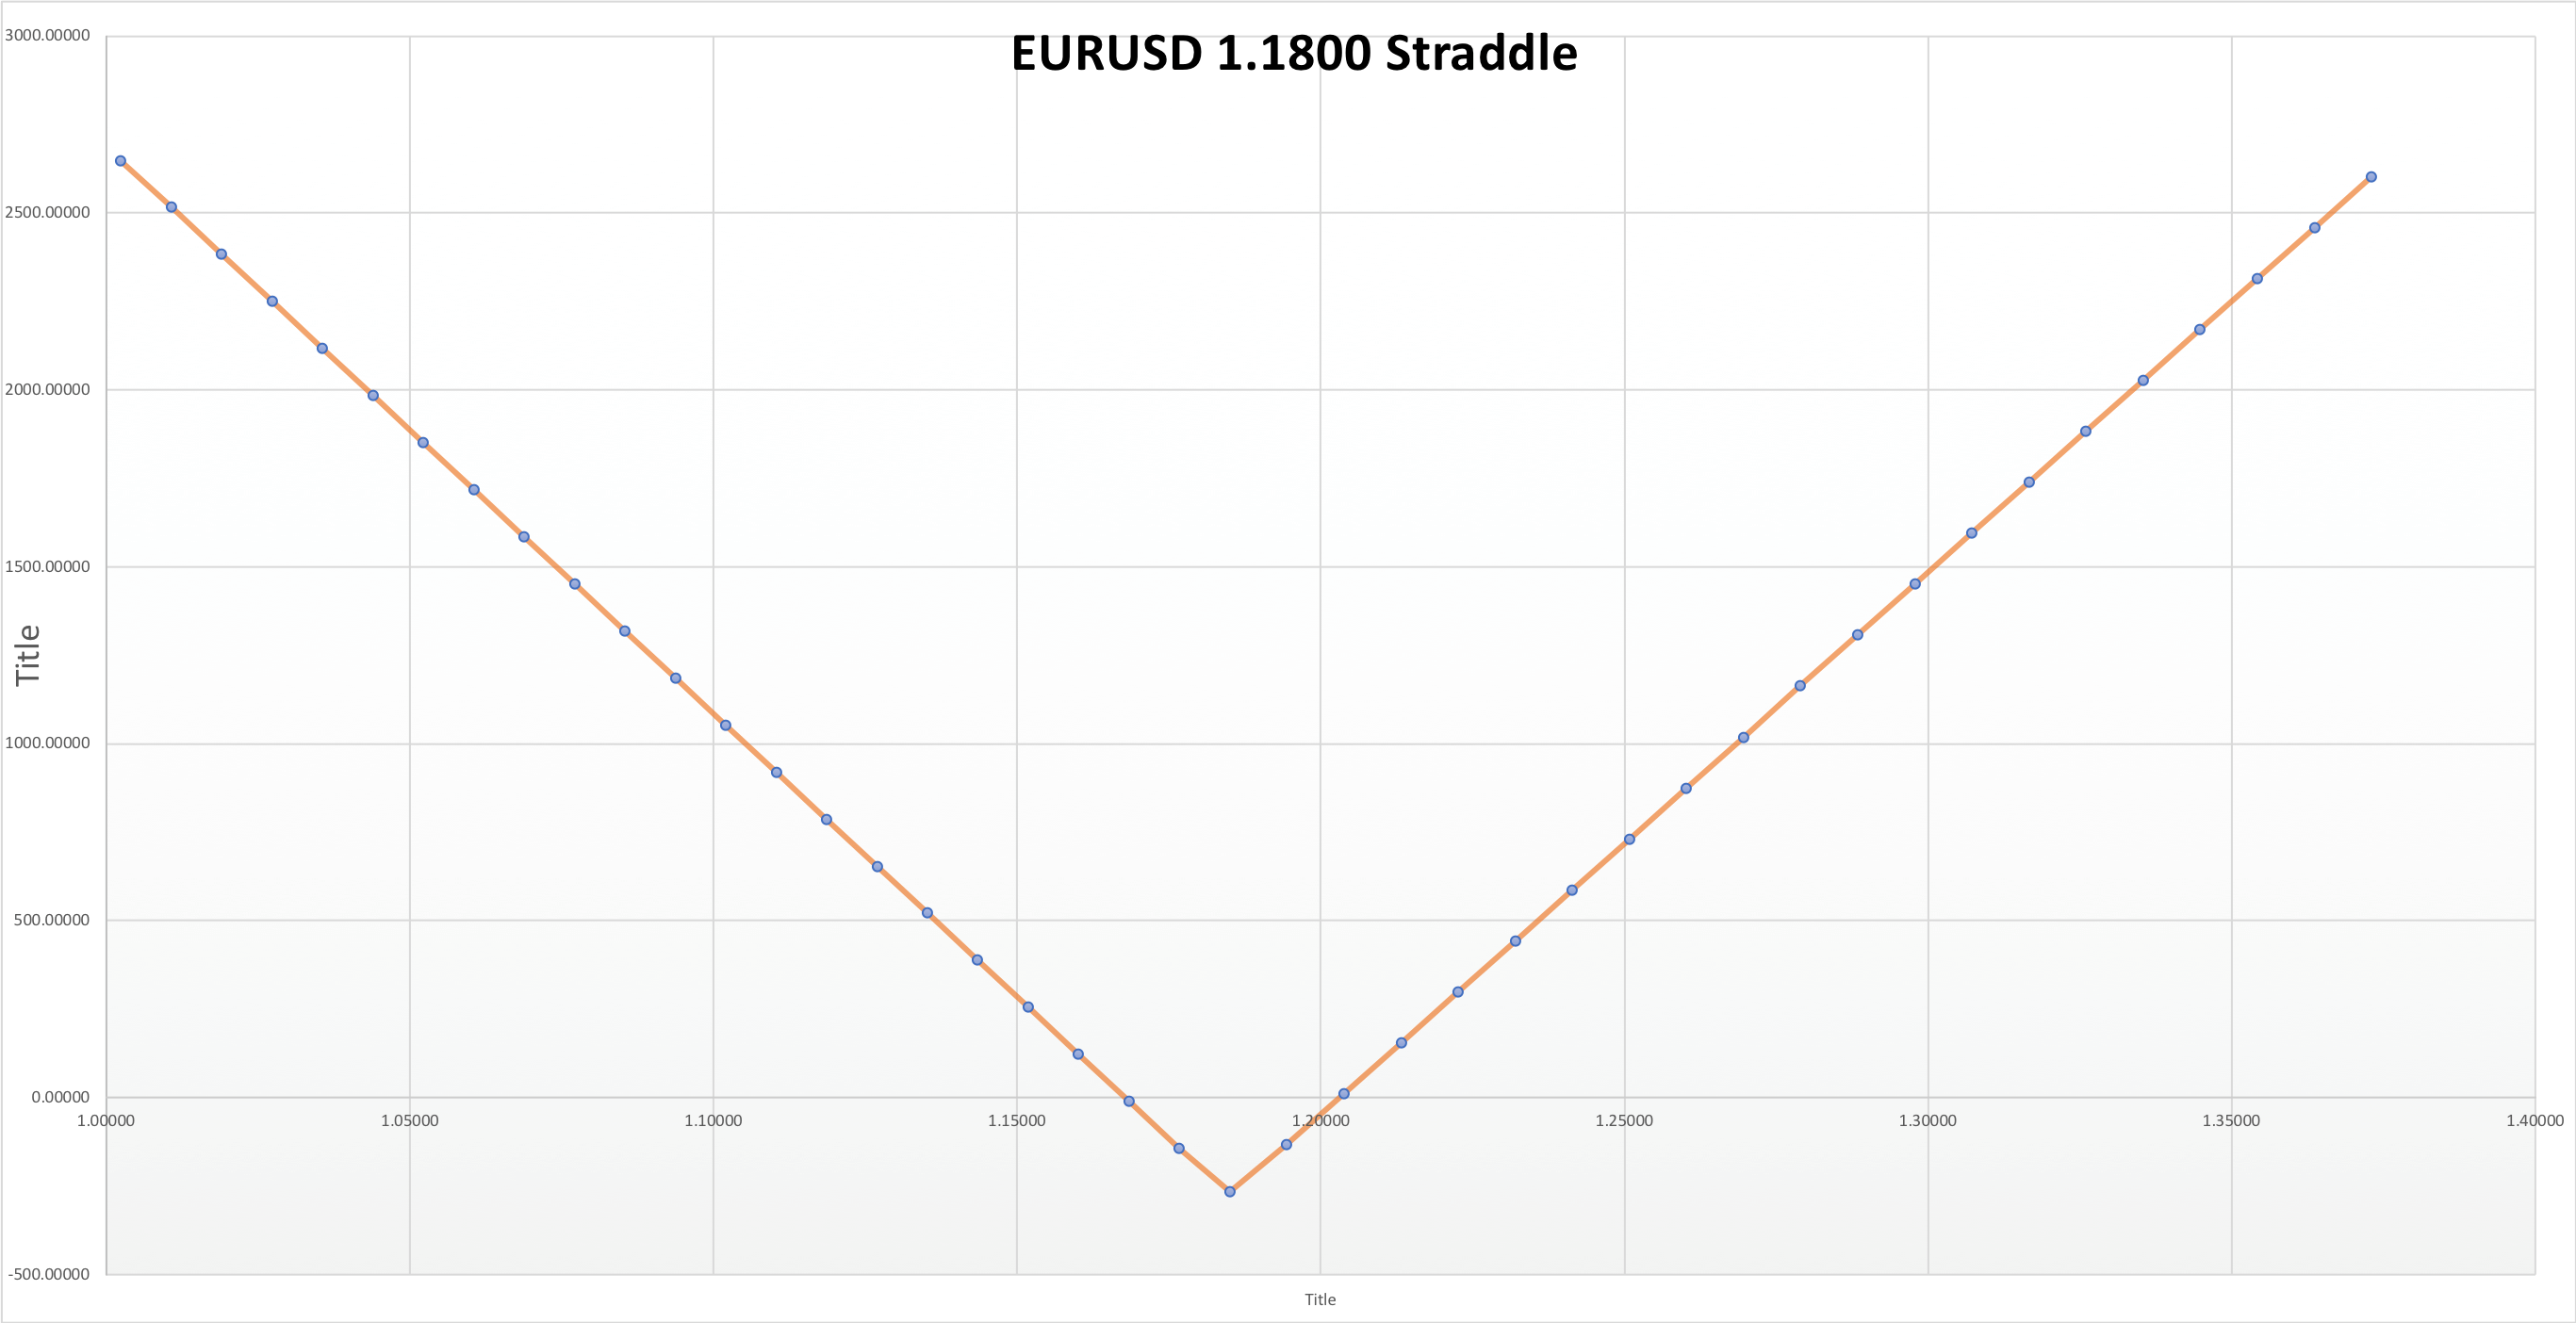
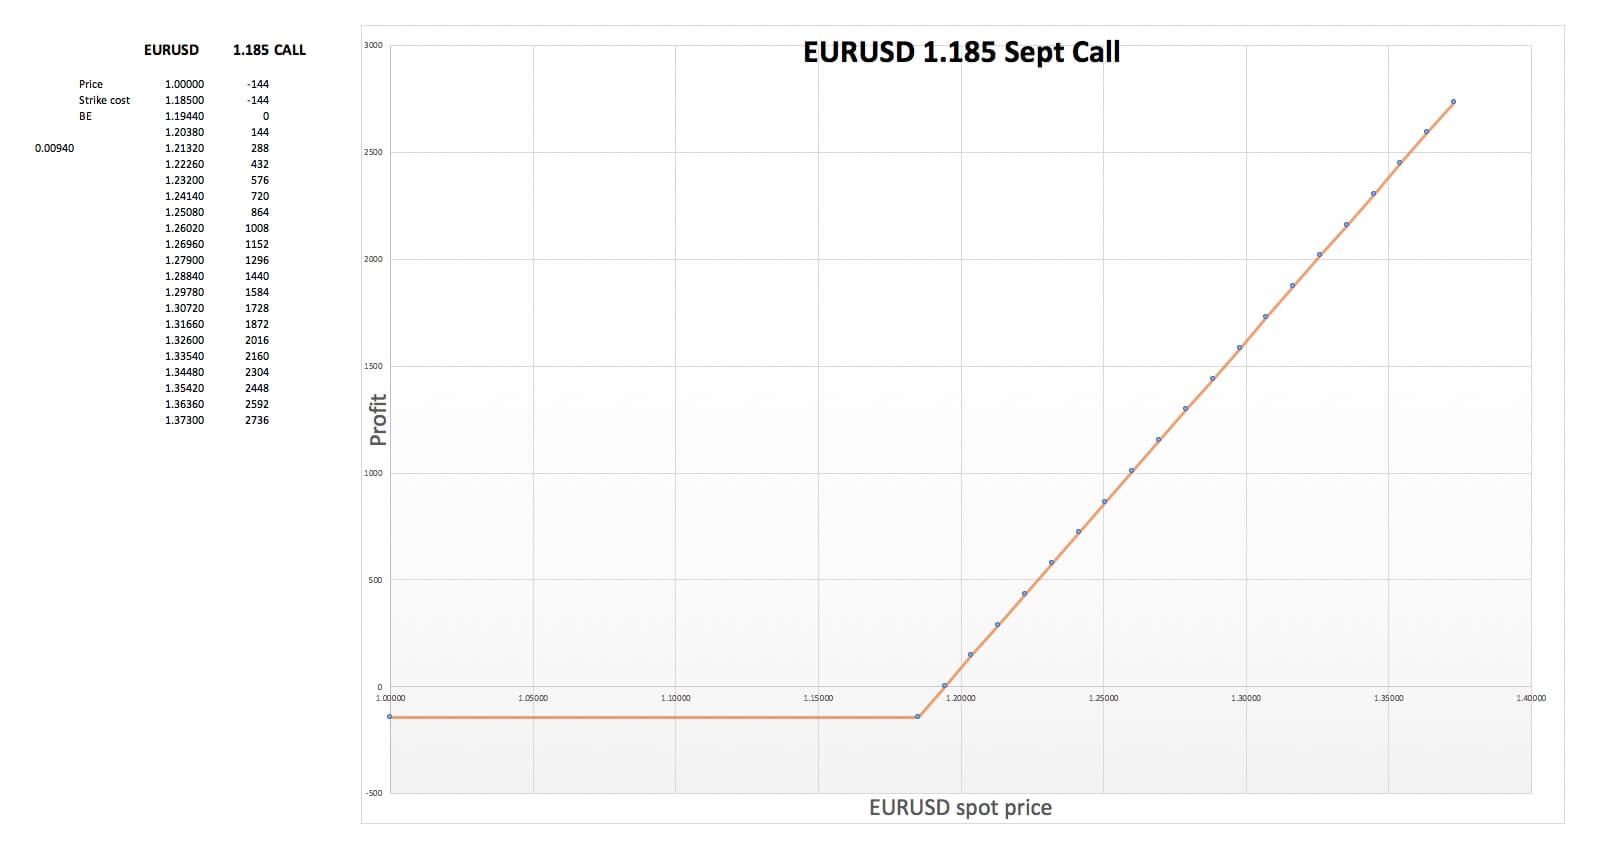
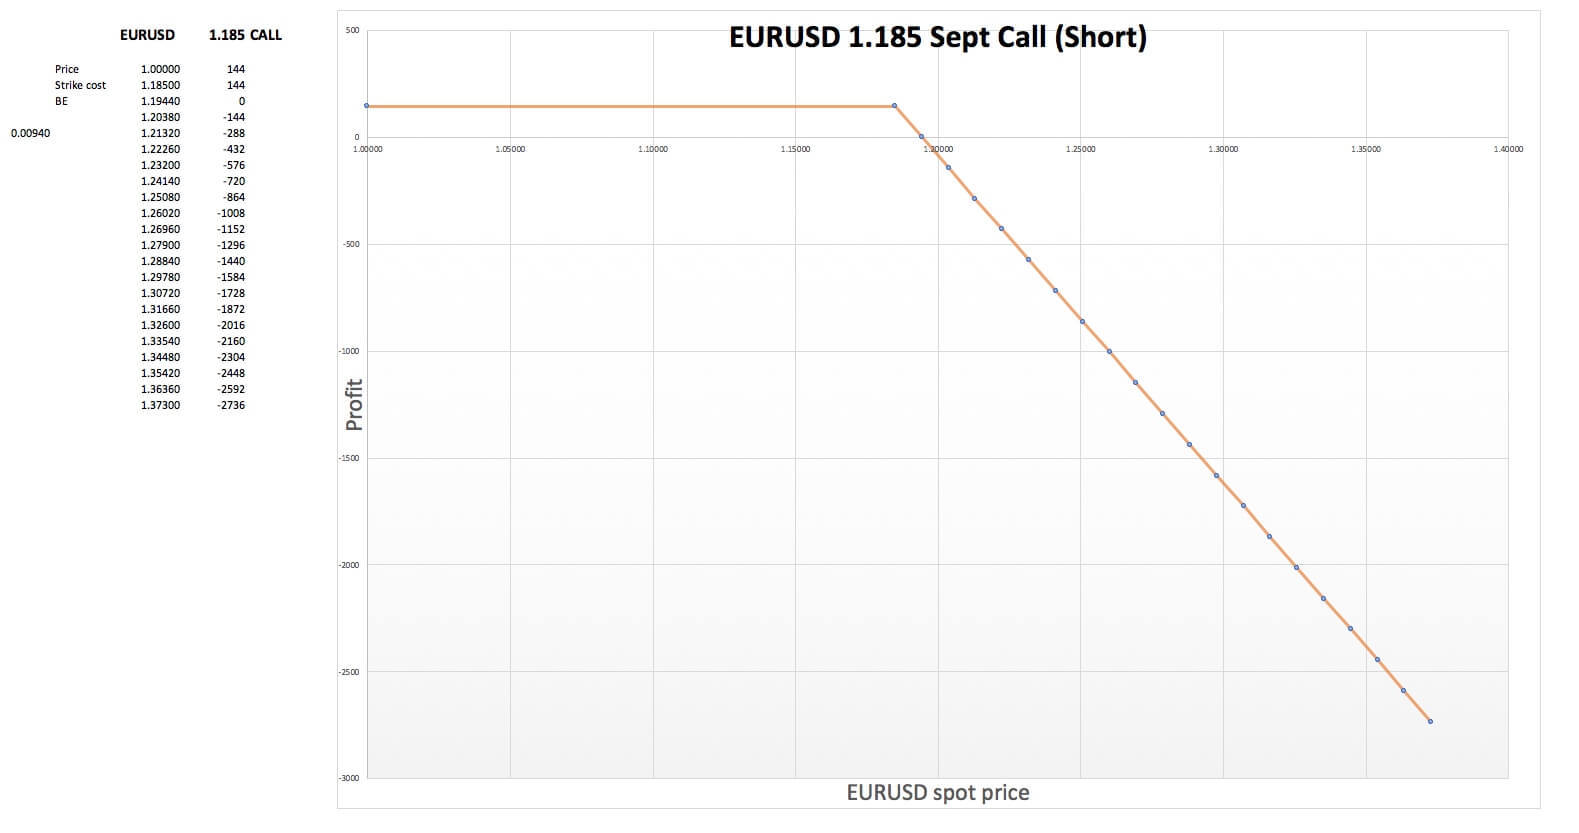
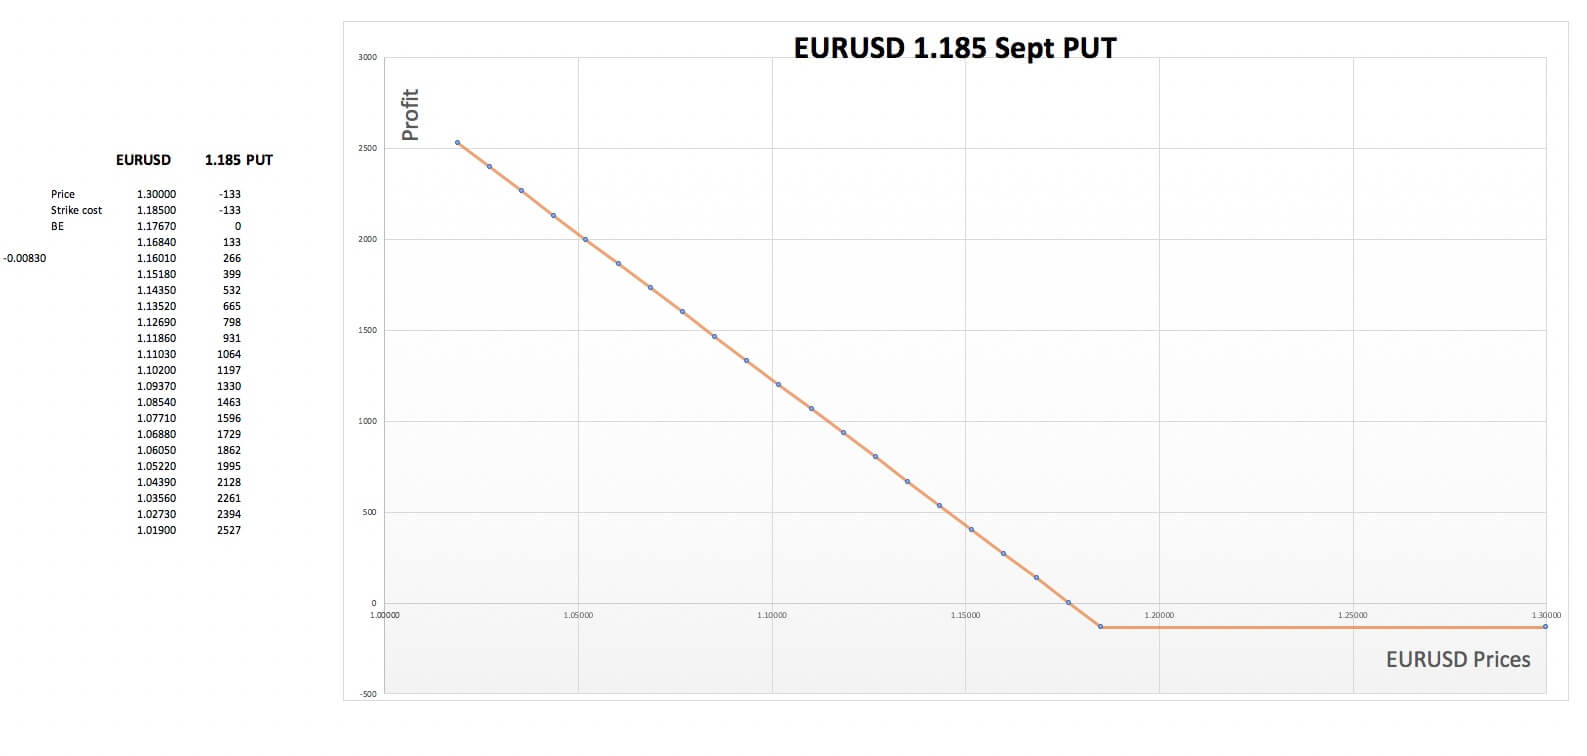
Strategies with zero Delta include buying or selling straddles and strangles, as well as Butterflies. It can also be created by a combination of underlying and options, such as buying one lot of a forex pair and sell two at-the-money calls of the same asset.
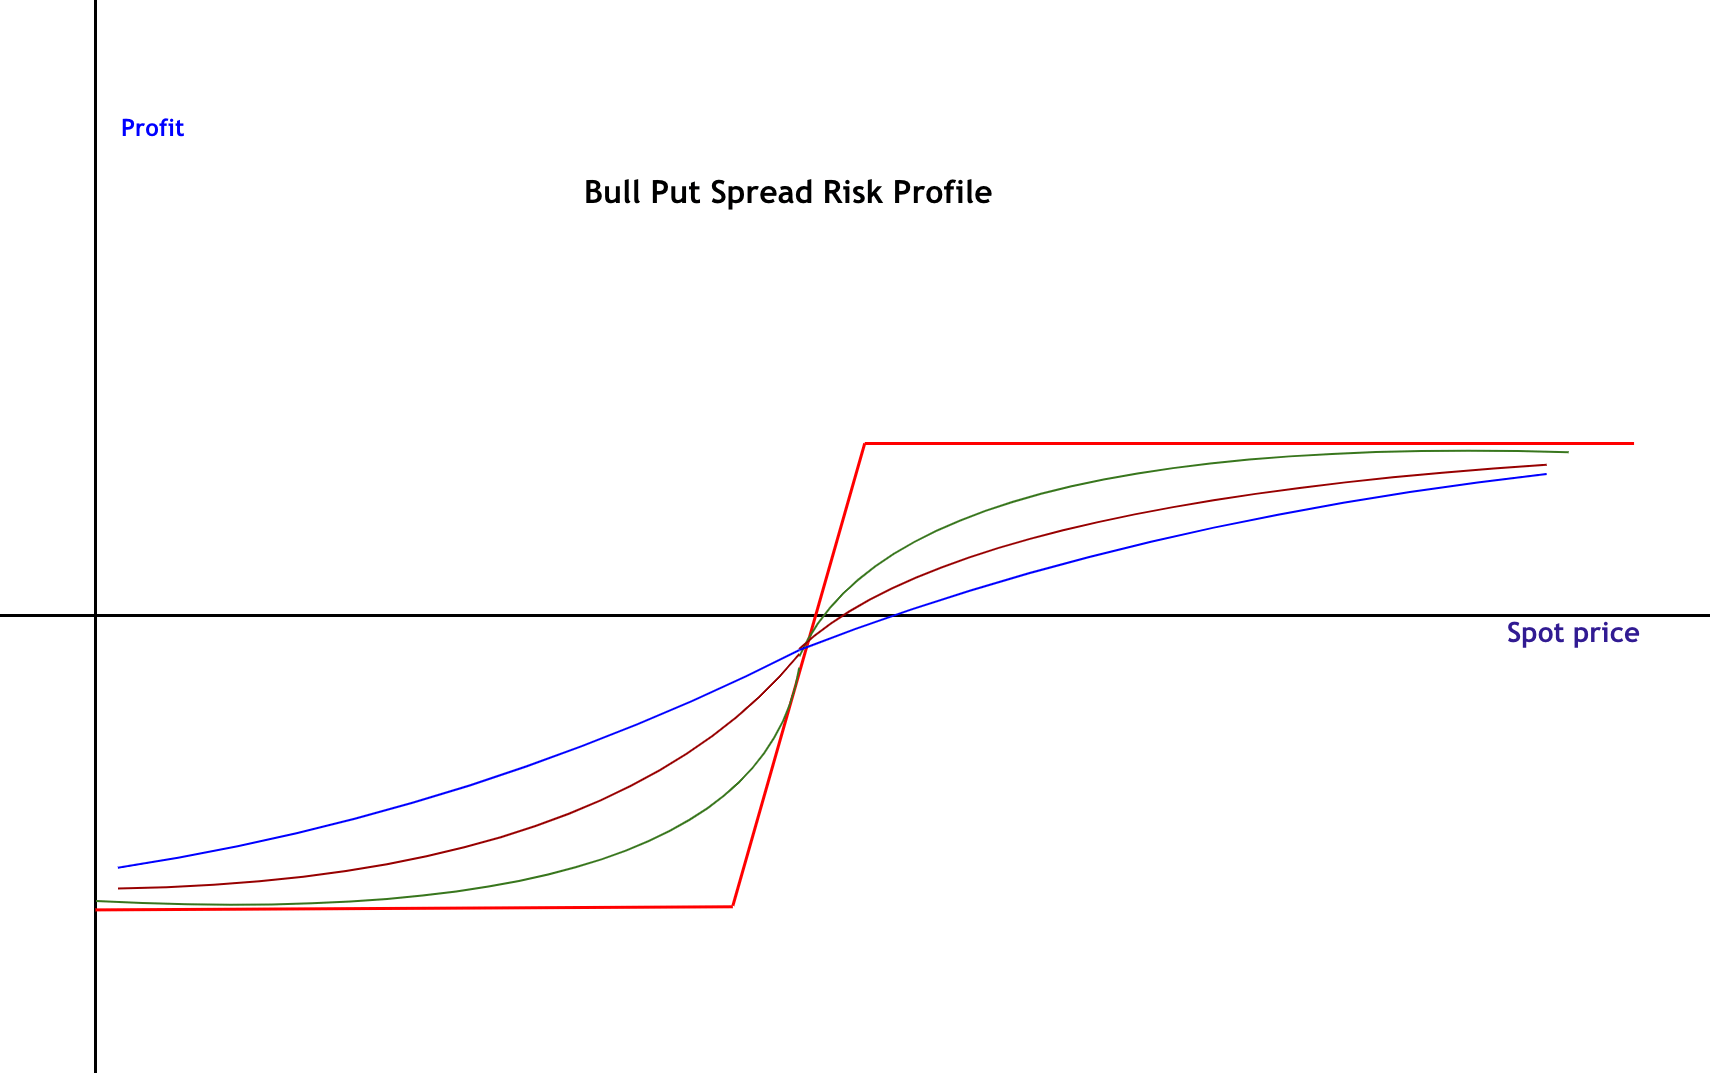
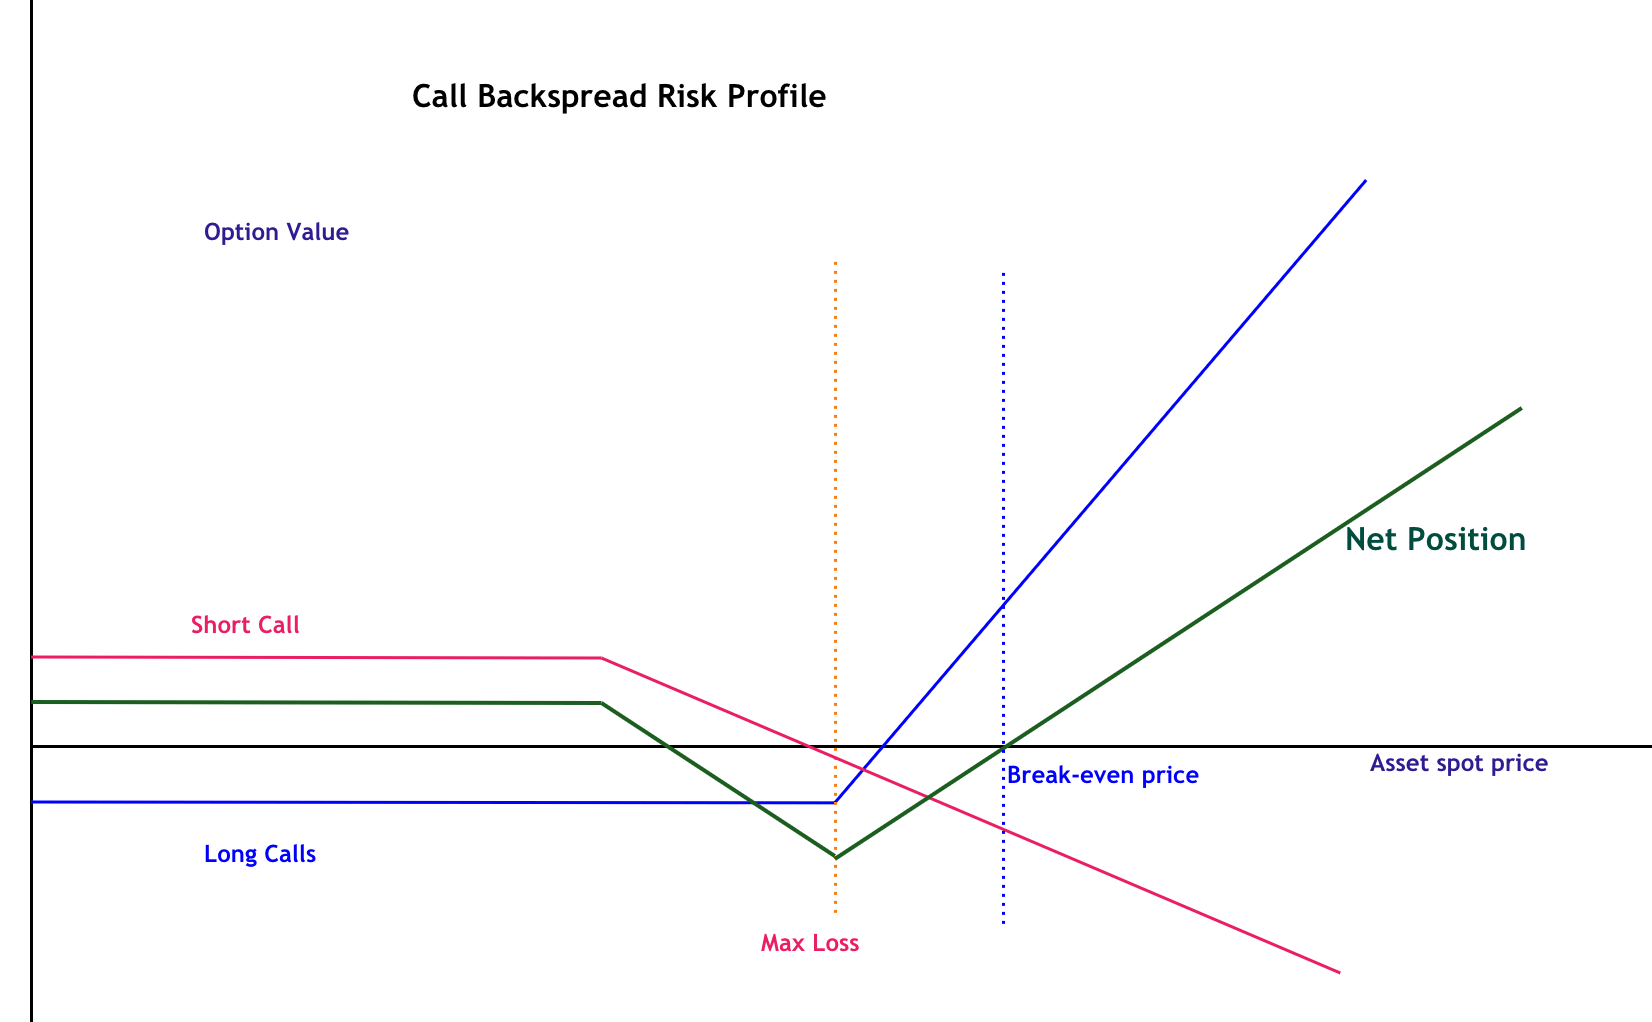
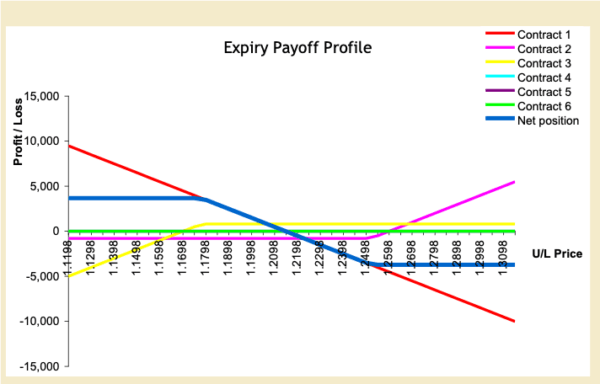
One of the most used delta-neutral position is a Ratio Spread. A Ratio Spread involves the uneven number of options are purchased and sold. Spreads can also be combined with the underlying asset. The particular spread to use should be based on the market conditions, as we already have understood in previous videos.
Ratio spreads are attractive strategies that present a broad profit region; nevertheless, they also show an unlimited risk; therefore, the position should be observed and managed.
Our videos are an introduction to Forex options; consequently, an in-depth explanation of a particular delta-neutral strategy is left for the reader.

Categories
Forex Options

Forex Options Part 14 The Butterfly Spread!

Forex Options XIV – The Butterfly Spread

The Call Butterfly spread requires buying a Call at one strike price, selling two Calls at a higher strike, and buying one additional Call at an even higher strike level. The Put Butterfly spread consists of buying a Put at a strike price, selling two more Puts at a lower strike, and buying an extra call at a strike below the written Puts. The Butterfly ratios are always 1:2:1 or a multiple of it. The purpose of a Butterfly spread is to profit from the high volatility of assets in a trading range by collecting option premiums. Butterfly Spreads are a specialized, statistically-based strategy. To improve the chanced of success, traders must consider the following.

Guidelines when selecting a Butterfly spread trade

 The underlying asset should be in a trading range, with no potential news that would disrupt the ranging state. The asset should have produced visible support and resistance zones on a daily or weekly chart. That means that assets that are trending are poor candidates.

 The implied volatility of the asset is high. The higher, the better, also considering the first guideline, of course. High volatility is required as the money comes from the two sold options, as the time premium increases with volatility. Thus, the more time premium the written options have, the better the profit.

 No more than 60 days till expiration, to help accelerate the time decay. Options with 30 days to expiration are ideal.

 The written options should be at-the-money or only slightly out-of-the-money. That will improve the chances of the asset to expire near at-the-money, where the premium maximizes.

 Make sure to trade it as a unity, avoiding market orders to sell and buy its components. A Butterfly created at optimal prices will increment the odds of making profits. The use of limit orders to guarantee you get the trade as you’ve planned is essential.

 Look to commissions also. A low-commission broker is desirable, as this trade involves trading four options.


Position management

The risk profile graph shows that the maximum profit available grows with the approach to the expiration, but also, the range of prices in which the spread is profitable gets narrower. The maximum profit is produced when the underlying’s price is at the strike price at the expiration date.

The best plan for exits is to close the spread before expiration; therefore, we have to make another four option trades. This is why Butterflies are complicated to trade. A complete trade requires eight trades in which spreads and commissions might eat all the available profit. Therefore, the trader must be alert to the best opportunity to close the position and create appropriate orders to minimize trade costs.
By good opportunity, we mean occasions where the combination of decreasing volatility and the price in the vicinity of the maximum level allows the closing of the spread at an acceptable profit.

Stop-loss

We should plan a stop-loss level in which our loss does not go beyond our projected profit to try to make sure our overall reward-to-risk ratio is at least 1:1.

Categories
Forex Videos

Forex Options Part 13! Selling a Vertical Spread…


Forex Options XIII – Selling a Vertical Spread


A vertical spread is a combination of options in which the trader buys a Call or Put and sells another Call or Put of the same underlying at a different strike.
Buying a Vertical Spread
We are long ( buying the vertical spread) when we buy the at-the-money or in-the-money option and sell an out-of-the-money option. A vertical spread is a strategy similar to a naked option. The selling of the out of the money call simply lowers its cost, as the trader is aware that the price is unlikely to move above the sold option’s strike level.
Traders buy vertical spreads when they are sure about the market direction, have a target for the move, and seek to optimize the cost of the trade.

Selling a Vertical Spread

We sell a vertical spread when we sell the at-the-money or in-the-money option and buy an out-of-the-money option. This is not a market-timing strategy, but a statistically-based move. The purpose of this is to profit from the decay and volatility drop, avoiding the unlimited risk of a naked option.

It is well known that the sellers make the majority of the money on options trading. That is because options will lose all its premium at expiration. Over 60% of all options that are out of the money expire worthless. This fact gives option sellers an advantage. The downside is that naked options involve the assumption of unlimited risk. The selling of an out-of-the-money option and the simultaneous purchase of a further out-of-the-money option solves this issue. This strategy allows traders to profit from high volatility and market-timing situations such as market tops and bottoms.

Key factors to maximize the trade potential of a vertical spread

  • The implied volatility is in the upper range, historically, the higher, the better to maximize the amount of premium received.
  • Identify support and resistance levels on the underlying’s price action, and sell the option whose strike price is at or beyond that level ( so that the chance to cross it is minimized).
    Sell the call with a delta of 40 or a put with a delta of -40. That way, the chance of the option to expire in the money is below 50%, while the premium is still acceptable.
  • Choose options with less than one month to expiration to make the time decay more pronounced
  • Look for the situation where the volatility of the sold option is higher than the one you intend to buy.

Market timing

Option writing can be used in place of option buying to take advantage of a market-timing strategy when volatility is very high. Inexperienced traders usually make the mistake of buying naked options to profit from the market movements without caring for volatility, losing money, long-term, because the more expensive the cost is, the larger the movement of the underlying to compensate for the costs of the trade. Furthermore, a posterior drop in volatility will further reduce the options’ value, hurting the naked position.
The best alternative to option buying when you believe the underlying is going to move in a determined direction and volatility is high, is selling a vertical spread. When you have reasons to believe that the market is going to rally or remain flat, you may sell a vertical put spread, usually called “Bull Put Spread.” Conversely, if you consider the market is going to fall, flat, or with limited movement, you may decide to sell a vertical call spread, called “Bear Call Spread.”

Position management

To optimize the profits, you should look at your strategy’s risk-profile curve at expiration to determine your maximum potential profit.
Also, check the risk curves before expiration to determine how far against your position should move the market to create a loss equal to your maximum profit, and determine the level at which to cut losses. The main idea is we don’t want reward-to-risk trades below 1.

Stop-loss
  • Close the trade if the loss surpasses the max-profit value.
  • If you consider that some significant support or
  • resistance was broken and the scenario you considered for the trade is no longer valid.

Taking profits

Close the trade if your profit reaches 80% of the maximum profit potential.
The idea behind this is that holding the trade trying to get the last 20% of the profits is wrong from the risk-reward point of view, as the R/R is
RR =0.25.

Categories
Forex Videos

Forex Options Part 12… Buying a Straddle!


Forex Options XII – Buying a Straddle

Straddle buying involves buying a Call and a Put at the same time and strike. There is a variant called Strangle, where the strike prices differ. This strategy is exclusive of options, and, theoretically, allows the trader to profit from a large movement at a key level when the likely direction is unknown, for instance, on a Central Bank news release, where the moment of the statement is known, but there is no way to known the posterior movement of the forex pair.
Since the cost of the straddle is expensive ( two premiums), it shows the lowest probability of all options strategies of making profits (and even more so on strangles). Thus, the best moments to buy it is when volatility is at its lowest point, and a sudden jump can be forecasted in advance of the rest of the participants.

Thus, the key elements to be decided to use Straddles are:
There is some key market factor that makes you believe a large move is ready to occur.
The market is quiet, and the implied volatility is at the lowest extreme.
There is enough time to expiration for the market move.
The reward is equally good, no matter which direction will move the underlying. That means making the trade delta-neutral by being as close to the current spot price as possible.

The dangers

As Jay Kaeppel reminds in his book,
“The goal in option trading is to put the odds as far in your favor as possible each time you enter a trade. Paying a lot of time premium on both a call option and a put option is not consistent with this goal and should generally be avoided.”

Time to expiration

Traders usually make the mistake of buying short-term straddles because they are cheaper, but that is wrong. The asset must make a large enough movement to pay for the two premiums. Thus, it is essential to let it the time to do it. Traders must analyze equal moves historically and determine the proper time to expiration. Of course, if the expected move has to do with a determined news release, that date, plus the expected time for the posterior movement, will set the correct timeframe.
You also have to take into account that it is advisable to close the trade earlier than the last two weeks before expiration unless one of them is deep in the money. In this case, it is best to hold if there are reasons to think the move is not over.

Volatility high

When buying a straddle when implied volatility is relatively high, and, following the purchase, volatility collapses, you’ll be hurt twice because the time premium part of the price will collapse as well. Under this circumstance, the probability of making a profit is close to null.

The Opportunity

If you focus your straddle purchases on very low implied volatility, you’ll profit not only on the price movement of the underlying asset but also on the rise of volatility that will increase both the call and the put.

Exiting the trade

Stop-loss

The best way to cut losses is to plan the trade so that the premium is low due to the low implied volatility. But, besides this,
You can plan to close the trade if it has not made profits before the last two weeks before expiration, since after that, the time premium decay accelerates its decline.
Cut your losses to a determined amount or percentage, for example, 50% of the total price paid. Let it go until expiration if you’ve decided that the premium is your risk. The downside is your position size will be smaller than if you choose to cut your loss at 50% of the cost.

Taking profits

There are several methods for taking profits.

  • Locking-in profits after the position doubles its value, by selling 50% of the position ( it requires to being long several straddles, of course), and trailing-stop the rest of the open position.
  • Setting a profit target, based on the technical analysis of support/resistance of the underlying.
  • Just use trail stop all the way.
    There is no guarantee that these approaches to stop-loss and take-profit will improve results. Still, it is important to have planned all the trade details to avoid emotionally driven errors.
Categories
Forex Videos

Forex Options Part 11… Buying a Calendar Spread!


Forex Options XI – Buying a Calendar Spread

The Calendar Spread is a strategy only available on options. As we already know, Options on assets come with different expiration dates, and each one offers different implied volatility levels. What’s more, at times, they show strikingly different values. Traders can use this situation to take advantage of the disparity by selling the option that trades at a significantly high price and buying the cheaper one.

The main factors for using calendar spreads are:
The written option should trade at least at 15% higher implied volatility than the option bought.
If the overall volatility is high, it is wrong to use it. It works best when the bought option shows low implied volatility.
The sold option expiry is within the next 45 days.
There are reasons to think that the underlying market will remain in a range.

A calendar spread is a neutral position that is entered by buying one option of a determined strike price and expiration month, and selling at the same time another option of the same type and strike price, but with less time until expiration than the option bought. The right time to enter a calendar spread is when the short-term implied volatility is over 15% higher than the long-term one. The higher the implied volatility of the option sold relative to the option bought, the higher the likelihood of profit.

The dangers

A significant advance or decline in the underlying makes the trade very unprofitable.
A sharp decline in implied volatility degrades the odds of a profit.
Therefore, the less time to expiration for the option sold, the better, provided it allows enough premium to have profits.

Factors to profitability

According to Jay Kaeppel, to maximize profits, we must consider the following:
Only trade a calendar spread when the volatility gap between sold and bought option is higher than 15%
Rank the volatility from 0 to 10 land trade calendar spreads only when below 6, ideally in the 1-2 range. If volatility increases on a trade entered at these volatility levels, it would return extraordinary profits, because the bought long-term option will increase much more than the short-term option that was sold.
Don’t sell options with more than 45 days to expiration.
The options traded must show deltas within 30 to 65 on calls and -30 to -65 on puts. As a rule of thumb, avoid trading options with more than one strike price from the current asset price.
Ideal markets for a calendar spread are assets moving in a trading range, where supports and resistances are clearly identified.

A decline in volatility

A decrease in volatility is the worst that can happen on a calendar spread trade. To understand why we have to remember that we sell the short-term option and buy the longer-term option. The longer the time to expiration, the higher the sensitivity of the option to volatility changes. That means a rise in volatility would result in increased profits because the option bought will increase more than the option sold. Conversely, a volatility drop would drive the trade to the losing side as the price of option bought sinks relative to the option sold.

References: “The option’s trader guide to probability, volatility and timing” by Jay Kaeppel

Categories
Forex Videos

Forex Options Part 10 Buying a Backspread!

Forex Options X – Buying a Backspread

A Backspread is a combination of option positions. A Call Backspread involves selling an at-the-money or in-the-money call and buying a higher number of out of the money calls. The ratio of options sold to options bought usually are 1:2, 2:3, 5:3, or any combination. The main idea is to buy more options than sold. The ideal situation happens when it is entered at a credit, meaning you earn more from the sold option than you pay for the purchase of options, which is ideal, as it offers total protection in the case you’re wrong with the direction of the trade.
Call Backspreads is a better alternative to buying naked calls because it offers better protection when wrong about the direction of the market.
A Put Backspread is identical to a call, but, as we may guess, it is the right choice if we think the market will move downwards.

Main Factors

We are expecting a market movement, but we would like to be covered if we are wrong.
Implied volatility is low, and we hope it will rise after our entry.
A total transaction entered at a credit is ideal.

A Falling Knife

The use of Backspreads is ideal for catching market bottoms and tops, as it limits, or, even, avoids the risk of being wrong. One situation is to capture a falling-knife market. In this scenario, the market experienced a sharp and significant drop, but we think it has to reverse. Buying naked calls in this scenario can be too risky, as the timing of an upward move is far from accurate, and we may end up with a losing position if the market keeps falling. The use of a Backspread is excellent because we can still profit if wrong in the case of a credit Backspread.

Overextensions

Another ideal situation occurs if the market makes an overextended rally, but you suspect it is a bull trap. That often happens when trading Bitcoin, for instance, with the Bart Simpson pattern. The Bart Simpson pattern shows a sharp upward movement followed by a similar downward action after several hours of sideways action.
Under this scenario, a Put Backspread position is ideal because, if wrong, we could still be protected but still having unlimited profit potential.

Uncertain timing

A third situation arises when we expect a substantial upward rally but are not sure about the timing. A properly constructed call Backspread can give unlimited profit for a minimal dollar risk.

Time to expiration

In all situations, it is better to use longer to expire options when constructing the Backspread, as this offers a broader timeframe for the play to develop. What’s more, Longer-dated options are more sensitive to changes in volatility, so that if we enter a Backspread on reduced volatility, the profits multiply when volatility increases due to the market move.

The risk

The main downside of this strategy happens when the underlying asset remains near the strike price of the sold call/put at expiration, or the implied volatility declines further, which usually occurs when the asset does not move much. This is why it is best not to hold Backspreads until expiration, as they can generate its largest loss with the lack of movement of the underlying security.

To summarize

A Backspread strategy can give the trader

  • The stamina to trade tops or bottoms on strongly trending assets
  • Time to allow the timing to work out with a limited risk
  • Profiting from an increase in volatility
Categories
Forex Videos

Forex Options Part 9 – Buying Naked Options!

Forex Options IX – Buying Naked Options

Buying naked options means the purchase of just calls or puts of the same strike and expiration date, with no ownership of the underlying asset, nor other simultaneous purchases of a different call ( or put).
Buying a naked option is a market-timing strategy. The options trader considers that, at the current price, the asset is overvalued or undervalued, and, also, there are signs of a market reversal.

The main factors to consider are:

There are technical reasons to believe in a large movement soon! Actual low implied volatility! Good Delta and time remaining to expiration so time decay will be minimal.

The main errors novice options traders do when buying naked options are:

Only consider market timing to make a trade.
Buying out of the money options because they are cheap. Buying options with no regard to the current implied volatility. And if they are expensive, switching to an even more out of the money strike. Buying options with short expiries because they are cheaper.

The threats

Poor timing is the main threat. Buying a call followed by a drop in price will swiftly devalue the option. Therefore, to buy options, it is imperative to have a fairly precise timing signal.
Also, time decay will hurt the value of the option if the underlying security fails to make the expected movement, which will cause a drop in volatility and a decrease in the premium. This effect increases if the time to expiration is short.

The following rules will maximize the odds in our favor:

Buy naked options only if your timing method has proven accurate
Buy calls with Delta over 50 or puts with Delta below -50 to improve the chances.
Buy calls near support, buy puts near resistance, especially on non-trend or mean-reverting markets. Lower volatility is a plus, although not too critical if the action is short-term
At least 30 days to expiration to minimize time decay.

The key elements to make a profit are two:
  • A reliable indicator or pattern that consistently predicts a large movement
  • Avoiding being hurt by time decay and drops in volatility.

A possible use of this strategy is to catch tops and bottoms. Options will limit the risk at the premium paid by the option. With enough time to expiration, the timing required to succeed does not need to be as accurate as with the underlying instrument. The risk is limited without the need for stop-loss orders, which on many occasions, get taken, and then the market reverses.


The risk/reward profile of a Call

The risk-reward profile of a naked call has already been shown, and it shows the characteristic stick profile with limited risk and unlimited reward. The intrinsic value line shows the values at expiration, but, since the before expiry, the option has a time value. The real market value at a set date before expiration draws a curve similar to the red line shown in the image. The shorter the time to expiry, the closer this line will be to its intrinsic value, since time value decay, as we already know.

Similarly, the risk/reward profile of a Put shows a stick-like pattern; only this time, the rewards come from prices under the strike price. As it happens in Calls, the red line in the image shows a likely value line of a Put before expiry, that would get closer and closer to the intrinsic line as the time approaches the expiry date.

Categories
Forex Videos

Forex Options Part 8 – Market Overview of Option Strategies!

Forex Options VIII – Market Overview of Option Strategies

In the previous videos, we have discovered the basics of options and the main topics that need to be mastered to trade them, such as Deltas, Volatility, Time to expiration, risk profiles, and market timing.
In this video, we will sketch the main strategies using options, with one goal in mind: to simplify the decision process.

Elements to success
There are two elements to consider when trading options: Volatility and price direction. A trader should consider if he wants to seek a directional strategy or a neutral one. After deciding that whether bullish, bearish, or neutral, the trader must look at the current and future implied volatility to decide which is best: to buy or write options.

The strategy matrix

These strategies will be covered in the following video presentations, and our critical variables of volatility and market direction will play the primary role in the decision-making process. The process will always be the same: you should decide first if you’re bullish, neutral, or bearish, and then assess the volatility.
To help in the decision making, it could be handy to have:

A chart with the price action of the underlying instrument, to help us visualize the situation of the market action

An implied volatility graph of the option in question, to assess whether it is at a low or high point


Source: cmegroup

The options chain with prices of the asset, to help us see the proximity to the spot price and also the expirations.

Source: traderji.com
A risk profile graph. That kind of graph is available in the majority of the option-trading tools. A risk profile helps not only assess the potential profits but also visualize the worst-case scenario.

Source: gfmi.com

Position Management:
To option traders, the most challenging decision is to exit. Thus, besides knowing when to use the strategy and the right moment to enter a trade, it is essential to understand when to exit for a profit and cut losses.

The strategies we will cover in the coming videos are

Buying a naked option
Buying a backspread
Buying calendar spreads
Buying Straddles

Selling a Naked put
Selling a vertical spread
Butterfly spread

Dental neutral strategies
Adjustments to increase profits

Categories
Forex Videos

Forex Options Part 7 – Market Timing!

Forex Options VII – Market Timing

As we have seen in our previous videos, many elements play essential roles in the success ( or failure) of options trading. Another important factor in deciding which options strategy to choose is the market action. Thus, market timing plays a crucial role in the success of the options trader. Timing the market when directly investing in an asset, especially in intraday trading, is essential. That is true also for option strategies that rely on the movement of the underlying security.

When trading options, the usual market situations to analyze are

  1. The underlying asset is expected to move in a particular direction within an assumed period.
  2. The asset is likely to go in a determined direction but without a specified period.
  3. The security is expected to experience a large movement but without a known path.
  4. The security is likely to move in a range.

Under the preceding scenarios, an options trader can be profitable if:

  1. He is right about the scenario
  2. He uses the precise strategy for the market and current volatility.

Usually, the first factor (being right) makes you money, whereas the second one determines the amount won, and the maximum loss when wrong.

The underlying asset is expected to move in a particular direction within an assumed period

Market timing is essential when planning to buy puts or calls because if we buy a call and the market drops, we will lose money. When developing a short-term strategy, the best test for the entry rules is to measure the profit after a certain number of days. such as in

Profit = Price [x] – Price[0],

being x the number of days after entry and testing it for different values of x. The advantage of using a time window is that it allows the trader to focus on a strategy with determined expectations.
If the trader’s time frame is one month or more, he should care about volatility. If it is exceptionally high, he will pay more time premium, which will decline over time, but if he intends to sell it in five days, he will not need to be concerned about it, as decay will be minimal. The disadvantage of trading in a reduced time frame is that the asset must move within the period, or the strategy will lose money.


The asset is likely to go in a determined direction but without a specified period

Often, traders expect an asset to rise or fall but don’t have clues about when that will happen. Options can be used under this scenario, although, in this case, volatility should be monitored and considered. When there is no specified time frame, the trader must usually keep the option near to its expiration; thus, time decay or volatility decline will eat part or all the expected profits.

The security is expected to experience a large movement but without a known path

Profiting from this scenario is unique to options trading, as options allow the possibility to profit indistinctly from rises or falls in the price of the underlying asset. The most usual strategy is buying straddles, the combination of a call and a put. Since this strategy is relatively expensive, it is best for low volatility periods ( the market is in a range) where you expect a sudden movement. If right, the combination of implied volatility increment, and price movement will pay the initial cost. Indicators that may help with this strategy are ADX, RSI, historical volatility, ATR, and Percent R.


The security is likely to move in a range

This is another scenario only profitable using options. In the case of the asset moving in ranges, which happens two-thirds of the time, the options trader may profit in several ways. Indicators such as Percent R or support/resistance assessment can determine overbought and oversold levels and use these timing techniques to options. For example, sell out of the money calls in overbought markets to profit from the premium at expiration. Other option strategies that profit from ranges are buying calendar spreads, vertical spread selling, selling puts at support levels, and advanced combinations, such as Butterfly spreads.


Recommended reading:
THE OPTION TRADER’S GUIDE TO PROBABILITY, VOLATILITY, AND TIMING , by Jay Kaeppel

Categories
Forex Videos

Forex Options Part 6 – Assessing options!

Forex Options VI – Assessing options


Probabilities

If you’ve been following our Options video series, you’ve understood that options trading is a game of chance. Thus, if you hope to succeed at trading options, you must strive to consistently place the odds in your favor as much as you can on every trade you intend to make.
Options traders must realize that options are not the same as trading the underlying asset. Options have a time premium that vanishes with time, and that makes their probability of profit to be less than 50%.

Pros and Cons

Although forex traders are used to having an opinion on whether a pair is going to move up or down, the options’ trader should not theorize about it, but comparing the risk and reward characteristics of several possible trades to decide which is the most desirable. Dreaming about unlimited profits while buying low-probability options or selling far out of the money options with high-probability of profits without minimizing the risk is a recipe for disaster.

The Delta as a proxy of probability

An option’s Delta can be determined for each option, using an option-pricing model, which usually is made available by the broker to its customers. Sites such as Investing.com display the Delta of the most usual FX options.
Delta values range from 0 to 100 on Calls and from -100 to 0 on Puts. Delta can be viewed as
1.- An estimate of the odds that the option will be in the money at its expiry. For instance, if the EURUSD 1.1650 Sept Call has a delta of 0.33, it has about a 33% probability of expiring in the money.

2.- A delta of 0.33 implies that the option moves 0.33 pips for every pip of movement on the underlying. A delta of 100 means the option position is equivalent to buying the underlying asset; thus, a delta of -50 is equal to being short the underlying with half of the original position size.

Please note, though, that the Delta of an option changes with time and price movements.

Delta Neutral

Delta neutral is a way to place the overall trade position so that the Delta nears to zero. This can be achieved by having a combination of options with positive and negative deltas so that their summation is near zero. Delta neutral traders don’t bother with market movements, because they don’t not affect them. Their task is to keep their position neutral, rebalancing it when the position moves away from neutral by opening new positions and/or closing open ones. According to advocates of this methodology, Delta Neutral strategies naturally make a trader buy low and sell high, creating a consistently profitable game.

Probability and risk Analysis

Options traders usually have several ways to fill an options trade for a determined strategy. Thus, evaluating the probability and the risk of the possible trade combinations will determine which is the most profitable and best candidate.
For example, a trader may be decided to buy a put and a call on the EURUSD pair before a potential disrupting event. That way, he will profit from the volatility raise without caring about direction. But he may be in doubt about whether to buy them at the same strike price (Straddle) or a different price (Strangle).

The trader must consider the following for every candidate combination:

  • Upside and downside break-even points
  • Probability of being outside of BE at Expiration
  • Profit at expiration for the upward and downward targets
  • The maximum loss of the option combination
  • Likelihood of experiencing the maximum loss.

A table made with these parameters will show the best alternative, which in this case, is the Straddle, as it shows the best settings and also the highest rewards for its risk.

Keys to Success in Option Trading

The essential trading guidelines to succeed in options trading are:

  • Identifying the strategies available
  • Understanding when to use a given plan to maximize the benefit
  • Accurately evaluating the level of the current volatility
  • Identifying whether it is time is to buy premium or sell premium
  • Buying undervalued options and selling overvalued options
  • Recognizing when there are disparities in the implied volatilities of different options and take advantage of the fact
  • Properly take a profit and cut a loss

Stay tuned for more on Option Strategies!

Recommended reading:
THE OPTION TRADER’S GUIDE TO PROBABILITY, VOLATILITY, AND TIMING , by Jay Kaeppel

Categories
Forex Videos

Forex Options Part 5 – Risk Profiles


Forex Options III- Risk Profiles of the Basic PUT/CALL Strategies

A Risk profile is the most important tool for analyzing the gain-loss potential of an Options strategy. Thus we need to dedicate a chapter to understand how to make risk profiles. That is because understanding and managing risk is a critical task for the options trader.

Risk profile

A risk profile is the graphical representation of the profit-loss of an options trade in relation to the changes in the price of the underlying asset. The horizontal axis shows the possible stock prices of the underlying asset. The vertical axis from bottom to top show potential losses and profits. The graph lines indicted the theoretical profit and loss of a position at expiration. The zero-line is the trader’s break-even point.


To create a risk profile of a Call option, the horizontal line below the zero-line would represent the cost of the option at day zero. Since below the strike price, the option has no intrinsic value. The horizontal line shows its time value. This line is extended until the strike price point. From there, profits begin to add up, so the path heads to the upside with a slope that reflects the profit and price change.

EURUSD 1.1850 Sept. Call

An easy way to construct it is by using Excel’s graphs after creating a table with relevant profit-loss points. As an example, we present a long position on EURUSD 1-1.850 sept-2020 Call.


In a long Call position, we buy the right, but not the obligation to purchase the asset at the strike price. Thus, if the asset drops in price, let’s say to 1.0000, we are not obliged to buy at the 1.1850 strike price. This sets the maximum loss to the price paid for the call option, which is $144.

Therefore, we set the cost value (-$144) with a minus sign from 1.0000 to its 1.1850 strike price. That will draw a horizontal line. Then we compute the break-even price (1.1944) and set its profit to zero. We calculate the distance from strike to BE ( 0.00940) and add points every that distance, which should also show $144 profit differences. After creating the table, we can create a graph and display it on the sheet.

Similarly, the same EURUSD 1.185 Short Call option will look like:


In the case of an option seller, he expects the price not to go above the strike price at expiration, but our maximum profit is the option premium ($144). If the price moves above the strike price, his premium will fade and start becoming an increasing loss. That is reflected in the profile.

As for Puts, the EURUSD 1.1850 Long Put profile is shown below:

When we purchase a Put, we buy the right to sell at the strike price. Thus, we expect the price of the asset to drop. But we don’t have an obligation to do it, So, if the asset’s price moves up, our loss will only be the cost of the Put option, $133 in this case. That creates the profit-loss profile shown above.

The short version of the EURSD September Put – when you sell the option instead of purchasing it– is:

In this case, the maximum profits occur when the price at expiration is above the strike price. Prices below expiration will covert that profit into increasing losses.

These kinds of graphs will give you the basic profile in case you don’t have more sophisticated options analytical software but is enough to create the strategies’ profile curves.

Categories
Forex Videos

Forex Options Part 4 – Volatility

Forex Options IV – Volatility

Historical Volatility

Historical volatility is the calculated or statistical volatility of an asset. It merely measures the price fluctuations of a security over a specific time. For example, we can calculate the standard deviation of the EURUSD pair over the last 20 days to get the 20-day historical volatility. Options traders, then, use this value to compute the fair price of a given option. If historical volatility is 25%, it means that the asset’s likely movement within the next 12 months will be in a range of about 25% from the current price ( plus or minus).

Figure 1 – EURUSD daily chart with its 20-day historical volatility curve.

Implied Volatility

Implied volatility represents the volatility of an asset expected by the market over the life of an option. The main difference with historical volatility is that the later is based on past price changes. In contrast, Implied Volatility is the volatility implied by the current price action of a given option. Historical volatility looks at the past, whereas implied volatility reflects the market’s expectations for future volatility.

Figure 2 Implied volatility shift with time and strike price


source: Semantic Scholar

When the expected volatility decreases, the option’s premium drops, and when it moves up, the option’s price goes up. Thus, assets with lower levels of implied volatility will hold cheaper option prices.

Implied volatility changes, as the view of the market participants shift. Options’ sensitivity to the changes in implied volatility varies with the time to expiration and strike to spot Price distance. An option near expiration will be less sensitive to implied volatility changes than a similar option with a longer time to expiration. Also, options with strike prices at the money have the highest sensitivity. In contrast, options deep in the money or out of the money are less sensitive to implied volatility shifts.

How to effectively use Implied Volatility

We can follow the asset’s implied volatility and take note when it peaks and when it troughs historically, to determine when it is relatively high and low.

Fig 3 – EURUSD Implied volatility changes
source: dailyfx.com

Following this procedure, we can determine when option prices are cheap, and when they are expensive. Also, since volatility tends to be mean-reverting and cyclic, traders could forecast a potential move towards its average value.
Volatility forecasting by itself is not a stand-alone strategy but can help traders decide their optimal option selection. For instance, if the options are expensive, and a trader expects this to revert to lower values soon, he may choose to sell instead of buying overpriced options. Strategies following this idea can be covered calls, naked puts, or credit spreads. Also, during low implied volatility, the purchase of options is the best choice. In that case, long calls, or even, a long straddle ( long put + long call) can be profitable.


Recommended reading:
THE OPTION TRADER’S GUIDE TO PROBABILITY, VOLATILITY, AND TIMING , by Jay Kaeppel

Categories
Forex Videos

Forex Options 3 – Option Pricing


Forex Options III – Option Pricing


Supply and demand

The price of a given option is determined in the real market by supply and demand. That means a buyer and a seller must agree on a determined price to complete a transaction. A buyer willing to buy at market price must pay the ask price. A seller wanting to sell at market price should accept the bid price. Options spreads are usually larger than spot spreads. For instance, the typical spread of a EURUSD spread is 3-4 pips, but its lower risk at a reduced cost makes them attractive to knowledgeable option traders.

A probability game


Options trading is a probability game. The long-term profitability of an options strategy is linked to the traders trying to buy undervalued options and sell overvalued options. Therefore, the trader should have a clear understanding of theoretical versus market valuations, and, in the case of FX Options, knowing the underlying market fundamentals.
The majority of options traders use an option as if it was the underlying, buying calls when they think the asset will go up and buying puts when considering it will go downward. The issue is that options are wasting assets, thus in most cases, that approach is unprofitable.

Structured approach


Most authors consider that to trade options successfully, a structured approach is necessary. A trading plan is needed, and, in addition, developing the discipline to follow it.
The benefits of a structured approach are:
Emotions are eliminated in the decision-making process
There is no psychological need to be right
The best thinking effort is made before the battle, avoiding subjective decisions

The Theoretical Pricing Model

Options are complex investment products as it involves estimating the odds the price of an underlying asset to surpass the strike price within a given time lapse. The most used model is The Black-Scholes equation that uses the price, volatility, time, and interest rates to compute an option’s fair price. The basic idea of the Black-Scholes model is that the right to delay a decision ( to buy an asset at a specific price) has a value, which can be computed.
A general trait of these models is the assumption that the distribution of prices in the market is Gaussian or something close to it, on a logarithmic scale. Although the Gaussian distribution is an approximation to the way prices move, it is essential to understanding the pricing model’s statistical nature.

Under this model, the price movements of the underlying assets move also following the Normal Distribution. If you’ve followed us in our Stats for traders” video series, you’d understand by now that 68,2% of the values following the bell-shaped curve lie within one standard deviation (SD) from the mean and 95.4% of them lie within two SDs.
That means only 31.8% lie away more than one SD, and just 4.6% go farther than two SDs. In the case of an option, we are interested in only one side of the bell curve. In this context, only 15.9% of the data points lie beyond 1 SD, and 2.3% beyond two SDs.

The Black-Scholes-Merton Formula

C(S0,t) = S0N(d1) -Ke-r(T-t) N(d2)

S0N(d1): The Intrinsic value
-Ke-r(T-t)N(d2): The time value of the option

d1 and d2 are calculations of the area of a point in the curve, which will show the price’s odds to reach that point.

As said, the Black-Scholes-Merton equation assumes that price movements follow the Gaussian Distribution. That, combined with an expiring date and the knowledge of the volatility (sigma) of the asset, are the key ingredients to assess the fair price of the option.
If we were to buy at the absolutely fair price, the model would predict zero gains and zero losses in the long term. But the volatility in the market is not constant but changing. Therefore, the ability to evaluate which options are cheap or expensive, under our forecasted scenario showing a higher (or lower) future volatility is one of the elements for success.

In the next video of this series, we will develop the volatility concept applied to options.


Recommended reading:
THE OPTION TRADER’S GUIDE TO PROBABILITY, VOLATILITY, AND TIMING , by Jay Kaeppel

Categories
Forex Videos

Forex Options 2 – Intrinsic Value & Time Value

Forex Options II – INTRINSIC VALUE AND TIME VALUE

As we have seen in our previous video, Options have value, called the premium. The premium is the cost of buying the option and varies depending on its strike price distance to the spot price.
As we can see on the graph 1, depending on whether the spot price is above, equal or below the strike price, it is said s call option is “in-the-money,” “at-the-money,” or “out-of-the- money” (Conversely, “out-of-the-money,” at-the-money” and “in-the-money” for a put option.)
The value of the option (premium) in a determined moment is composed of its intrinsic value and time value.
Premium = Intrinsic Value + Time Value

Intrinsic value


The intrinsic value of an option is the amount by which it is in-the-money. The intrinsic value part of the premium is not reduced or lost by the passage of time. On a Call option, it is the difference between the spot price and the strike price of the underlying asset. On a Put option, the intrinsic value is equal to the subtraction of the strike price and the asset’s spot price. If the option is at the money or out of the money, its intrinsic value is zero.
We can see that the intrinsic value is not dependent on how much time is left until its expiration. It only tells how much of the value of the asset is included in the price. If the intrinsic value is zero, then the premium has only time value, which decreases over time.

Time Value

The time value (Theta) can be thought of as the amount by which the premium exceeds its intrinsic value. Also called Extrinsic value, the time value has a direct relation to time, but also to changes in volatility. The time value of an option expiring in three weeks has less time value than a similar option expiring in six weeks. That is logical, as the buyer can profit more time from the movement of the option.
Since American options can be exercised any time before expiration, an option premium cannot go below its intrinsic value. This means that the cheaper the option, the less real value is included in the price. The price of out of the money options are lower as the strike price moves further out of the money. That is because the odds of being profitable at expiration decrease with distance from strike to spot price.
The time value has a kind of snowball behavior. It decreases slowly when far away from expiration, but it accelerates and depreciates faster and faster. On the expiration date, the option’s value is only its intrinsic value, which means the option has to be in the money.
As the option is deeper in the money, it has less time value and more intrinsic value. This also means the option behaves more and more as its underlying asset. This is related to the Delta getting closer to 100 ( or -100 in the case of puts). The higher the Delta, the option captures a higher percentage of the movement of its underlying asset.

That’s all for today. In the next videos will explain the basic strategies using options.


Recommended reading:
THE OPTION TRADER’S GUIDE TO PROBABILITY, VOLATILITY, AND TIMING , by Jay Kaeppel

Categories
Forex Videos

An Introduction To Forex Options Part 2- Step Up Your Game!

An Introduction To Forex Options Part 2- Step Up Your Game!


The price of the option, at least theoretically, is determined by a complex computation using the Black-Scholes model. The Black-Scholes equation aims to compute the fair value of the contract, based on the asset’s volatility, the time in days to the expiration, and the distance of the strike price to the spot price of the underlying.
But, the market may and do set a different price. Since strike price and expiring date are fixed, the difference of the market price with the theoretical price, computed using historical volatility, is attributed to a different perception of the asset’s volatility, which is called “implied volatility.”

The greeks

The running price of an option depends on several factors, as we can see: The volatility, the distance of the strike to the current price, and the time to the expiration. The greeks are four factors that define the risk of the option: Delta, Gamma, Vega, and Theta.

Delta

Delta measures the change in the price of an option that results from a change in the underlying’s price. The value of delta ranges from – 100 to zero on puts and from 0 to 100 on calls. For example, the delta of a call at the money ( when the strike and spot prices are equal) is 50, which means the option’s value changes 50% of the change on the underlying’s price. Delta is also a measure of the probability of being profitable at expiration.
We have to pay attention to the following:
– Deltas increase as the expiration date gets closer
– Delta’s rate of change is measured by Gamma
– Implied volatility changes can also change the Delta.

Gamma

Gamma measures the rate at which Delta changes. Gamma is small for out of the money options and gets higher as the option moves at the money. Gamma is positive ( 0-100) for calls and negative ( -100-0) for puts.
A low gamma suggests that even a large movement on the underlying will have a small effect on the Delta and, therefore, on the option’s price.

Vega

Vega is the measure of the volatility of the underlying asset. As the Vega increases, so do the odds of the price moving larger ranges. Hence, an increase in Vega it rises the price of the option, while a shrinking vega will lower it. Thus, option sellers benefit from the shrinkage of Vega. Vega reflects the price action of the market. An increasing Vega shows a trend, while a decreasing vega may show a trading range. Also, since Vega reflects the implied volatility, it can increase or decrease without any price changes on the underlying asset. Of course, a quick change in the price increases it. Also, Vega drops as the option gets closer to its expiration.

Theta

Theta shows the time decay of the option and is related to its distance to the expiration date. As time passes, Theta drops. Theta is always negative since time moves in the same way for calls and puts. Consequently, Theta decay is good for sellers and bad for buyers. Theta is highest for the at-the-money option, and its value drops to its negative limit with an increasing rate near expiration.


Recommended reading:
THE OPTION TRADER’S GUIDE TO PROBABILITY, VOLATILITY, AND TIMING , by Jay Kaeppel

Categories
Forex Videos

An Introduction To Forex Options Part1 – Step Up Your Game!


Forex Options: Introduction


This article begins a series that will explain the basic concepts of options. We will focus on the basic or vanilla options because we think they are the most used in all markets, and base of all variants, including the infamous binary options.

Options as Insurance

An option was thought of as insurance, where the buyer acquires the right to be compensated if something happens to his main assets. That way, fund managers could hedge the risks of their portfolios. Thus, an option is a derivative from the main asset, which gives the buyer the right, but not the obligation, to buy or sell at a determined price at the expiration date.
Therefore, contrary to the underlying asset, an option purchase offers unlimited gains for a limited loss. In a sense is like a position with built-in stop loss, only that the stop loss does not get executed until the expiration date of that option. This, and its relatively low cost compared with the cost of the underlying asset, has made options a game extremely popular.

The contract

Options are structured contracts between two parties, a buyer and a seller in which the seller takes the obligation to sell a specified asset at a determined price, called Strike Price, at a future expiration date. The buyer also acquires the right, but not the obligation to buy the asset at the strike price.
Option basic classes
There are two basic option classes: Calls and Puts.

Fig 1 – The valuation curve of a Call

Fig 2 – The valuation curve of a Put

A Call offers the buyer the right to buy the underlying asset at the strike price, and a put provides the buyer the right to sell it at the specified strike price, both at a set expiration date. There are two options styles, European and American options. Both are similar. The only difference is that American options allow the buyer to exercise the option at any time before expiration, while the European style may be exercised only on the Expiration date. The difference is subtle but unimportant, as any trader can sell the purchased option instead of exercising it and use the money to purchase the asset.

Option contract detail terminology

The terminology of an option stipulates the asset, expiration date, type, and strike price of the contract. Example:
“EUR-USD December 01 1.20 Call”
This contract states that the underlying asset is the EUR/USD pair, that the expiration date is December 01, the strike price is 1.20, and is a Call.

Expiration dates are usually the third Saturday of the month for monthly options, but there are also weekly options that may expire at a determined day and time.
We can see that for a predetermined asset there can be a lot of different contracts involving different expiries, strike prices, and class (put or call). These contracts are called option chains.


Recommended reading:
THE OPTION TRADER’S GUIDE TO PROBABILITY, VOLATILITY, AND TIMING , by Jay Kaeppel

Categories
Forex Videos

How To Make Money Following Our Free FX Options Signals! Updates & Improvements

How To Make Money Following Our FX Options Section – Update

Thank you for joining the Forex Academy educational video. In this video, we will be looking at our FX options service, which is completely free and which we first brought you on the 23rd of April this year. We will be taking a look at how the service is going since its inception and what’s changed and how it can be applied to your daily trading to enhance your overall success rate.


First, you will need to head to our website at Forex (dot) Academy, select market update, and from the drop-down menu, click on FX options.


Every day, on this page, our analyst, Kevin O’Sullivan, brings you the combined volume FX option expiries, which close at 10 a.m. New York time, each day. The combined amounts will never be less than 100 million of the local currency pertaining to the maturity. And where these large volume FX option maturities have a magnetic effect on the price action of the particular currency typically major pairs that are involved.


This is what you might expect to see when you click on the FX options page every day when the majority are available. Here we can see that there are three options maturities due to roll off at the 10 a.m. New York cut. The first option is for 982 million euros at the 1.1300 exchange rate, the second option is for 584 million euros at 1.1400, and the third option is 4 for 512 million euros at 1.1500.


These FX option maturities are lean plotted on to a 1-hour chart and colour coded red, orange, or blue. If you see an FX option in red, there is a high probability that’s the price action gravitates towards this by 10 a.m. New York. If the maturity is colour coded in orange, there is a slightly less possible chance of price reaching this level by the cut. And if the maturities are highlighted in blue, there is an unlikely chance that price action reaches these levels by 10 a.m.


Kevin will also so provide chart analysis, which is a fairly new feature when he publishes this data at around 8:30 a.m. BST each day. Here he says that the pair is consolidating but that the 1.1400 option expiry is within range and with a caveat that eurozone data and policymaker speeches may play a role in trend direction. He has provided support and resistance levels, and the two options at 1.13 and 1.15 are discounted by coding them in blue, Kevin, and where he believes the price will move to the upside to target the 1.400 maturity which he has coded in red.


Let’s take a look at the price action later on during the European and United States session in this pair. We can see that Kevin was correct price action punched through the resistance line and headed up to the 1.1400 option maturity. At no time did price action go near the one 1.13 00 or 1.1500 levels, as predicted, and where these were highlighted in blue as being unlikely. And at the time of the New York cut, the exchange rate was 1.1430, just 30 pips away from the favoured red option at 1.1400.
It is suggested by Kevin that traders place the option expiry levels onto their own charts in order to feed this into their own trading methodology. Even if you had taken on the trade based on Kevin’s recommendation early in the European session, you could have made nearly 50 pips as the price rose.
What is more, is that this service is extremely reliable and wear on a regular basis the technical analysis as provided by Kevin is throwing up accurate predictions often with pinpoint accuracy and regularly buy a handful of pips. Which just goes to show how much the market pushes price action to these key fx expiries and where are often larger the combined amount of the maturity, the more likely of price action hitting the FX option maturity at the time of the 10 a.m. New York cut.

Categories
Forex Videos

How Do Forex Option Expiries Effect Price Action In The Spot FX Market – Forex Academy Shows You

How do forex option expiries affect price action in the spot FX market


In this video presentation, we are going to be looking at how Forex option expiries affect price action in the spot FX market.
We will be exploring how forex options work, although we will not be concentrating too much on the technicalities of how they are traded because we are more interested in how FX options expiries can be of great benefit to traders in the spot FX arena.

So what are FX Options, and what is the significance of their expiries?

FX options is essentially another way of trading forex. In effect, they are different branches of the same entity. One is traded on the spot FX, thus known as the Spot FX market, which most of you will be familiar with, and the one we are discussing today is the Future’s FX Options market, where trades are made based upon the price of a currency exchange rate at some point in the future.

So what are FX options?

Options traders purchase what is called a premium, which is a contract and which gives them the right, but not an obligation to buy or sell an FX currency exchange rate at a specified price. This exchange rate is called a strike.
Typically these contracts will be purchased for a future date, typically days, weeks, or even months in advance and where the contract is purchased from a market maker, which is usually an institution that offers futures contracts trading, unlike banks and brokers which offer spreads in spot forex. Contracts expire on the date that the trader chose and always at 10:00 a.m. in New York, USA. This is known as the New York Cut.


If a trader wishes to purchase a premium, for a future date, for an FX Option, where he or she believes that a chosen currency pair’s exchange rate will be above that at the time of the purchase, he or she buys a Call Option. This is an option to buy. Alternatively, if the trader wishes to purchase a premium for an option where he or she believes that the future currency pair’s exchange rate would be below that at the time of the purchase, he or she buys a put option. This is an option to sell.

So how much does the premium contract cost a trader?

This will vary depending on the size of the contract and also so how far the future currency exchange rate is from the current one and the length of the future expiry date. However, futures traders often prefer this type of exposure in the FX market because they take a long term view of where exchange rates will be. And rather than swing trade to these levels in the spot FX market, they prefer to pay the price or premium for the contract upfront, and this then becomes their risk and exposure, unlike spot FX traders whose level of risk fluctuates with price action.

How do options traders make money?

If on the day of the maturity of the FX options contract at 10 a.m. for the New york cut the strike rate, or currency exchange rate, Is it at or above the exchange rate for a call option, or at or below the exchange rate for a put option, then the trader is known as being in the money. If a currency exchange rate is not hit, they are out of the money. If they are out of the money, the option expires, and the contract is worthless to the buyer, and he loses the premium.

If, however they are in the money, the buyer will get to exercise the option and create a position in the market. And the seller of the contract will be the counterparty in the ongoing trade. The seller of the contract also gets to keep the premium.

So who trades FX currency options?

Anybody can trade FX options, but typically we will find institutions, high net worth individuals, forex traders looking to hedge positions, forward forex traders, speculators, exporters, banks, institutions, companies with exposure in the foreign exchange market generally.
Insert G: So, how does FX currency options affect the spot FX market? Interestingly, when FX options expiries accumulate into large amounts, typically $100 million +, we often find that these accumulated amounts at a set currency exchange rate have somewhat of a magnetic effect to spot FX Trader in the run up to the 10 a.m. new york cut.

Although these huge amounts of options expiring at a particular level occur on an almost daily basis, it does not definitely mean that price action pertaining to a particular pair will hit the strike rate. However, some of the traders who are involved in FX options will also use the Spot FX market to hedge some of their own positions, thus using the Spot market to try and move price to where they need it to be.

Also, these currency options expiry levels with the accumulated amounts are available via certain brokers and commentators before the expiries. Thus this publicly available information is used by Spot FX traders to keep an eye out in the market in the period leading up to the expiry. Remember, the larger the amount of the expiring contracts, the more it would seem that there is a gravitational pull towards these exchange rates.

Forex.Academy will be making these levels available to you, free of charge, and they can be accessed on the options drop-down menu of our home page. For your convenience, as and when option expiries become available almost each day, we will also plot them onto a chart, as per this slide, and you will be able to view them there for your convenience.