Forex Options IV – Volatility
Historical Volatility
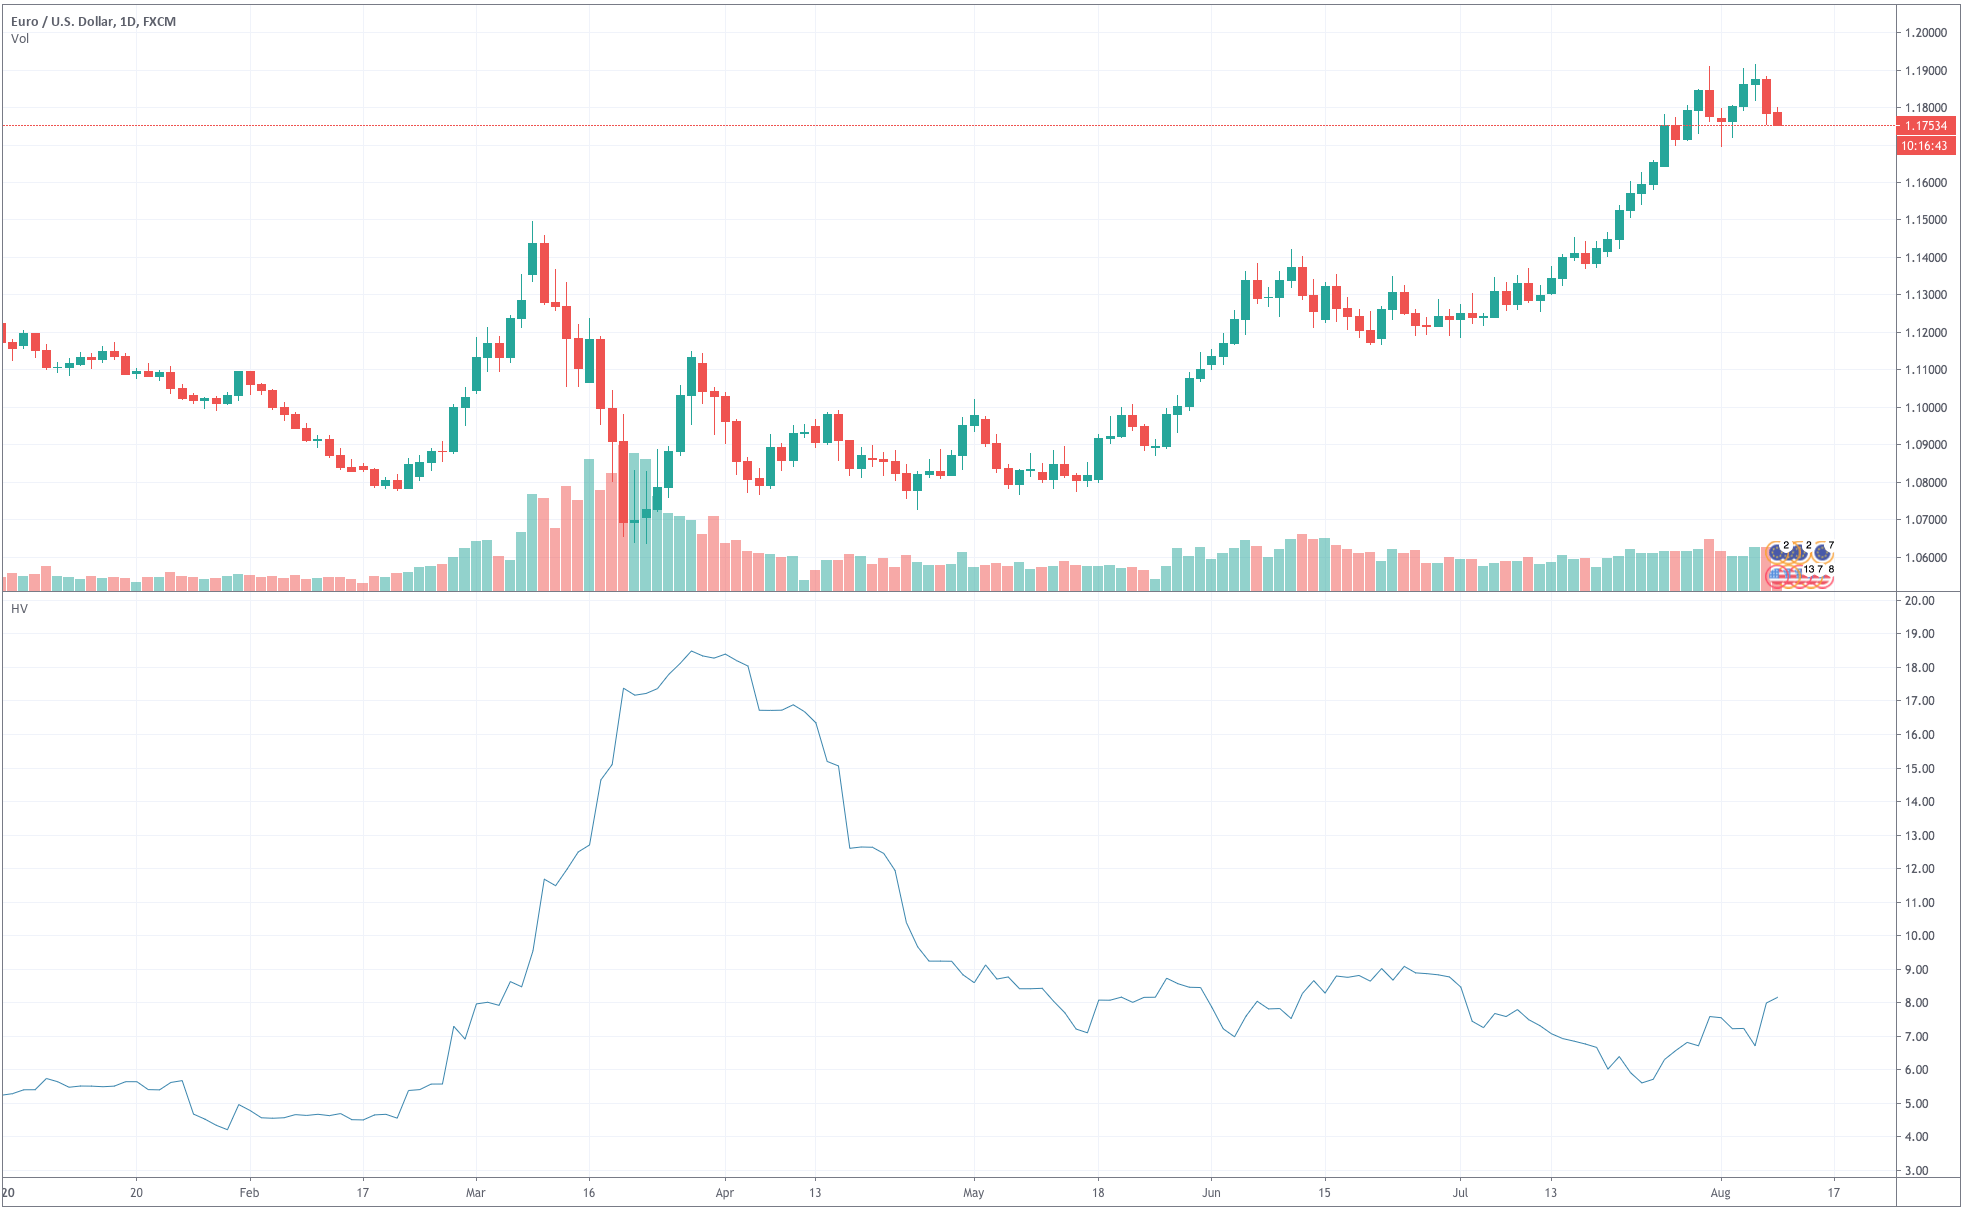
Historical volatility is the calculated or statistical volatility of an asset. It merely measures the price fluctuations of a security over a specific time. For example, we can calculate the standard deviation of the EURUSD pair over the last 20 days to get the 20-day historical volatility. Options traders, then, use this value to compute the fair price of a given option. If historical volatility is 25%, it means that the asset’s likely movement within the next 12 months will be in a range of about 25% from the current price ( plus or minus).
Figure 1 – EURUSD daily chart with its 20-day historical volatility curve.
Implied Volatility
Implied volatility represents the volatility of an asset expected by the market over the life of an option. The main difference with historical volatility is that the later is based on past price changes. In contrast, Implied Volatility is the volatility implied by the current price action of a given option. Historical volatility looks at the past, whereas implied volatility reflects the market’s expectations for future volatility.
Figure 2 Implied volatility shift with time and strike price
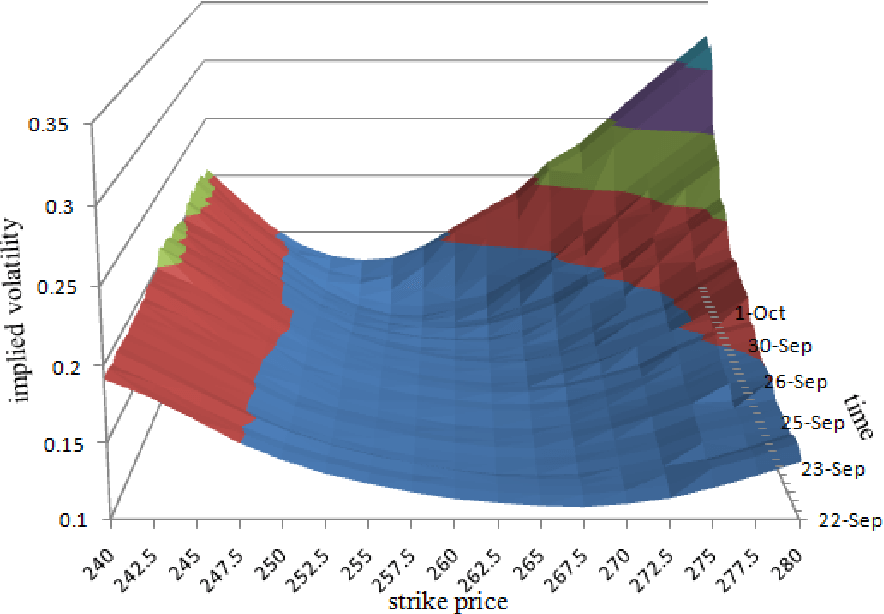
source: Semantic Scholar
When the expected volatility decreases, the option’s premium drops, and when it moves up, the option’s price goes up. Thus, assets with lower levels of implied volatility will hold cheaper option prices.
Implied volatility changes, as the view of the market participants shift. Options’ sensitivity to the changes in implied volatility varies with the time to expiration and strike to spot Price distance. An option near expiration will be less sensitive to implied volatility changes than a similar option with a longer time to expiration. Also, options with strike prices at the money have the highest sensitivity. In contrast, options deep in the money or out of the money are less sensitive to implied volatility shifts.
How to effectively use Implied Volatility
We can follow the asset’s implied volatility and take note when it peaks and when it troughs historically, to determine when it is relatively high and low.
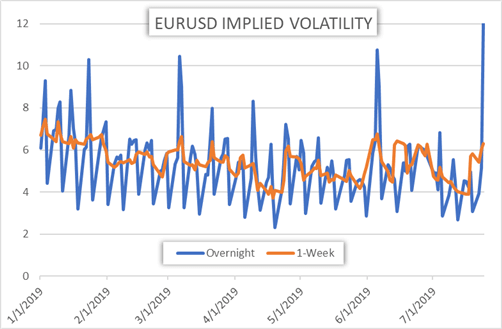
Fig 3 – EURUSD Implied volatility changes
source: dailyfx.com
Following this procedure, we can determine when option prices are cheap, and when they are expensive. Also, since volatility tends to be mean-reverting and cyclic, traders could forecast a potential move towards its average value.
Volatility forecasting by itself is not a stand-alone strategy but can help traders decide their optimal option selection. For instance, if the options are expensive, and a trader expects this to revert to lower values soon, he may choose to sell instead of buying overpriced options. Strategies following this idea can be covered calls, naked puts, or credit spreads. Also, during low implied volatility, the purchase of options is the best choice. In that case, long calls, or even, a long straddle ( long put + long call) can be profitable.
Recommended reading:
THE OPTION TRADER’S GUIDE TO PROBABILITY, VOLATILITY, AND TIMING , by Jay Kaeppel