
Forex Options III- Risk Profiles of the Basic PUT/CALL Strategies
A Risk profile is the most important tool for analyzing the gain-loss potential of an Options strategy. Thus we need to dedicate a chapter to understand how to make risk profiles. That is because understanding and managing risk is a critical task for the options trader.
Risk profile
A risk profile is the graphical representation of the profit-loss of an options trade in relation to the changes in the price of the underlying asset. The horizontal axis shows the possible stock prices of the underlying asset. The vertical axis from bottom to top show potential losses and profits. The graph lines indicted the theoretical profit and loss of a position at expiration. The zero-line is the trader’s break-even point.

To create a risk profile of a Call option, the horizontal line below the zero-line would represent the cost of the option at day zero. Since below the strike price, the option has no intrinsic value. The horizontal line shows its time value. This line is extended until the strike price point. From there, profits begin to add up, so the path heads to the upside with a slope that reflects the profit and price change.
EURUSD 1.1850 Sept. Call
An easy way to construct it is by using Excel’s graphs after creating a table with relevant profit-loss points. As an example, we present a long position on EURUSD 1-1.850 sept-2020 Call.
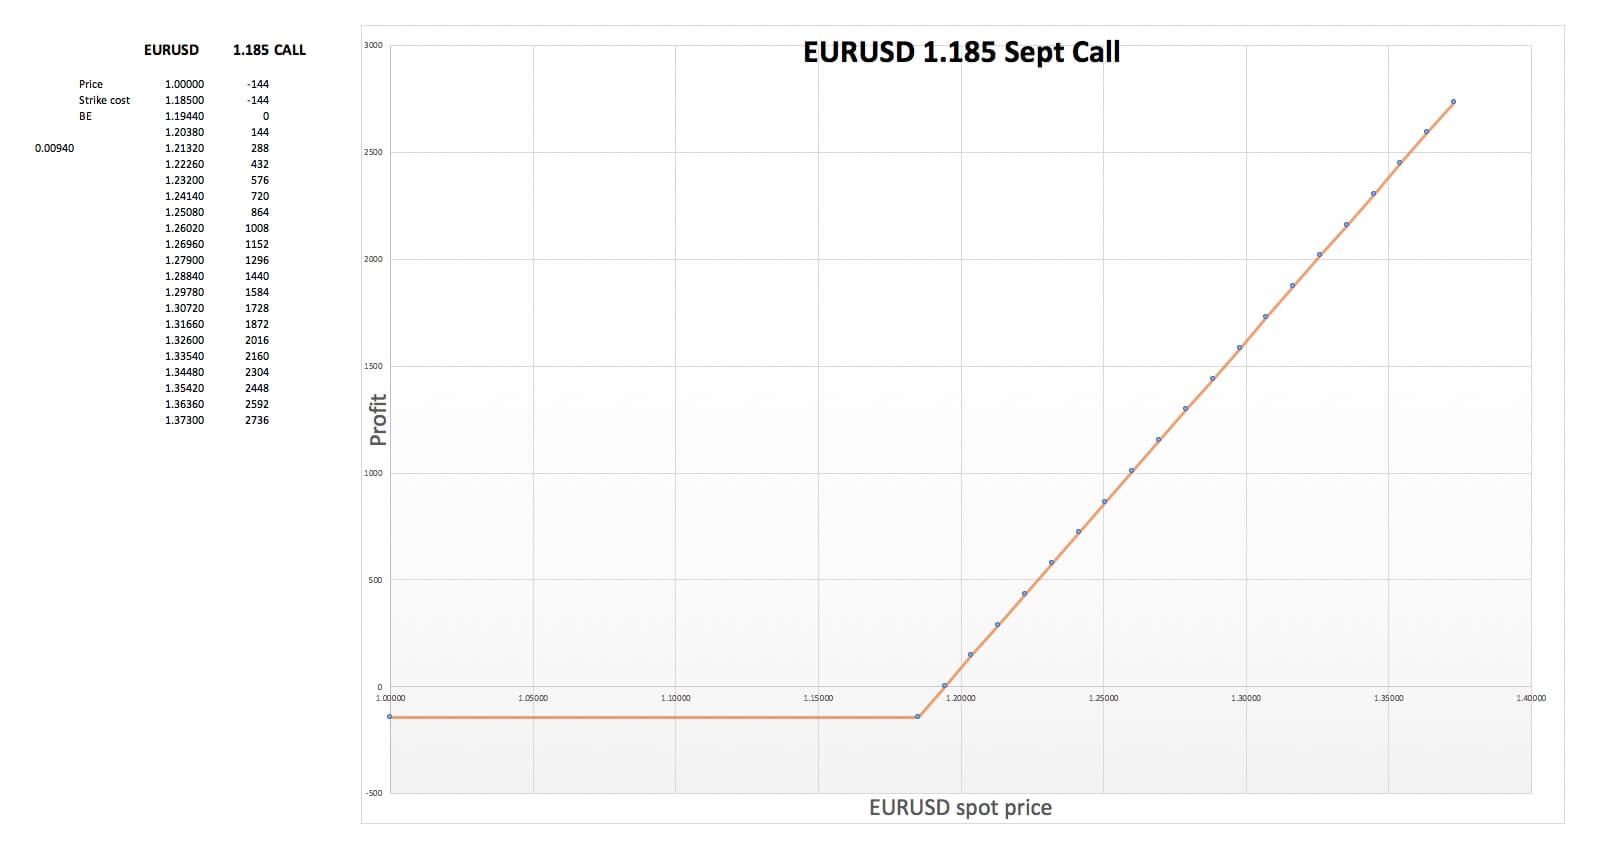
In a long Call position, we buy the right, but not the obligation to purchase the asset at the strike price. Thus, if the asset drops in price, let’s say to 1.0000, we are not obliged to buy at the 1.1850 strike price. This sets the maximum loss to the price paid for the call option, which is $144.
Therefore, we set the cost value (-$144) with a minus sign from 1.0000 to its 1.1850 strike price. That will draw a horizontal line. Then we compute the break-even price (1.1944) and set its profit to zero. We calculate the distance from strike to BE ( 0.00940) and add points every that distance, which should also show $144 profit differences. After creating the table, we can create a graph and display it on the sheet.
Similarly, the same EURUSD 1.185 Short Call option will look like:
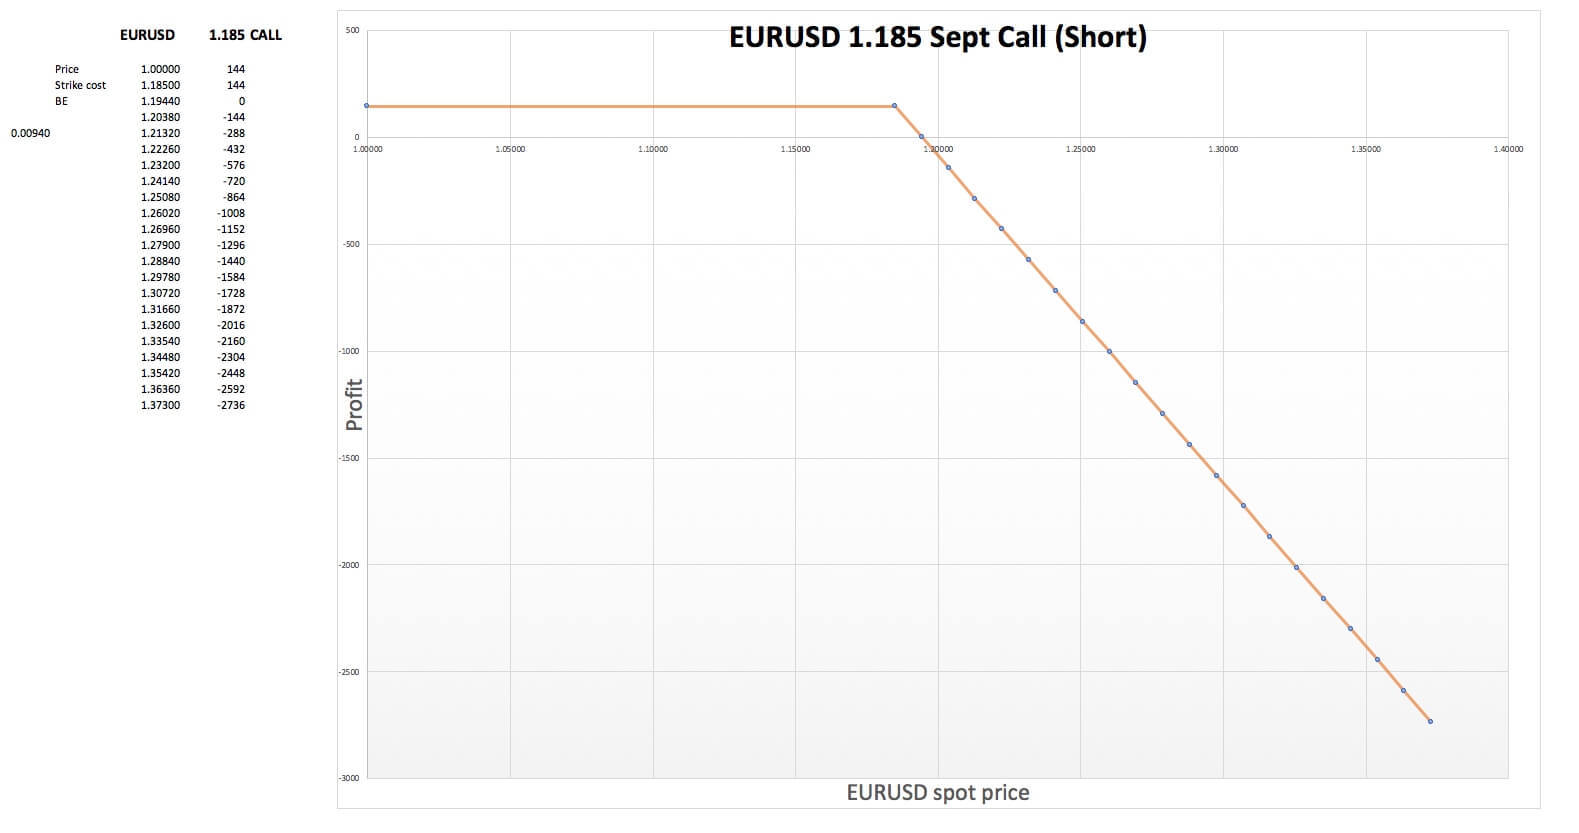
In the case of an option seller, he expects the price not to go above the strike price at expiration, but our maximum profit is the option premium ($144). If the price moves above the strike price, his premium will fade and start becoming an increasing loss. That is reflected in the profile.
As for Puts, the EURUSD 1.1850 Long Put profile is shown below: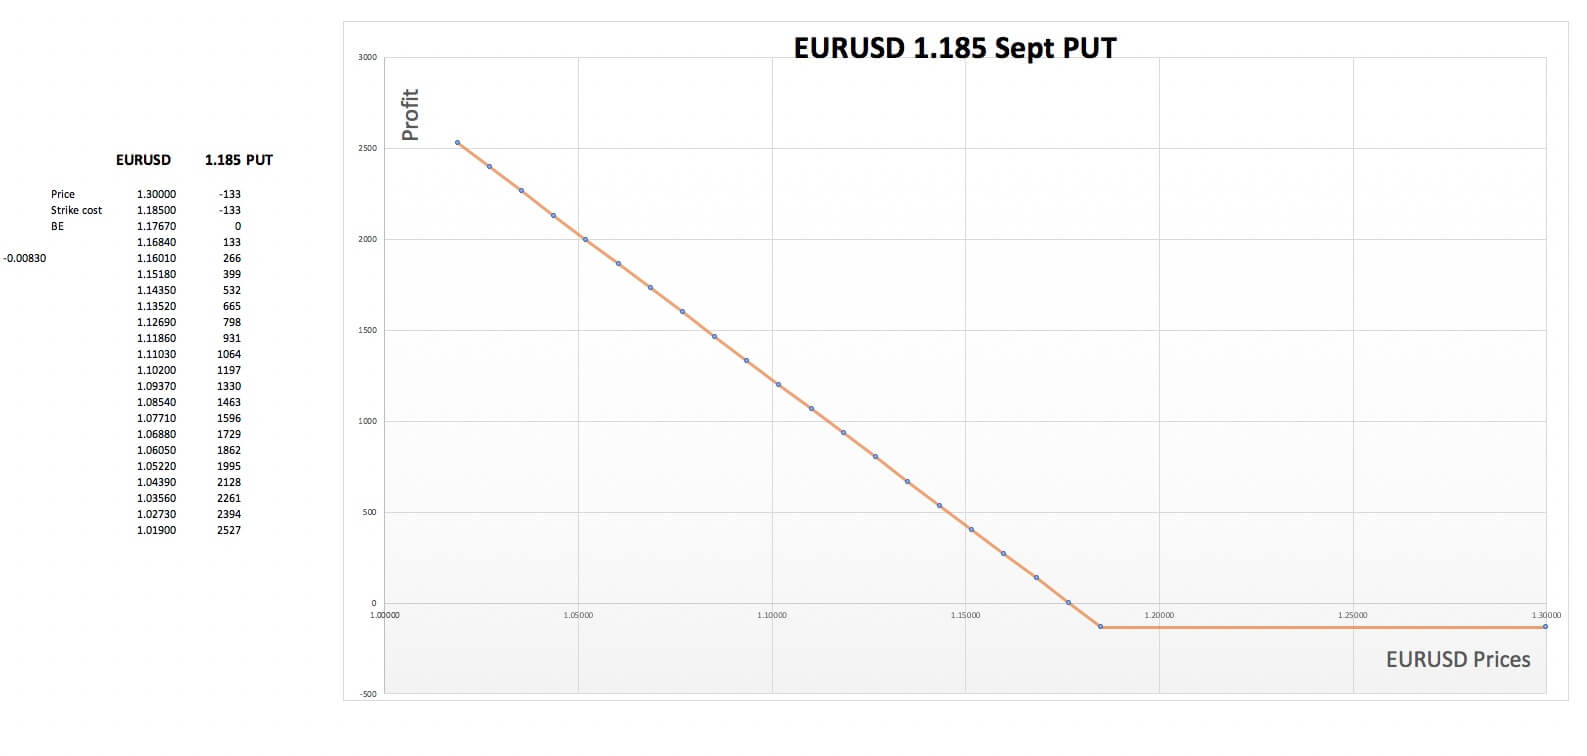
When we purchase a Put, we buy the right to sell at the strike price. Thus, we expect the price of the asset to drop. But we don’t have an obligation to do it, So, if the asset’s price moves up, our loss will only be the cost of the Put option, $133 in this case. That creates the profit-loss profile shown above.
The short version of the EURSD September Put – when you sell the option instead of purchasing it– is: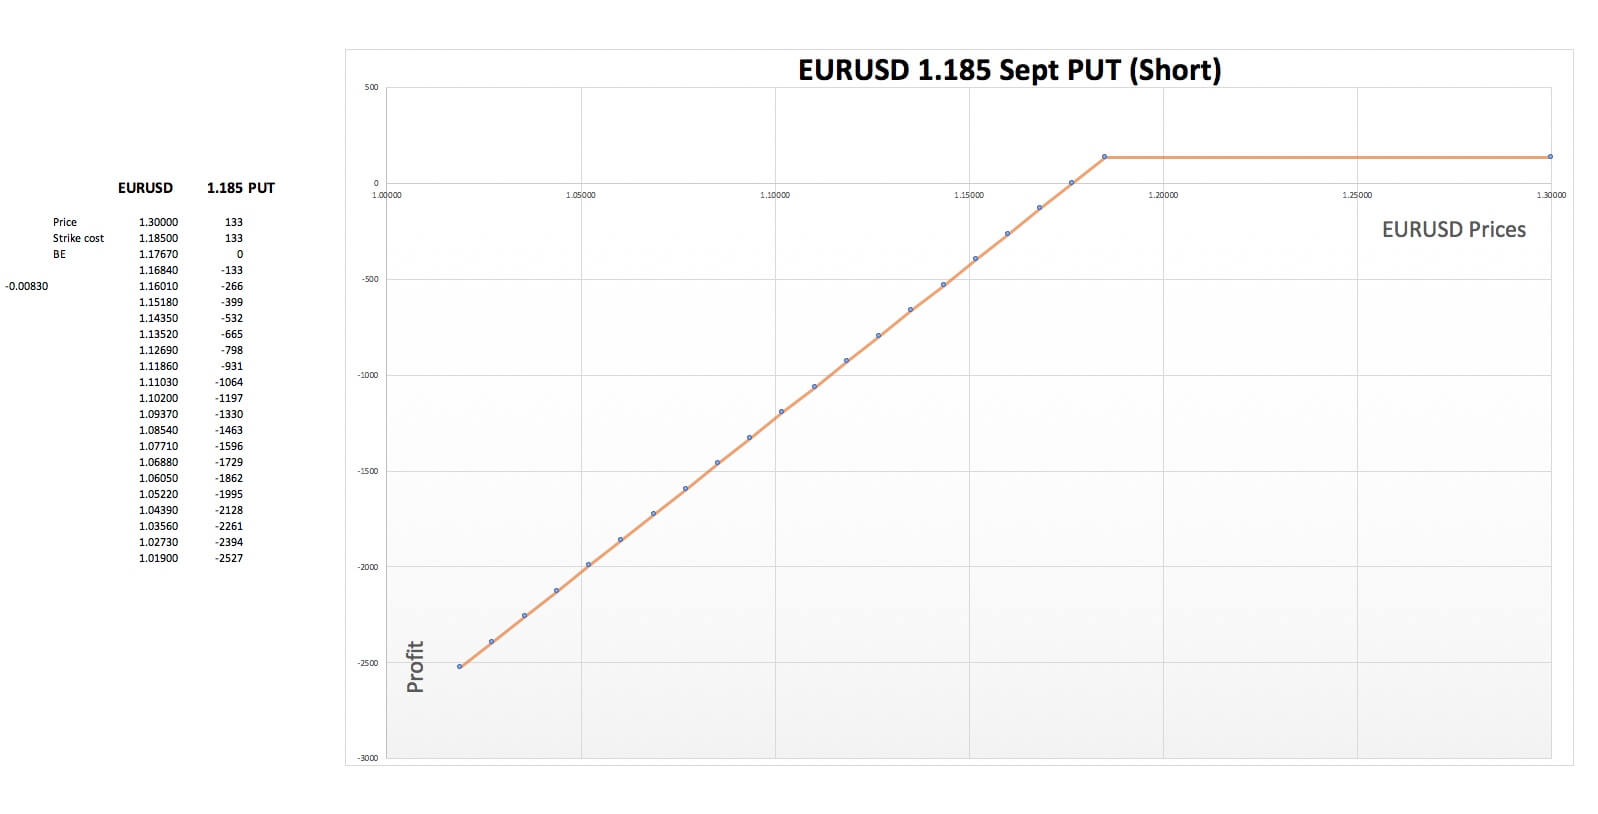
In this case, the maximum profits occur when the price at expiration is above the strike price. Prices below expiration will covert that profit into increasing losses.
These kinds of graphs will give you the basic profile in case you don’t have more sophisticated options analytical software but is enough to create the strategies’ profile curves.