
Introduction
The Transportation Industry’s contribution to GDP is both direct and indirect. The real contribution of Transportation to overall economic growth goes beyond what the GDP can measure. Hence, Understanding the Role of Transportation in economic activity and its underlying importance that is both visible and subtle is essential for our overall fundamental analysis.
What is GDP from Transport?
Transportation
Transportation includes the types of services that are provided through operating vehicles, moving goods, or people over public transport systems like roads, railways, waterways, airways, etc.
The supply side of the Transportation system is called the Transportation Industry. It is also essential to note that the Standard Industrial Classification (SIC) and North American Industrial Classification System (NAIC) both consider Transportation as a separate industry. They do so through a standard set of definitions and criteria. Hence, not all Transportation services come under the Transportation Industry.
The Transportation services’ contribution to GDP can be measured in the following ways:
Final Demand: It is calculated by adding all the expenditures by households, private firms, and the government on Transportation related goods and services.
Value Added: It is calculated as the GDP contribution by the Transportation services overall. Transportation Value Added is a gauge of the transportation sector’s contribution to GDP. It is based on the difference between transportation services sold value and the goods and services used to produce Transportation.
The Bureau of Economic Analysis (BEA) takes industry value added to be a measure of an industry’s contribution to GDP.
From measurement viewpoint, three types of transportation operations can be distinguished:
- For-hire operations: It includes those services conducted by transportation industries on a fee basis. A trucking company’s trucking operations is an instance of for-hire operations.
- In-house operations: also called, own-account operations, is conducted by non-transportation industries for their use. For instance, the Coca-cola company may transport its beverages to its local warehouse for storage through its trucks.
- Final user operations: Final users include the general population (end consumers) and the government who purchase transportation services like cars, trucks for their use.
Transportation Satellite Accounts: The Satellite industry segregates data by focusing on types of economic activity. Hence, the TSAs depict the contribution of for-hire, in-house, and household transportation services as they all form part of the Transportation Industry.
How can the GDP from Transport numbers be used for analysis?
The Transportation-related Final Demand metric is useful to compare the expenditures incurred on other industries like healthcare or housing. For sector-wise, growth analysis, investors can use this to gauge, which industries are experiencing increasing demand that can help them to invest accordingly.
On the other hand, it is not an accurate metric to measure the Transportation needed to support and sustain economic activity. For instance, if the investment into Transportation infrastructure is underfunded, then correspondingly, it will underestimate the final demand due to low economic output. The Transportation industry’s contribution in the year 2019 and 2018 has stayed around 3.2% of GDP as per BEA.
The value-added contribution of Transportation Industry to GDP is, however, understated for the following two reasons:
- It only includes the contribution of for-hire transportation services. Many industries use transportation services for their use. In-house services do not contribute to GDP.
- The extent to which industries depend on Transportation is not depicted in these figures. Mobility and interconnectivity between industries, states, and countries are critical factors in business growth in today’s interconnected international markets.
Accessibility to resources, end consumers are all enabled through Transportation and are heavily impacted with poor transportation infrastructure. The US Department of Transportation – Bureau of Transportation Statistics accounts for the TSA reports, and they, by far, depict the contribution of the Transportation industry better than other measures published.
Impact on Currency
Sources of GDP from Transport
For the United States, the BEA reports are available here – GDP -BEA
We can use the GDP by Industry to get the transport’s contribution to GDP here –
GDP by Industry – BEA & Transportation Statistics –Annual Report – BTS
Transportation’s contribution to GDP for the world can be found here –
GDP from Transportation – Trading Economics
GDP from Transport Announcement – Impact due to news release
The main role of transport is to provide access to different locations to individuals and businesses. Transport facilitates a wider range of social and economic transactions than would otherwise be possible. Transport is an important sector in its own weight. Transport infrastructure and transport operations together account for more than 5% of the country’s GDP. In developed countries, further investment in that infrastructure will not only result in economic growth but also improve the quality of life, lower costs to access resources and markets, and improve safety.
Therefore, the transport sector is an important sector of the economy that many long-term benefits associated with it. Fundamentally speaking, investors would not invest based on a currency based on the contribution made by the transport sector alone, as its direct influence on the GDP is less. The transport industry indirectly helps in boosting the GDP by assisting in all business activities.

In today’s article, we will observe the impact of GDP on various currency pairs and observe the change in volatility because of its news announcement. For illustration, we have collected the latest GDP data of Switzerland, which was released in March. The below image shows that the GDP in the fourth quarter was slightly better than expectations and higher than the previous quarter.

USD/CHF | Before the announcement
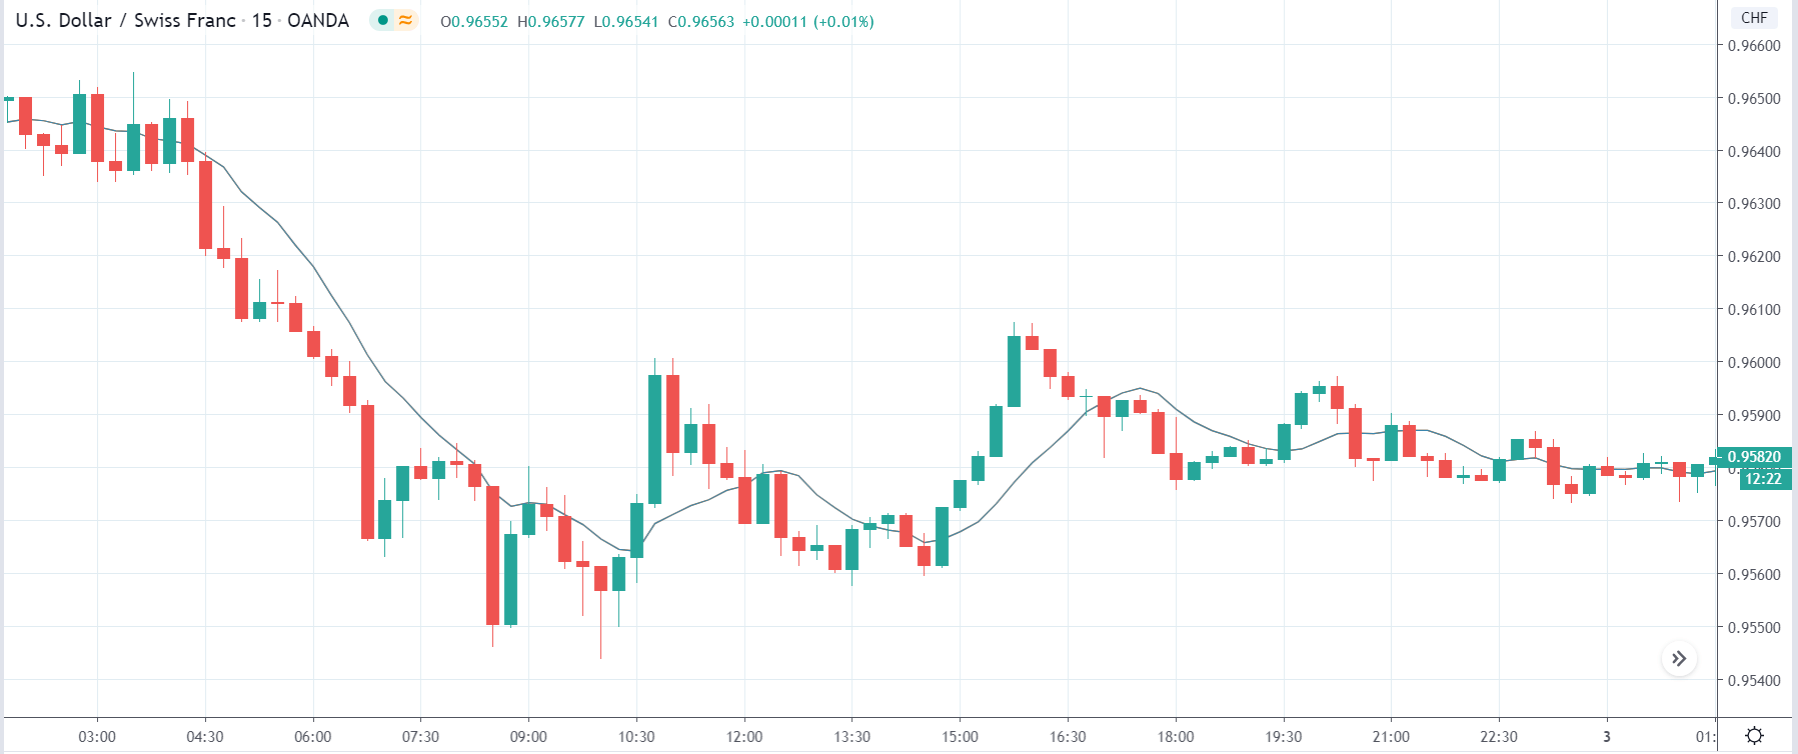
Let us start with the USD/JPY currency pair in order to analyze the impact of GDP on the Swiss Franc. In the above Forex price chart, we see that the overall trend of the market is down where recently the price is moving in a ‘range.’ After the occurrence of a trend continuation pattern, a ‘sell’ trade can be taken with less risk. Conservative traders should wait for news releases and trade after the volatility settles down.
USD/CHF | After the announcement
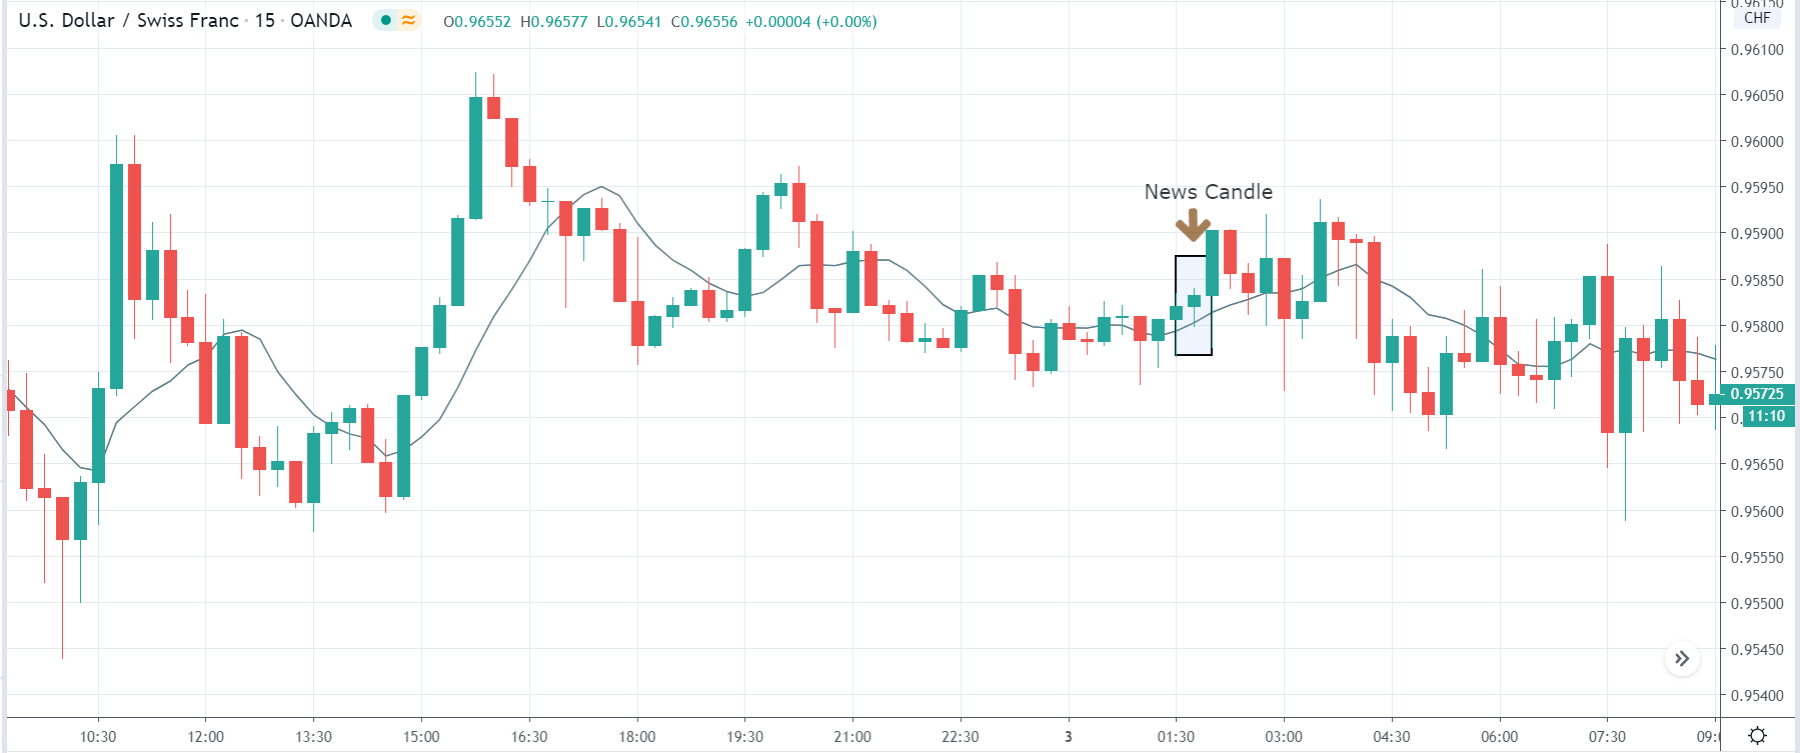
After the news announcement, the price marginally increases that takes the market higher by just a few pips. We can argue that the GDP data had the least impact on the currency pair and did not induce any volatility in the market. As the data was as expected, it did not turn the market downside, and it moves as usual.
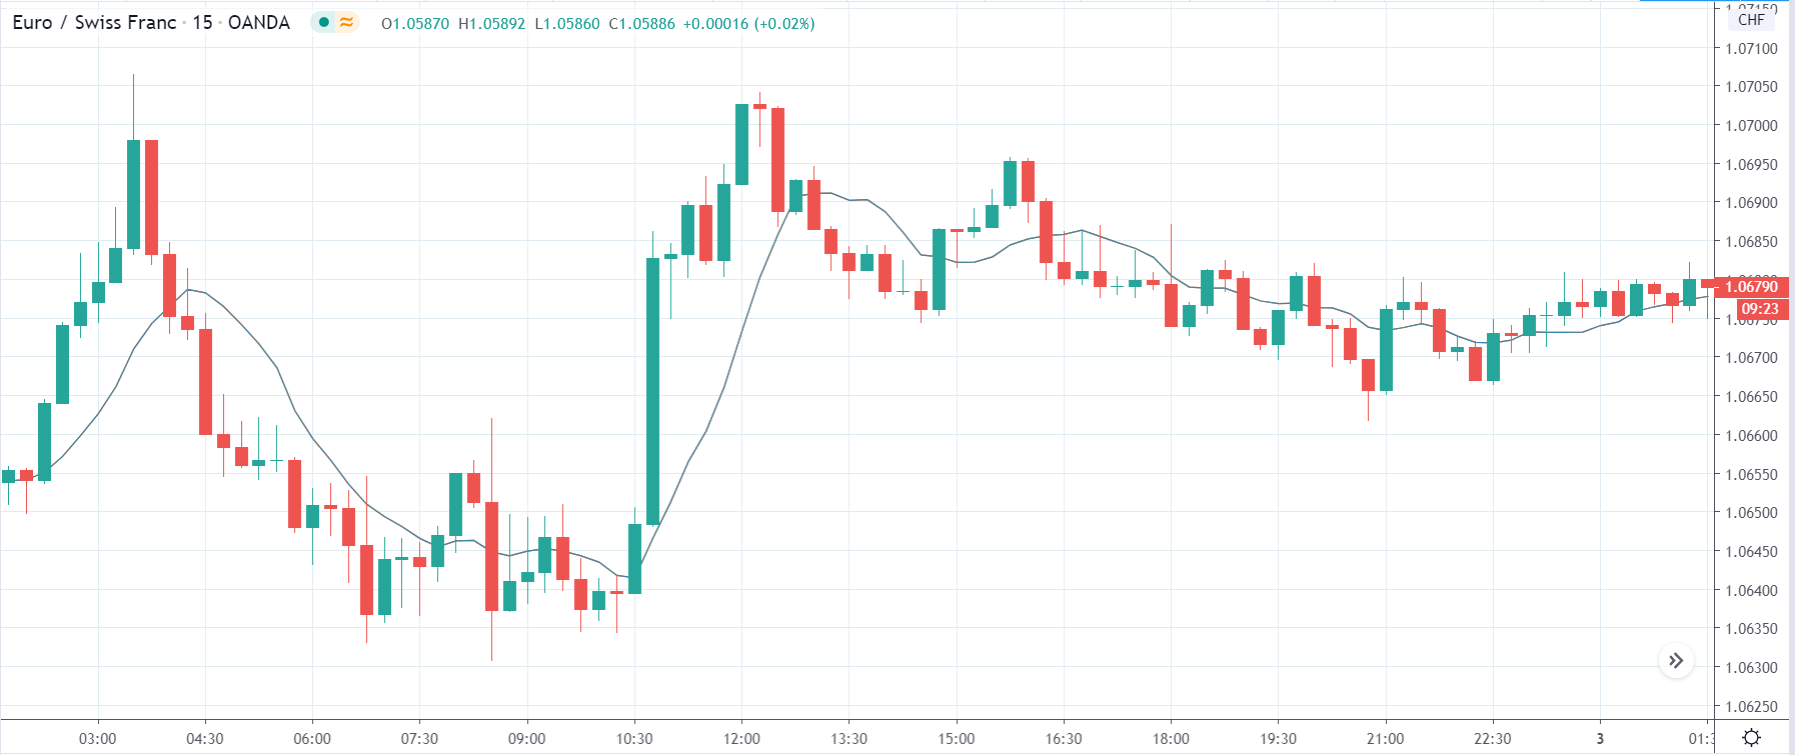
EUR/CHF | Before the announcement
EUR/CHF | After the announcement

The above images represent the EUR/CHF currency pair, it is clear that before the news release, the market is in an uptrend, and few minutes before the release, the price has been moving within a ‘range.’ This means the news event could either result in a continuation of the trend or a reversal of the trend.
Hence it is recommended to wait for the news announcement to watch the impact it makes on the price chart. After the news announcement, there is a slight increase in volatility to the downside after the close of news candle resulting in strengthening of the Swiss Franc. However, the ‘news candle’ itself appears to be impact-less, where there is hardly any change in price during the announcement.
NZD/CHF | Before the announcement

NZD/CHF | After the announcement
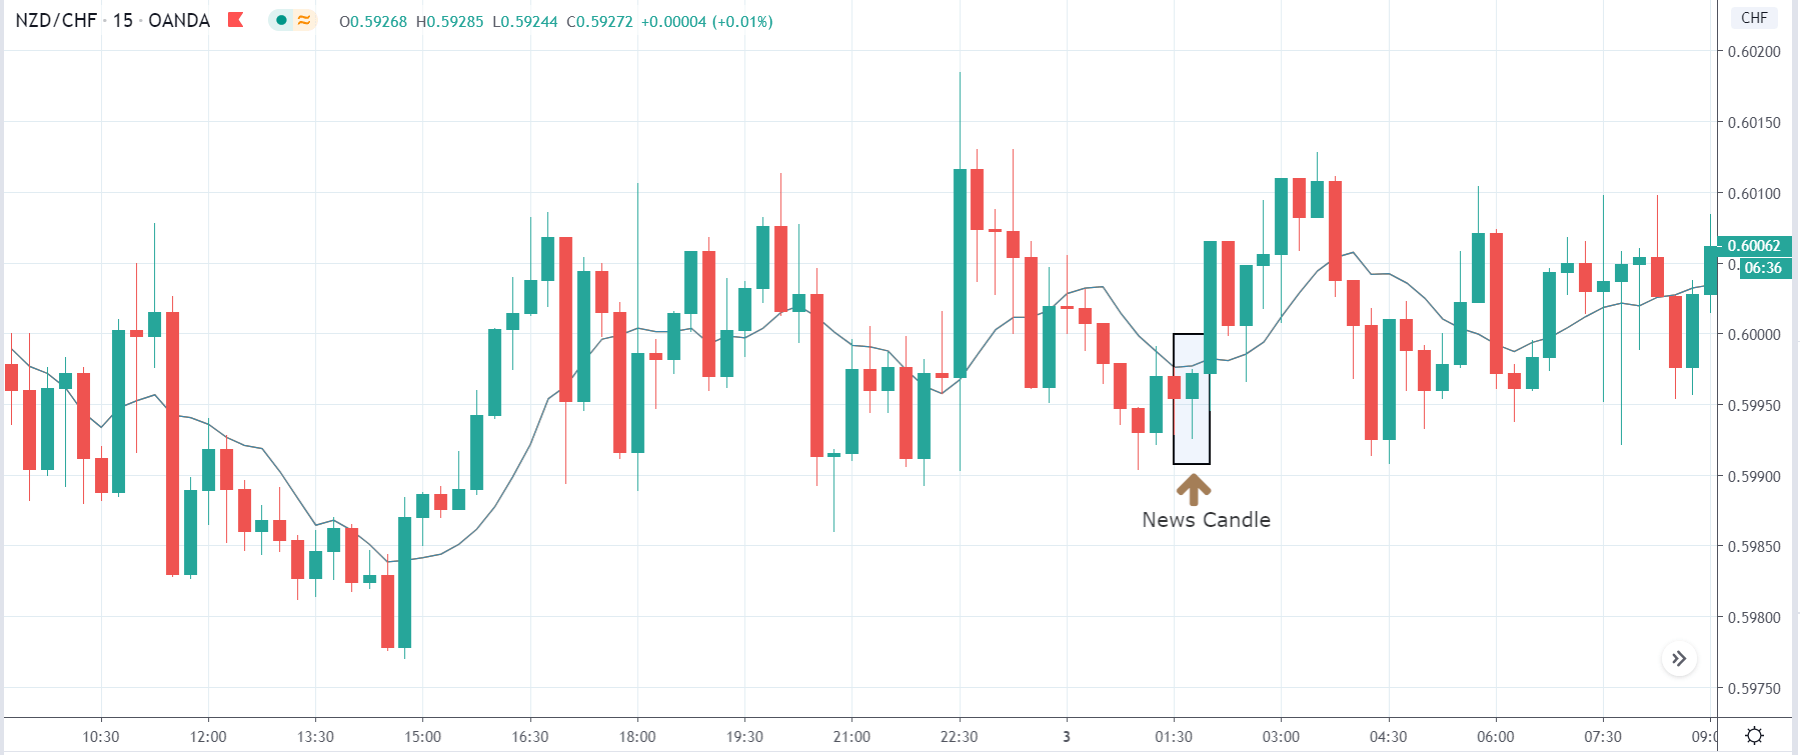
The above images are related to the NZD/CHF currency pair, where we see that the market is moving sideways before the news announcement. Just before the release, the price is close to the bottom of the ‘range.’ As the impact of these numbers is less, aggressive traders can take ‘long’ positions when technically the location is supporting for a ‘buy.’
After the news announcement, the market moves higher, and there is an increase in volatility to the upside. Since the GDP was not extremely bullish or bearish, the market did not react violently to the news release. Therefore, in such times we need to look at the charts from a technical angle. All the best!