Categories
Forex Fundamental Analysis

GDP from Construction – Exploring The Fundamental Forex Driver

Introduction

Construction is the very first phase of an expected economic growth, which is more evident in the developing economies compared to the developed economies. New buildings, infrastructures, renovations are an indication of an expanding economy. GDP from construction is an important economic indicator to assess financial health and future economic expansion trends.

Construction

It is a part of the Secondary (Industry) Sector of an economy.  Construction refers to building and infrastructure works in all areas. The Construction Sector includes all physical making of infrastructures like bridges, transportation systems (roads, railways), dams, irrigation systems, naval ports, airports, pipelines, apartments, buildings, houses, commercial buildings, corporate structures, etc.

How can the GDP from Construction numbers be used for analysis?

The Construction Industry’s Economic Output is a significant economic indicator that is closely watched by both the private and public sectors. It is especially crucial for developing economies like China, as it is their main contributor to GDP. The GDP from Construction figures assist Central Authorities in policy reforms & economic-decisions.

Growth is essentially a process of invention of new things and discarding the old inefficient ones. Construction, in this sense, is nothing but that. It involves the erection of new buildings, renovations, expansions of the infrastructures that are currently existing. Increased GDP from Construction involves more people getting employed, better wages in the sector, and the extra demand for raw materials, etc. Hence we can say that the act of construction itself has a ripple effect on the economy.

Secondly, the GDP from the construction of corporate infrastructures or commercial structures implies that the constructed structures will be used for further economic activities. For example, a company doubling its company size is planning to double its staff and correspondingly the business that it generates. Hence, GDP from Construction figures improvement is indicative of an improvement in many other sectors.

All these improvements correlated with GDP overall also stimulate consumer confidence and encourages consumer spending, which further stimulates the economy and boosts growth. The Secondary Sector is composed of Industrial Output and Construction Output. For most countries, Industrial Output will be the dominant contributor to the GDP from the Secondary Sector.

We analyze GDP from Construction to understand the associated implications that more economic growth will be followed. For example, the construction of new power plants, or manufacturing industries, would show higher GDP from Construction this year. But the subsequent years, we will see higher GDP due to the newly added Industrial Outputs.

Hence, GDP from Construction figures can be used to assess future economic growth. Everything that is constructed is most likely to bring revenue through its usage in the future. Hence, GDP from Construction improvements can be a leading indicator for further improvements in GDP down the line.

The global Construction Industry makes up 13% of the World GDP, which is more than the Agriculture sector, which is about 7% of the World GDP. It means, overall, the global economy is improving at a rapid pace, with the Industrialization of many economies. It is forecasted to grow to 15% in 2020. China, India, and Japan are flourishing in this era with rapid Industrialization and achieving high GDP Growth Rates ranging from 5-20% in recent years.

GDP from construction can be used by investors to know which countries are transitioning from Developing Economies to Developed Economies. As GDP from Construction increases, it would be followed by GDP growth through increased Industrialization. Further down the line, the economies would transition to the services Sector as their main contributor to GDP.

Impact on Currency

The GDP from Construction is not a high impact indicator when compared to measures like GDP and GDP Growth Rates. GDP from construction does not portray the entire picture of the economy. However, it can be an essential tool for the Central Authorities to keep track of Construction Sector performance and its relative implications over the economy.

What construction is occurring can also serve as an indication of the economy type going to be built over the coming years. But, for the international currency markets, it does not serve as a useful indicator. It is a proportional and lagging indicator. Higher GDP from Construction is great for the economy and its corresponding currency, and vice-versa.

Sources of GDP from Construction

For the US, the corresponding reports are available here – GDP -BEA, GDP by Industry – BEA, and Construction – GDP. World Bank also maintains the Construction and Industrial Sector as a percentage of GDP on its official website, which can be found here – Industrial Sector (including construction) – World % of GDP. GDP from construction can also be found here – GDP Construction – World – Trading Economics.

GDP from Construction Announcement – Impact due to news release

The construction sector is one of the fastest-growing sectors today that has a great impact on the economy of any nation. Construction is one crucial sector that contributes to the economic growth of a country. The government and other regulatory authorities have always shown interest in this segment by investing significantly in various parts of the sector. Naturally, it will contribute to the GDP of a country and influence the reading released quarterly and monthly. When talking about the fundamental analysis of a currency or stock, investors make investment decisions based on the GDP and not on contributions made by individual sectors.

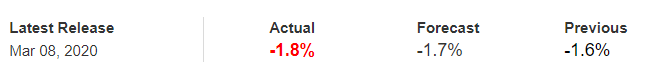
Now let’s analyze the impact of GDP on different pairs and witness the change in volatility due to the news release. For this purpose, we have gathered the latest GDP data of Japan, where the below image shows the fourth quarter’s GDP data released in March.

AUD/JPYBefore the announcement

We will first look at the AUD/JPY currency pair to observe the impact of GDP announcement on the Japanese Yen. In the above picture, we see the market has crashed lower due to some other news release, and currently, the price is at its lowest point. This means there is a great amount of selling pressure in the market, or sellers are dominant. In such a market situation, it is advised not to carry any position in the market before the news release.

AUD/JPY | After the announcement

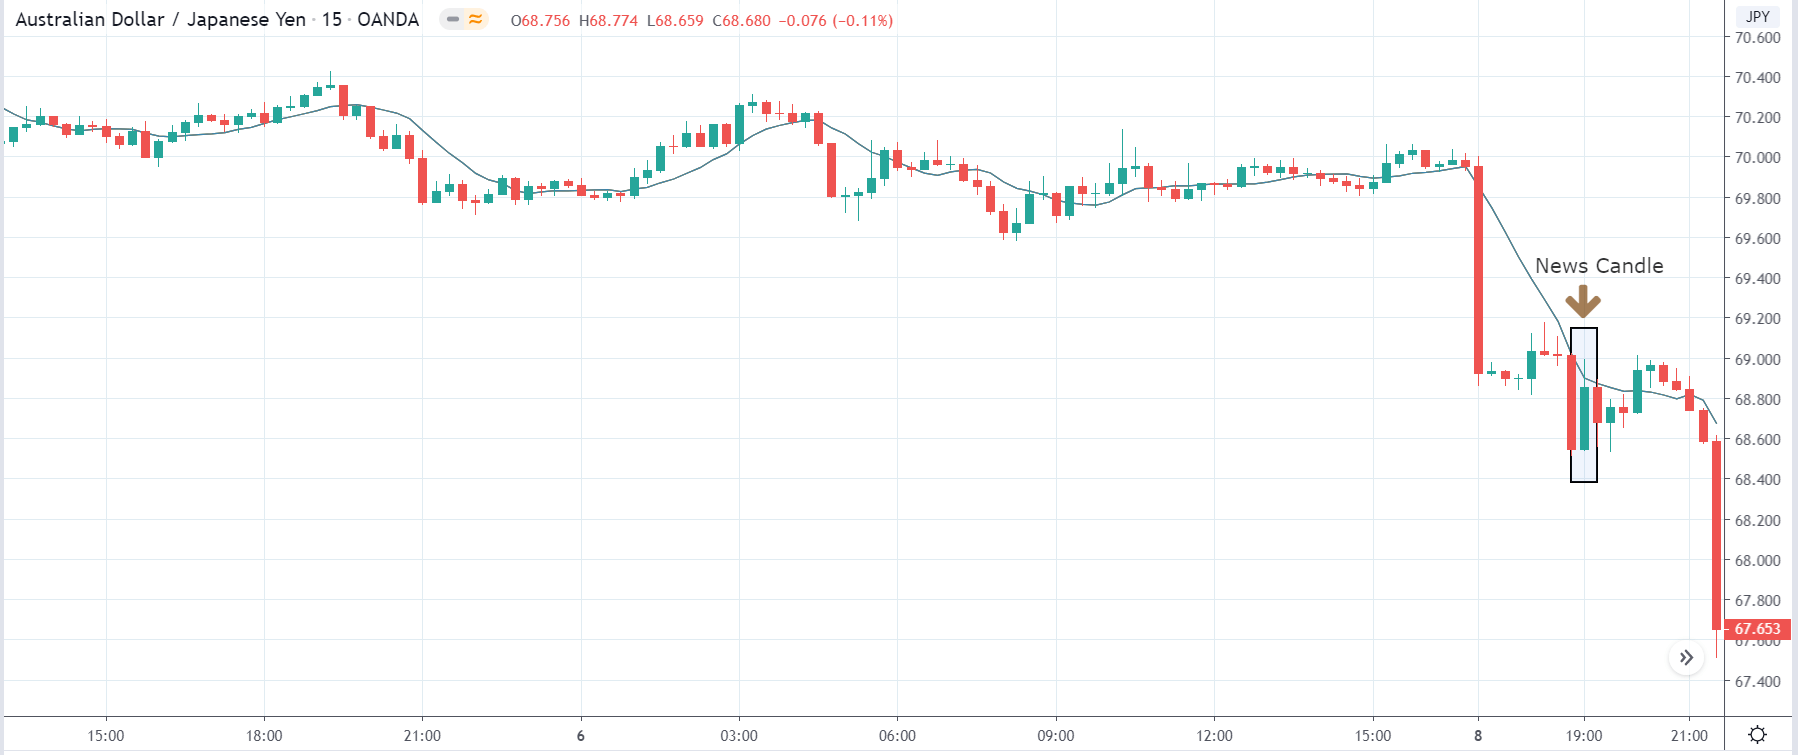
After the news announcement, the price sharply moves higher and closes as a long bullish candle. This means traders sold Japanese Yen soon after the news release as it was below expectations and lower than the previous quarter. The volatility did increase to the upside for a while, but it did not sustain as the Japanese Yen was showing a lot of strength. One should trade after the market shows signs of trend continuation or reversal and not just based on the GDP data.

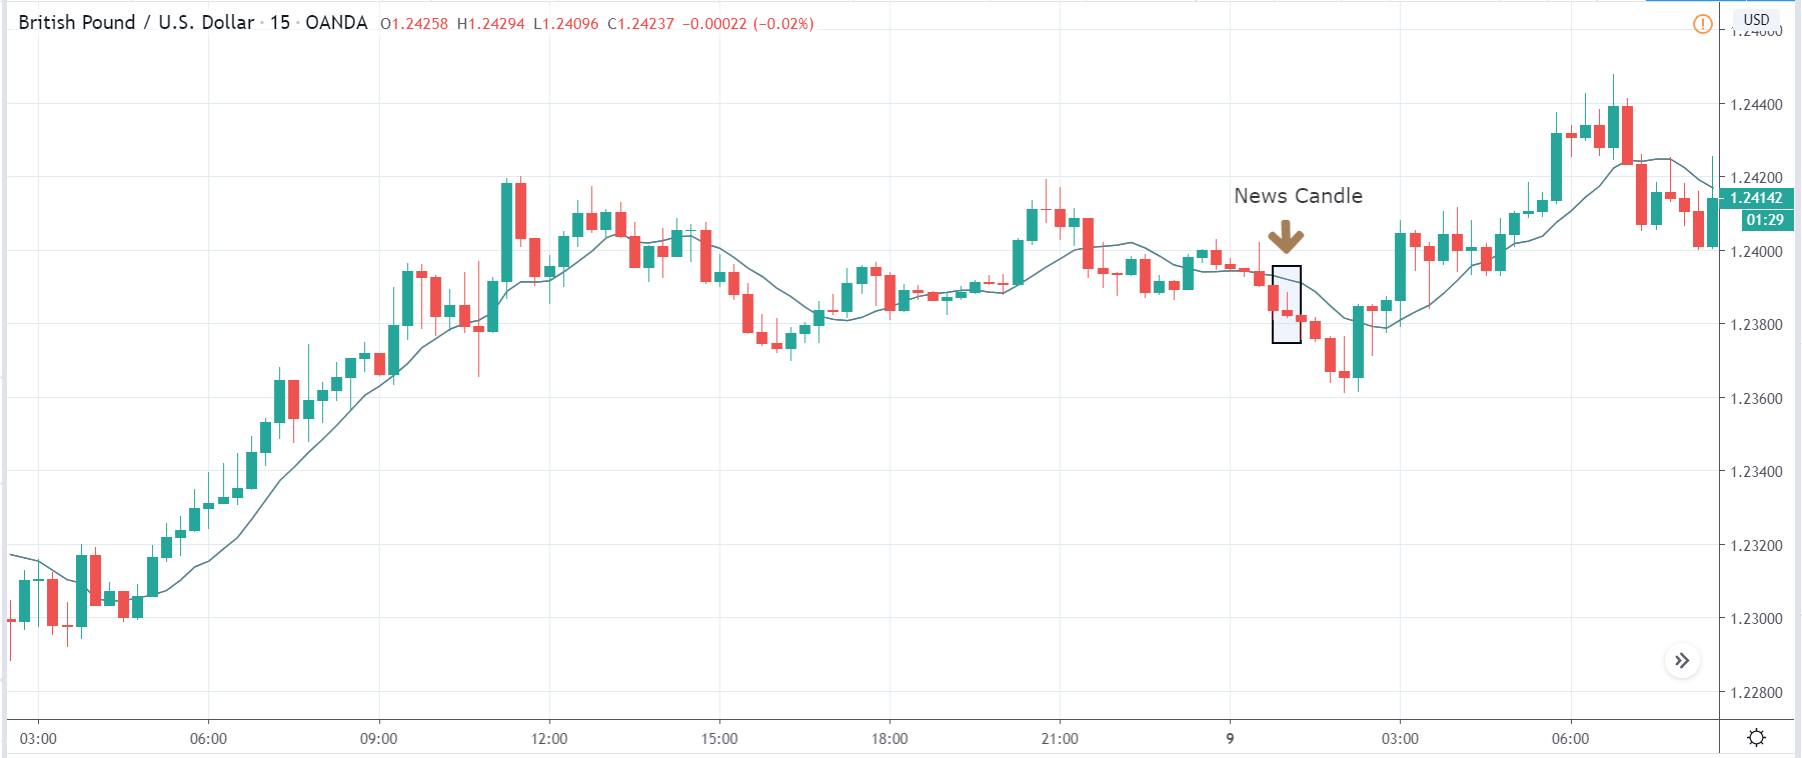
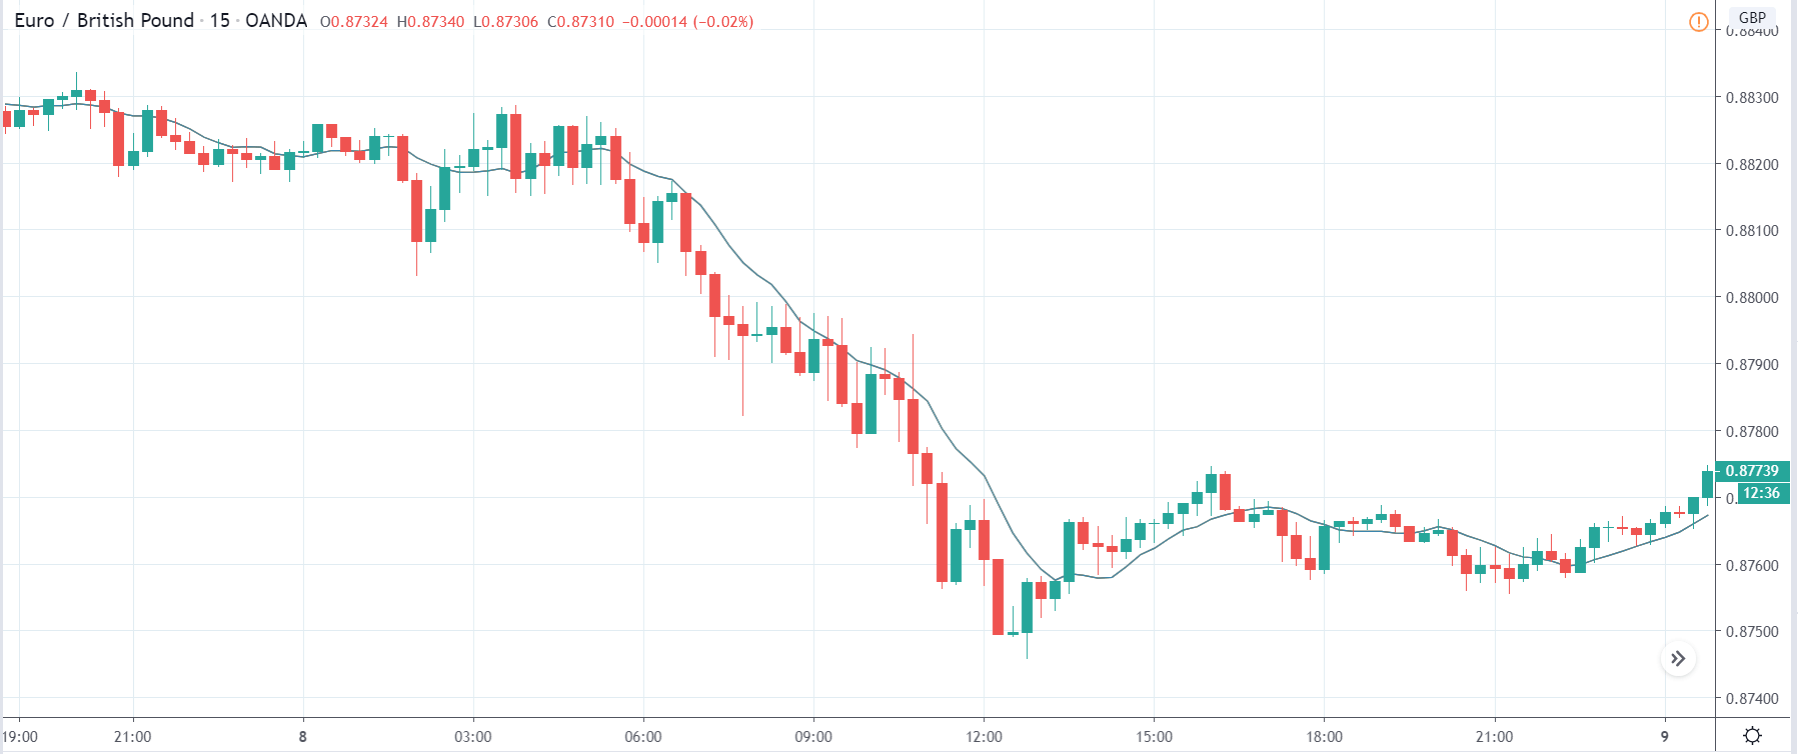
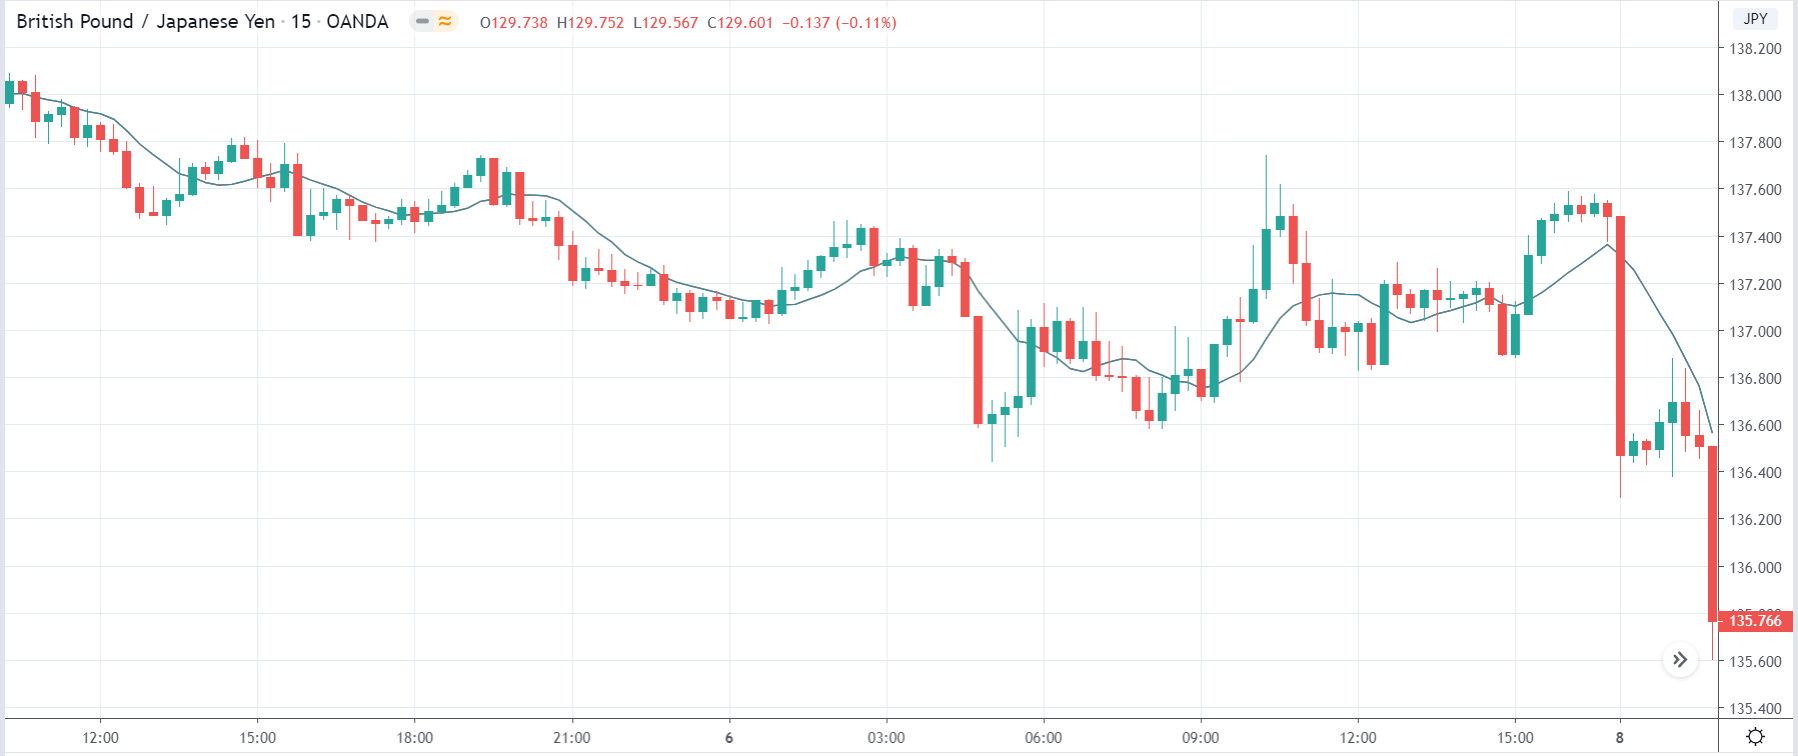
GBP/JPY | Before the announcement

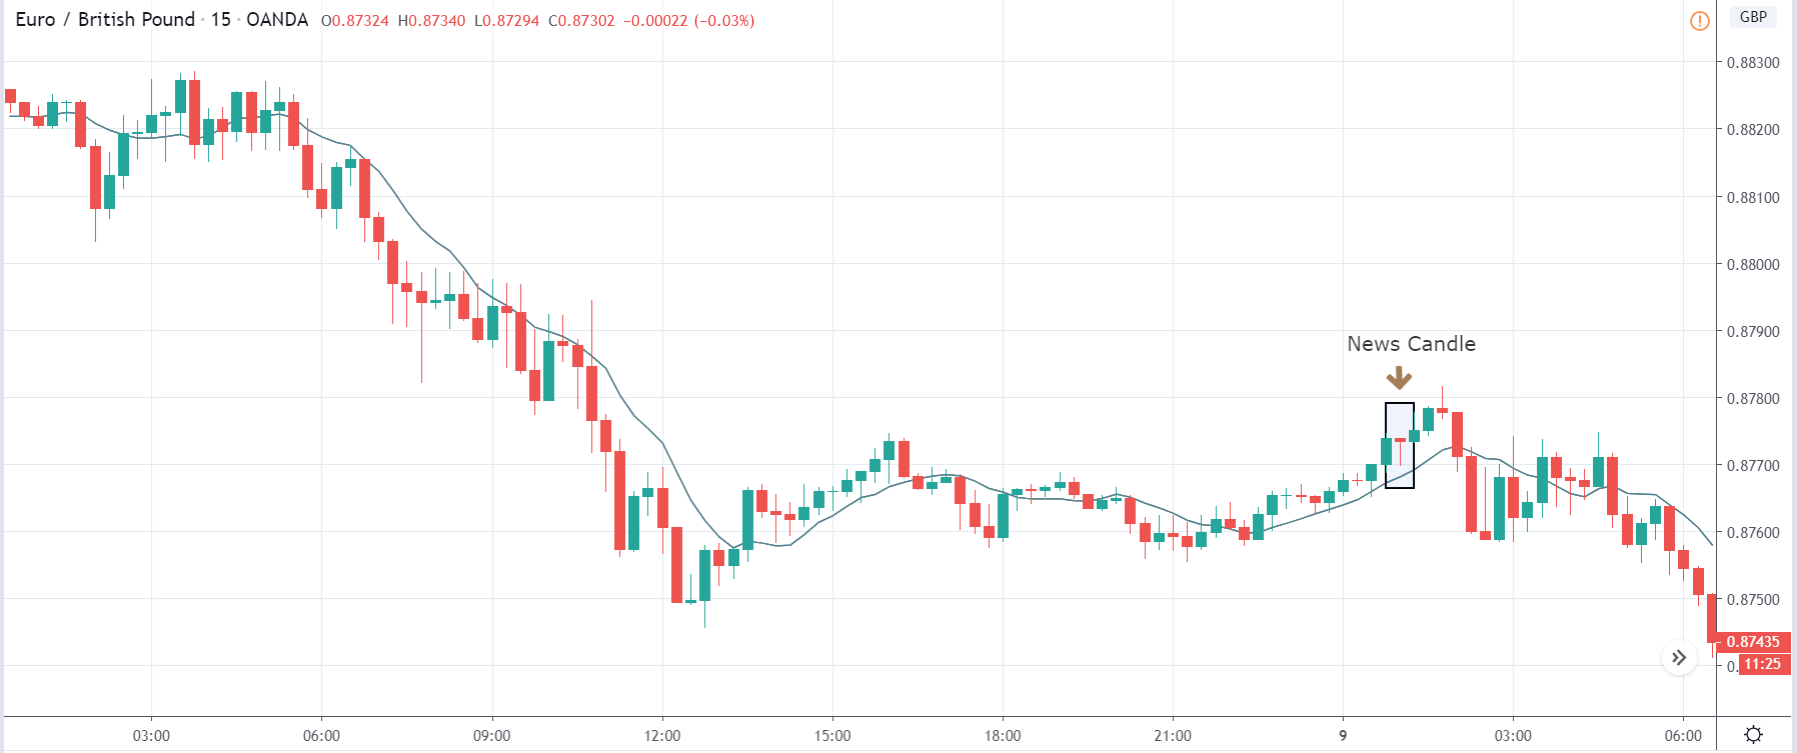
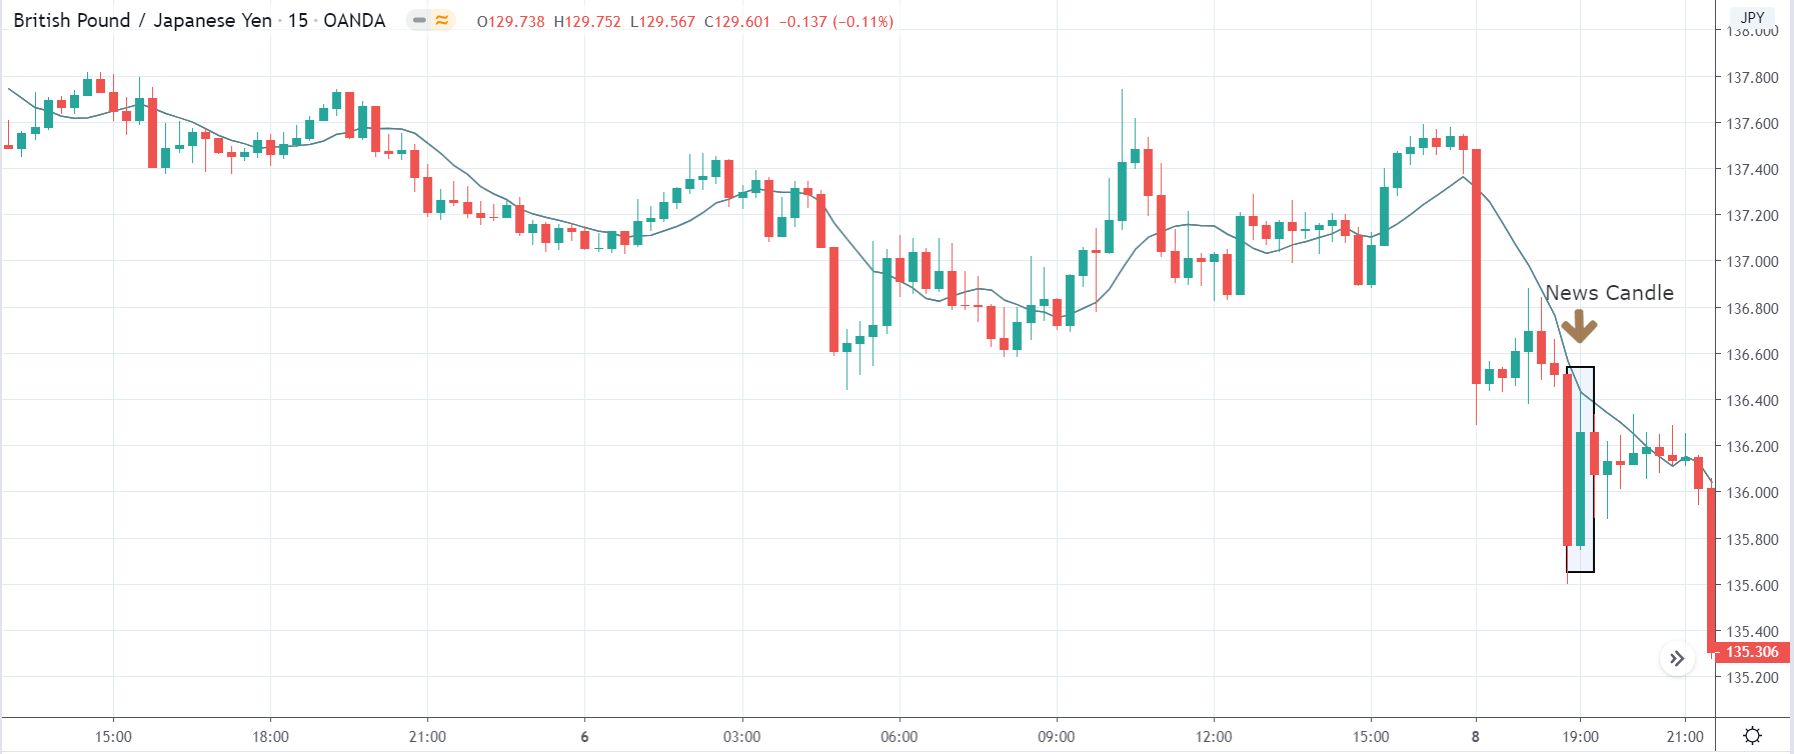
GBP/JPY | After the announcement

The above images represent the GBP/JPY currency pair, where we see that the market has strongly moved lower as indicated by two big bearish candles before the news announcement. This means the Japanese Yen has gotten strong recently due to some other fundamental reason, and we cannot ascertain if this will continue or not. As volatility is very high, one should not take a position in the currency before the news release.

After the news announcement, volatility spikes to the upside, and the ‘news candle’ closes with a great amount of bullishness. Even though the price moves higher by a lot, it did not go above the moving average. The market has reacted adversely to the news announcement as the GDP was lower than last time and also below what was forecasted. If the price does cross moving average, this means the downtrend is still intact.

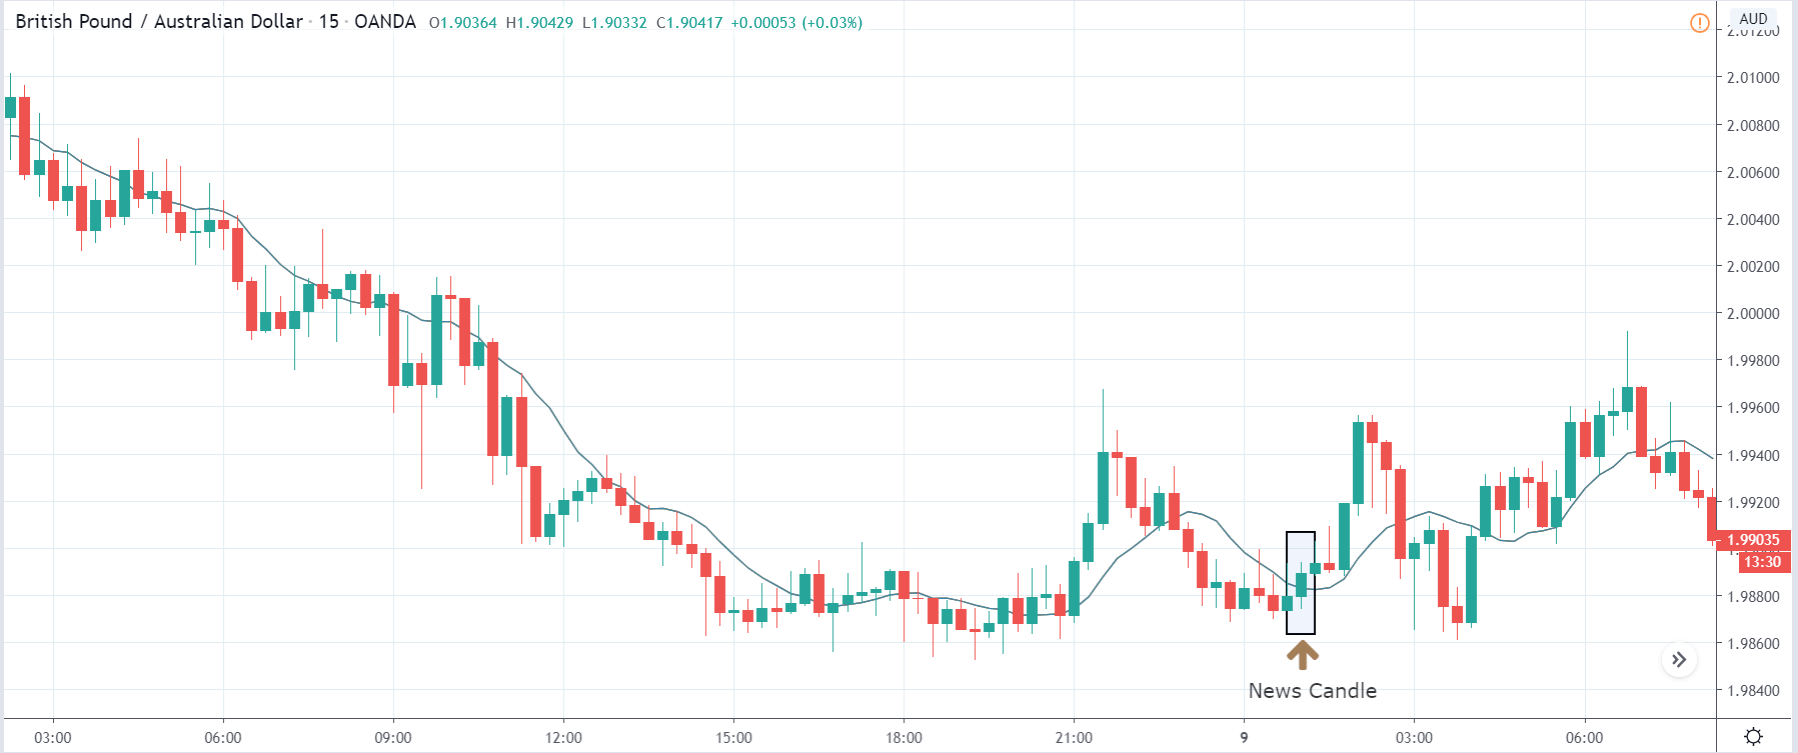
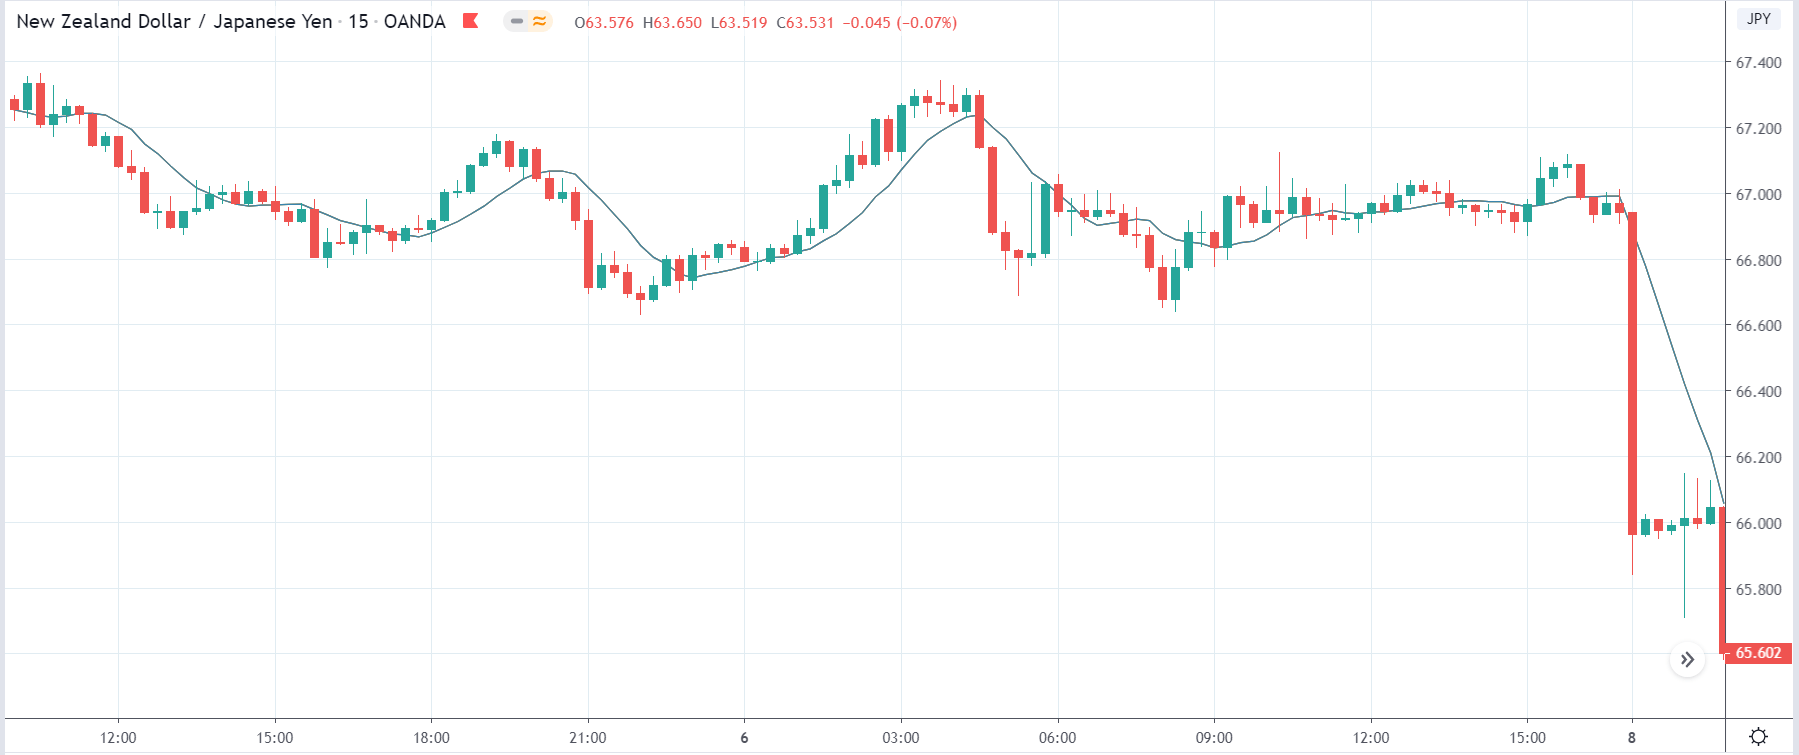
NZD/JPY | Before the announcement

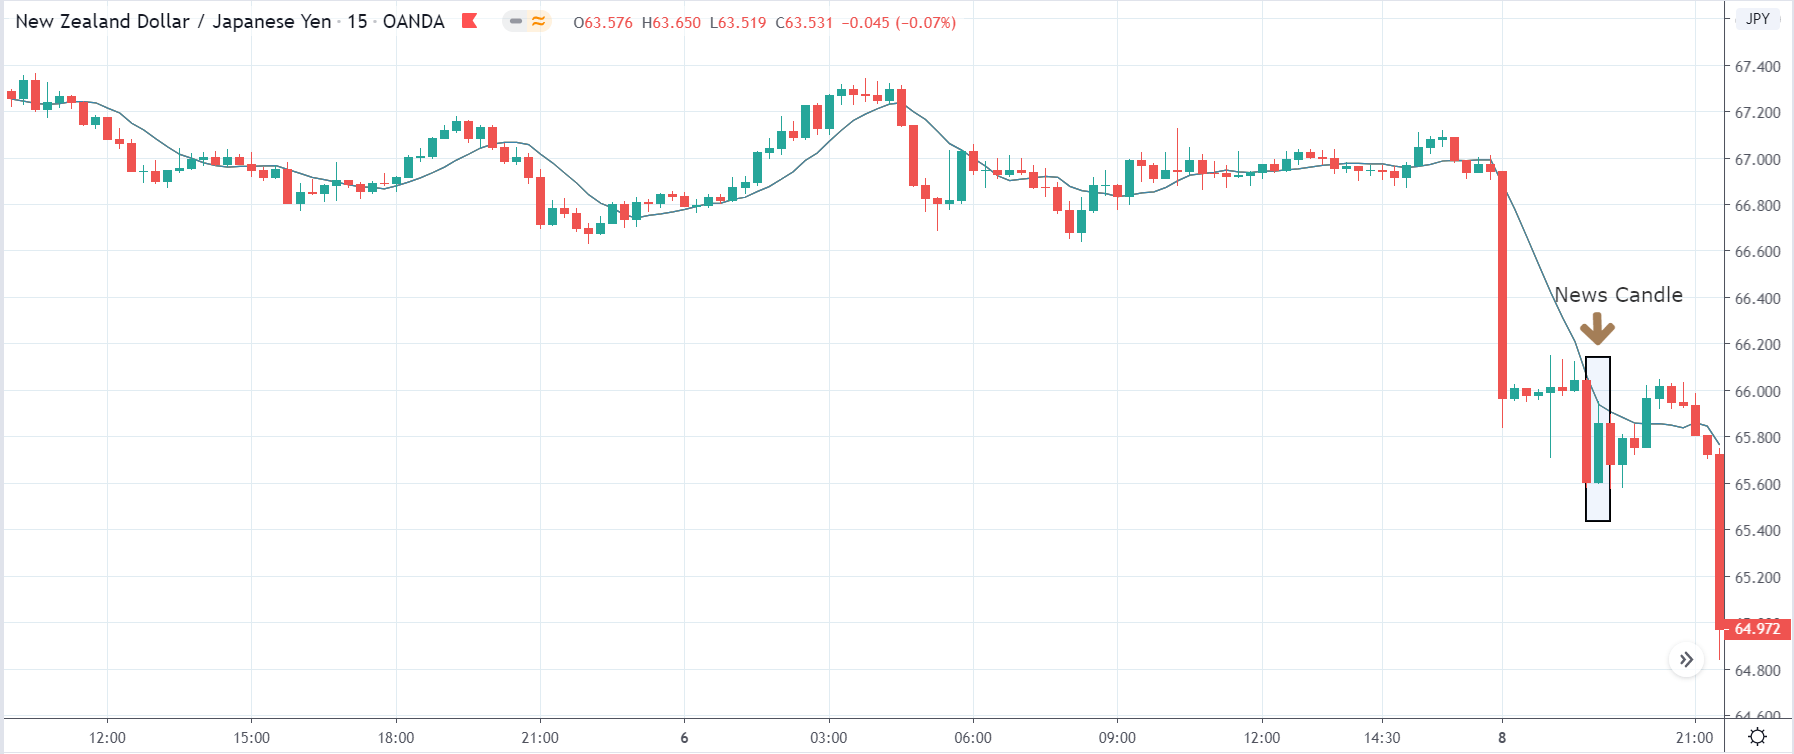
NZD/JPY | After the announcement

The above pictures are that of the NZD/JPY currency pair, where we see a major crash in the market before the news announcement, which is visible in the first image. This pair also shows similar characteristics as in the above currency pairs, where the Japanese Yen has strengthened greatly. Ideally, we should be looking to sell the currency pair after a suitable price retracement.

After the news announcement, the market goes higher so much that it almost retraces the previous bearish candle, resulting in some weakness in the Japanese Yen. As the GDP data was weak, it brought disappointment in the market where traders sold the Japanese Yen and bought the base currency. Cheers!

Categories
Forex Daily Topic Forex Fundamental Analysis

Importance Of ‘Construction Output’ As An Economic Indicator

Introduction

Construction activity is the beginning phase of an expected economic growth, which is more vividly evident in the developing economies than developed economies. New infrastructures, buildings, renovations are all part of an expanding economy. Construction is an important economic indicator to assess economic health.

What is Construction Output?

Construction Output is the measure of building and civil engineering work in monetary terms. It is the amount of construction work done measured as the money charged to the customers. It refers to the construction work performed by an enterprise whose principal activity is classified as Construction. Since a measure of the amount of work is proportional to fees charged for the activity, it is measured in the domestic currency of the region where the construction activity was undertaken.

Overall, Construction Output is a measure of the amount charged to customers for construction activity by construction companies in a specific period ( monthly, quarterly, annually). The UK Construction Output is based on a sample survey of 8,000 businesses employing over 100 people or having an annual turn over greater than 60 million sterling pounds. The Construction Output excludes the Value Added Tax (VAT) and payments to subcontractors.

The Construction Output data reporting based on sectors, new or existing renovations, seasonal adjustments, volume, value-based, etc. precisely as illustrated for reference below:

(Picture Credits – Ons.gov)

The Construction Output data is also reported in the index format, where the base index period is 2016, for which the score is 100, and subsequent reports would be scored in comparison to this index period. Typically, it is widely discussed in terms of percentage changes concerning the previous month.

How can the Construction Output numbers be used for analysis?

The Construction Output is a significant economic indicator in the United Kingdom, that is closely watched by both private and public sectors, especially by the Bank of England and HM Treasury. The Construction Output figures assist them in policy reforms and economic-decisions. Growth is a process of emergence of new and better things and discarding old inefficient ones. Construction, in this sense, is just that. Construction involves the erection of new buildings, infrastructures, renovations, expansions of existing infrastructures.

Increased Construction Output implies more people employed, better wages in the construction sector, more demand for raw materials for the Construction, etc. The very act of Construction has a ripple effect on the economy.

Secondly, the Construction of corporate infrastructures or commercial structures implies that these buildings will be used for further economic activities. For example, a company doubling its company size is planning to double its staff and correspondingly the business that it generates. Hence, Construction Output figures improvement is indicative of an improvement in many other sectors.

All these improvements correlated with Construction Output also stimulate consumer confidence and encourages consumer spending, which further stimulates the economy and boosts growth. The importance of Construction Output is also evident from the fact that it is taken into account for the compilation of the GDP monthly estimate.

New Orders in the Construction Industry

It is a quarterly report produced by the administrative data provided by the Barbour ABI. Construction Output data reflects immediate short term health of the economy as it accounts for the construction work that has already taken place. Whereas, the New Orders report from the ONS provides more a forward-looking estimate of the potential construction activity in Great Britain.

New Orders are also crucial in gaining insight into the upcoming economic trends. Hence, it is advisable to use the New Orders report in conjunction with Construction Output report data to assess current and ongoing economic trends more precisely. It is a quarterly report. It is also presented as an index report for which the base index period is 2016, i.e., the New Orders score for 2016 is 100, and all subsequent reports are reported in comparison to this index value.

Impact on Currency

The Construction Output is a coincident indicator in the short-run. Still, it can also be used to gauge upcoming economic trends based on the type of Construction Activities are being undertaken. Also, if we take the New Orders report, both together can act as a leading economic indicator.

Construction Output reflects the current economic conditions by showing the value of the Construction Activity that has already taken place every month.  It is a proportional economic indicator, meaning an increase in Construction Output figures is good for the economy and correspondingly for the currency and vice-versa.

Economic Reports

The Construction Output reports are published approximately six weeks after the reference month by the Office for National Statistics (ONS) on its official website.

Monthly Construction Output reports go back to 2010 for the United Kingdom. A derived data set going back to 1997 can be obtained from monthly GDP data sets. The Construction Output reports are available in seasonally adjusted and unadjusted formats, and at current prices and chained volume measures (excludes effects of inflation).

For the United States, the Bureau of Economic Analysis releases GDP by Industry quarterly and annual estimates, which serves as a close or relatable statistic for the Construction Output of the United Kingdom. As such, there is no Construction Output dedicated nationwide statistics in the United States. Hence, GDP by Sector analysis helps us to analyze the Construction Industry’s performance in the United States.

Sources of Construction Output

We can find the latest Construction Output statistics for the United Kingdom can be found below.

For the United States – Gross Output of Private Industries: Construction

Construction Output reports for various countries are available here.

Impact of the ‘Construction Output’ news release on the price charts

By now, we believe that you have understood the significance of Construction Output in an economy, which essentially includes construction work done by enterprises that are used for measuring the growth of the construction sector. It gives an insight into the supply on the housing and construction market. The Construction industry is one of the first to go into recession when the economy declines but also to recover as conditions improve. The Construction Sector has a marginal influence on the GDP of an economy. Thus, investors do not give a lot of importance to the data when it comes to the fundamental analysis of a currency.

In today’s illustration, we will explore the impact of the Construction Output news announcement on different currency pairs and compare the change in volatility. The below image shows the previous, forecasted, and latest data of the United Kingdom, where we see a reduction in total output in the month of March. Let us look at how the market reacted to this data.

GBP/USD | Before the announcement:

The first pair we will look into is the GBP/USD currency pair, where the above image shows the characteristics of the pair before the news announcement. The market is in a strong uptrend and has started moving in a range with the price at the bottom of the range at the moment. Thus, we can expect buyers to show up any time from this point. As economists are expecting healthier Construction Output data, traders can take a ‘long’ position with a strict stop loss below the ‘support.’

GBP/USD | After the announcement:

After the news announcement, the market drops slightly owing to weak Construction Output data, and the volatility is seen to increase on the downside. But since the impact of this news release is less, the effect will not last long on the currency pair, and we cannot expect the market to break key technical levels. This is why the price reacts strongly from the ‘support’ and bounces off. Traders need to analyze the pair technically and trade accordingly.

GBP/AUD | Before the announcement:

GBP/AUD | After the announcement:

The above images represent the GBP/AUD currency pair, where we see that before the news is announced, the market was in a strong downtrend indicating a great amount of weakness in the British Pound. Currently, we can say that the price in the ‘demand’ area and thus we can expect bullish pressure to come back in the market at any moment. It is not recommended to buy the currency pair as the downtrend is dominant, and there are no signs of reversal.

After the news announcement, the price quickly moves up and closes as a bullish candle. In this pair, the Construction Output data get an opposite reaction from the market where the volatility increases to the upside soon after the announcement. Traders can take a ‘short’ position in the market after a suitable price retracement to a key technical level.

EUR/GBP | Before the announcement:

EUR/GBP | After the announcement:

The above charts belong to the EUR/GBP currency pair, where we see that the market is in an overall downtrend before the announcement, and currently, the price is in a retracement mode. Since the British Pound is on the right-hand side of the pair, a down-trending market means the currency is extremely strong. Looking at the price action, we can say that the downtrend will continue and now we need to find the right place to enter the market.

After the news announcement, the price initially goes lower, but the currency gets immediately bought into, and volatility increases to the upside. This was a result of poor Construction Output data were traders bought the currency pair by selling British Pound. As the impact is least, the up move does not sustain, and the downtrend continues.

That’s about ‘Construction Output’ and the impact on its news release on the Forex price charts. Shoot your questions in the comments below, and we would be happy to answer them. Cheers!