
The cryptocurrency market spent most of its weekend consolidating, with only a couple of cryptocurrencies moving significantly. Bitcoin is currently trading for $11,817, which represents a decrease of 0.64% on the day. Meanwhile, Ethereum lost 1.27% on the day, while XRP lost 0.47%.


Daily Crypto Sector Heat Map
When talking about top100 cryptocurrencies, OMG Network gained 50.69% on the day, making it the most prominent daily gainer. Waves (26.69%) and Ren (24.74%) also did great. On the other hand, Quant lost 6.55%, making it the most prominent daily loser. It is followed by Divi’s loss of 5.80% and Ampleforth’s drop of 5.08%.
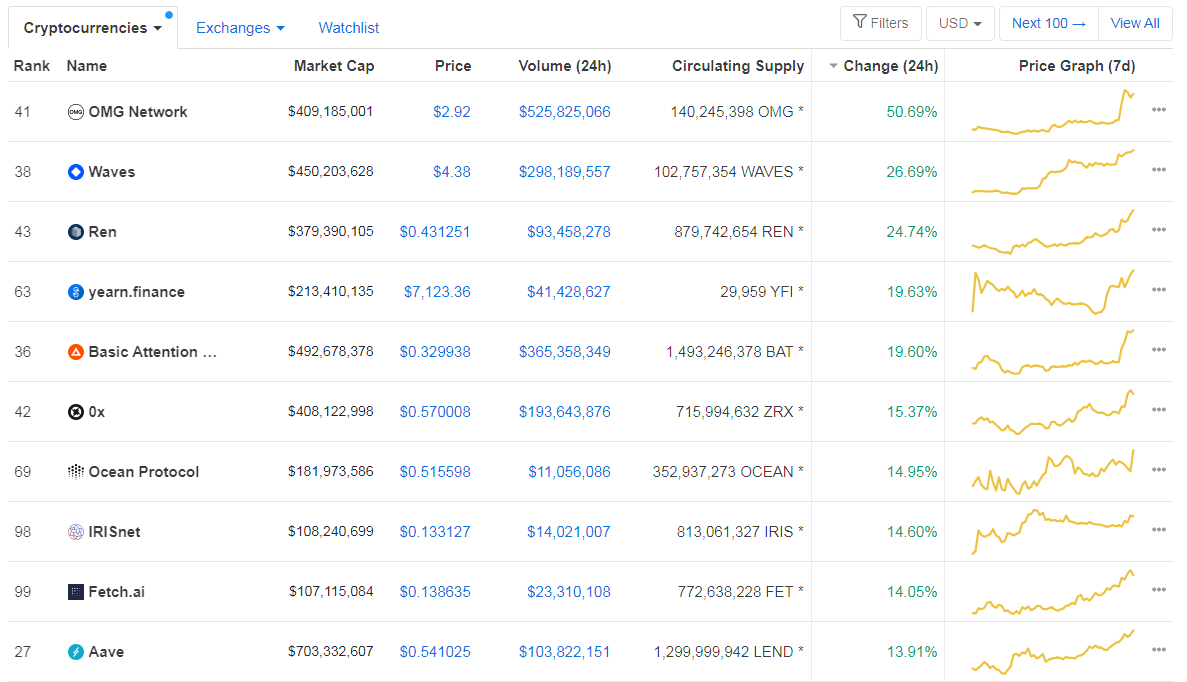
Top 10 24-hour Performers (Click to enlarge)
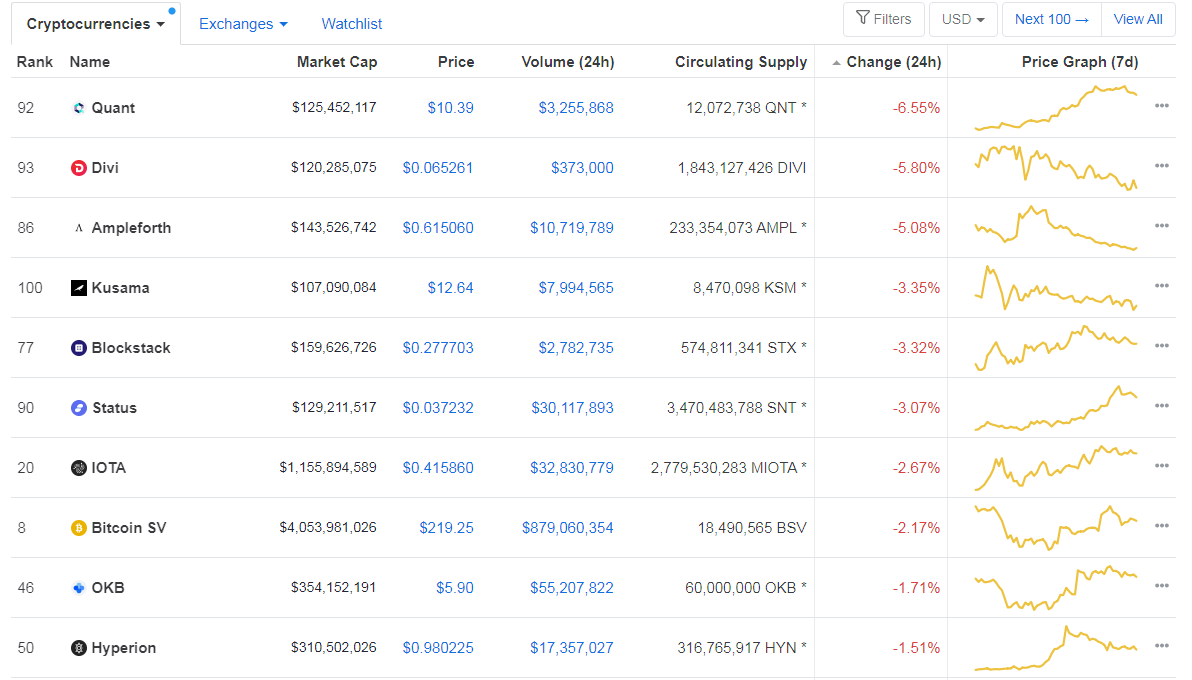
Bottom 10 24-hour Performers (Click to enlarge)
Bitcoin’s dominance level has decreased slightly and dropped under the 60% mark, with its value currently at 59.17%. This value represents a 0.91% difference to the downside when compared to our last report.
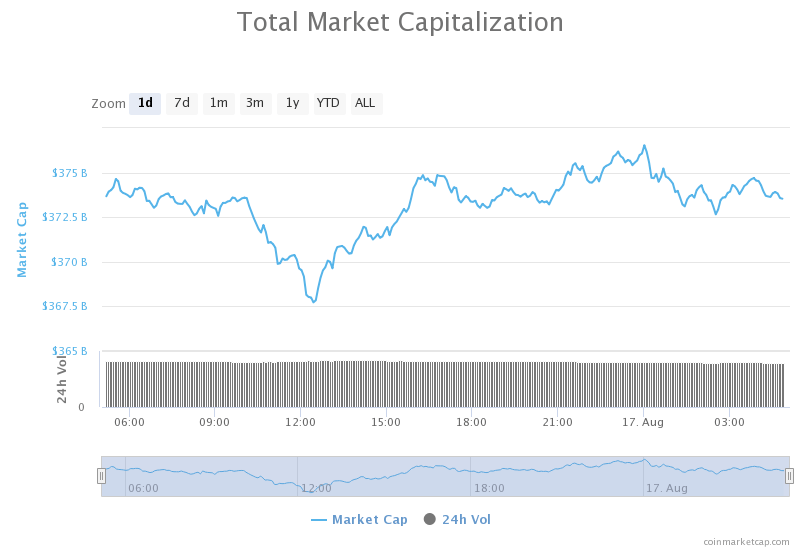
Daily Crypto Market Cap Chart
The cryptocurrency market cap experienced a slight increase in value over the weekend. Its current value is $373.40 billion, which represents an increase of $5.33 billion when compared to our previous report.
_______________________________________________________________________
What happened in the past 24 hours?
_______________________________________________________________________
- California Moves Forward With Digital Asset Bill (Cointelegraph)
- Bitcoin Hash Rate Hits Record Average High With $12K Price in Sight (Cointelegraph)
- Bitcoin’ Whale Clusters’ Show $14K as Pivotal for BTC Price Bull Run (Cointelegraph)
- Bitcoins Are Being Tokenized Faster Than They’re Mined as DeFi Craze Continues (Coindesk)
- US Post Office could turn to blockchain tech after Trump threatens “shutdown” (Cryptoslate)
- Bitcoin Derivatives Platform BitMEX Makes KYC Mandatory, Whales to Trade Elsewhere (Cryptobriefing)
- JPMorgan is Investing in Ethereum: ConsenSys Blockchain Conglomerate Raising $50M (Cryptobriefing)
- Curve becomes third DeFi protocol to hit $1 billion in total value locked (The Block)
- Binance saw the highest web traffic among other crypto exchanges in July (The Block)
- Aave becomes second DeFi protocol to hit $1 billion in total value locked (The Block)
_______________________________________________________________________
Technical analysis
_______________________________________________________________________
Bitcoin
Bitcoin was on a slightly upward slope over the course of the weekend, trying to reach $12,000 before attempting a strong push. The largest cryptocurrency by market cap saw good support in the 21-period moving average, which kept it on its path. The descending RSI and incredibly low volume indicate that the cryptocurrency will move very soon. Meanwhile, Bitcoin’s hashrate reached its new all-time high of 129 EH/s.
BTC traders should look for a trade when a volume spike happens.
BTC/USD 4-hour Chart
Technical factors:
- Price is above its 50-period EMA and its 21-period EMA
- Price is at its middle B.B
- RSI is neutral (52.88)
- Volume is decreasing (Low)
Key levels to the upside Key levels to the downside
1: $12,000 1: $11,630
2: $12,300 2: $11,460
3: $11,090
Ethereum
Unlike Bitcoin, Ethereum was not moving slow throughout the weekend. After breaking the $415 mark, Ethereum needed to consolidate above it and show strength, which it did. The second-largest cryptocurrency by market cap retested its support (successfully) and is now safely at the $425 mark.
Traders should look for a trade when ETH regains volume.
ETH/USD 4-hour Chart
Technical Factors:
- Price is currently above its 21-period and its 50-period EMA
- Price is above its top B.B.
- RSI is neutral (52.85)
- Volume is below average
Key levels to the upside Key levels to the downside
1: $445 1: $415
2: $496 2: $400
3: $361
Ripple
XRP spent its weekend consolidating between the $0.285 and $0.31 support and resistance levels. Low volatility, as well as volume, made XRP virtually untradeable over the course of the weekend. However, as much as XRP doesn’t seem like it doesn’t have the strength to push through $0.31 by itself (without Bitcoin moving first), the state it is currently in is still more bullish than bearish.
Traders can look for a trade after XRP increases its volume and heads towards $0.31.
XRP/USD 4-hour Chart
Technical factors:
- Price is currently above the 21-period and 50-period EMA
- Price is between its middle and top B.B.
- RSI is neutral (55.30)
- Low volume
Key levels to the upside Key levels to the downside
1: $0.31 1: $0.285
2: $0.32 2: $0.266
3: $0.245
Related posts
 Daily Crypto Review, July 15 – Fidelity Goes All-In On Bitcoin; BTC Difficulty At Historic Heights
 Daily Crypto Review, Nov 4 – Bitcoin Contesting $14,000; Crypto Sector in the Green
 Daily Crypto Review, Nov 9 – Bitcoin at $15,500; What Will Biden’s Win Bring to the Crypto Sector?
 Daily Crypto Review, Nov 17 – Bitcoin Crushes $16,500; XRP Explodes to the Upside
One reply on “Daily Crypto Review, August 17 – DeFi Craze Continues: More BTC Tokenized Than Mined”
Interesting the more it moves to tokens. Great to see