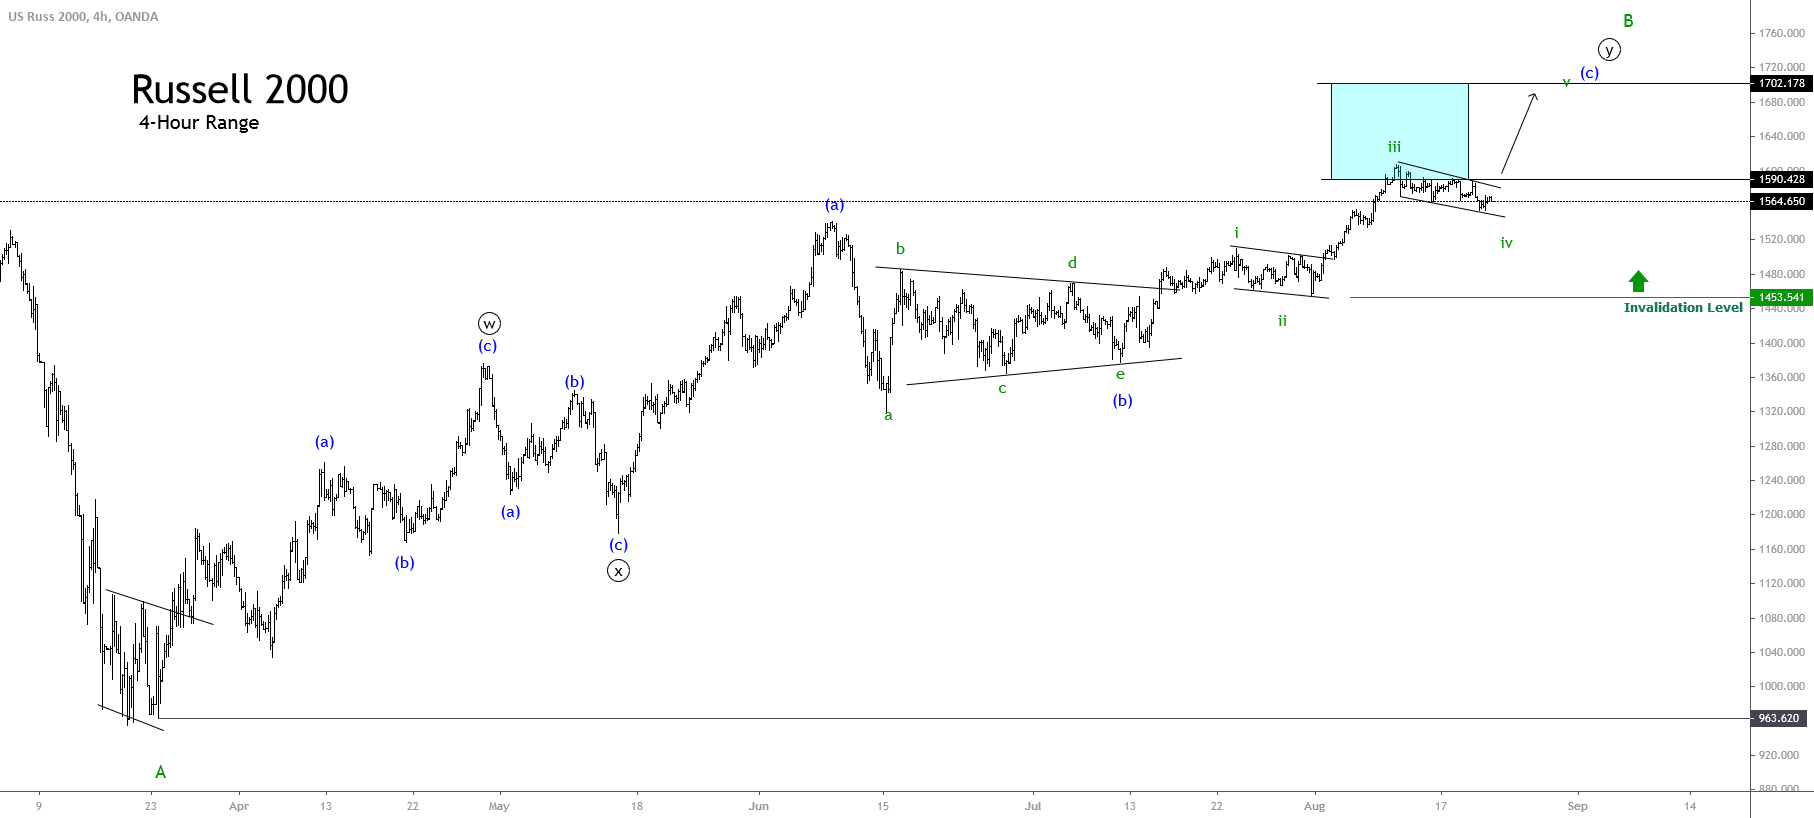
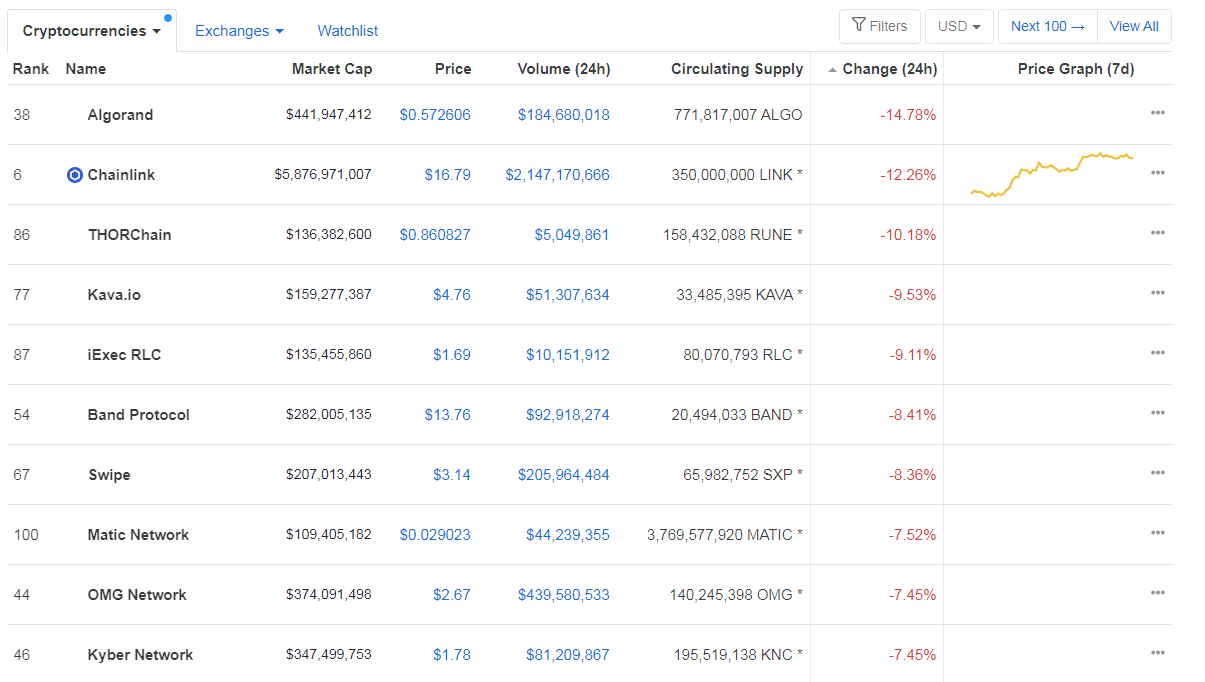
Categories
Forex Fundamental Analysis

Importance of ‘Lending Rate’ News Announcement on the Forex market

Introduction

The ease with which money can be obtained within a country primarily drives the business sector and consumer spending. Consumer Spending and Businesses mostly make up the GDP of a country. Hence, understanding Lending Rates and its impact on the economy can help us build our fundamental analysis better.

What is Lending Rate?

Lending Rate: The rate at which a bank or a financial institution charges its customers for lending money. It is the fee that is to be paid by the customer for the borrowed money. Bank Lending Rate, in general, is the Bank Prime Rate.

Bank Prime Rate: It is the rate of interest that banks charge their most creditworthy customers. It is the lowest interest rate at which banks generally gives out loans. On the receiving end usually are large corporations with a good track record with the concerned bank. Generally, the loans taken are also huge.

Other forms of loans like house mortgage, vehicle loans, or personal loans, are all either partly or wholly based on the prime rate. It is also important to note that the Central Bank’s interest rates set the bank lending rate. For the United States, the Federal Reserve’s, the Federal Open Market Committee (FOMC) determines the target fed funds rate.  Fed funds rate will ultimately influence all the Bank lending rates on account of competition.

How can the Lending Rate numbers be used for analysis?

Banks and financial institutions are the primary source of money for businesses and consumers across the country. Hence, Bank Lending Rates can mainly drive business direction and influence consumer spending.

The Central Banks will influence the interest rates through their open-market operations in the inter-bank market by purchasing or selling bonds. When Central Banks buy bonds, they inject money into the economy, thereby effectively inducing inflation. It is popularly referred to as the “Dovish” approach. When the Central Bank sells bonds, it is effectively withdrawing money from the economy, making money scarce and costly to borrow. It is popularly referred to as the “Hawkish” approach.

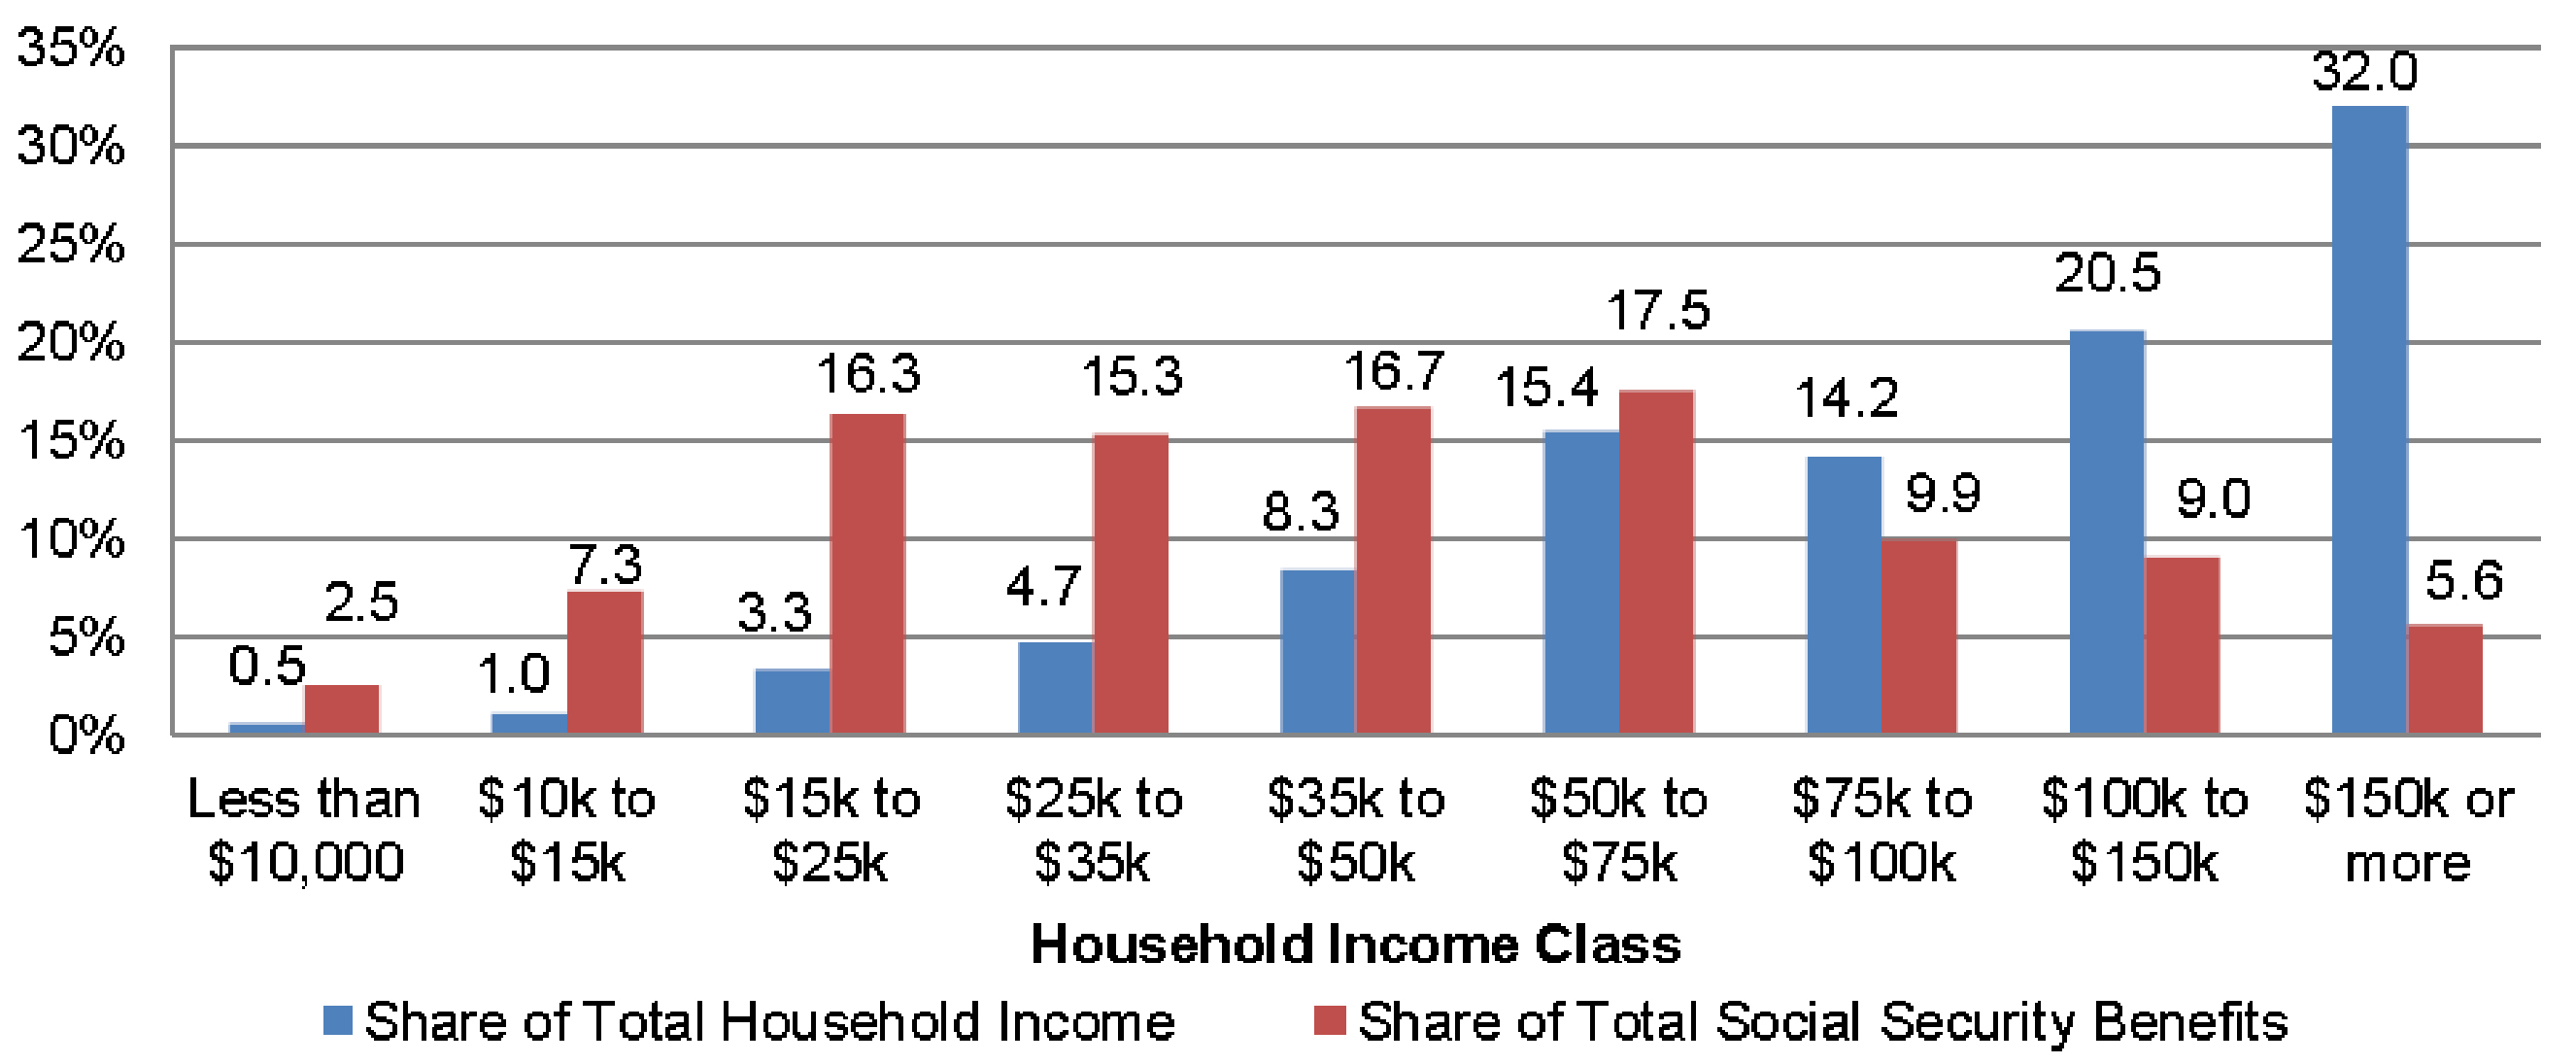
When the Central Bank wants to deflate the economy, they will sell bonds, and when they decide to inflate, they will effectively buy bonds. In the private sector, Consumer Spending makes up about two-thirds of the United States’ GDP, and the rest is mostly by the business sector. The ease with which money is made available to people and business organisations affects the economy in a big way.

When lending rates are low, businesses can procure loans easily; they can run, maintain, and expand their current businesses. On the other hand, when the lending rates are high, only the high-end companies can procure loans. Meanwhile the rest of the business struggle to stay afloat in the deflationary environment. Businesses would be forced to keep their expansionary plans on halt when loan rates are high.

Consumers are also encouraged to take on loans when the rates are low. It promotes consumer spending, which, in turn, boosts local business. On the other hand, when interest rates are high, consumers would tend to save more spend less. When spending is less, businesses also slow down, especially sectors that do business with non-essentials like entertainment, luxury, or recreation.

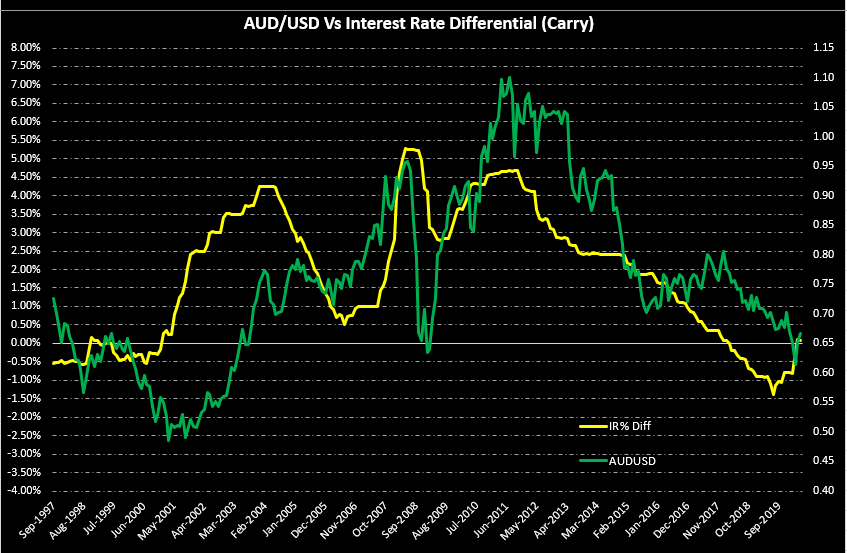
On the international scale, the lending rates and deposit rates of banks from different countries also drive the flow of speculative money from international investors. When the lending rate in one country’s bank is lower than the deposit rate in another country’s bank, investors can generate revenue through a “carry.” Investors will borrow from the low-yielding currency bank and deposit in the high-yielding currency bank. The difference between these two rates is the margin they make.

The above plot shows the actual plot between the interest rates differential (AUS IR – USA IR) and the AUD USD exchange rate. As we can see, whenever the difference between the interest rates rises in favour of AUD, the exchange rate tends to follow. There is a strong correlation between both in the long run.

Since the Central Bank’s interest rates primarily determine all the lending rates (all types), investors generally calculate interest rate differentials by subtracting interest rates of two countries to see potential “carry” opportunities. Hence, when low-interest rates are prevalent, currencies lose value, on account of inflation and also outflow of money into other countries where deposit rates are higher.

Overall, the lending rates and deposit rates together move the currency markets in favour of the country’s currency, having higher deposit rates.

 Impact on Currency

The underlying Central Bank interest rates influence lending rates. The market is more sensitive to Central Bank interest rate changes than the bank lending rates. The lending rates of banks are also not as immediate as the Central Bank’s interest rate changes. Hence, although lending rates impact the economy, its effects are only apparent after about 10-12 months.

Hence, Lending rates are a low-medium impact indicator in the currency markets, as the leading indicator Central Bank interest rates take precedence over bank lending and deposit rates.

Economic Reports

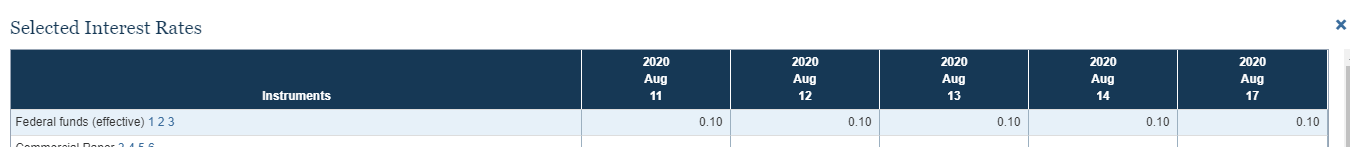
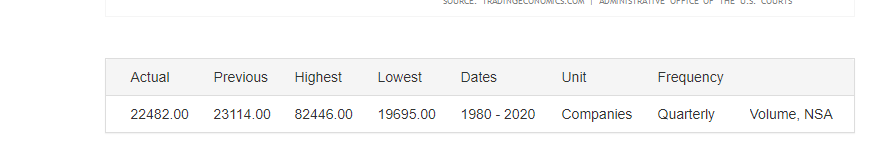
The lending rates of banks can be found from the respective banks from which we would want to borrow money. For the United States, the Federal Reserve publishes Monday to Friday the daily Interest Rates in its H.15 report at 4:15 PM on its official website. Weekly, Monthly, Semi-annual, and Annual rates of the same are also available. The average Bank Prime Rates are also available in the same report.

Sources of Lending Rate

The United States Fed Fund Rates are available here. The prim Bank Loan Rate is available in a more consolidated and illustrative way for our analysis in the St. Louis FRED website. Consolidated Bank Lending Interest Rates of different countries are available here.

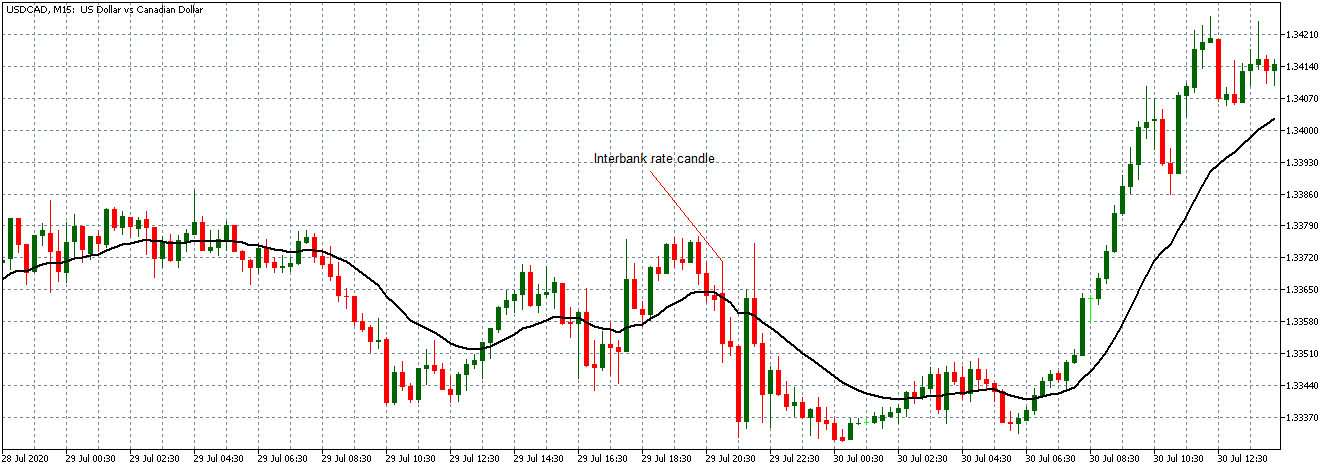
How Lending Rates Affects Price Charts

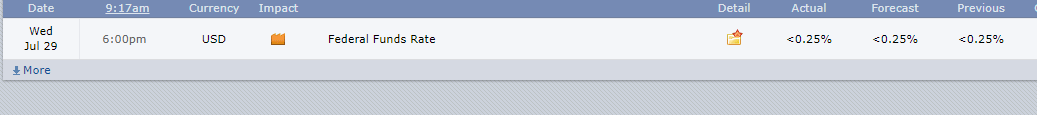
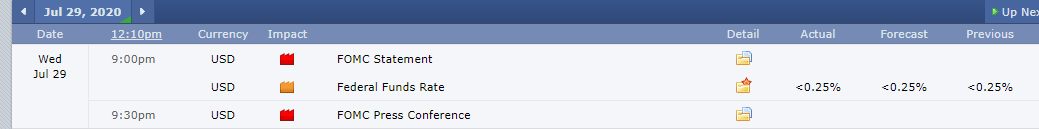
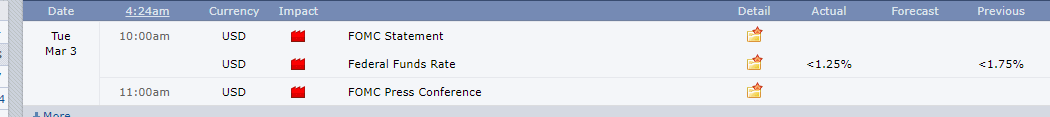
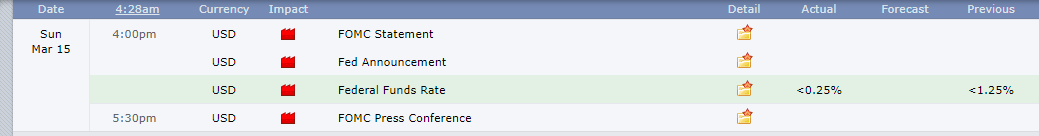
The lending rates can either create expansionary or contractionary effects within an economy.  Let’s now have a look at how it affects the price action in the forex market. In the US, lending rates entirely depend on the Federal Reserve’s Fund Rate. On March 4, 2020, the lending rates were cut from 4.75% to 4.25%. This cut coincided with the Federal Reserves’ interest rate cut from 1.75% to 1.25% on March 3.

On March 16, 2020, the lending rates were reduced from 4.25% to 3.25%. This cut coincided with the Federal Reserves’ interest rate cut from 1.25% to 0.25% on March 15.

For this reason, the lending rates rarely affect the price action in the forex markets.

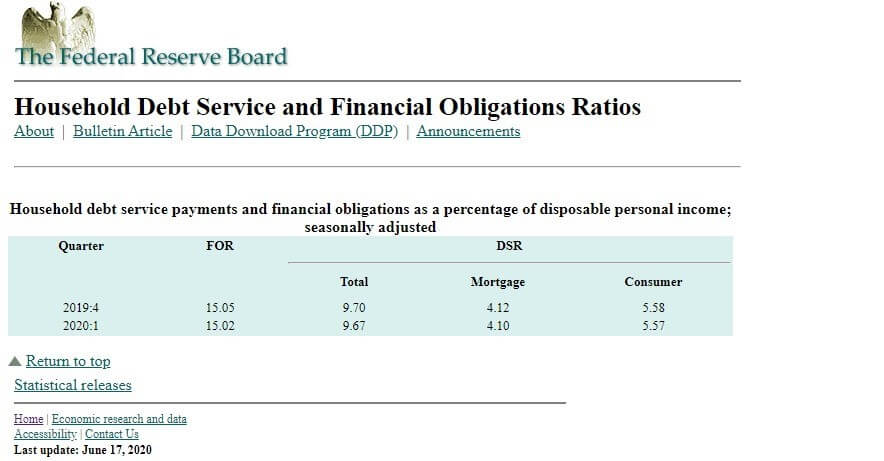
In the US, the Bank Prime rate is published every weekday at 4.15 PM ET. Below is a screengrab from the US Federal Reserve showing the latest bank prime rates.

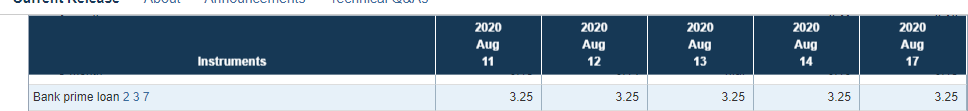
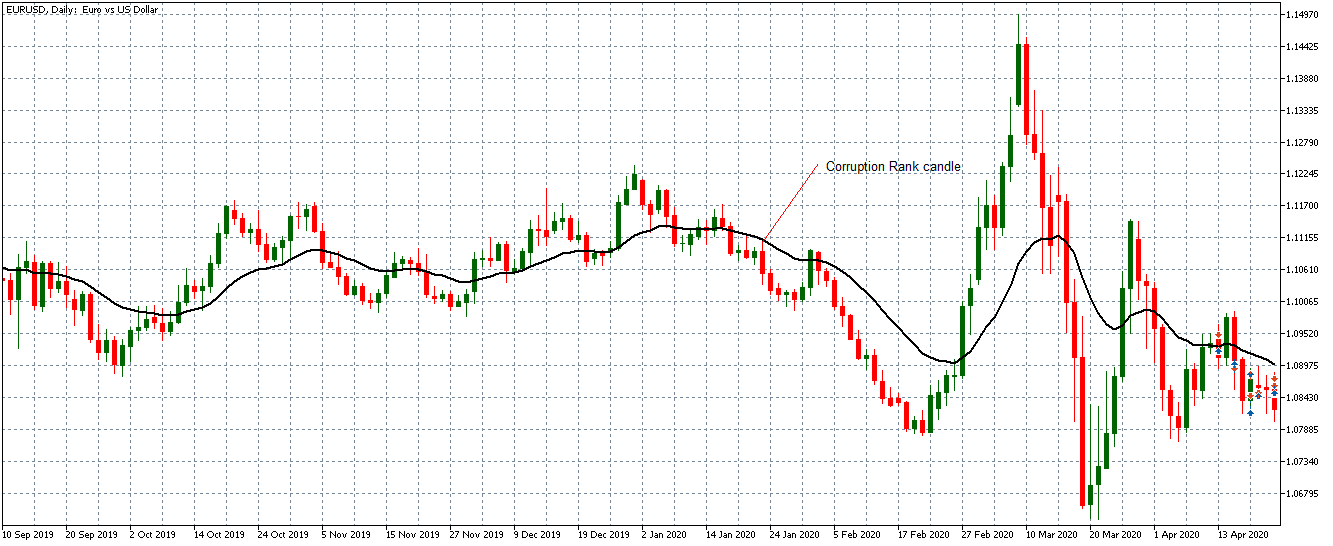
As can be seen, the rate has remained at 3.25% from March 16, 2020. For this analysis, we will consider if the change on March 16, 4.15 PM ET from 4.25% to 3.25% had any effect on the price action of selected currency pairs.

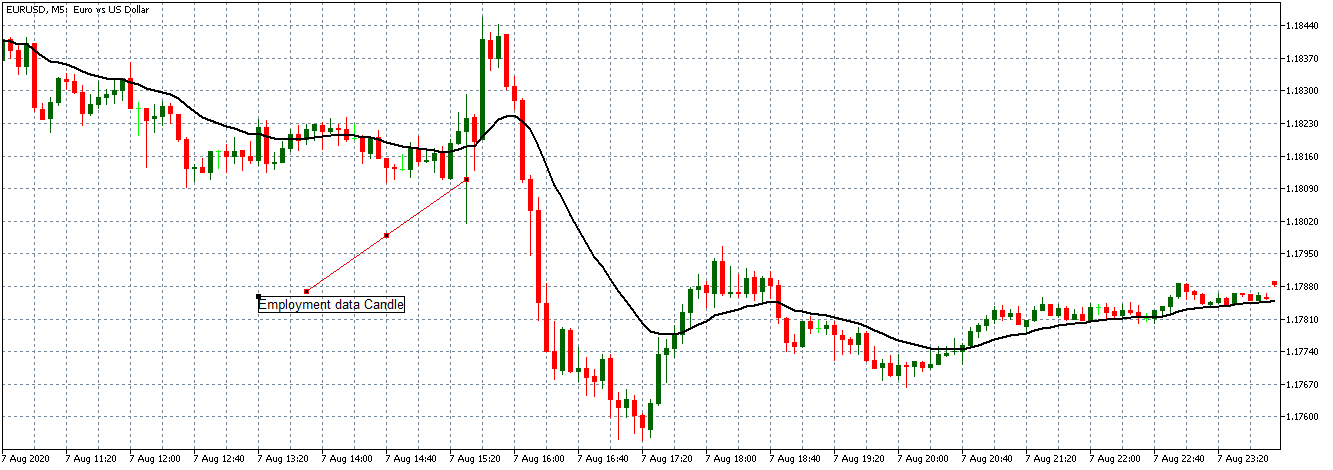
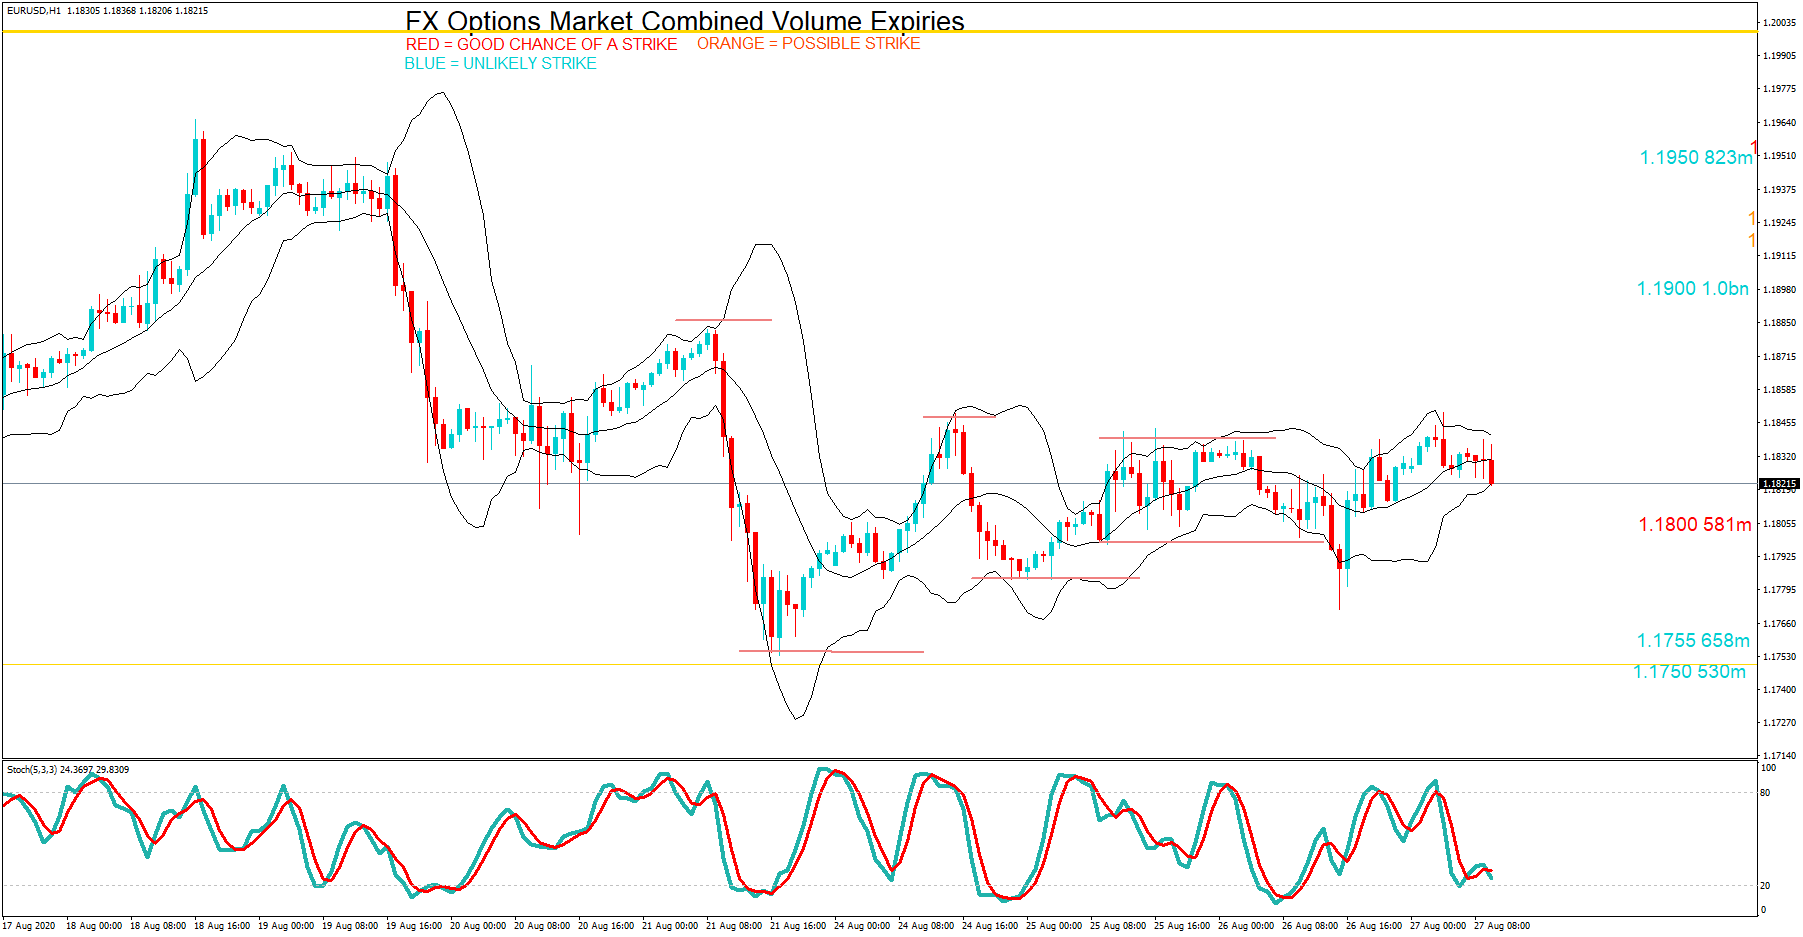
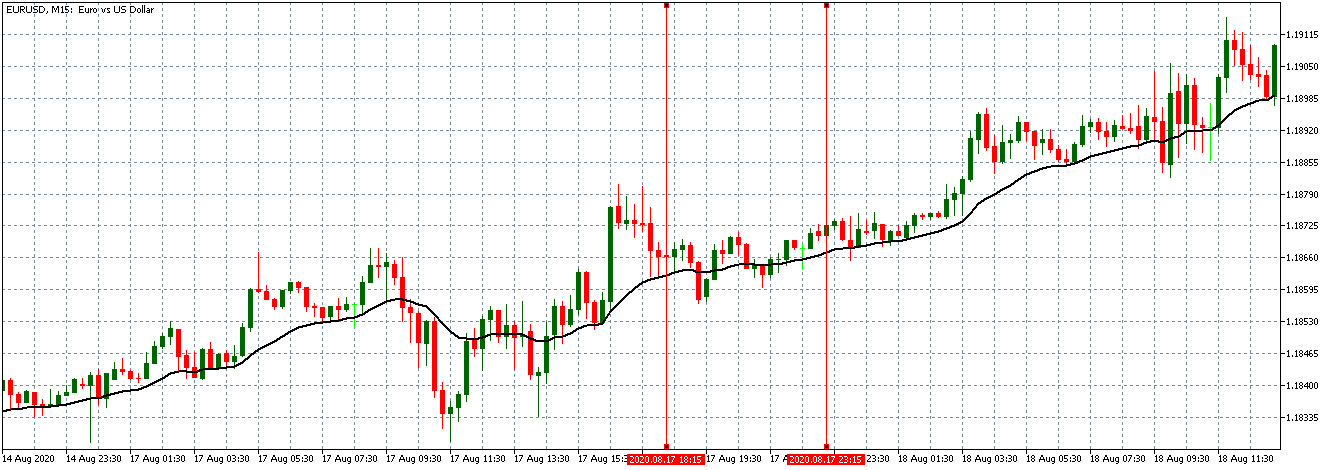
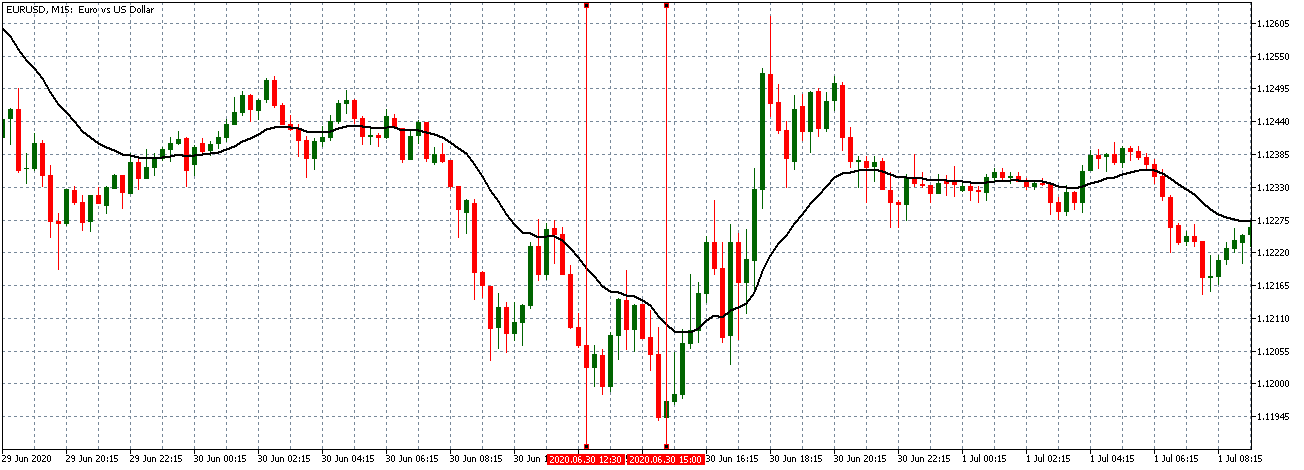
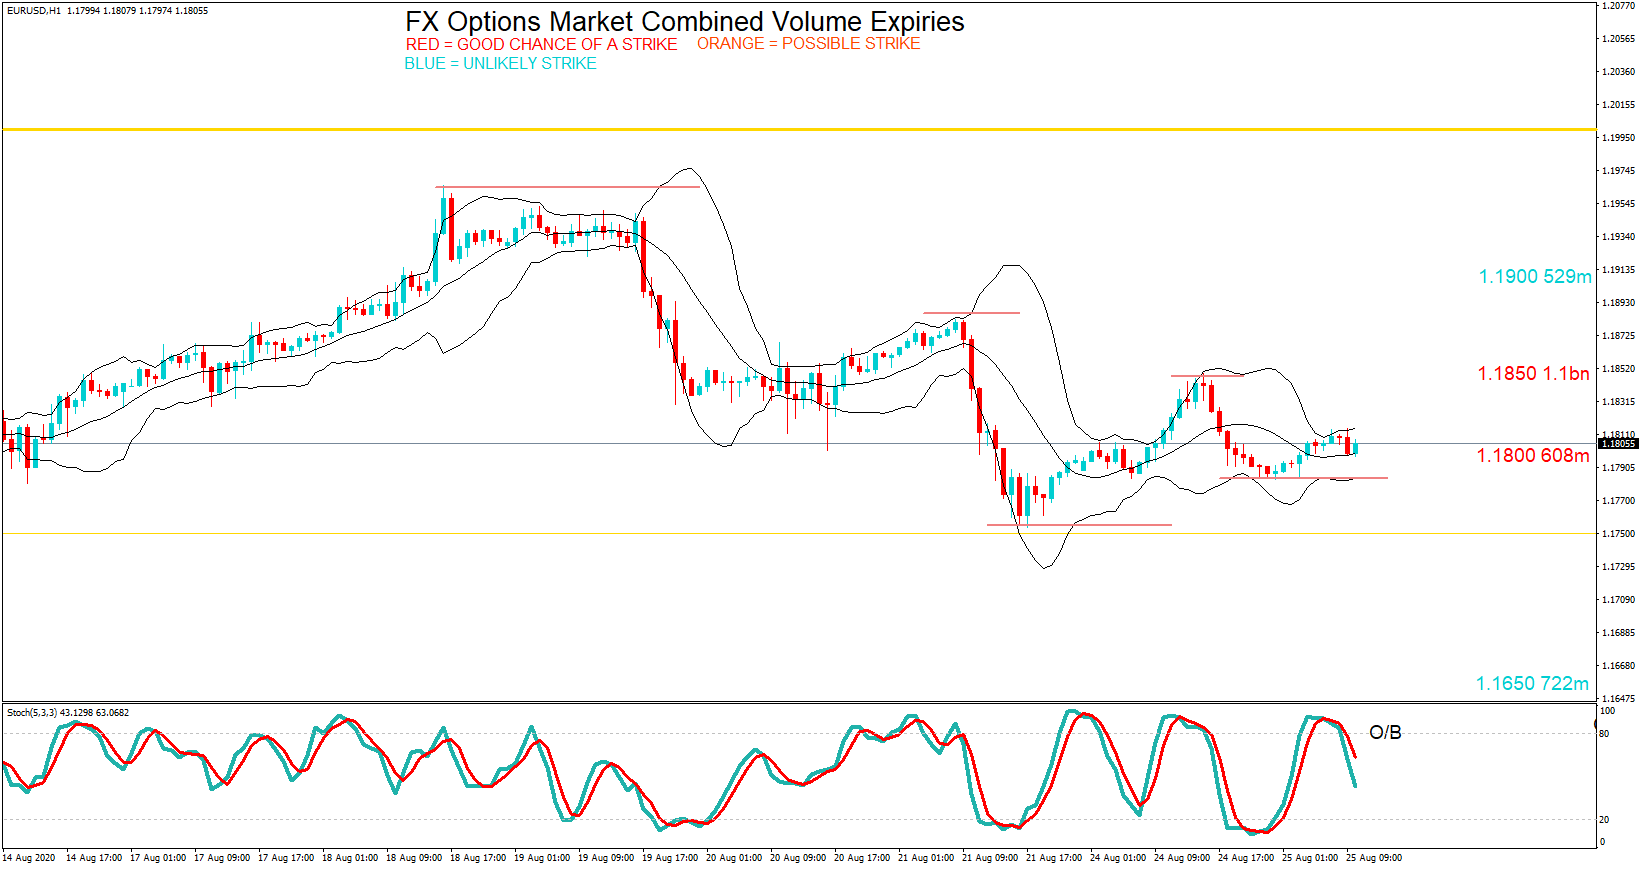
EUR/USD: Before Lending Rate Change on March 16, 2020, 
Just Before 4.15 PM ET

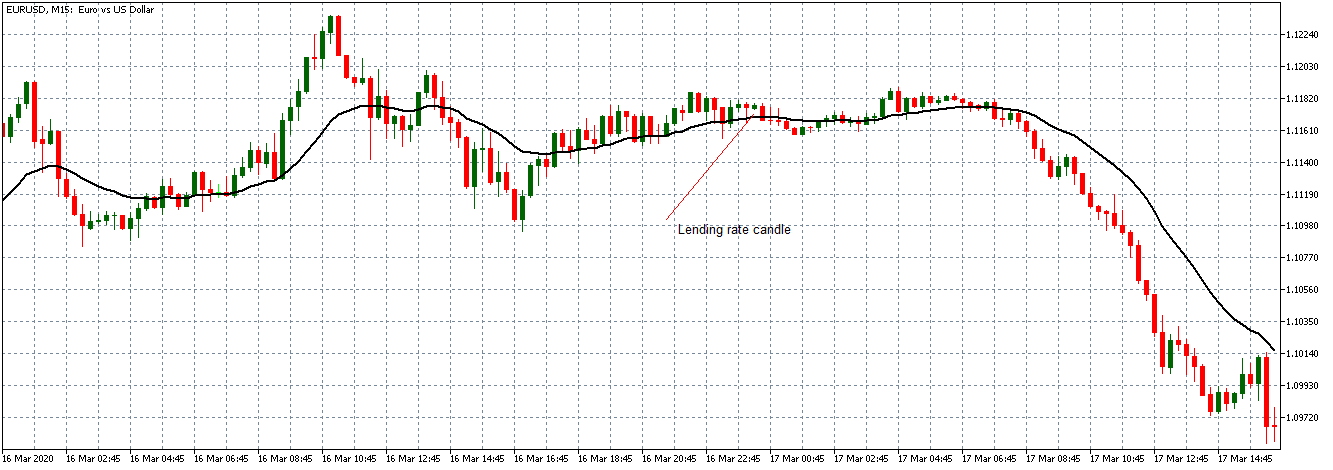
Between 10.00 AM and 4.00 PM ET, the EUR/USD pair was on a neutral trend. This neutral trend is shown on the 15-minute chart above with bullish and bearish candles forming slightly above the flattening 20-period Moving Average.

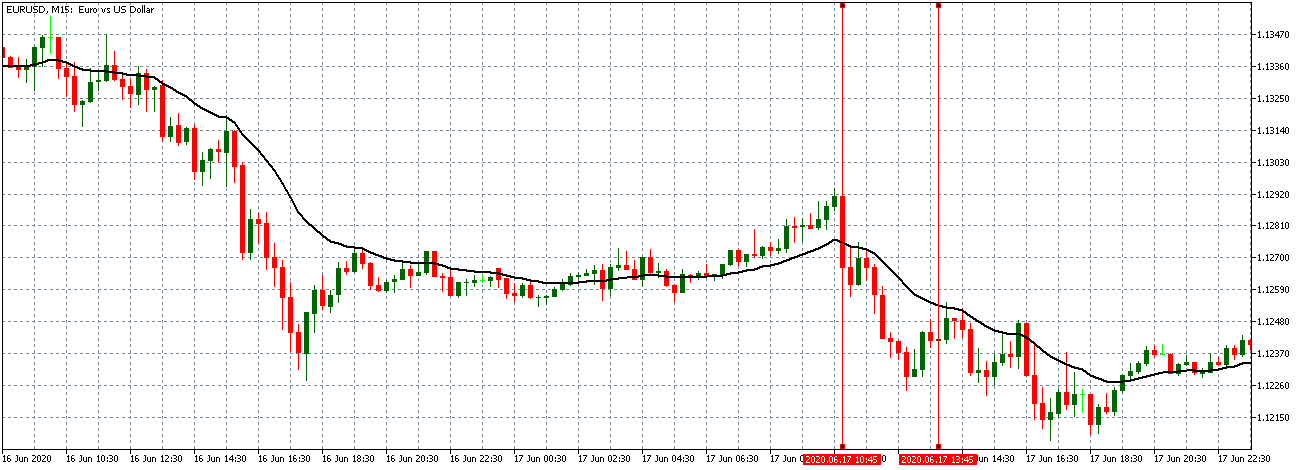
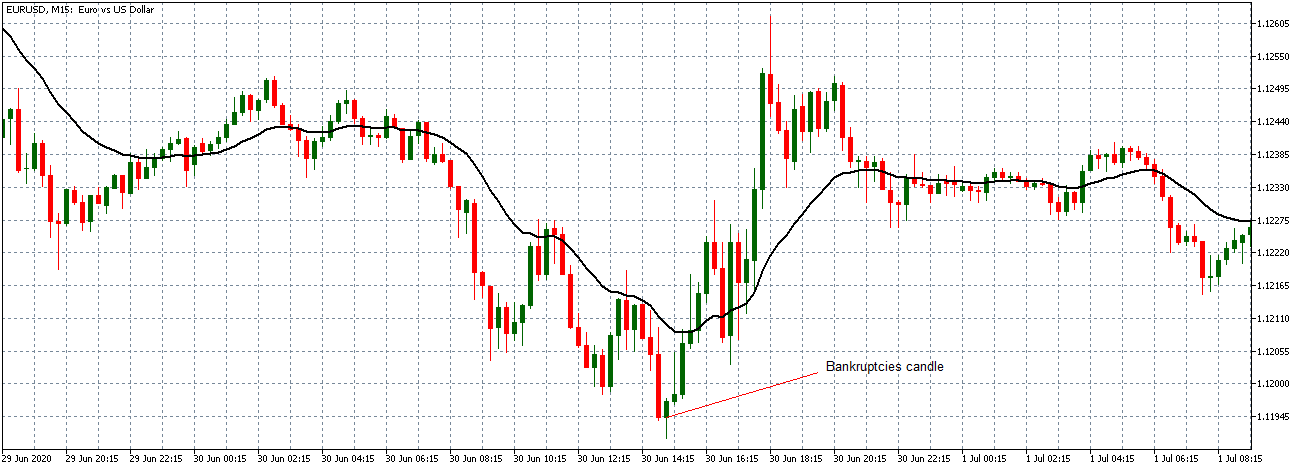
EUR/USD: After Lending Rate Change on March 16, 
2020, 4.15 PM ET

As shown by the chart above, the EUR/USD pair formed a slightly bullish 15-minute candle after the daily release of the lending rates. As earlier mentioned, the release of the lending rates is not expected to have any significant impact on the price action. This sentiment is further supported by the lack of change in the prevailing trend after the news release since the pair continued trading on a neutral stance.

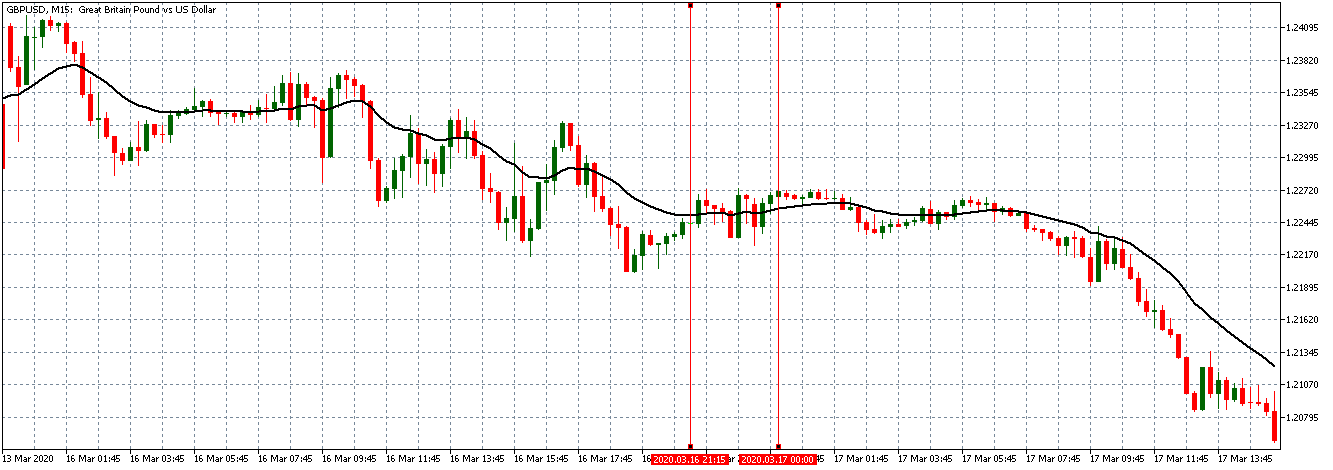
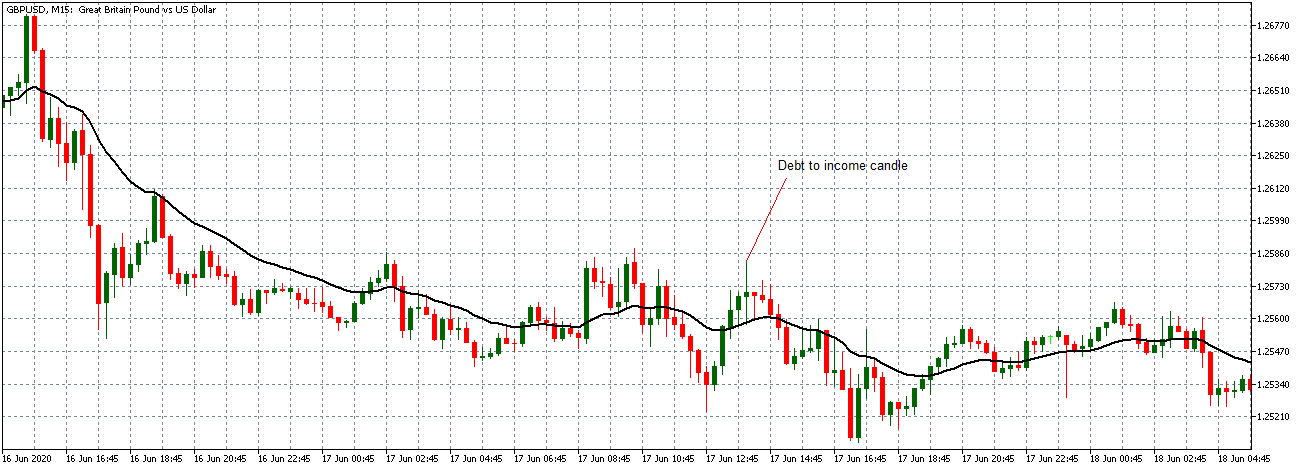
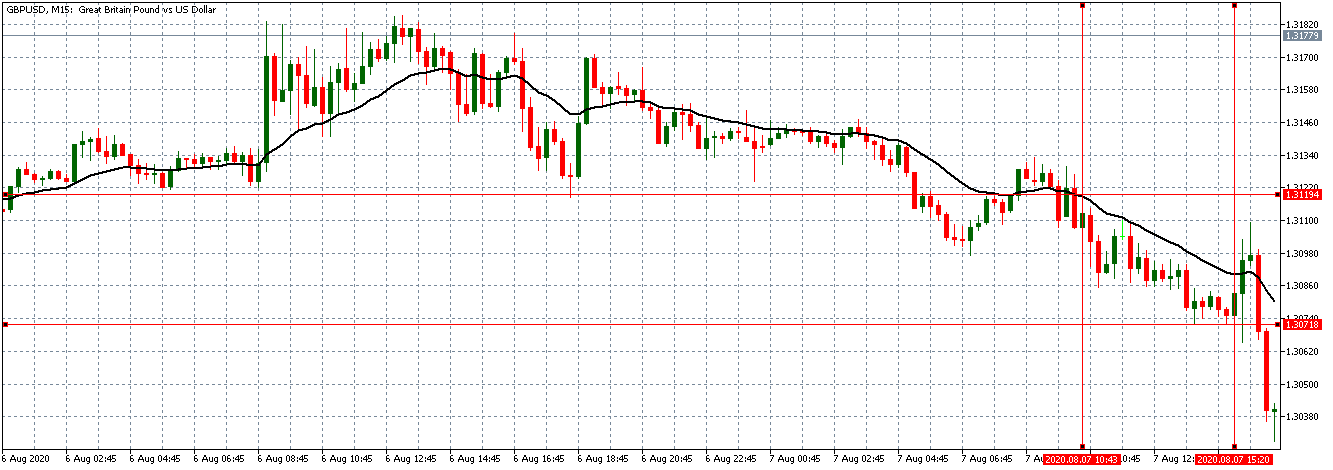
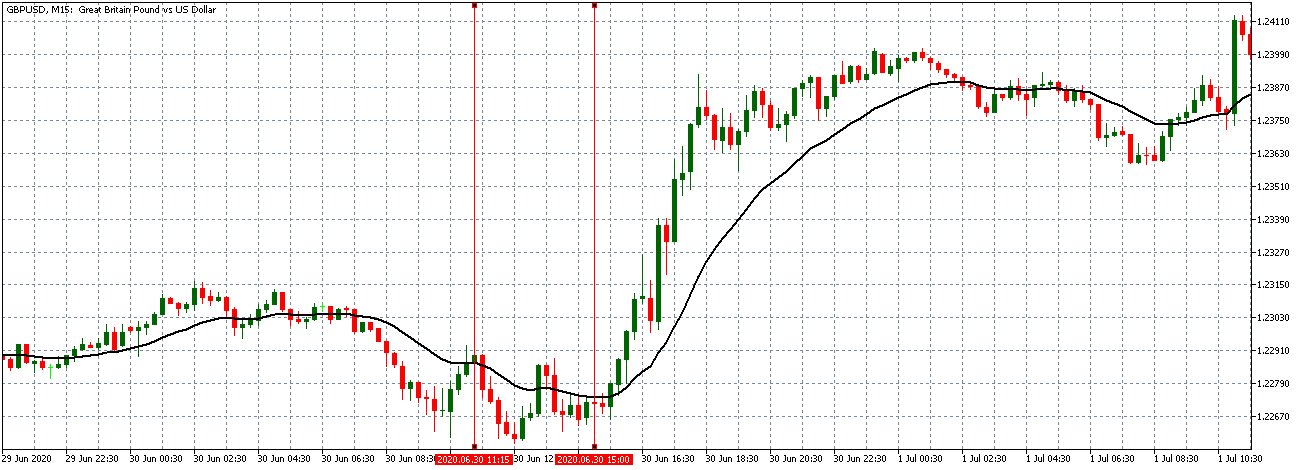
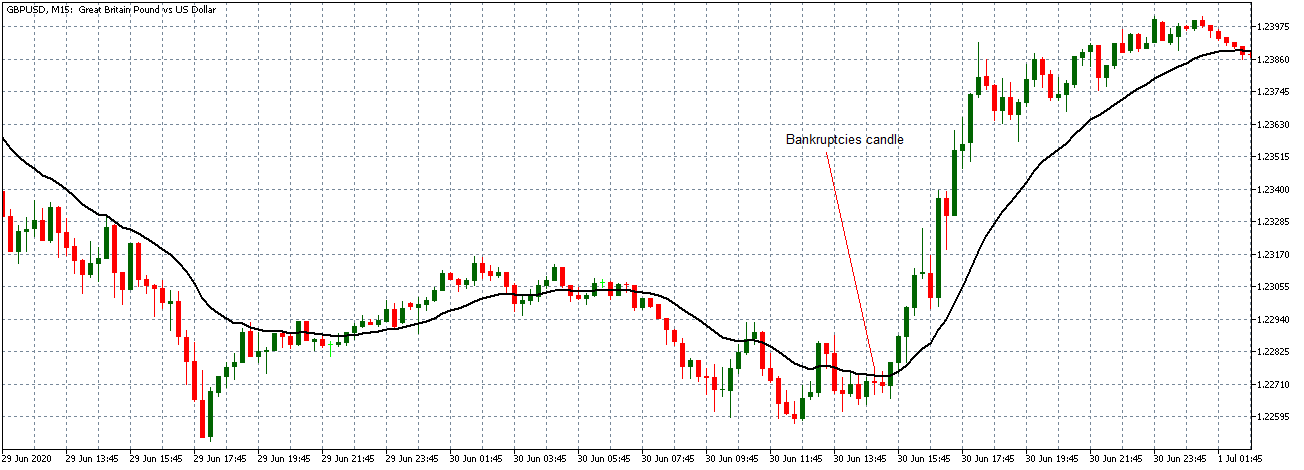
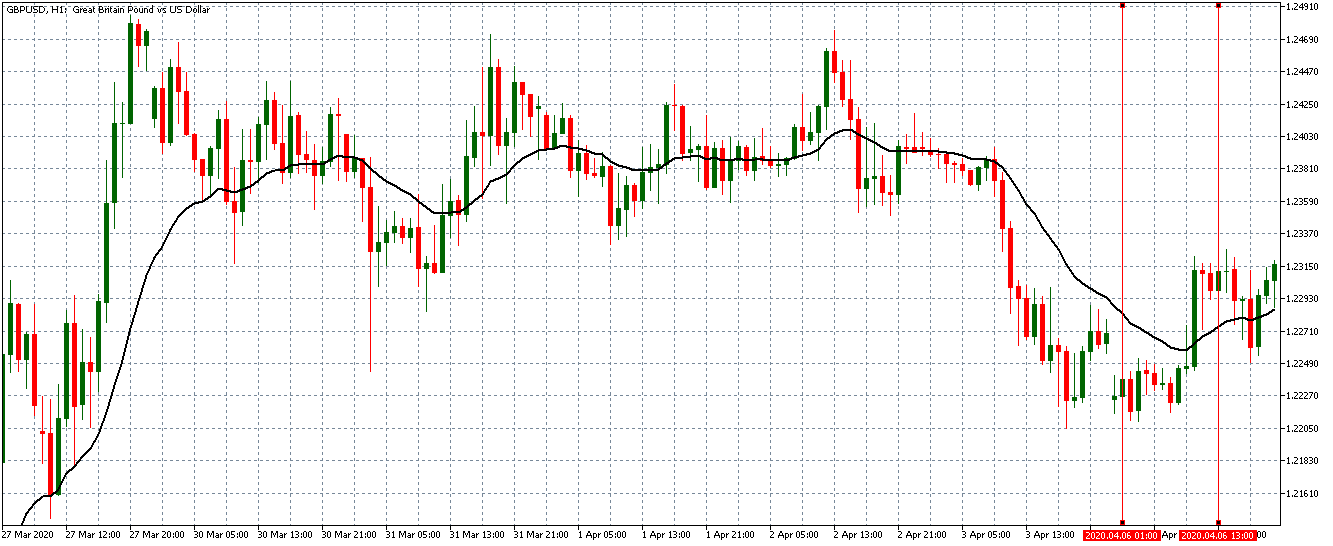
GBP/USD: Before Lending Rate Change on March 16, 2020, 
Just Before 4.15 PM ET

The GBP/USD pair showed a similar neutral trading pattern as the EUR/USD pair between 1.00 PM and 4.00 PM ET. This pattern can be seen on the above 15-minute chart with candles forming on the flat 20-period Moving Average.

GBP/USD: After Lending Rate Change on March 16, 
2020, 4.15 PM ET

After the news release, the pair formed a slightly bearish 15-minute candle but continued trading in the earlier neutral trend.

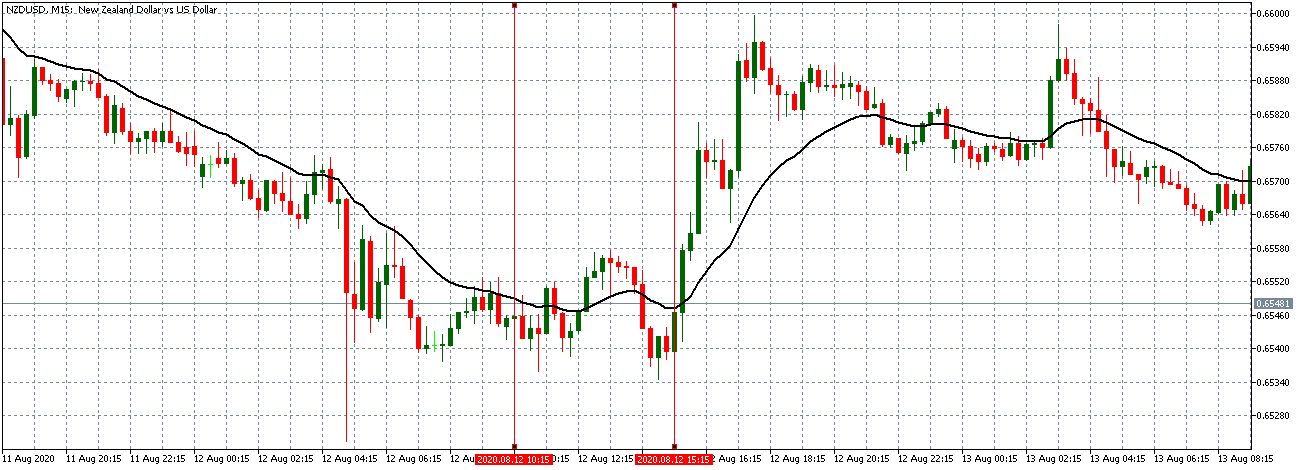
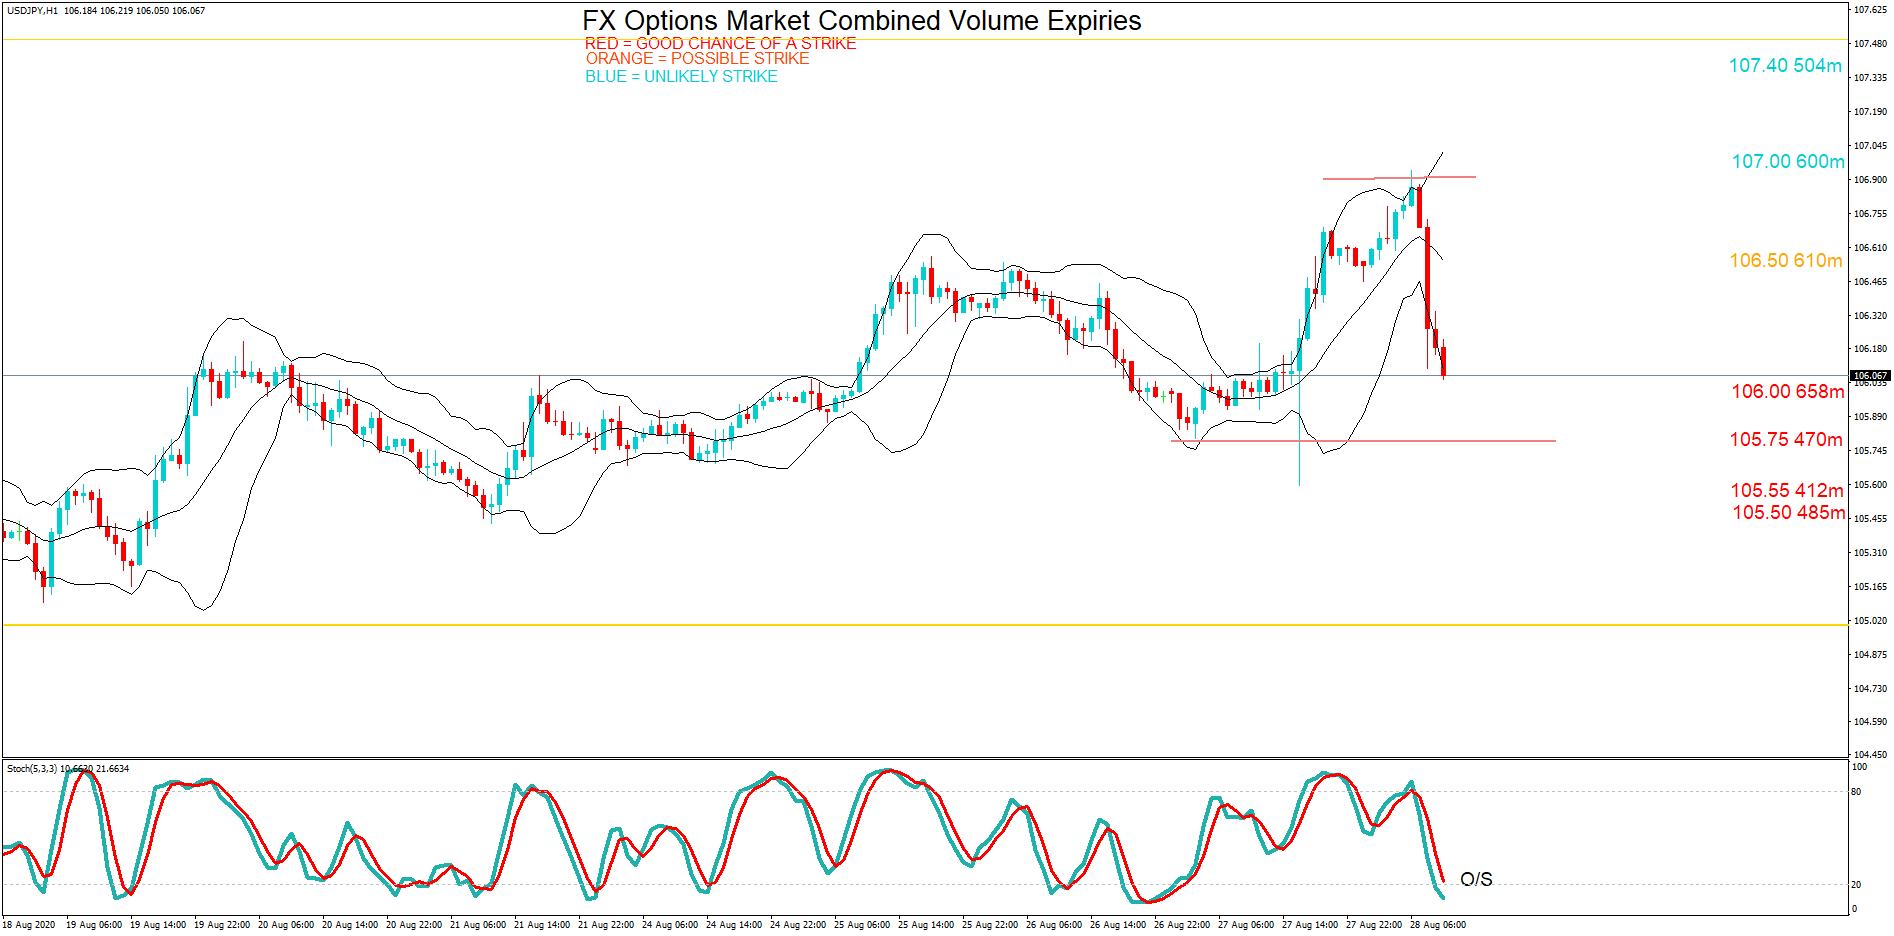
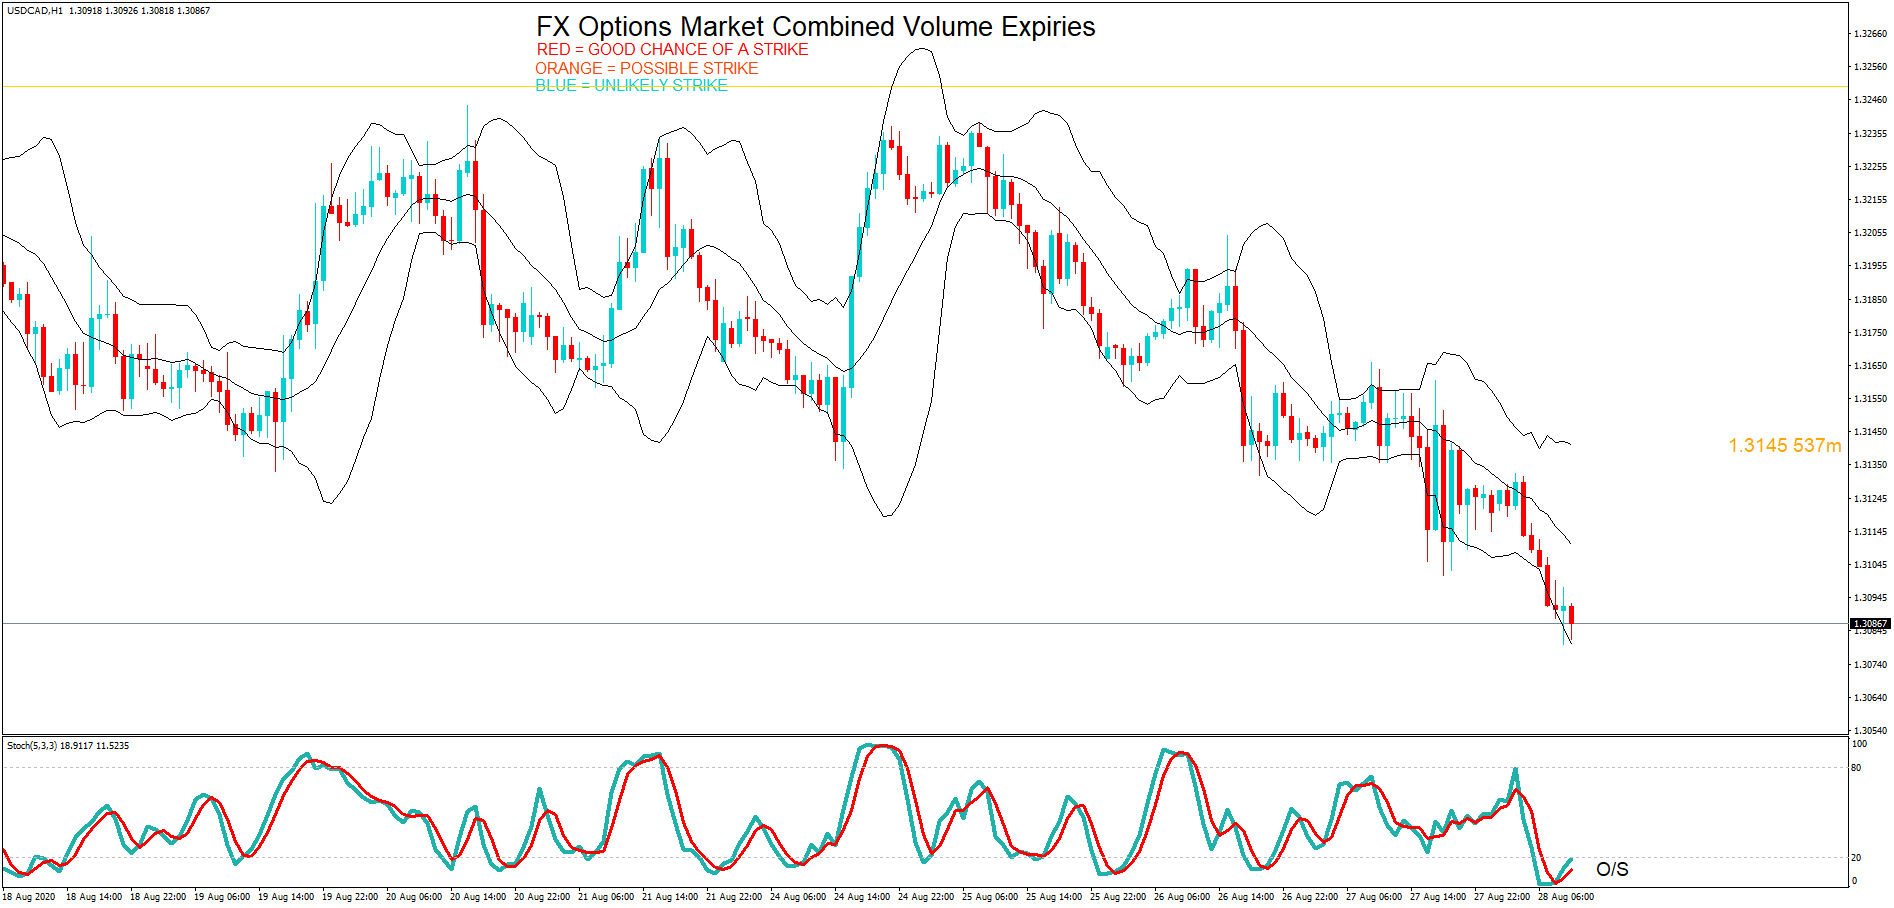
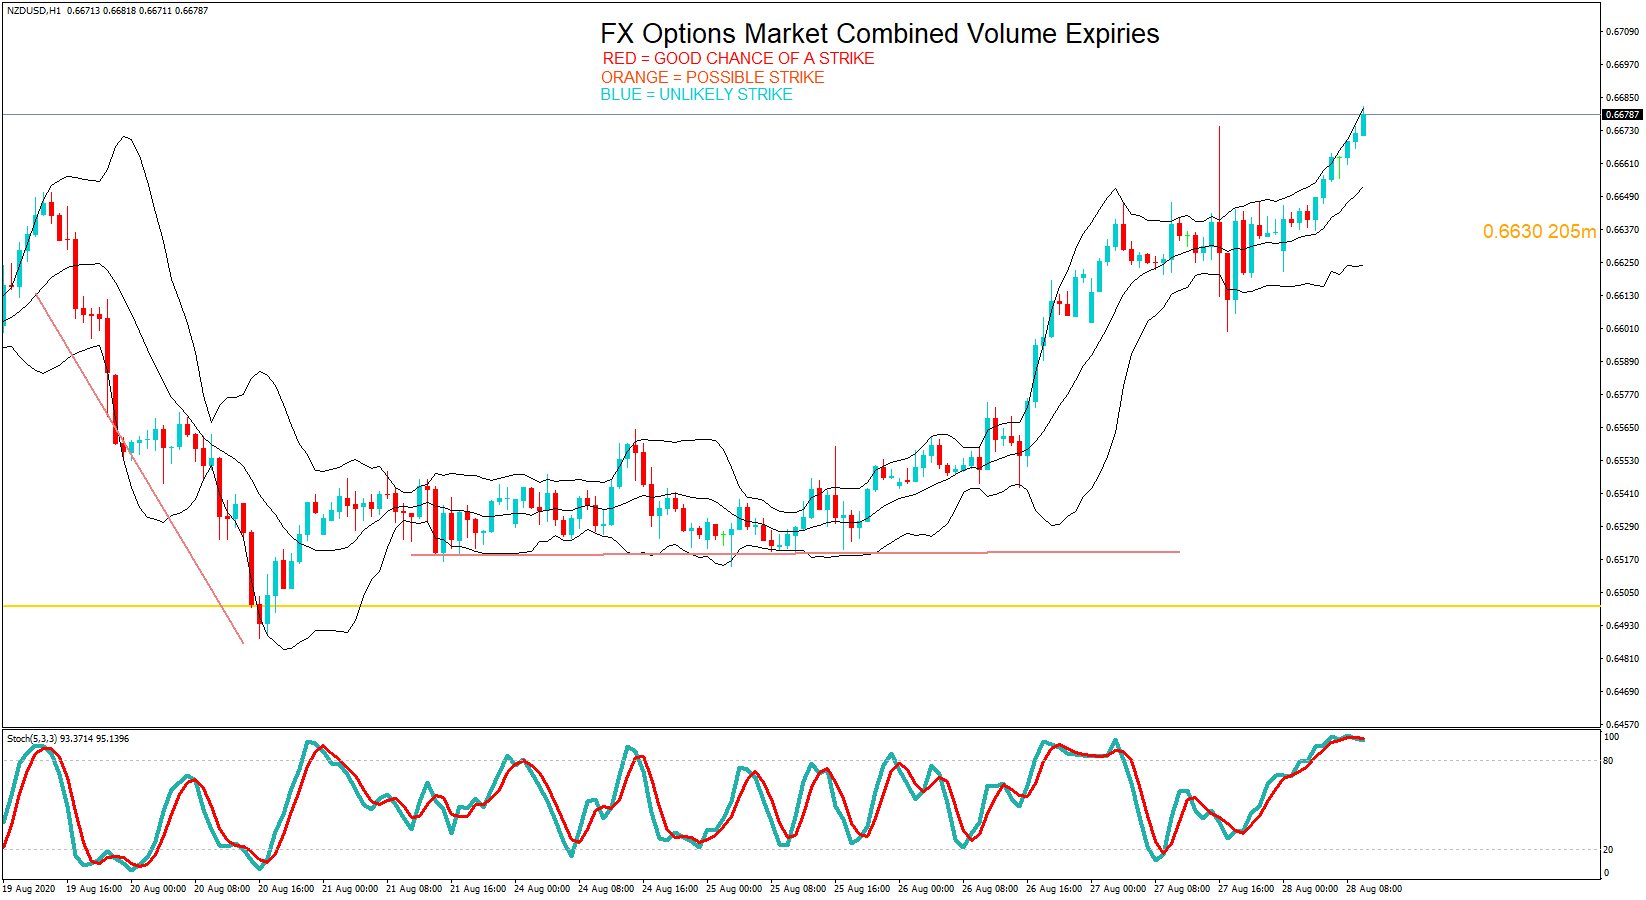
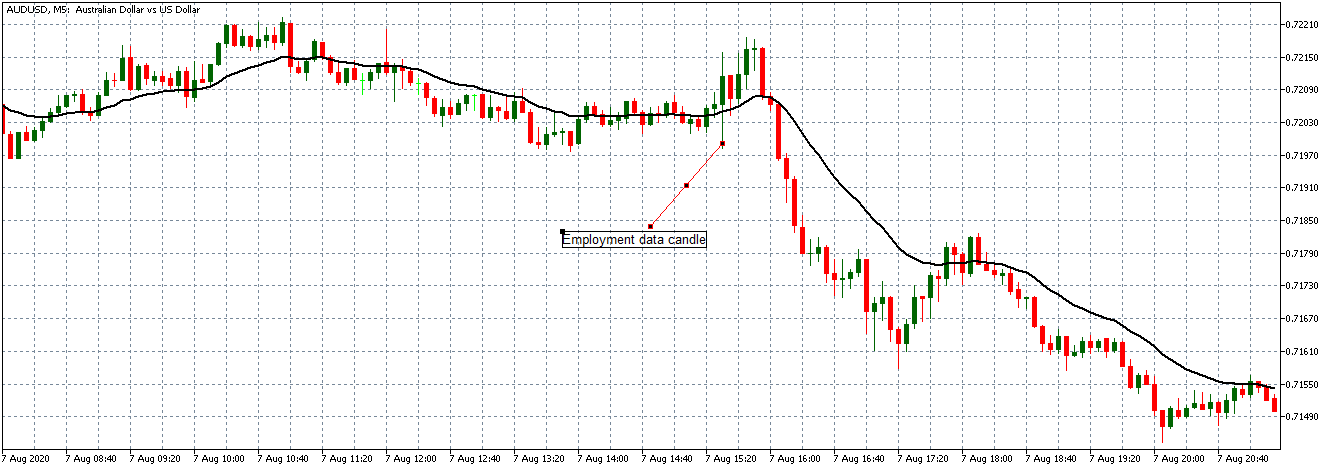
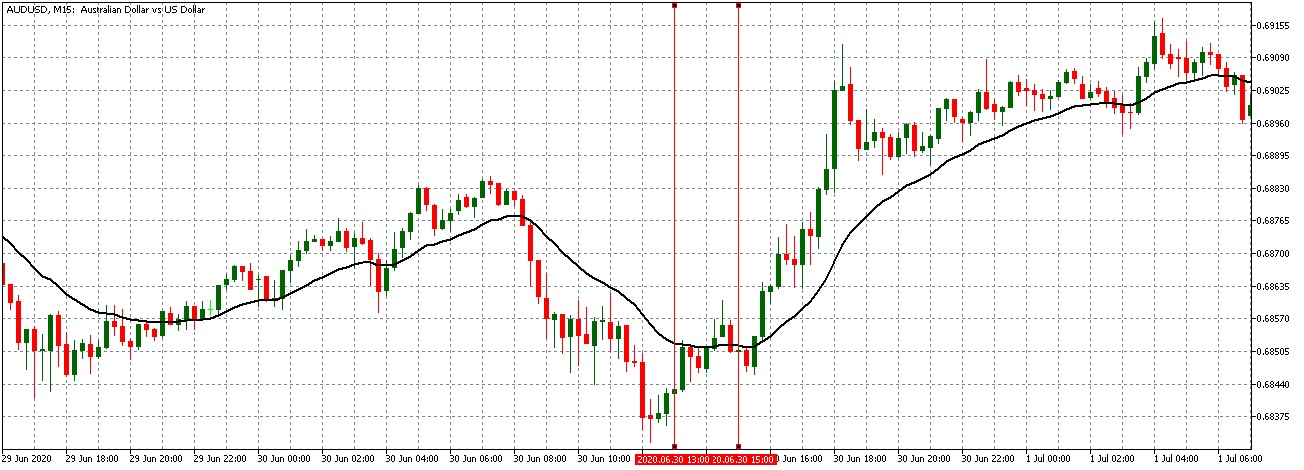
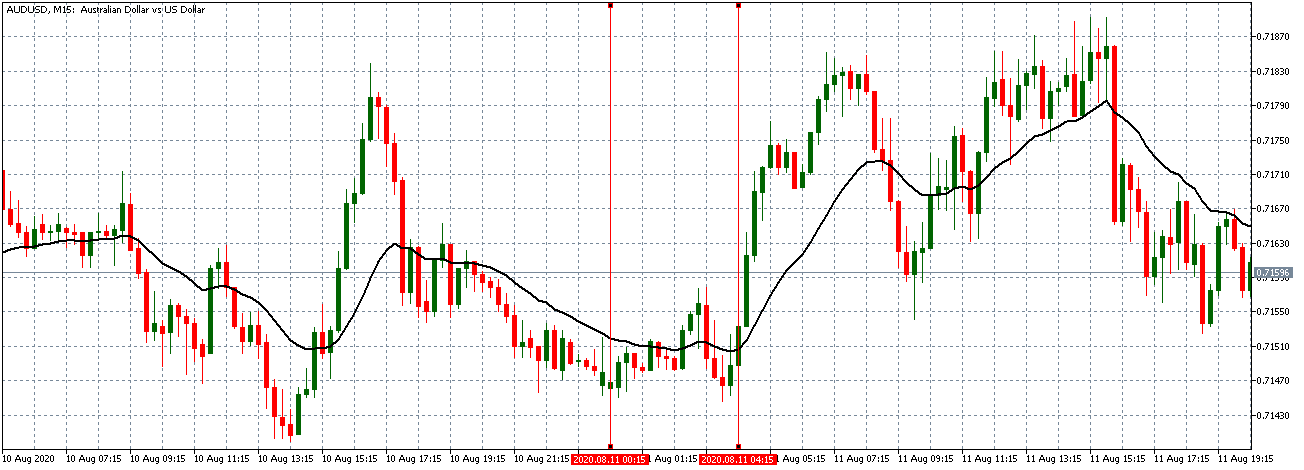
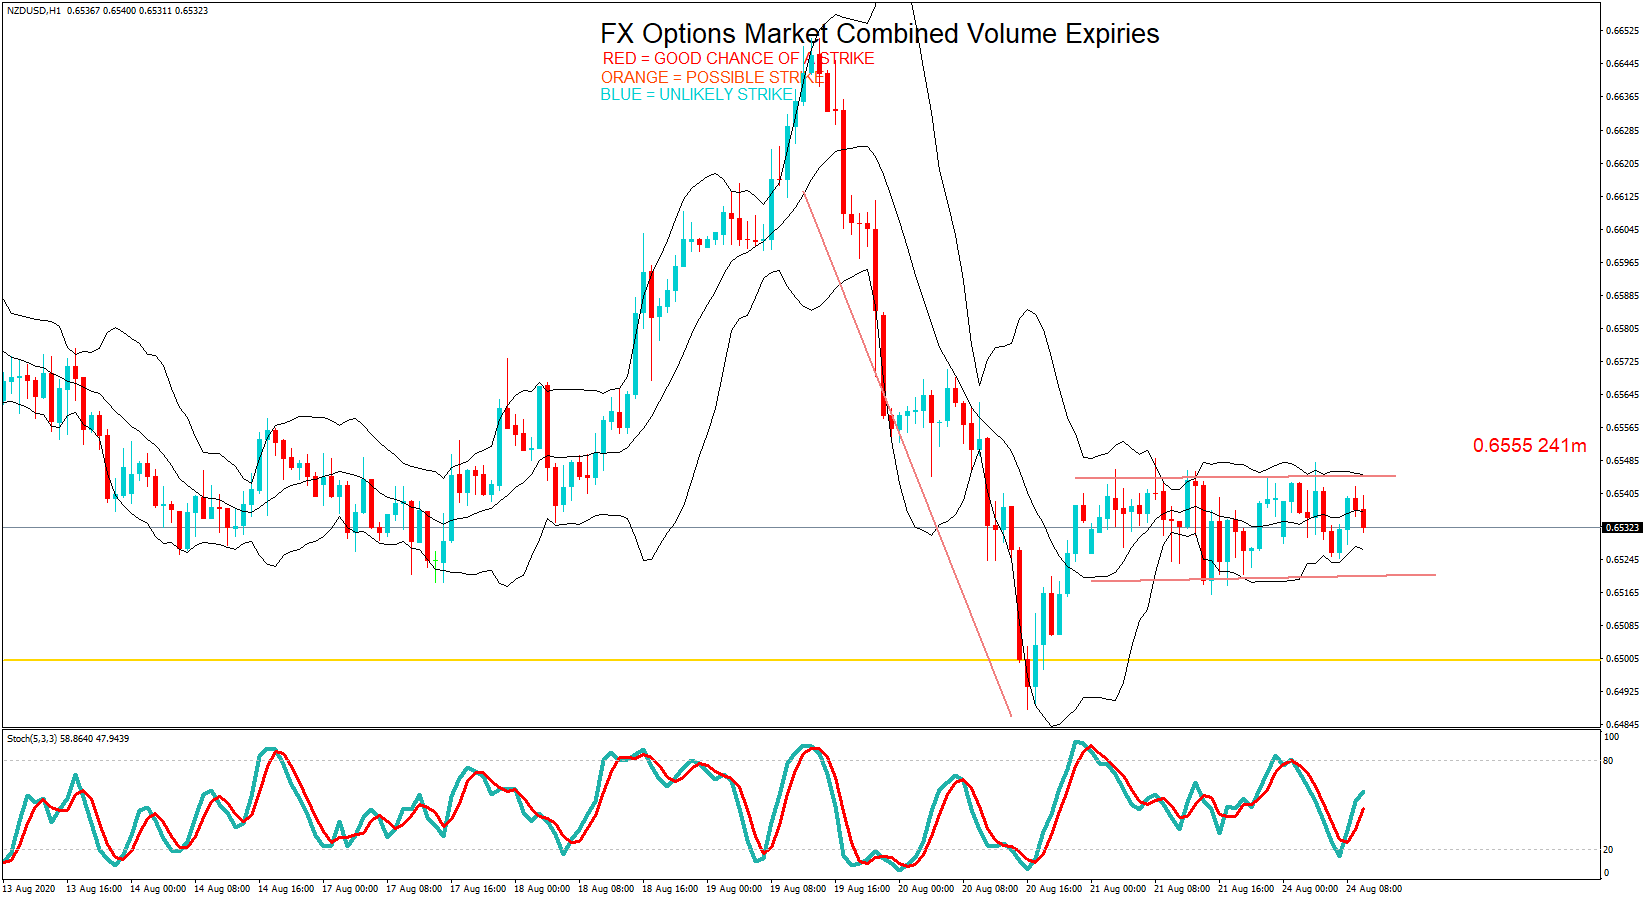
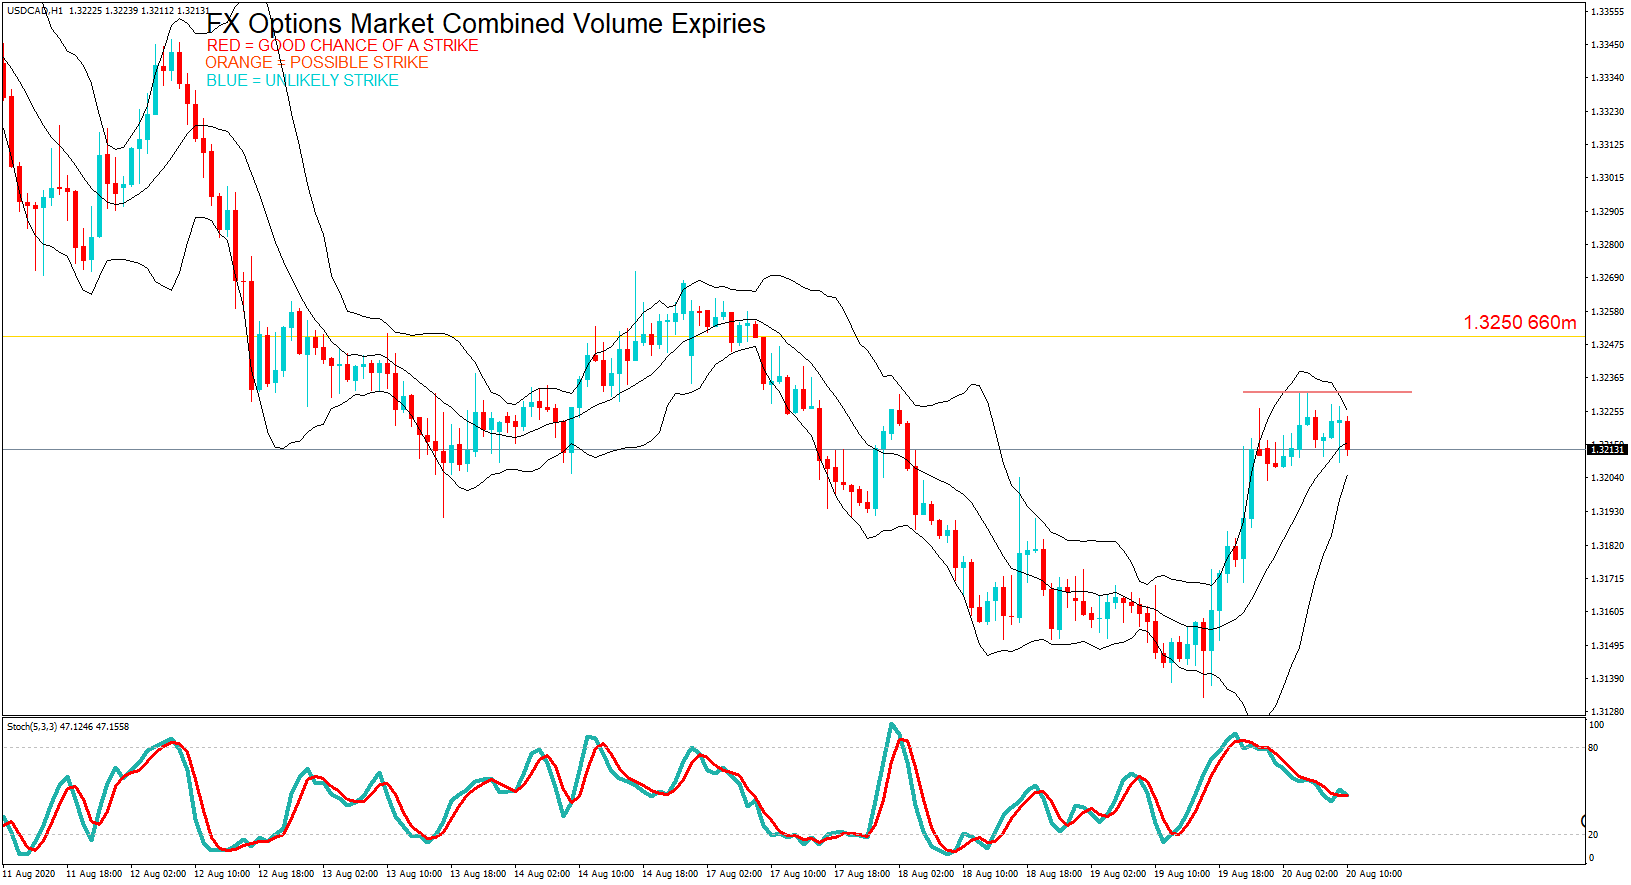
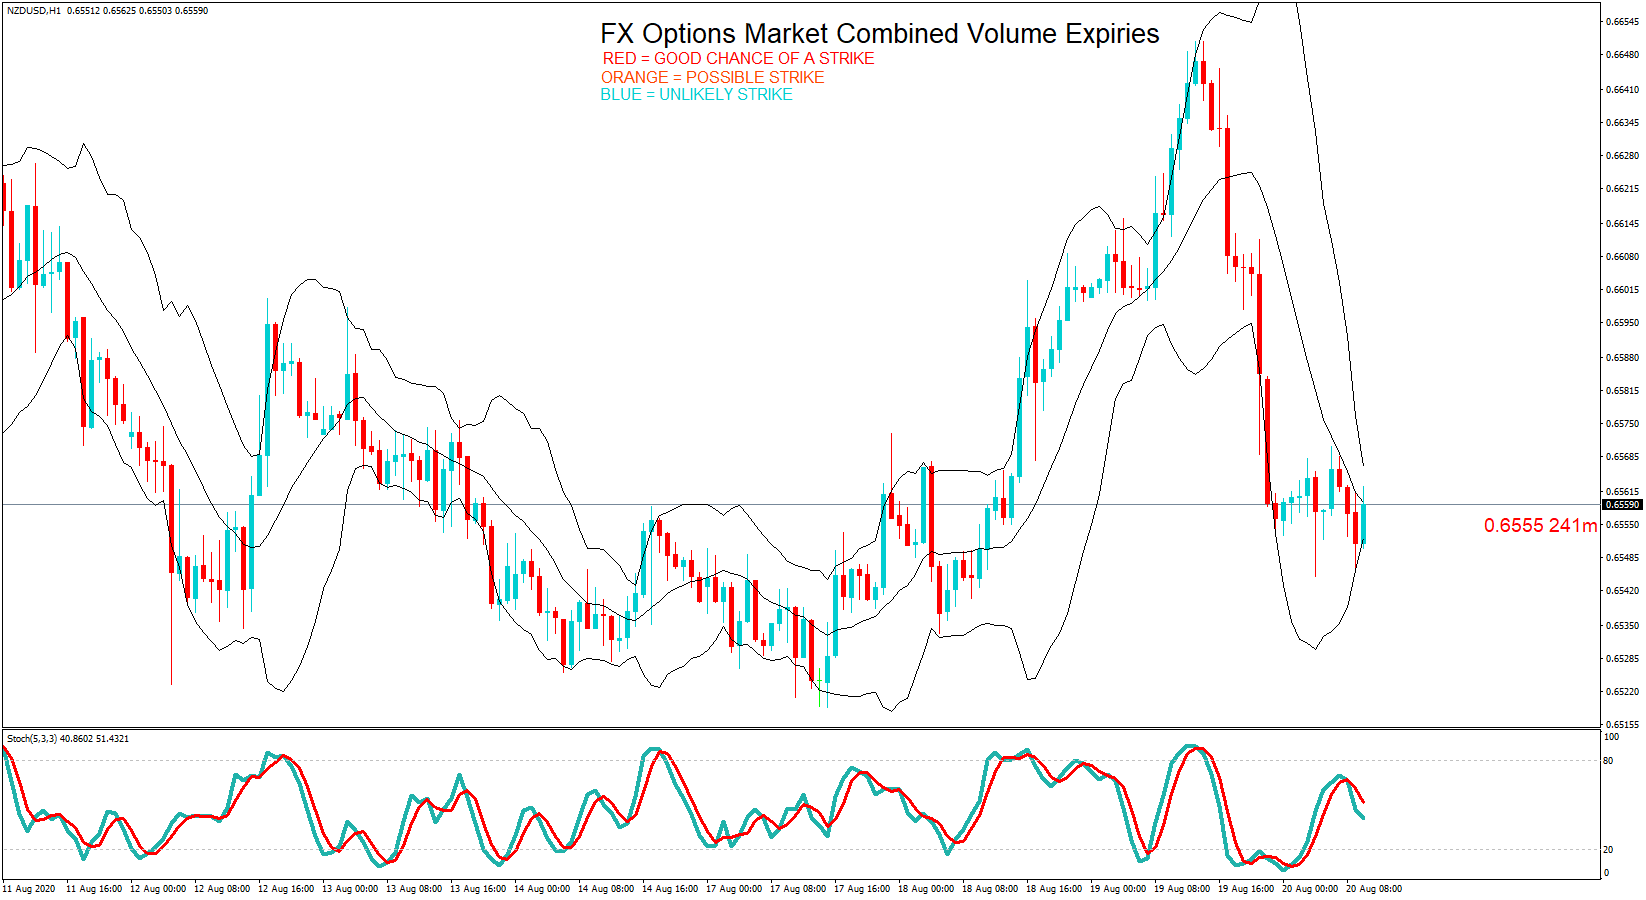
NZD/USD: Before Lending Rate Change on March 16, 2020, 
Just Before 4.15 PM ET

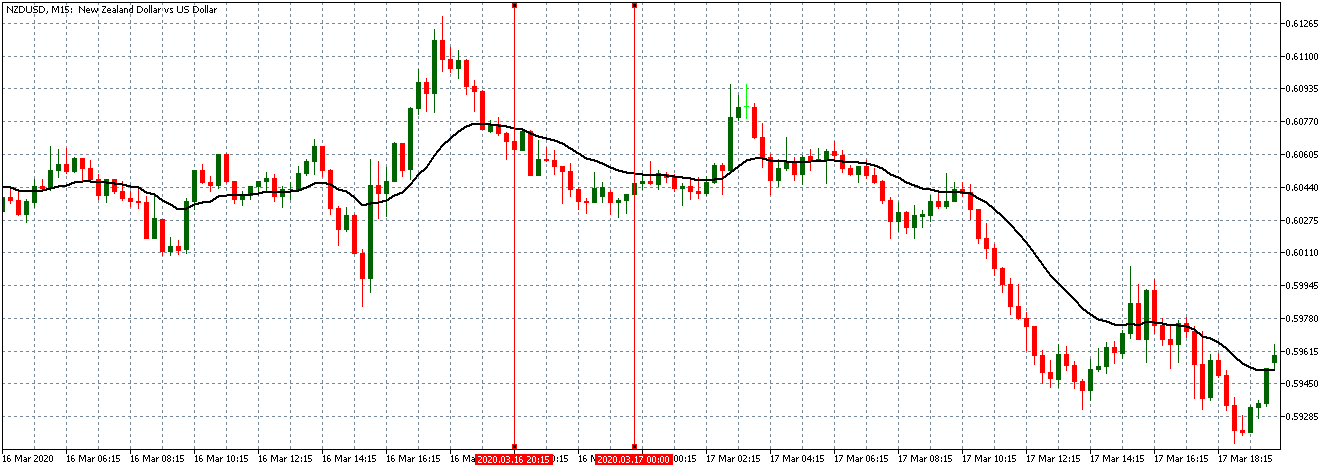
NZD/USD: After Lending Rate Change on March 16, 
2020, 4.15 PM ET

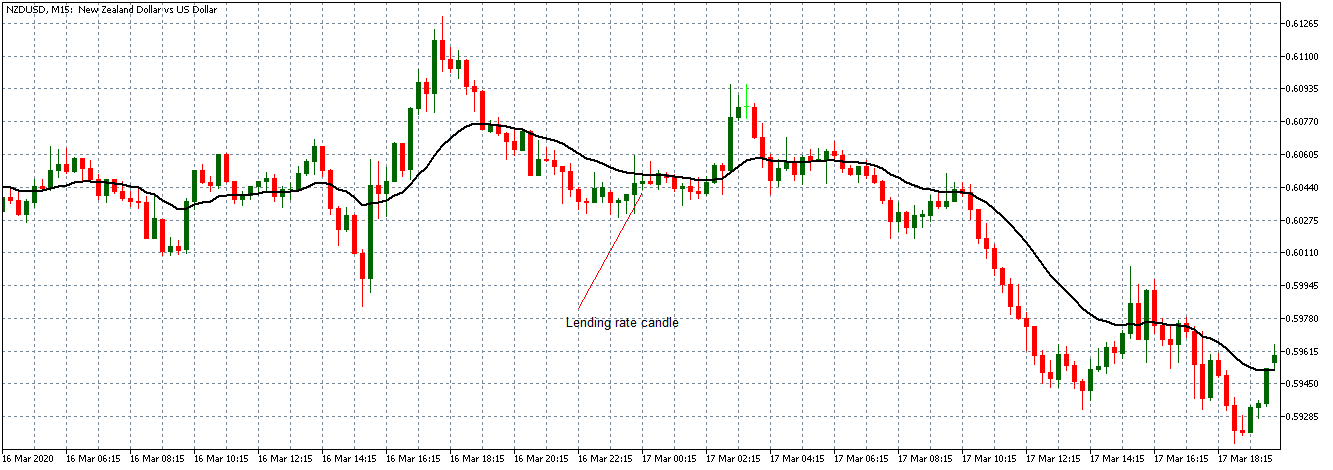
Unlike the EUR/USD and the GBP/USD pairs, the NZD/USD pair had a steady downtrend between 12.15 PM and 4.00 PM ET. After the release of the daily lending rates, the pair formed a bullish 15-minute candle, but just like the other pairs, the news was not significant enough to change the prevailing market trend.

As we noticed earlier, the lending rates move in tandem with the Federal funds rate. Since the lending rates have always remained unchanged in the market and forex traders have anticipated this, hence the lack of volatility accompanying the news release.

Categories
Crypto Market Analysis

Daily Crypto Review, August 31 – Cryptos Making Steady Gains Over the Weekend; ETC Hit By Third 51% Attack

The crypto market had a good weekend, with almost every single top cryptocurrency ending up in a net gain. Bitcoin is currently trading for $11,664, which represents an increase of 0.66% on the day. Meanwhile, Ethereum gained 4.42% on the day, while XRP gained 2.19%.

 Daily Crypto Sector Heat Map

When taking a look at top100 cryptocurrencies, UMA gained 48.99% on the day, making it the most prominent daily gainer. Flexacoin (27.54%) and bZx Protocol (26.08%) also did great. On the other hand, DFI.Money lost 17.06%, making it the most prominent daily loser. It is followed by Golem’s loss of 10.16% and NEM’s drop of 7.06%.

Top 10 24-hour Performers (Click to enlarge)

Bottom 10 24-hour Performers (Click to enlarge)

Bitcoin’s dominance level has gone down quite a bit over the weekend and dropped below the 60% mark. Its value is currently at 59.24%, represents a 1.82% difference to the downside when compared to our last report.

Daily Crypto Market Cap Chart

The crypto market cap has increased significantly over the course of the weekend. Its current value is $372.72 billion, which represents an increase of $19.24 billion when compared to our previous report.

_______________________________________________________________________

What happened in the past 24 hours?

_______________________________________________________________________

_______________________________________________________________________

Technical analysis

_______________________________________________________________________

Bitcoin

Bitcoin spent the weekend slowly rising in price on low volume. The largest cryptocurrency by market cap rose above $11,460 and $11,630 resistance levels, turning them into support. The $11,630 level is currently being retested, but it looks like Bitcoin will stay above it unless a large spike of sellers suddenly comes to the market.

Traders should take a look at Bitcoin’s confirmation of the $11,630 level. If BTC stays above it, traders can consider Bitcoin to be moving in within a range, bound by $11,630 and $12,000.

BTC/USD 4-hour Chart

Technical factors:
  • Price is above its 50-period EMA and 21-period EMA
  • Price is slightly above its middle band
  • RSI is neutral but leaning towards overbought (57.95)
  • Volume is low
Key levels to the upside          Key levels to the downside

1: $11,630                                1: $11,460

2: $12,015                                2: $11,090

3: $12,330                                 3: $10,855

Ethereum

After passing the descending trend and moving above it, Ethereum had a couple of days of steady gains. The second-largest cryptocurrency by market cap slowly gained ground and passed the $400 as well as $415 resistance levels along the way. The move stopped just above $430, before starting to retrace. There is a big possibility that the $415 level will be tested as a support level.

Ethereum traders should look for ETH’s reaction when the price reaches $415 again.

ETH/USD 4-hour Chart

Technical Factors:
  • Price is currently above its 21-period and 50-period EMA
  • Price is slightly below the upper band
  • RSI is severely overbought (67.64)
  • Volume is average
Key levels to the upside          Key levels to the downside

1: $415                                     1: $400

2: $445                                     2: $360

3: $496                                      3: $340

Ripple

XRP also had a great weekend, with its price consistently moving towards the upside after briefly breaking the $0.266 support level to the downside, which is where the bullish move on Aug 27 started. While it made some progress towards the upside, XRP did not reach past any significant resistance levels. In fact, it got stopped by the $0.285 level, which it most likely won’t pass.

Due to its RSI being close to overbought, low volume, and price rejection around the $0.285 level, XRP will most likely start a move towards the downside now.

XRP traders should trade it on its way down towards $0.266 or possibly look for a bounce off of the support XRP will find on its way down.

XRP/USD 4-hour Chart

Technical factors:
  • The price is above its 21-period and 50-period EMA
  • Price is slightly below its upper band
  • RSI is nearly overbought but is moving towards neutral (58.17)
  • Volume is low and relatively stable
Key levels to the upside          Key levels to the downside

1: $0.285                                   1: $0.266 

2: $0.31                                     2: $0.2454

3: $0.32                                    3:$0.235


Categories
Forex Options

FX Options Market Combined Volume Expiries for 31st August 2020

Thank you for visiting the Forex Academy FX Options market combined volume expiries section. Each day, where available, we will bring you notable maturities in FX Options of amounts of $100 million-plus, and where these large combined maturities at specified currency exchange rates often have a magnetic effect on price action, especially in the hours leading to their maturities, which happens daily at 10.00 AM Eastern time. This is because the big institutional players hedge their positions accordingly. Each option expiry should be considered ‘in-play’ with a good chance of a strike if labelled in red, still in play and a possible strike if labelled in orange and ‘out of play’ and an unlikely strike if labelled in blue, with regard to the likelihood of price action meeting the strike price at maturity.

…………………………………………………………………………………………………………

FX option expiries for Aug 31 NY cut at 10:00 Eastern Time, via DTCC, can be found below.

– EUR/USD: EUR amounts

  • 1.1750 536m
  • 1.1800 1.1bn
  • 1.1900 1.4bn

EURUSD subdued but will likely push higher. Euro-area data, Fed speech and US data up later. The 1.4B option is large and a potential magnet for price action which is right in the current zone.

– GBP/USD: GBP amounts

  • 1.3250 272m

GBPUSD, a public holiday in the UK may help keep a lid on the bull run. US data / Fed speech up later will drive the next move.

– USD/JPY: USD amounts

  • 104.50 378m
  • 105.00 754m
  • 105.25 575m
  • 105.75 457m
  • 106.00 438m

USDJPY is in a consolidation phase with a bias to the upside. 106.00 looks like a potential strike.

………………………………………………………………………………….

As you can see on the preferred 1-hour chart(s), we have also plotted the expiration levels at the various exchange rate maturities and we have also labelled in red, orange and blue.  Therefore, if you see option expiry exchange rates labelled in red these should be considered in-play, because we believe there is a greater chance of the expiry maturing at these levels based on technical analysis at the time of writing. There is still a lesser possibility of a strike if they are in orange and so these are ‘in-play’ too. However, if we have labelled them in blue, they should be considered ‘not in-play’ and therefore price action would be unlikely to reach these levels, which are often referred to as Strikes, at the time of the 10 AM New York cut.

Our technical analysis is based on exchange rates which may be several hours earlier in the day and may not reflect price action at the time of the maturities. Also, we have not factored in economic data releases or keynote speeches by policymakers, or potential market volatility leading up to the cut.

Although we have added some technical analysis, we suggest you take the levels and plot them onto your own trading charts and incorporate the information into your own trading methodology in order to use the information to your advantage. Remember the higher the amount, the larger the gravitational pull towards the exchange rate maturity at 10:00 AM Eastern time.

If you want to learn how forex option expiries affect price action in the spot FX market see our educational article by clicking here: https://bit.ly/2VR2Nji

DISCLAIMER: Please note that this information is for educational purposes. Also, the maturities will look more or less likely to become a strike at 10 AM NY time due to exchange rate fluctuations resulting in a different perspective with regard to technical analysis, and also due to upcoming economic data releases for the associated pairs.

Categories
Forex Fundamental Analysis

Everything About ‘Households Debt to Income’ as a Macro Economic Indicator

Introduction

Households Debt to Income is another metric that is used to assess the relative wealth and standard of living of people in the nation. It can give us hints on the spending patterns and circulation of currency and liquidity of the nation overall. Hence, Households Debt to Income ratio is beneficial for economists, investors, and also to deepen our foundation in fundamental analysis.

What is Households Debt to Income?

Debt-to-Income (DTI): The DTI is an individual financial measure that is defined as the ratio of total monthly debt payments to his monthly gross income.

Gross income refers to the income received from the employer or workplace and does not include any of the tax deductions.

The DTI is calculated using the below-given formula.

Disposable Personal Income (DPI): Disposable Personal Income, also called After-Tax Income, is the remainder of an individual’s income after all federal tax deductions. Hence, It is the amount people are able to spend, save, or invest.

Household Debt Service Ratio and Financial Obligations Ratio: The household Debt Service Ratio (DSR) is the ratio of total household debt payments to Disposable Personal Income (DPI).

Mortgage DSR: It is the total quarterly required mortgage payments divided by total quarterly Disposable Personal Income.

Consumer DSR: It is the ratio of aggregate quarterly scheduled consumer debt payments to total quarterly Disposable Personal Income (DPI). The Mortgage DSR and the Consumer DSR together form the DSR.

Financial Obligations Ratio: It is a broader measure than the Debt Service Ratio (DSR) as it takes into account rent payments, auto lease deductions, house owners’ insurance, and property tax.

How can the Households Debt to Income numbers be used for analysis?

DTI is a personal financial metric that is used by banks to determine the individual’s credit eligibility. A DTI ratio should be no more than 43% to be eligible for mortgage credit, but most banks prefer 36% as a healthy DTI ratio to lend money.

The household Debt Service Ratio & Financial Obligations Ratio is more useful, and large scale public data releases for fundamental analysis. The proportion of income that goes into servicing debt payments determines Discretionary Income, Personal Savings, and Personal Consumption Expenditures. Higher the Households Debt to Income ratio, the lesser the money available for other needs.

The Households Debt to Income measures the degree of indebtedness of Households, or in other words, it measures the burden of debt on Households people. The higher the numbers, the greater the load and lesser freedom to spend on other things. As debt burden increases, Discretionary Spending (i.e., for personal enjoyment) decreases, and the income is used entirely to meet the necessities only.

An increase in DPI or decrease in debt payment (by foreclosure or servicing all installments at once) is the two ways to reduce the Debt to Income percentage.

The Households Debt to Income is an essential metric for Government and Policymakers as dangerously high levels in these figures is what led to the financial crisis of 2008 in the United States.

Impact on Currency

High Households Debt to Income figure slows down the economy as debt durations are usually serviced for years. Higher numbers also indicate decreased spending as people spend more money to save and to maintain repayments. This cut back on expenditures results in slowing down businesses, especially those based on Discretionary items (ex: Fashion, entertainment, luxury, etc.) take a severe hit. The overall effect would be a lower print of  GDP, and in extreme cases, it can result in a recession.

Households Debt to Income is an inverse indicator, meaning lower figures are good for economy and currency. The numbers are released quarterly due to which the statistics are available only four times a year, and the limitations of the data set make it a low impact indicator for traders. It is a long-term indicator and shows more of a long-term trend. It is not capable of reflecting an immediate shift in trends due to which the number’s impact is low on volatility and serves as a useful indicator for long-term investors, economists, and policymakers.

Economic Reports

The Board of Governors of the Federal Reserve System in the United States releases the quarterly DSR and FOR reports on its official website. The data set goes back to 1980.

DSR & FOR Limitations: The limitations of current sources of data make the calculation of the ratio especially tricky. The ideal data set for such an estimate requires payments on every loan held by each household, which is not available, and hence the series is only the best estimate of the debt service ratio faced by households. Nonetheless, this estimate is beneficial over time, as it generates a time series that captures the critical changes in the household debt service burden. The series are revised as better data, or improved methods of estimation become available.

Sources of Households Debt to Income

The DSR and FOR figures are available here:

DSR & FOR – Federal Reserve

Graphical and Comprehensive summary of all the Households Debt related are available here:

St. Louis FRED – DSR & FOR

Households Debt to Income for various countries is available here:

Households DTI – TradingEconomics

How Households Debt to Income Affects The Price Charts

Within an economy, the household debt to income is vital to indicate the consumption patterns. In the forex market, however, this indicator is not expected to cause any significant impact on the price action. The household debt to income data is released quarterly in the US.

The latest release was on July 17, 2020, at 7.00 AM ET. The screengrab below is from the Federal Reserve website. It shows the latest household debt service and financial obligations ratios in the US.

The debt service ratio for the first quarter of 2020 decreased from 9.7% in the fourth quarter of 2019 to 9.67%. Theoretically, this decline in the debt to income ratio is supposed to be positive for the USD.

Let’s see how this news release made an impact on the Forex price charts.

EUR/USD: Before Households Debt to Income Release on June 17,
2020, Just Before 7.00 AM ET

Before the news release of the household debt to income, the EUR/USD pair was trading on a steady downtrend. This trend is evidenced by the 15-minute candles forming below the 20-period Moving Average, as shown in the chart above.

EUR/USD: After Households Debt to Income Release on June 17,
2020, 7.00 AM ET

After the news release, the pair formed a bullish 15-minute candle indicating that the USD had weakened. The weakening of the USD is contrary to a bearish expectation since the households’ debt to income had reduced, the USD would be stronger. The pair later continued to trade in the previously observed downtrend.

Now let’s see how this news release impacted other major currency pairs.

GBP/USD: Before Households Debt to Income Release on June 17, 
2020, Just Before 7.00 AM ET

Before the news release, the GBP/USD pair had been attempting to recover from a short-lived downtrend. This recovery is evidenced by the candles crossing above a flattening 20-period Moving Average.

GBP/USD: After Households Debt to Income Release on June 17, 
2020, 7.00 AM ET

After the news release, the pair formed a 15-minute bullish “Doji star” candle. The pair traded within a neutral trend afterward with the 20-period Moving Average flattening. As observed with the EUR/USD pair, GBP/USD did not react accordingly, as theoretically expected, to the positive households’ debt to income data.

AUD/USD: Before Households Debt to Income Release on June 17, 
2020, Just Before 7.00 AM ET

AUD/USD: After Households Debt to Income Release on June 17, 
2020, 7.00 AM ET

Before the news release, the AUD/USD pair showed a similar trend as the GBP/USD pair attempting to recover from a short-lived downtrend. As can be seen, the 20-period Moving Average has already started flattening before the news release.

After the data release, the AUD/USD pair formed a 15-minute bullish candle. The pair continued trading in a neutral trend with candles forming on a flat 20-period Moving Average.

From the above analyses, the news release of the household to debt income data produced contrary effects on the USD. More so, the indicator’s impact on the currency pairs is negligible.

Categories
Forex Fundamental Analysis

Everything About Food Inflation & The Impact Of Its Release On The Forex Market

Introduction

Capitalist economies achieve economic growth using inflation as the primary fuel. Low and steady inflation rates are essential for achieving target GDP each year. Not all commodities inflate steadily and proportionally. Disproportional inflation amongst different sectors leads to over and underpricing of commodities. Food and Energy are the most basic of necessities in today’s modern society. Understanding how food inflation affects the population and the overall economy will help us better understand the inflation trends and their consequences.

What is Food Inflation?

Inflation is the typical increase in prices of commodities and a decrease in the purchasing power of money over time. Inflation is required to motivate people to work better to be able to afford it. If prices were stagnant, the necessity to grow or earn more would cease, thus halting the growth of a nation on the macro level. When that happens, people will remain in their current financial state and would not progress. Hence, inflation is the “necessary evil” or the required fuel for capitalist countries to achieve economic growth.

Food Inflation refers to the general increase in prices of food commodities. As prices inflate, our current income’s purchasing power erodes. Food and Energy are the necessities for us in this modern society. Although to some extent, Energy can be cut back on to get on with life, we cannot cut back on food.

Food is the fundamental right to every human being. Accessibility and affordability to food and water is a must for every individual regardless of their country. Food inflation monitors the affordability aspect of food within the nation; the consequences associated with it are more intricate than we might anticipate.

How can the Food Inflation numbers be used for analysis?

As people can procure fewer goods for a unit of currency over time, people can either cut back on expenses or earn more to compensate for inflation. Food expenses are mandatory expenditure part of income. High food inflation will take up a more substantial chunk out of the disposable income of individuals leaving less room for discretionary spending.

As the affordability of food decreases due to high food inflation, consumer spending is negatively affected. Consumer Spending is the primary component of GDP accounting for more than two-thirds of the nation’s GDP. In the same case, more people who are working on minimum wages find it more difficult to afford food and would be below the poverty line even when their wages are not.

Political implications would also be severe. The backlash from the public over Government’s inadequacy to control inflation would be severe and, at times, have led to strikes and bans in many countries over the years. The Government at such times faces severe criticism both from the public and the opposition parties and would likely lose the next elections.

Food inflation could also occur due to adverse weather conditions destroying crops, or mismanagement of supply and demand by the authorities, or even politically manipulating supply and demand for profit by local dealers. There have been incidents where supplies of grains were withheld to boost up the prices for better profits artificially.

In developing countries, there are incidents where Government-issued rations are also sold illegally for profit by some corrupt groups. Lack of proper support to farmers in terms of resources like electricity, water, seeds, loans could also impair them to produce a good yield. All such factors add to food inflation, whose burden falls upon the ordinary people.

It is necessary to understand that all other commodities excluding Food and Energy generally have at least some alternatives (or different brands) to choose from in case price inflates. For instance, people looking to buy clothes from a brand may switch to another brand to avoid paying the new inflated price. Food inflation effect cannot be avoided as quickly as was the previous case.

Government officials closely monitor the inflation levels and are politically committed to keeping inflation in check through fiscal and monetary levers at their dispense. Food and Energy prices are given special attention, and almost all the time, the response is quick and practical from the Government during times of disruption in the food supply.

During the COVID-19 pandemic, many countries’ governments released relief packages to make sure there is no food shortage. Despite the fact many people slipped through the cracks of these protection measures, nonetheless, Governments did everything they could to avoid starvation.

 Impact on Currency

Food inflation is part of overall consumer inflation. Consumer inflation is the primary macroeconomic indicator for currency traders to assess relative inflation amongst currency pairs. Hence, food inflation is overlooked by currency traders for the broader inflation measures like the Consumer Price Index (CPI) or Personal Consumption Expenditure (PCE).

Nonetheless, food inflation is beneficial for the government officials to keep it in check all the time and also for the economic analysts to report the same. Overall, food inflation is a low-impact coincident indicator in macroeconomic analysis for currency trading that is overlooked for broader inflation measuring statistics, as mentioned before.

Economic Reports

The Bureau of Labor Statistics publishes monthly inflation statistics as part of its Consumer Price Index report for the United States. This report has the food inflation statistics as the first criteria.

The St. Louis FRED also maintains the inflation statistics on its website and has many other tools to add to our analysis.

Sources of Food Inflation

Consumer Price Index from the US Bureau of Labor Statistics is available on its official website along with monthly updates.

We can find the same indexes along with many others with a comprehensive summary and statistics on the St. Louis FRED website.

We can find the global food inflation statistics of most countries on Trading Economics.

How Food Inflation Data Release Affects The Price Charts

In the US, the food inflation data is released simultaneously with the overall consumer price index (CPI) data. The data is released monthly about 16 days after the month ends. The most recent release was on August 12, 2020, at 8.30 AM ET and can be accessed at Investing.com here. A more in-depth review of the monthly report can be accessed at the US Bureau of Labor Statistics website.

It is worth noting that since the food inflation numbers are released together with the over CPI, it will be challenging to determine the effect it has on price action.

The screengrab below is of the monthly CPI from Investing.com. On the right, is a legend that indicates the level of impact the Fundamental Indicator has on the USD.

As can be seen, the CPI data is expected to have a medium impact on the USD upon its release.

The screengrab below shows the most recent changes in the monthly CPI data in the US. In July 2020, the monthly CPI increased by 0.6% better than analysts’ expectations of a 0.3% change. This positive change is therefore expected to make the USD stronger compared to other currencies.

Now, let’s see how this release made an impact on the Forex price charts.

EUR/USD: Before Monthly CPI Release on August 12, 2020, 
Just Before 8.30 AM ET


As can be seen from the above 15-minute chart, the EUR/USD pair was on a steady uptrend before the inflation news release. Bullish candles are forming above a steeply rising 20-period Moving Average, indicating the dollar was weakening before the release. Immediately before the news release, the uptrend can be seen to be weakening.

EUR/USD: After Monthly CPI Release on August 12, 
2020, 8.30 AM ET

After the news release, the pair formed a 15-minute bullish candle. Contrary to the expectations, the USD became weaker against the EUR since the pair continued to trade in the previously observed uptrend.

Now let’s see how this news release impacted other major currency pairs.

AUD/USD: Before Monthly CPI Release on August 12, 2020, Just Before 8.30 AM ET

The AUD/USD pair shows a similar trading pattern as the EUR/USD before the inflation news release. The pair is on an uptrend, which heads for a neutral trend immediately before the news release.

AUD/USD: After Monthly CPI Release on August 12, 2020, 
8.30 AM ET

As observed with the EUR/USD pair, the AUD/USD formed a bullish 15-minute candle after the news release. Afterward, the pair traded in a renewed uptrend with the 20-period Moving Average steeply rising.

NZD/USD: Before Monthly CPI Release on August 12, 2020, 
Just Before 8.30 AM ET

NZD/USD: After Monthly CPI Release on August 12, 2020, 
8.30 AM ET

Unlike the EUR/USD and the AUD/USD pairs, the NZD/USD traded within a subdued neutral trend with an observable downtrend immediately before the news release. However, after the news release, the pair formed a 15-minute bullish candle and traded in a steady uptrend, as seen with the other pairs.

Bottom Line

In theory, a positive CPI data should be followed by an appreciating USD. From the above analyses, however, the positive news release resulted in the weakening of the USD. This phenomenon can be choked to the effects of the coronavirus expectations, which have made fundamental indicators less reliable.

Categories
Forex Market Analysis

Daily F.X. Analysis, August 28 – Top Trade Setups In Forex – U.S. Fed Chair Powell Speaks! 

On the news front, the economic calendar is due to a report series of CPI and GDP figures from the European economy. These events are expected to be overshadowed by the U.S. Personal Pending, Chicago PMI, and Revised UoM Consumer Sentiment, which are expected to slightly worse than beforehand. This may add further bearish bias for the U.S. dollar today.

Economic Events to Watch Today  


EUR/USD – Daily Analysis

During the Thursday’s Asian trading hours, the EUR/USD currency pair managed to extend its previous session gaining streak and still flashing green while taking round near 1.1830/40 level mainly due to the broad-based U.S. dollar selling bias, in the wake of cautious sentiment around the market ahead of the U.S. Federal Reserve (Fed) Chair Jerome Powell’s speech. On the contrary, the buying interest around the shared currency is declining on the day amid the intensifying virus fugues in Europe, which eventually becomes the key factor that has been capped further upside in the currency pair. 

At the moment, the EUR/USD currency pair is currently trading at 1.1835 and consolidating in the range between the 1.1817 – 1.1850. However, the traders are cautious about placing any strong position ahead of week’s Jackson Hole conferences where Federal Reserve’s (Fed) President Jerome Powell will speak about the central bank’s long-awaited monetary policy framework review, which will focus on inflation. 

Despite the upbeat U.S. and China data, the equity market has been declining since the day started amid the renewed concerns over the US-China relation. At the US-China front, the Trump administration sanctioned those companies who are helping China to mark its existence in the South China Sea. In contrast, China fired missiles in a military drill near the South China Sea. 

At the USD front, the broad-based U.S. dollar failed to gain any positive traction on the day. However, the losses could be associated with the doubts about the U.S. economic recovery ahead of Fed Chairman Jerome Powell’s speech at Thursday’s Jackson Hole symposium themed. However, the losses in the U.S. dollar became the key factor that kept the currency pair’s higher. Whereas, the U.S. Dollar Index that tracks the greenback against a basket of other currencies dropped by 0.12% to 92.882 by 11:59 PM ET (4:59 AM GMT).

At the coronavirus front, the coronavirus cases grew to 236,429, with a total of 9,280 deaths toll, according to the German disease and epidemic control center, Robert Koch Institute (RKI) report. In the meantime, the cases rose by 1,576 in Germany yesterday against Monday’s +1278. Whereas the death toll also grew by 3. It is worth mentioning that Germany recorded its highest number of new COVID-19 cases during the weekend in almost 4-months. As a result, they undermined the bullish sentiment around shared currency and held the currency pair between the thin range.

Daily Technical Levels

Support Pivot Resistance
1.1754 1.1828 1.1894
1.1689 1.1967
1.1615 1.2033

 EUR/USD– Trading Tip

The EUR/USD is trading slightly bullish at 1.1851, crossing over the resistance level of 1.1849 level. On the lower side, the EUR/USD may find support at 1.1830, while a bearish breakout of 1.1830 level can trigger selling until 1.1800 level. In case of a bullish breakout, the EUR/USD pair may begin further buying trends until 1.1880 and 1.1945 levels.


GBP/USD – Daily Analysis

The GBP/USD stimulates the daily high to 1.3242, up 0.29%, while directing into the European session open. Like major pairs, the Cable restored the yearly high on Thursday ere dipping to 1.3161, which caught the two-day winning streak. After remarks from Fed Chair, the broad U.S. dollar rally pulled the quote descending the prior day. 

The greenback’s latest drops support the pair bulls before BOE Governor Andrew Bailey’s address at the Jackson Hole Symposium. While running the third bullish day in the previous four, the GBP/USD prices also spend tiny heed to the Brexit distress indicated by The Times.

The final scheduled round of post-Brexit trade negotiations between the E.U. and the U.K. have already been abandoned, but ministers are expected to appear next week. Additionally, Germany’s expulsion of Brexit discussions as agenda from next week’s critical talks amongst the E.U. representatives.

Subsequently, the uproar girdling insect repellent ingredient defending against the coronavirus (COVID-19) and 21-day immunity plan represented a mild enthusiasm at home. The sentiment overlooks the biggest daily COVID-19 problems while producing 1,522 numbers for Thursday.

On the other hand, U.S. President Donald Trump addressed to end dependence on China “once and for all.” Besides, the mystic concepts of Fed Chair Powell, involving Average Inflation Targeting (AIT), appear to decrease the allure as markets start reading between the words and spot economic worries.

 Daily Technical Levels

Support Pivot Resistance
1.3145 1.3215 1.3268
1.3092 1.3338
1.3022 1.3391

 GBP/USD– Trading Tip

The GBP/USD has distributed the trading range of 1.3240 – 1.3180, and a bullish breakout of Cable is anticipated to lead it higher unto 1.3275 mark. On the higher side, the GBP/USD faces the next resistance at 1.3275 mark and over this level, the pair may find 1.3323 resistance. Speaking about the technical side of the market, 50 periods of EMA, RSI, and MACD suggest bullish bias in the GBP/USD pair. Today, let’s look for buying trades above 1.3275 level.


USD/JPY – Daily Analysis

During Thursday’s early European trading session, the USD/JPY currency pair managed to stop its early-day losing streak and took modest bids near above 106.00 level mainly after the (BOJ) board member Hitoshi Suzuki expressing his take on the monetary policy outlook, which eventually undermined the Japanese yen and extended some support to the currency pair. 

 Meanwhile, the risk-off market sentiment, driven by the renewed US-China tussle and intensifying virus cases in Europe and Asia, tends to underpin the safe-haven Japanese yen and kept the currency pair sidelined. At this moment, the USD/JPY currency pair is currently trading at 106.02 and consolidating in the range between 105.81 – 106.08.

It is worth reporting that the Bank of Japan (BOJ) board member Hitoshi Suzuki expressed his part on the monetary policy outlook while saying that “Will ease monetary policy further without hesitation with an eye on the pandemic impact on the economy. “He also added that “If BOJ were to ease more, it could use a special program for combating pandemic, cut short-, long-term interest rates or ramp up risky asset buying.” However, these statements recently weakened the Japanese yen and provided little support to the currency pair. 

Apart from this, the Takatoshi Ito, a famous economist who was once a preferred nominee to become Bank of Japan (BOJ) governor, stated that the Japanese economy could see a quicker recovery by 2022 if a vaccine becomes available. However, the currency pair failed to give any major attention to the above headlines, as it remains flat around 106.00 due to the cautious risk tone and weaker greenback ahead of the Fed Chair Powell’s Jackson Hole speech.

Across the pond, the failure of the American lawmakers to offer any hint on the big coronavirus (COVID-19) relief package or the highest COVID-19 new cases in Italy since May, not to forget the fresh US-China tussle over the South China Sea, all factors are weighing on the market trading sentiment, which could be considered as the main factors for the currency pair limited moves. 

At the US-China front, the Trump administration plans sanctions on those companies who are helping China to mark its existence in the South China Sea. At the same time, China fired missiles in a military drill near the South China Sea. The U.S. Secretary of State Michael Pompeo criticized China for “coercive bullying tactics against our friends in the United Kingdom.” This also exerted a burden on the market trading sentiment. This, in turn, underpinned the safe-haven Japanese yen demand and capped upside momentum in the pair.

Despite the risk-off market sentiment, the broad-based U.S. dollar failed to gain any positive traction on the day, as well as the losses could be associated with the doubts about the U.S. economic recovery ahead of Fed Chairman Jerome Powell’s speech at Thursday’s Jackson Hole symposium themed. However, the losses in the U.S. dollar became the key factor that kept the currency pair’s gain limited. Whereas, the U.S. Dollar Index that tracks the greenback against a basket of other currencies dropped by 0.12% to 92.882 by 11:59 PM ET (4:59 AM GMT).

Looking forward, the market traders await the Federal Reserve Chairman Jerome Powell’s speech in the Jackson Hole Symposium. As well as, America’s preliminary readings of the second quarter (Q2) GDP, which is expected -32.5% versus -32.9% will be key to watch. In the meantime, the updates surrounding the fresh Sino-US tussle, this time over the South China Sea, as well as the coronavirus (COVID-19) updates, could not lose their significance.


Daily Technical Levels

Support Pivot Resistance
105.8700 106.2900 106.9700
105.1800 107.4000
104.7600 108.0800

USD/JPY – Trading Tips

The USD/JPY is trading bearish at 106.082 level, holding above a support level of 106, which is extended by upward channel. On the higher side, the USD/JPY expected to gain an immediate resistance around 106.566 and 107.078. Looking at the 2-hour timeframe, the 50 periods EMA is extending resistance at 106.350. Likewise, the MACD and RSI are staying in a bearish zone, beneath 50 and 0, sequentially. The USD/JPY may trade bearish below 106.350 to target 106 and 105.800. Good luck! 


Categories
Forex Market Analysis

Gold Still Controlled by the Bull

Overview

The Gold price continues developing a sideways movement, which corresponds to an incomplete corrective structure that is still incomplete. Although there is an extreme bullish sentiment among market participants, the price of the golden metal could be poised to a decline in the following trading sessions.

Market Sentiment Overview

Gold prices continue moving sideways, consolidating above the psychological barrier of $1,900. The precious metal gains of over 28% (YTD) were boosted by the US Dollar weakness, which has dropped 5.47% (YTD) so far.

Gold, in its weekly timeframe, illustrates the market sentiment of the precious metal exposed by its 52-week high and low range. In the chart, we currently distinguish the market action moving mostly sideways, on the extreme bullish sentiment zone. The indecision candle that the yellow metal developed leads us to observe a state of equilibrium between the market participants.

On the other hand, looking at the volatility of the precious metal (GVZ) exposed in its daily chart, we observe the price action is consolidating in a flag pattern in the bearish sentiment zone. At the same time, we highlight the bounce GVZ developed from the extreme bearish sentiment zone toward the bearish zone in which currently is consolidating. We see that GVZ, moving above its 60-day moving average, shows an improvement in the investors’ sentiment.

The current market context observed in the Gold Volatility Index, which is consolidating creating a flag formation, added to Gold’s retesting of  $1,917.81 per ounce, corresponding to the support of the extreme bullish sentiment zone, leads us to expect a new decline in the price of the yellow metal.

Elliott Wave Outlook

The short-term outlook under the Elliott wave perspective and illustrated in its 2-hour chart exposes the sideways movement evolving an incomplete corrective structure, after the yellow metal touched its all-time high at $2,075.14 per ounce, reached on August 06th.

Once the precious metal topped at $2,075.15 per ounce, Gold completed its fifth wave of Minuette degree, and it is drawing a corrective sequence that remains incomplete. In the previous figure, we distinguish the aggressively developed first downward leg. This fast movement drove the yellow metal to ease over 10%, finding a bottom at $1,862.32 per ounce. That gave the pass to the wave (b), identified in blue, which remains in development.

The second leg of the incomplete three-wave sequence completed its first wave of a lesser degree at $2,015.65 per ounce, starting to retrace with a lower momentum. This decelerated movement observed in the wave b of Subminuette degree, identified in green, drives us to verify the alternation principle stating that a fast move should alternate with a slow movement.

For the coming trading sessions, we expect an upward movement that would complete the wave c of Subminuette degree, in green, which at the same time would end the wave (b) in blue. Once this wave ends, the price should start to decline in a five-wave sequence corresponding to wave (c) of Minuette degree, labeled in blue. This downward scenario agrees with the potential upside observed in the Gold Volatility Index chart.

Categories
Forex Options

FX Options Market Combined Volume Expiries for 28th August 2020

Thank you for visiting the Forex Academy FX Options market combined volume expiries section. Each day, where available, we will bring you notable maturities in FX Options of amounts of $100 million-plus, and where these large combined maturities at specified currency exchange rates often have a magnetic effect on price action, especially in the hours leading to their maturities, which happens daily at 10.00 AM Eastern time. This is because the big institutional players hedge their positions accordingly. Each option expiry should be considered ‘in-play’ with a good chance of a strike if labelled in red, still in play and a possible strike if labelled in orange and ‘out of play’ and an unlikely strike if labelled in blue, with regard to the likelihood of price action meeting the strike price at maturity.

…………………………………………………………………………………………………………

FX option expiries for Aug 28 NY cut at 10:00 Eastern Time, via DTCC, can be found below.

– USD/JPY: USD amounts

  • 105.50 485m
  • 105.55 412m
  • 105.75 470m
  • 106.00 658m
  • 106.50 610m
  • 107.00 600m
  • 107.40 504m

USDJPY is in an aggressive bear trend. Several option expiries are eyed at and below 106.00

– USD/CAD: USD amounts

  • 1.3145 537m

USDCAD is oversold and the 1.3145 option is within range of a possible pullback.

– NZD/USD: NZD amounts

  • 0.6630 205m

NZDUSD is in a bull trend and close to a 3-week high. Potential for a pullback to the option expiry.

………………………………………………………………………………….

As you can see on the preferred 1-hour chart(s), we have also plotted the expiration levels at the various exchange rate maturities and we have also labelled in red, orange and blue.  Therefore, if you see option expiry exchange rates labelled in red these should be considered in-play, because we believe there is a greater chance of the expiry maturing at these levels based on technical analysis at the time of writing. There is still a lesser possibility of a strike if they are in orange and so these are ‘in-play’ too. However, if we have labelled them in blue, they should be considered ‘not in-play’ and therefore price action would be unlikely to reach these levels, which are often referred to as Strikes, at the time of the 10 AM New York cut.

Our technical analysis is based on exchange rates which may be several hours earlier in the day and may not reflect price action at the time of the maturities. Also, we have not factored in economic data releases or keynote speeches by policymakers, or potential market volatility leading up to the cut.

Although we have added some technical analysis, we suggest you take the levels and plot them onto your own trading charts and incorporate the information into your own trading methodology in order to use the information to your advantage. Remember the higher the amount, the larger the gravitational pull towards the exchange rate maturity at 10:00 AM Eastern time.

If you want to learn how forex option expiries affect price action in the spot FX market see our educational article by clicking here: https://bit.ly/2VR2Nji

DISCLAIMER: Please note that this information is for educational purposes. Also, the maturities will look more or less likely to become a strike at 10 AM NY time due to exchange rate fluctuations resulting in a different perspective with regard to technical analysis, and also due to upcoming economic data releases for the associated pairs.

Categories
Crypto Market Analysis

Daily Crypto Review, August 28 – Bitcoin Bearish as XRP Plummets

The crypto market was mostly bearish over the course of the day, with XRP losing the most out of the top cryptocurrencies. Bitcoin is currently trading for $11,341, which represents a decrease of 0.5% on the day. Meanwhile, Ethereum lost 0.44% on the day, while XRP lost 5%.

 Daily Crypto Sector Heat Map

When taking a look at top100 cryptocurrencies, Numeraire gained 29.44% on the day, making it the most prominent daily gainer. Serum (23.05%) and Uma (21.68%) also did great. On the other hand, Aragon lost 17.67%, making it the most prominent daily loser. It is followed by Kusama’s loss of 12.20% and Qtum’s drop of 11.12%.


Top 10 24-hour Performers (Click to enlarge)

Bottom 10 24-hour Performers (Click to enlarge)

Bitcoin’s dominance level has gone up quite a bit from when our previous report, with its value currently at 61.06%. This value represents a 0.71% difference to the upside when compared to our last report.

Daily Crypto Market Cap Chart

The cryptocurrency market cap has decreased slightly over the course of the day. Its current value is $353.48 billion, which represents a decrease of $6.8 billion when compared to our previous report.

_______________________________________________________________________

What happened in the past 24 hours?

_______________________________________________________________________

_______________________________________________________________________

Technical analysis

_______________________________________________________________________

Bitcoin

Bitcoin was extremely volatile in the past 24 hours, with its price ranging from $11,110 to $11,600. The largest cryptocurrency by market capitalization is still below the $11,460 resistance level and seems like its preparing a move (most likely to the downside).

The price of Bitcoin has declined by more than 6% in the last three days and that along with the fact that $700 million Bitcoin futures expiry is approaching, traders are nervous and have a bearish scenario in mind. Many technical analysts believe that Bitcoin has two paths ahead at the moment: $16,000 or $9,600.

Traders should take a look at Bitcoin’s movement around $11,460 before trading.

BTC/USD 4-hour Chart

Technical factors:
  • Price is below its 50-period EMA and 21-period EMA
  • Price is below its middle band
  • RSI is neutral but leaning towards oversold (41.82)
  • Volume is average (one-candle spike)
Key levels to the upside          Key levels to the downside

1: $11,460                                1: $11,090

2: $11,630                                2: $10,855

3: $12,015                                 3: $10,500

Ethereum

The second-largest cryptocurrency by market capitalization continued its path above the descending trend line. While being above this line is a positive thing, Ethereum is still losing value as it’s gripping the line and following it down. If ETH decides to test the upside, it will encounter some turbulence way before its major resistance at $415.

If, however, Ethereum pushes towards the downside, it will fall back into the trend and possibly rush towards the bottom trend line.

Ethereum traders should look for Ethereum’s volume spike and push towards the upside.

ETH/USD 4-hour Chart

Technical Factors:
  • Price is currently below its 21-period and 50-period EMA
  • Price is slightly below the middle band
  • RSI is neutral (45.39)
  • Volume is very low (With volume spike when the trend line was retested)
Key levels to the upside          Key levels to the downside

1: $415                                     1: $400

2: $445                                     2: $360

3: $496                                      3: $340

Ripple

XRP had an incredibly bad day, as bears took over the market and pushed its price down. The third-largest cryptocurrency by market cap dropped under the $0.266 support, and then immediately tried to head back up (without any success). While the price is still near the $0.266 level, it is unlikely that XRP will confidently move above it unless Bitcoin pulls the whole crypto market up by a sudden move to the upside.

XRP traders should look for how the cryptocurrency reacts to the $0.266 level and trade-off of that info.

XRP/USD 4-hour Chart

Technical factors:
  • The price is below its 21-period and 50-period EMA
  • Price is slightly above its lower band
  • RSI is at the oversold line (30.19)
  • Volume is unstable and cycling between average (low) and extremely high volume candles
Key levels to the upside          Key levels to the downside

1: $0.285                                   1: $0.266 

2: $0.31                                     2: $0.2454

3: $0.32                                    3:$0.235


Categories
Forex Fundamental Analysis

Impact of ‘Employment Rate’ Economic Indicator On The Forex Market

Introduction

Employment is crucial for consumer spending, which makes more than two-thirds of the GDP for many countries. Understanding the employment rate and the cascading effect it has on the economy is paramount for fundamental analysis. The factors affecting the employment rate and business cycle patterns all inherently impact economic growth and currency valuation. Hence, understanding employment as an economic indicator will strengthen our analysis.

What is Employment Rate?

Employment Rate:  It is defined as the ratio of employed to the total available labour force. Here the labour force is defined as the sum of employed and unemployed persons. It is also considered as a measure of the extent to which the labour force is being used.

Unemployment is a state where an individual is actively searching for employment but cannot find work.

Unemployment Rate: It is defined as the percentage of unemployed people to the available labour force. It is the other half of the employment rate. Employment and unemployment rate combined should yield results as 100% as it equals the total available labour force.

How can the Employment Rate numbers be used for analysis?

Employment and unemployment can be considered as the two sides of the same coin. We can derive our fundamental conclusions from either direction. Employment Rate is essential for our analysis because it has a direct and cascading impact on consumer spending. In the US, consumer spending accounts for about 70% of the total GDP.

A high employment rate indicates that more people in the labour force have income that they can spend on purchasing goods and services. When consumer spending is on the rise, businesses flourish, leading to better wages, or even more employment. Overall, employment in one sector has an indirect positive effect on dependent sectors and a direct positive effect on the economy.

The Government is also politically committed to ensuring a low unemployment rate; otherwise, citizens will not favour them in the next elections. By providing proper support to local businesses, the Government can increase employment in the short run.

A high unemployment rate is very damaging to the economy. As more people are unemployed, there is a direct negative effect on consumer spending. In this scenario, also the cascading effect works and makes the situation worse. It also hurts the employed people.

Increased unemployment in the economy can bring down the employed morale, making them feel guilty for being employed while their colleagues are unemployed. It can also make employed people feel less secured and discourage their spending habits, and they may end up saving for a rainy day. Employed people may feel lucky enough to have a job that inhibits them from applying for better opportunities amid high unemployment.

Employment and Unemployment rates can also help investors to keep a pulse on the health of the economy. Overall it is essential to make sure the employment rate is always high and does not take a dip. Even when the unemployment rate rises linearly, it has an exponential impact on economic growth, and hence the central authorities try to avoid it at all times.

It is also essential to understand that employment rates are sensitive to business cycles in the short run. Hence, seasonally adjusted versions of the same are more useful for analysis. In the long run, the employment rates are significantly affected by government policies on higher education and income support. Policies that focus on the employment of women and disadvantaged groups also help increase the employment rate.

Both developing and underdeveloped countries’ governments have to focus on education policies and employment opportunities for their labour force if economic growth is the primary concern. Literacy and higher education in underdeveloped and developing nations have helped the economies grow stronger year-on-year.

Employment rates are coincident indicators and can also be used to predict or confirm oncoming recessionary or recovery periods, if any. The onset of a recession is accompanied by a massive unemployment rate or decreased employment rates. Hence, despite the propaganda of the media and Government, we can use employment data actually to confirm whether the economy is growing or stagnating. Accordingly, during recovery periods, employment rates start on a recovery trajectory back to its previous normal.

Impact on Currency

As an increase in employment rate points towards a growing economy, a high employment rate is good for the GDP and the currency. Hence, the employment rate is a proportional coincident indicator. An increase or decrease in employment rate is suggestive of improving or deteriorating the economy, respectively.

The forex market watches the unemployment rate more closely than the employment rate itself. Significant changes in the employment rate or the unemployment rate tend to have a considerable impact on market volatility. Still, generally employment rate in itself is a low impact indicator compared to the unemployment rate.

Employment change, initial jobless claims also precede unemployment rates, and the desired effects are already factored into the market before the employment rates are released. Hence, overall it is a low impact indicator.

Economic Reports

In the United States, the BLS surveys and tracks monthly employment and unemployment within the country. It classifies them based on geography, sex, race, industry, etc. The Employment Situation report is also published by the BLS, and it goes as far back as the 1940s. It is released by BLS on the first Friday at 8:30 AM Eastern Standard Time every month.

Sources of Employment Rate

The US BLS publishes monthly employment and unemployment reports on its official website. We can also find the same indexes and statistics of various categories on the St. Louis FRED. We can also find employment rate statistics published by the OECD countries here. Consolidated reports of employment rates of most countries can also be found in Trading Economics.

How Employment Rate News Release Affects The Price Charts

As we have already established, an increase or decrease in the employment rate can be used to gauge whether the economy is performing well or poorly. For forex traders, it is therefore imperative to understand how the news release of this macroeconomic indicator will impact the price action on various currency pairs.

In the US, employment reports are released monthly, usually on the first Friday after the month ends. The latest, expected, and all historical figures are published on the Forex Factory website. We can find the most recent release here. Below is a screengrab of the US unemployment rate from the Forex Factory website. On the right, we can see a legend that indicates the level of impact the Fundamental Indicator has on the corresponding currency.

As shown, the unemployment rate is a high impact indicator. The snapshot below shows the change in the US unemployment rate as released on August 7, 2020, at 1230GMT. For July 2020, the unemployment rate declined from 11.1% to 10.2%, beating the 10.5% decline forecasted by analysts.

Now, let’s see how this news release made an impact on the Forex price charts.

EUR/USD: Before Employment Data Release August 7, 2020, Just Before 1230GMT

The 30-minute EUR/USD chart above shows the market is on a downtrend from 0200 to 1200 GMT with the candles forming below the 20-period Moving Average. More so, the market was trading within a narrow price channel of between 1.1850 and 1.1810, indicating a calm market with traders waiting for the latest employment data to gauge the economic recovery.

EUR/USD: After Employment Data Release August 7, 2020, 1230GMT

As can be shown on the chart above, immediately after the news release, we can observe a sudden downward spike with a retraction. This spike indicates the market is having mixed reactions to the positive employment news hence the strong USD.

After the initial spike, the market can be seen to ‘absorb’ the positive news. The pair adopted a bearish outlook with the price breaking and staying below the earlier observed 1.1810 resistance level.

Since the pair had not shown any unexpected sudden swings before and after the new release, trading the news would have been profitable. For such a high impact economic indicator, it is advisable to open positions after the news release to avoid being caught on the losing end of the trend.

Now, let’s quickly see how this new release has impacted some of the other major Forex currency pairs.

GBP/USD: Before Employment Data Release August 7, 2020, Just Before 1230GMT

GBP/USD: After Employment Data Release August 7, 2020, 1230GMT

The GBP/USD pair showed a similar trend as the one observed with EUR/USD. The pair can be seen to have traded within a narrow price channel of 1.3122 and 1.3071 from 0700 to 1200 GMT. After the economic data release, the pair similarly had a sudden spike. It later adopted the same bullish stand as the EUR/USD pair, with price breaking and trading below the observed resistance level.

AUD/USD: Before Employment Data Release August 7, 2020, Just Before 1230GMT

GBP/USD: After Employment Data Release August 7, 2020, 1230GMT

Similar to the EUR/USD and the GBP/USD pairs, the AUD/USD traded within a price channel of 0.7221 and 0.7196 and no unexpected spikes before the news release. After the news release, a sudden spike can be observed with an accompanying retraction, and later the pair adopted a bullish stance breaking below the observed resistance level.

From the above analysis, the subdued market volatility before the release of the employment data and the subsequent volatility, it is evident that the employment rate is high impact indicator anticipated by forex traders.

Categories
Forex Elliott Wave Forex Market Analysis

Dow Jones: Still no New Record High Confirmation

Overview

The Dow Jones Industrial Average continues its advances toward the green side. During this year, it is still easing 1.08% (YTD). The DJIA index, which groups to the 30 largest capitalized U.S. companies, move in the extreme bullish sentiment zone unveiling the probability of new record highs in the U.S. stock market. Likely, it could find resistance at the 30,000 pts as a psychological barrier confirming the all-time highs observed both S&P 500 and NASDAQ 100.

Market Sentiment Overview

During this year, the Dow Jones Industrial Average eases 1.08% (YTD), returning from the bear market to bull market side. The recovery experienced by the Industrial Average, carried it to jump from the lowest level of the year at 18,213.5 pts to 28,287 pts gaining over 55%. 

The following figure compares the advance of Dow Jones and the S&P 500 in its weekly timeframe. In these two charts, we observe that both indexes move in the extreme bullish sentiment zone. However, although surprising, the recovery observed in the U.S. stock market, the Industrial Average still doesn’t confirm the all-time high of the S&P 500, reached on the latest trading sessions

If we look at the Dow Jones’ volatility (VXD), it is running below the 60-day moving average, which confirms that the market sentiment continues being in favor of fresh upsides on the Industrial Average.

Finally, considering that both NASDAQ 100 and S&P 500 reached fresh all-time highs in the latest sessions, the Dow Jones should follow the same path in the coming trading sessions.

Elliott Wave Outlook

The mid-term outlook for the Industrial Average provided by the Elliott Wave Analysis reveals the bullish continuation of the incomplete wave B of Minor degree labeled in green, which could push it toward new all-time highs.

The next 4-hour chart illustrates the price running in an uptrend that began on March 23rd when the U.S. Blue Chip index found fresh buyers at 18,213.5 pts, developing a corrective structural sequence that remains incomplete.

Once the Industrial Average broke upward the (b)-(d) upper-line of the triangle drawn by the wave ((b)) of Minor degree, the price activated its progression as wave ((c)), which is characterized by the inclusion of five internal waves. 

Currently, Dow Jones continues its development in an incomplete wave (iii) of the Minuette degree labeled in blue. Simultaneously, the bullish trendline looks intact, which leads us to conclude that the uptrend remains sound, calling for more upsides in the following trading sessions.

Finally, considering that both the S&P 500 and NASDAQ 100 reached new record highs, we expect further upsides and record highs on Dow Jones. A potential target could be at 30,000 pts as this psychological barrier will be a natural profit-taking level.

Categories
Crypto Market Analysis

Daily Crypto Review, August 27 – $700 Million of Bitcoin Options Expiring on Friday: Prepare for Volatility

The crypto market was split between cryptos that ended up in the green and in the red, with a bit more cryptocurrencies ending up gaining in the past 24 hours. Bitcoin is currently trading for $11,374, which represents an increase of 0.14% on the day. Meanwhile, Ethereum gained 0.77% on the day, while XRP lost 0.36%.

 Daily Crypto Sector Heat Map

When taking a look at top100 cryptocurrencies, Celo gained 56.49% on the day, making it the most prominent daily gainer. Aragon (36.44%) and Siacoin (17.45%) also did great. On the other hand, The Midas Touch lost 20.75%, making it the most prominent daily loser. It is followed by Kusama’s loss of 8.81% and Reserve Rights’ drop of 8.72%.

Top 10 24-hour Performers (Click to enlarge)

Bottom 10 24-hour Performers (Click to enlarge)

Bitcoin’s dominance level has stayed at the same place as we reported yesterday, with its value currently at 60.35%. This value represents a 0.01% difference to the upside when compared to our last report.

Daily Crypto Market Cap Chart

The cryptocurrency market cap has increased significantly over the course of the day. Its current value is $360.28 billion, which represents an increase of $24.61 billion when compared to our previous report.

_______________________________________________________________________

What happened in the past 24 hours?

_______________________________________________________________________

_______________________________________________________________________

Technical analysis

_______________________________________________________________________

Bitcoin

Bitcoin has had somewhat a slow day after bottoming out near $11,090. The largest cryptocurrency by market cap tried to break the $11,460 resistance level at one point, but it ended up unsuccessfully. Bitcoin will need to gather quite a strong bullish presence if it wants to reach $12,000 anytime soon, as the upside is guarded by way too many smaller and bigger resistance levels.

With $700 million of Bitcoin options expiring on Friday, we may see a nice spike in volume and volatility. Various analysts predict that the price at its current position would be a good buying opportunity for futures traders, while a price near $12,000 would be a good sell opportunity.

Traders should take a look at Bitcoin’s movement around $11,460.

BTC/USD 4-hour Chart

Technical factors:
  • Price is below its 50-period EMA and 21-period EMA
  • Price is between its lower and middle band
  • RSI is neutral but leaning towards oversold (41.02)
  • Volume is average
Key levels to the upside          Key levels to the downside

1: $11,460                                1: $11,090

2: $11,630                                2: $10,855

3: $12,015                                 3: $10,500

Ethereum

While it did not do much better than Bitcoin in terms of daily gains, Ethereum had a decent day. The second-largest cryptocurrency by market cap gathered a small bullish force to push through the descending trend. Not only did Ethereum push past it, but it also confirmed its position above it. With that being said, Ethereum needs a significant volume spike if it wants to reach past $400, or go any higher than that.

However, with DeFi booming and gathering interest from traders (and even creating new ones), Ethereum might be on the right track to show its true bullish nature in the mid-term.

Ethereum traders should look for Ethereum’s volume spikes and trade-off of that.

ETH/USD 4-hour Chart

Technical Factors:
  • Price is currently below its 21-period and 50-period EMA
  • Price is between its lower and middle band
  • RSI is neutral (44.63)
  • Volume is very low
Key levels to the upside          Key levels to the downside

1: $415                                     1: $400

2: $445                                     2: $360

3: $496                                      3: $340

Ripple

XRP was the only cryptocurrency in the red in the past 24 hours out of the top3 cryptocurrencies by market cap. After bottoming out near $0.266 and recovering to around $0.28, XRP started dropping slightly again, reaching the current price of $0.275. The low volume and candles with small bodies and small wicks show almost no volatility in trading.

XRP traders should look for a volume spike before even considering a trade.

XRP/USD 4-hour Chart

Technical factors:
  • Price is below its 21-period and 50-period EMA
  • Price is between its lower and middle band
  • RSI stable and leaning towards the oversold area (38.69)
  • Volume is below average and stable
Key levels to the upside          Key levels to the downside

1: $0.285                                   1: $0.266 

2: $0.31                                     2: $0.2454

3: $0.32                                    3:$0.235


Categories
Forex Market Analysis

Daily F.X. Analysis, August 27 – Top Trade Setups In Forex – U.S. Fed Chair Powell Speaks! 

On the fundamental side, the eyes will remain on the U.S. Prelim GDP, Unemployment rate, and Fed Chair Powell Speaks, which is due during the U.S. session. U.S. economy is once again expected to report a massive dip in the U.S. GDP data. At the same time, the Jobless Claims may improve a bit. Overall, the Fed Chair Powell Speaks will be the main highlight of the day as it may determine further sentiment about the U.S. dollar depending upon the dovish or hawkish tone of Powell.

Economic Events to Watch Today  


EUR/USD – Daily Analysis

The EUR/USD pair was closed at 1.18300 after placing a high of 1.18391 and a low of 1.17720. Overall the movement of the EUR/USD pair remained flat yet slightly bearish throughout the day. The Euro to U.S. Dollar exchange rate remained flat throughout the day and dropped in late Wednesday. The EUR/USD pair lost some of its previous daily gains earned on the back of stronger than expected German GDP data for the second quarter of this year.

The President at IFO Institute, Clemens Fuest, said that the German economy was on track to recovery as the German companies assessed their current business situation markedly more positively than last month. He said that the manufacturing sector’s business climate had improved considerably; however, many manufacturers still consider their current business to be poor.

Whereas, the resurgence of coronavirus pandemic in Europe increased the concerns for another wave of the Eurozone outbreak. Spain has recorded 80,000 new coronavirus cases over the last two weeks; the rate was by far the most in Western Europe. Germany reported 1576 new cases on Wednesday and increased the total count to 236,429.

The travel warning for countries outside Europe has been extended to September 14, as announced by the German Foreign Ministry on Wednesday. Meanwhile, Health Minister Jens Spahn has said that coronavirus testing’s capacity was limited in the country. In France, the Government warned that a second wave could hit the country as early as November. Furthermore, the E.U. trade commissioner Phil Hogan resigned after the Irish Government accused him of breaching COVID-19 guidelines. He attended a golf dinner with more than 80 people in a County Galway on August 19 and was criticized for not complying with quarantine rules while traveling.

Mr. Hogan denied breaking any law and said that he should have been more rigorous concerning the COVID-19 guidelines. These virus-related concerns kept weighing on the local currency Euro and kept the pair EUR/USD under pressure throughout the day.

On the U.S. front, the U.S. dollar was low on the day ahead of Fed Chair Jerome Powell’s speech scheduled for Thursday. The speech is expected to be dovish and provide fresh clues about the delayed U.S. next stimulus package and is weighing on the market sentiment.

However, the U.S. macroeconomic data remained supportive of the U.S. dollar as the Core Durable Goods Orders rose to 2.4% in July from the projected 1.9% and supported the U.S. dollar. The Durable Goods Orders also raised to 11.2% from the anticipated 4.4% and supported the U.S. dollar. The U.S. data added further pressure on EUR/USD pair, and the pair moved in a downward direction in the late American session after moving sideways throughout the day.

Daily Technical Levels

Support Pivot Resistance
1.1787 1.1814 1.1856
1.1744 1.1884
1.1717 1.1926

 EUR/USD– Trading Tip

The EUR/USD is trading sideways, holding below a double top resistance area of 1.1849 level. On the downside, the EUR/USD is likely to find support at 1.1804, while a bearish breakout of 1.1804 level can trigger selling until 1.1775 level. In case of a bullish breakout, the EUR/USD pair may trigger further buying trends until 1.1879 and 1.1945 levels.

GBP/USD – Daily Analysis

The GBP/USD currency pair managed to gain some positive traction and drew some modest bids near above 1.3200 level on the day mainly due to the broad-based U.S. dollar weakness, triggered by the cautious sentiment ahead of U.S. Federal Reserve (Fed) Chair Jerome Powell’s speech. Apart from this, the lack of progress over the much-awaited U.S. fiscal stimulus also weighed on the safe-haven U.S. dollar and contributed to the currency pair gains.

On the contrary, the downbeat report from the Confederation of British Industry (CBI) and negative remarks by the Organisation for Economic Co-operation and Development (OECD) also exerted some downside pressure o the currency pair. On the other hand, the cancelation of the negotiations over the U.K. and the European Union’s post-Brexit relationship also becomes the key factor that kept the lid on any additional gain in the currency pair. At this particular time, the GBP/USD currency pair is currently trading at 1.3207 and consolidating in the range between 1.3195 – 1.3223.

As per the CBI report, the companies reliant on spending by consumers – many of which only opened in recent weeks after the lockdown – cut jobs faster on record. However, these comments initially weighed on the currency pair. In the meantime, the OECD noted the British economy’s record quarterly fall as worrisome. In turn, this undermined the sentiment around the British Pound and contributed to the currency pair modest losses.

Also weighed on the quote was the reports that the E.U. representatives have dropped the discussions over the U.K. and the European Union’s post-Brexit relationship as a subject for the next week’s meeting. However, these gloomy headlines overshadowed the previous day’s positive comments from the Irish leader Michael Martin.

The fresh challenges to the US-China relations exerted further downside pressure on the market trading sentiment across the pond. It is worth reporting that the Trump administration considers imposing sanctions on those companies helping China mark its presence in the South China Sea. This happens after the dragon nation fired missiles in the drills around the debatable region.

At the USD front, the broad-based U.S. dollar was down on Thursday morning in Asia ahead of U.S. Federal Reserve Chairman Jerome Powell’s speech at the Jackson Hole symposium later. Whereas, the losses in the U.S. dollar become the key factor that kept the GBP/USD currency pair higher. Whereas, the U.S. Dollar Index that tracks the greenback against a basket of other currencies dropped by 0.12% to 92.882 by 11:59 PM ET (4:59 AM GMT).

Looking forward, the market traders await the Federal Reserve Chairman Jerome Powell’s speech in the Jackson Hole Symposium. As well as, America’s preliminary readings of the second quarter (Q2) GDP, which is expected -32.5% versus -32.9% will be key to watch. In the meantime, the updates surrounding the fresh Sino-US tussle, this time over the South China Sea, and the coronavirus (COVID-19) updates, could not lose their importance.


Daily Technical Levels

Support Pivot Resistance
1.3144 1.3182 1.3247
1.3079 1.3285
1.3040 1.3351

 GBP/USD– Trading Tip

The GBP/USD has distrub[ted the narrow trading range of 1.3140 – 1.3056, and upward breakout of GBP/USD is expected to lead the Cable prices further higher until 1.3262 mark. On the upper side, the GBP/USD pair may face the next resistance around 1.3262 mark and above this 1.3295. Technically, 50 periods of EMA, RSI, and MACD all are suggesting a bullish trends in the GBP/USD pair. Let’s look for buying trades above 1.3146 level.

USD/JPY – Daily Analysis

The USD/JPY was closed at 105.985 after placing a high of 106.554 and a low of 105.954. After posting gains for three consecutive days, USD/JPY pair declined on Wednesday amid the broad-based U.S. dollar weakness ahead of Fed Chair Jerome Powell’s speech on Thursday.

The traders were selling USD/JPY pair over the rising hopes that a next stimulus package was on its way. As in result, the U.S. Dollar Index (DXY) fell by 0.1% against its rival currencies and weighed further on the U.S. dollar that dragged the currency pair on the low side.

The Chairman of Federal Reserve, Jerome Powell, will deliver a speech via video conference at Jackson Hole Symposium on the next day and provide an annual central bank’s monetary policy framework review.

Investors believe that the speech will make a strong case about the monetary stimulus, so they are awaiting it to find fresh clues about how the Fed will support the economy further through the coronavirus pandemic crisis.

Another reason behind waiting for the Fed’s Chair Powell’s speech is to determine whether Fed will favor shifting from a long-run inflation target of 2% to an average level of inflation as it will raise inflation and will make the U.S. dollar weak before raised interest rates.

The U.S. dollar was lower on the day ahead of the next stimulus measure as Powell’s dovish expectations increased. If Powell’s speech provided the expected clues, then the U.S. dollar will fell even more and weighed on USD/JPY to move it below 104 level.

Whereas, on the data front, at 04:50 GMT, the SPPI for the year from Japan rose to 1.2% from the expected 0.8% and supported Japanese Yen and added losses in currency pair. From the U.S. side, the Core Durable Orders for July rose to 2.4% from the expected 1.9% and supported the U.S. dollar. The Durable Goods Orders for July also rose to 11.2% from the estimated 4.4% and supported the U.S. dollar. The strong U.S. dollar capped additional losses in the USD/JPY on Wednesday.

Meanwhile, the additional losses in currency pair were supported by the rising tensions between the U.S. & China. On Wednesday, 24 Chinese companies were penalized by the Trump Administration due to their contribution to China’s controversial island-building campaign.

The U.S. banned Chinese companies from buying the U.S. products citing their role in helping the Chinese military construct artificial islands in the disputed South China Sea. The U.S. had already penalized dozens of Chinese companies over national security concerns and violations of human rights, and now China’s encroachment in the South China Sea has also added in it. Now it is remained to see the response of China over this penalty by the U.S. The ongoing tensions between the U.S. & China added strength in Japanese Yen that further supported the USD/JPY pair’s bearish trend on Wednesday.

Meanwhile, the risk sentiment that took its pace yesterday on the back of renewed hopes on the vaccine was faded away after the latest warning from the top U.S. virus expert Dr. Anthony Fauci. He said that before the vaccine’s approval for safety and efficiency, the usage of vaccines could be harmful. He warned that it could affect the development of other vaccines.

President Donald Trump had considered plans to put out a vaccine before it was tested and approved to increase his re-election chances in upcoming November’s presidential elections. Democrats have blamed Trump for endangering American lives for political gain. It has also weighed on risk sentiment and added in the currency pairs losses on Wednesday.

Daily Technical Levels

Support Pivot Resistance
105.7600 106.1600 106.3700
105.5500 106.7700
105.1500 106.9800

USD/JPY – Trading Tips

The USD/JPY is consolidating in an upward channel, which is supporting the pair at 105.820. On the upper side, the USD/JPY is likely to gain an immediate resistance around 106.566 as well as 107.078. Looking at

the 2-hour chart, the 50 periods EMA is extending resistance at 106.069. Simultaneously, the MACD and RSI are holding in a selling zone, below 50 and 0, respectively. The USD/JPY may trade bullish over 105.850 to target 107.084 and selling below 105.829. Good luck! 


Categories
Forex Options

FX Options Market Combined Volume Expiries for 27th August 2020

Thank you for visiting the Forex Academy FX Options market combined volume expiries section. Each day, where available, we will bring you notable maturities in FX Options of amounts of $100 million-plus, and where these large combined maturities at specified currency exchange rates often have a magnetic effect on price action, especially in the hours leading to their maturities, which happens daily at 10.00 AM Eastern time. This is because the big institutional players hedge their positions accordingly. Each option expiry should be considered ‘in-play’ with a good chance of a strike if labelled in red, still in play and a possible strike if labelled in orange and ‘out of play’ and an unlikely strike if labelled in blue, with regard to the likelihood of price action meeting the strike price at maturity.

…………………………………………………………………………………………………………

FX option expiries for Aug 27 NY cut at 10:00 Eastern Time, via DTCC, can be found below.

– EUR/USD: EUR amounts

  • 1.1750 530m
  • 1.1755 658m
  • 1.1800 581m
  • 1.1900 1.0bn
  • 1.1950 823m

EURUSD has been contained in a relatively narrow range considering the market volatility recently. Expect more of the same with US Dollar volatility after US data and Fed speech later today.

– USD/JPY: USD amounts

  • 104.90 425m
  • 105.00 1.7bn
  • 105.50 890m
  • 105.75 706m
  • 106.50 404m
  • 106.60 706m
  • 107.00 441m
  • 107.15 353m

USDJPY Support and resistance as displayed on the chart with 2 likely candidates for a strike. Again, US data will pave the way for the next move.

– AUD/USD: AUD amounts

  • 0.7190 587m

AUDUSD will be dependent on US dollar strength/weakness. Potential for a topping off at 0.7250 and a reversal.

– USD/CAD: USD amounts

  • 1.3100 554m
  • 1.3250 520m

USDCAD rangebound at least until US data and Fed Chair speech before the New York cut.

………………………………………………………………………………….

As you can see on the preferred 1-hour chart(s), we have also plotted the expiration levels at the various exchange rate maturities and we have also labelled in red, orange and blue.  Therefore, if you see option expiry exchange rates labelled in red these should be considered in-play, because we believe there is a greater chance of the expiry maturing at these levels based on technical analysis at the time of writing. There is still a lesser possibility of a strike if they are in orange and so these are ‘in-play’ too. However, if we have labelled them in blue, they should be considered ‘not in-play’ and therefore price action would be unlikely to reach these levels, which are often referred to as Strikes, at the time of the 10 AM New York cut.

Our technical analysis is based on exchange rates which may be several hours earlier in the day and may not reflect price action at the time of the maturities. Also, we have not factored in economic data releases or keynote speeches by policymakers, or potential market volatility leading up to the cut.

Although we have added some technical analysis, we suggest you take the levels and plot them onto your own trading charts and incorporate the information into your own trading methodology in order to use the information to your advantage. Remember the higher the amount, the larger the gravitational pull towards the exchange rate maturity at 10:00 AM Eastern time.

If you want to learn how forex option expiries affect price action in the spot FX market see our educational article by clicking here: https://bit.ly/2VR2Nji

DISCLAIMER: Please note that this information is for educational purposes. Also, the maturities will look more or less likely to become a strike at 10 AM NY time due to exchange rate fluctuations resulting in a different perspective with regard to technical analysis, and also due to upcoming economic data releases for the associated pairs.

Categories
Forex System Design

Creating Your First Trading System – Part 1

Introduction

In our previous articles, we presented the introductory concepts to design, create, test, optimize, and evaluate a trading system. In this section, we will be using a practical example of the development process of a trading system.

Starting to Build the Trading System

In his work, Robert Pardo exposes a seven-step methodology that must be followed to develop a trading system. These steps are as follows:

  1. Formulate the trading strategy.
  2. Write the rules in a precise form.
  3. Test the trading strategy.
  4. Optimize the trading strategy.
  5. Trade the strategy.
  6. Monitor the trading performance and compare it to test performance.
  7. Improve and refine the trading strategy.

Picking a Trading Strategy

A trading system starts with an investment idea that could arise from a publication in a specialized trading site or another related source. In our case under study, we are going to develop a trading strategy based on the Turtle Traders. 

Our reader must consider that the process applies to any other strategy.

The Turtle Trading System Rules

The Turtle System uses the following set of rules:

  • Timeframe: Daily range.
  • Entry:
  • Richard Dennis defined two systems; the first one corresponds to a short-term strategy considering the 20-day breakout. In parallel, He added a long-term system using the 55-day breakout. In our system, we will be conservative and use the long-term strategy based on the 55-day breakout.
  • Stop Loss: The stop loss should be placed a the distance corresponding to one time the Average True Range (ATR) of the 20 days.
  • Exit: The system developed by Richard Dennis doesn’t consider a specific take-profit level as it happens with some chartist patterns. Instead, Dennis defines the exit criterion after the price moves against the position for a 10-day and a 20-day breakout. For long positions, the exit will be a 20-day low, and for short positions will correspond to 20-day high. However, to simplify our system, we will consider a profit target level at one  20-day Average True Range distance (1 20-ATR).
  • Position Size: The size will correspond to 1% of the capital available in the trading account.
  • Adding Positions: For educational purposes, we will not consider increasing the positioning criterion.

Charting the Turtle Trading System

As a way to visualize what our first version of the trading system should do, we will illustrate the strategy on a chart for both long and short positions.

In the previous figure, we can observe the set of rules for the entry, stop-loss, and profit-target.  The rule of position sizing will correspond to 1% of capital in the trading account.

Conclusions

In this first part, we identified a trading strategy and specified a set of rules corresponding to what the system should do. In the next educational article, we will start to transform the ideas into a set of instructions.

Suggested Readings

  • Jaekle, U., Tomasini, E.; Trading Systems: A New Approach to System Development and Portfolio Optimisation; Harriman House Ltd.; 1st Edition (2009).
  • Pardo, R.; Design, Testing, and Optimization of Trading Systems; John Wiley & Sons; 1st Edition (1992).
  • Faith, C. M.; Way of the Turtle. New York: McGraw-Hill; 1st Edition (2007).


Conclusions


Suggested Readings

  • Jaekle, U., Tomasini, E.; Trading Systems: A New Approach to System Development and Portfolio Optimisation; Harriman House Ltd.; 1st Edition (2009).
Categories
Forex Fundamental Analysis

Everything About Deposit Interest Rate as a Macro Economic Indicator

Introduction

Deposit Interest Rates play a crucial role in controlling the flow of money within the economy and the international market. The interest rate differentials have always directed the flow of speculative money in and out of countries, thereby affecting the currency exchange rates. Hence, it is crucial to understand Deposit rates as an economic factor in the FOREX industry.

What is Deposit Interest Rate?

Deposit Interest Rate: It is the money financial institutions pay the depositing party. The deposit account holders put some money in the bank for which the bank pays out interest. Deposit accounts can be a savings account, Certificates of Deposit (CD), and self-directed deposit retirement accounts.

Banks give loans to its customers at a higher rate than the interest they pay out on their deposit accounts. It is this spread between the lending rate and deposit rate that banks make their profit and is called Net Interest Margin.

How can the Deposit Interest Rate numbers be used for analysis?

Potentially, banks are free to set their deposit rates at whatever rate they desire, but they have to keep competition and business into account. Deposits provide financial institutions with the necessary liquidity to maintain business and give out more loans. Banks need to give out loans to make a profit, but also needs to have depositors to provide the required liquidity. Within the country, when the deposit interest rates are low, people would be more interested in investing their money in stocks or other money markets where there is a possibility of a higher return on their capital.

Conversely, banks may increase their deposit rates to attract investors to deposit their capital providing banks with the necessary liquidity to fund their loans. Investors see bank deposits as a safe bet against the risky stock or money markets where they are subjected to a potential loss. Customers are also encouraged to save more and spend less when they get a higher return on their deposits. In the international markets, investors check and compare the lending and deposit rates of major banks in different countries. When the deposit rate of a bank in one country is higher than the lending rate of a bank in another country, there is a chance of making money.

Investors, traders, or some institutions may borrow money from a low-interest rate country and deposit in another country where the rates are high. This difference in the lending and deposit rates amongst banks of different countries is called Interest Rate Differential or ‘Carry.’ For example, let us assume when the deposit rate in Australia is 5%, and the lending rate in the United States is 3.5%. The difference of 1.5% return will move the speculative or “hot” money out of the United States and into Australia. When the Australian Dollars start to flow into the country, the global FOREX market is deprived of the AUD currency, and, hence, it is appreciated.

The below plot also shows the historical difference between the interest rates differential (AUS IR – USA IR) and the AUD USD exchange rate. As we can see, whenever the difference between the interest rates rises in favour of AUD, the exchange rate tends to follow. There is a good correlation between both in the long run. Whenever the direction changes in favour of the United States, so does the exchange rate.

Hence, the “carry” essentially directs the flow of “hot” money in and out of countries whenever there is an increase in interest rates differentials. The larger the difference and consistent the direction of the differential in the plot (positive or negative) more will be the inflow of money in that direction.

When the differential is near or close to zero, then the speculative money may be forced into other options to generate revenue. The interest rate differential may be prominent when paired against small and developing countries to that of developed countries in general. As most of the developed economies are struggling to maintain their growth and have been forced to keep interest rates low, it indeed is a little tricky to find currency pairs to generate a significant carry.

Impact on Currency

Deposit rates have a definite impact on the currency markets. It is one half of the money flow equation. When the lending rates and deposit rates are checked and compared, money flow starts in favour of the higher deposit rate country that appreciates the currency value and vice-versa.

Therefore, deposit rates alone do not determine currency value fluctuations. But in general, it is safe to say that higher deposit rates tend to appreciate currency’s value as the market is deprived of that currency. Conversely, low-interest rates on deposits discourage saving and thereby go into spending, which contributes to inflation and currency depreciation.

Economic Reports

The deposit interest rates of local banks can be found on the respective banks from which we would want to borrow money. But in general, the deposit rates and lending rates due to market forces are subject to be close to the country’s Central Bank’s target rate.

For the United States, it is the Fed Funds target rate, and the actual rate is called the effective Fed Funds rate. The Federal Reserve publishes Monday to Friday the daily Interest Rates in its H.15 report at 4:15 PM on its official website. Weekly, Monthly, Semi-annual and Annual rates of the same are also available.

Sources of Deposit Interest Rate

The United States Fed Rates are available here. The monthly effective Fed Funds rates are available in a more consolidated and illustrative way for our analysis in the St. Louis FRED website. Consolidated Deposit Interest Rates of different countries are available here.

How Deposit Interest Rate Affects Price Charts

For forex traders, monitoring other economic indicators is usually meant to help them predict what interest rates are going to be in the future. However, since the deposit interest rates largely depend on the federal funds rate, they rarely have any significant impact on the forex markets by itself. It is worth noting that the US FOMC only meets eight times in a year to determine the federal funds’ target rate. This explains the lack of impact by the deposit interest rate.

In the US, the Fed Funds target rate, on which deposit interest rates are based on, are published every weekday at 4.15 PM ET. Below is a screengrab of the Fed Funds target rate from August 11 to August 17, 2020.

As can be seen, the rate has remained the same at 0.1%. The screenshot below is from Forex Factory, showing that the latest FOMC decision recommended that the Fed Funds target rate remains between 0% and 0.25%.

Now that we’ve established the impact that the deposit interest rate has on the economy and the currency valuation let’s see how it impacts the price action of some select currency pairs.

EUR/USD: Before Effective Fed Funds Rate Release August 17, 
2020, Just Before 4.15 PM ET

The 15-minute EUR/USD chart above shows that the market between 10.15 AM and 4 PM ET on August 17, 2020, had no specific trend. The market has adopted an almost neutral stance with the candles forming just around the flattening 20-period Moving Average.

EUR/USD: After Effective Fed Funds Rate Release August 17, 
2020, 4.15 PM ET

As can be seen on the chart above, immediately after the daily update on the Effective Fed Funds rate, there is a slightly bullish 5-minute candle forms. The news, however, is not significant enough to the market to cause any spikes or change the prevailing market trend. As can be seen, the pair continued with its neutral trend and a flattening 20-period Moving Average.

Let’s see how this new release has impacted some of the other major Forex currency pairs.

GBP/USD: Before Effective Fed Funds Rate Release August 17,
2020, Just Before 4.15 PM ET

The neutral trend observed with the EUR/USD pair before the daily release of the Effective Fed Funds Rate can be seen on the GBP/USD chart above. The candles formed just around the flattening 20-period Moving Average.

GBP/USD: After Effective Fed Funds Rate Release August 17, 
2020, 4.15 PM ET

After the news release, a 15-minute bullish candle forms. However, the same neutral trends persist with the pair indicating that the news was not significant enough to move the markets and cause a change in the trend.

AUD/USD: Before Effective Fed Funds Rate Release August 17, 
2020, Just Before 4.15 PM ET

AUD/USD: After Effective Fed Funds Rate Release August 17,
2020, 4.15 PM ET

Unlike with the EUR/USD and the GBP/USD pairs, the AUD/USD pair had a clear uptrend before the daily release of the Effective Fed Funds Rate. This uptrend was not a steady one since the candles formed just above an almost flattening 20-period Moving Average. After the news release, a bullish 15-minute candle is formed. The news was, however, not significant enough to alter the prevailing market trend.

While the deposit interest rate is vital in determining the flow of money in an economy, it plays an almost insignificant role in moving the forex markets. Cheers.

Categories
Crypto Market Analysis

Daily Crypto Review, August 26 – Bitcoin in a Downtrend; Altcoins Following Bitcoin

Almost every single cryptocurrency in the top100 ended up in the red today, as Bitcoin fell below $11,630. Bitcoin is currently trading for $11,334, which represents a decrease of 2.34% on the day. Meanwhile, Ethereum lost 3.84% on the day, while XRP lost 2.57%.

 Daily Crypto Sector Heat Map

When taking a look at top100 cryptocurrencies, Kusama gained 35.49% on the day, making it the most prominent daily gainer. Aragon (18.33%) and The Reserve Rights (14.61%) also did great. On the other hand, Flexacoin lost 12.17%, making it the most prominent daily loser. It is followed by Ocean Protocol’s loss of 10.15% and Verge’s drop of 9.60%.

Top 10 24-hour Performers (Click to enlarge)

Bottom 10 24-hour Performers (Click to enlarge)

Bitcoin’s dominance level has increased slightly, with its value currently at 60.34%. This value represents a 0.3% difference to the upside when compared to our last report.

Daily Crypto Market Cap Chart

The cryptocurrency market cap decreased significantly over the course of the day. Its current value is $335.82 billion, which represents a decrease of $33.15 billion when compared to our previous report.

_______________________________________________________________________

What happened in the past 24 hours?

_______________________________________________________________________

_______________________________________________________________________

Technical analysis

_______________________________________________________________________

Bitcoin

Bitcoin has experienced yet another price drop in the past 24 hours. As we mentioned in our previous article, the largest cryptocurrency by market cap was preparing a move to either side and that the direction of the move will decide BTC’s faith in the short-term. As we can see, Bitcoin decided to go towards the downside and quickly dropped below its $11,630 and $11,460 support levels. It got stopped, however, by both the $11,090 and the descending trend line, which Bitcoin created ten days ago.

Traders should take a look at how Bitcoin resolves its current position and trade after they get more info.

BTC/USD 4-hour Chart

Technical factors:
  • Price is below its 50-period EMA and its 21-period EMA
  • Price is at its lower band
  • RSI bounced off of the oversold line (32.84)
  • Volume has increased
Key levels to the upside          Key levels to the downside

1: $11,460                                1: $11,090

2: $11,630                                2: $10,855

3: $12,015                                 3: $10,505

Ethereum

Ethereum also had a bad day, with bears dominating its price movements. The second-largest cryptocurrency by market cap has, over the course of the day, dropped back into the descending trend it just briefly escaped the day before. Ethereum’s position within the descending trend was confirmed after a small price spike couldn’t get past the trend’s upper level.

Ethereum traders should look for how ETH handles being in the level, and how it exits it.

ETH/USD 4-hour Chart

Technical Factors:
  • Price is currently below its 21-period and its 50-period EMA
  • Price is at its lower band
  • RSI is leaning towards oversold (37.87)
  • Volume is normal (but the past 24h saw a surge in volume at one point)
Key levels to the upside          Key levels to the downside

1: $415                                     1: $400

2: $445                                     2: $361

3: $496                                      3: $340

Ripple

XRP suffered from the same fate as BTC and ETH, with bears taking over the market and its price dropping in the past 24 hours. The third-largest cryptocurrency by market cap fell below $0.285 after not being able to properly confirm its position above it, and almost reached the $0.266 support in the process. XRP is now stabilizing at around $0.275 with low volume and volatility.

XRP traders should look for how the cryptocurrency reacts when it reaches its immediate support/resistance levels.

XRP/USD 4-hour Chart

Technical factors:
  • Price is below its 21-period and its 50-period EMA
  • Price is slightly above its lower band
  • RSI stable, but leaning towards the oversold area (38.10)
  • Volume is below average and stable (except a two-candle spike during the price drop)
Key levels to the upside          Key levels to the downside

1: $0.285                                   1: $0.266 

2: $0.31                                     2: $0.2454

3: $0.32                                    3:$0.235


Categories
Forex Market Analysis

Daily F.X. Analysis, August 26 – Top Trade Setups In Forex – Durable Goods Orders In Highlights! 

On the news front, the eyes will remain on the U.S. fundamentals, especially the Durable Goods Orders m/m and Core Durable Goods Orders m/m, which are expected to report negative data and may drive selling bias for the U.S. .dollar.

Economic Events to Watch Today  


EUR/USD – Daily Analysis

The EUR/USD closed at 1.18336 after placing a high of 1.18435 and a low of 1.17840. Overall the movement of the EUR/USD pair remained bullish throughout the day. The EUR/USD pair gained traction and raised on Tuesday after falling for two consecutive days. The rise in the EUR/USD pair was due to improved risk appetite in the market after the U.S. & China both held the trade talks and confirmed their commitment to trade deal.

Meanwhile, the potential vaccine for coronavirus and the distribution of vaccine doses to worldwide raised optimism and helped risk sentiment that also added further in the gains of riskier asset EUR/USD pair.

The U.S. & China said they were making progress in trade talks despite other tensions, which added further in the optimism. The Chinese Ministry of Commerce announced that a constructive dialogue between both sides had pushed the trade deal forward.

As in result, the U.S. Treasury yields rose but failed to raise the U.S. dollar as the disappointing release of the Conference Board’s Consumer Confidence depressed the U.S. dollar. At 19:00 GMT, the highlighted C.B. Consumer Confidence data fell in August to 84.8 from the anticipated 93.0 and weighed heavily on the U.S. dollar that added gains in the EUR/USD pair.

On the other hand, from the European side, the German Final GDP for the second quarter contracted less than it was expected and supported Euro currency. The forecasted GDP was -10.1% but, in actuality, came in as -9.7% and supported the single currency. The German Ifo Business Climate Index in August exceeded the expectations of 92.2 and came in as 92.6 and supported Euro currency that further added gains in the EUR/USD pair.

Furthermore, the risk sentiment was also supported by the positive news regarding the vaccine and its distribution from the World Health Organization. Investors cheered the COVAX facility initiative that would allow the worldwide equal distribution of vaccine doses in collaboration with the vaccine manufacturers.

WHO said that 172 countries were engaged in talks to participate in the COVAX facility, and nine vaccine candidates have already joined it while nine were under evaluation. It also added that significant producers were under discussion to join the facility. The worldwide equal and fair distribution of vaccines will help recover the economy and bounce back from the pandemic. This raised risk sentiment and pushed the EUR/USD riskier asset in the upward direction on Tuesday. Apart from this, the investors will be watching the speech of Fed Chair Jerome Powell on Thursday at Jackson Hole Symposium to find fresh clues about the U.S. dollar.

Daily Technical Levels

Support Pivot Resistance
1.1795 1.1820 1.1857
1.1758 1.1882
1.1733 1.1919

 EUR/USD– Trading Tip

The EUR/USD is trading with a bearish bias amid stronger U.S. dollar at 1.1810, holding right above the triple bottom support area of 1.1804 level. Closing of candles above this level can drive bullish correction until 1.1840, while the violation of the 1.1804 level can trigger selling unto 1.1785 level. On the 2 hour chart, the EUR/USD pair has formed an ascending triangle pattern, which also extends resistance at 1.1847. Let’s wait for a bullish or a bearish breakout before placing any major trade in the EUR/USD. 


GBP/USD – Daily Analysis

 The GBP/USD closed at 1.31505 after placing a high of 1.31703 and a low of 1.30539. Overall the movement of GBP/USD pair remained bullish throughout the day. After falling for two consecutive days, GBP/USD pair surged and posted gains and recovered almost more than half of the previous two day’s losses on Tuesday amid the broad-based U.S. dollar weakness.

The U.S. dollar was weak as the Consumer Confidence from August declined, and the safe-haven status of greenback suffered because of risk-on market sentiment. The risk appetite increased after the U.S. & China confirmed their commitment towards the phase-one trade deal on Tuesday. Despite ongoing tensions, both sides assured to comply with their promises made in the phase-one trade deal agreement and released some tension from the market.

This raised risk appetite and the risk-sensitive GBP/USD pair gained from this situation. Meanwhile, the potential vaccine development and its distribution in the whole world to fight the pandemic also raised risk sentiment and added in the pair gains.

Whereas on Brexit front, the top Tory and former Brexit Secretary David Davis warned that it was a critical endgame, and the U.K. will soon have to be preparing for talks to collapse. As both sides have earmarked October as a deadline, and the last three weeks will matter more than the first three years of talks.

He added that if Europe continued to follow Barnier’s strategy, then we could end up with a no-deal scenario, and the Europeans will lose a large and very profitable marketplace, namely the United Kingdom. They will lose the most efficient financial market; they will lose access to British fisheries and funding that was agreed under the Withdrawal Agreement. The funding was agreed on the presumption that both sides would get a trade deal, a political promise that the E.U. has failed to keep.

The U.K.’s negotiator David Frost had provided a draft text last week to speed up the talks, but E.U. negotiator Micheal Barnier dismissed it as unrealistic and urged E.U. states to stay cold-blooded. Barnier said that U.K.’s strategy would be to trade fishing access for freedom from E.U. rules at the last minute.

Meanwhile, at an informal meeting, the colleague of Mr. Barnier, Eurasia Group analyst, Mujtaba Rahman, said that the trade-off concerning state aid and fishing rights as possible, but it will take time. He claimed that the prospect of no-deal with the risk of delay at the border and food shortages would be a huge concern for Boris Johnson and his government, pushing him to compromise.

Both sides are reluctant to lose their demands and the time is falling short, it is now unclear whether they would reach an agreement. However, investors are cheering the other risk-related news and ignoring the Brexit progress as it has stalled.

On the data front, at 15:00 GMT, the CBI Realized Sales from Britain declined to -6 from the expected 7 in August and weighed heavily on the local currency that kept the currency pair gains limited. From the U.S., the Consumer Confidence from the Conference Board was declined to 84.8 from the projected 93.0 and the previous 91.7 and weighed heavily on the U.S. dollar as this report was highlighted on Tuesday. The weak U.S. dollar added further in the GBP/USD pair’s gains.

Daily Technical Levels

Support Pivot Resistance
1.3079 1.3125 1.3196
1.3008 1.3242
1.2962 1.3313

 GBP/USD– Trading Tip

The GBP/USD has violated the sideways trading range of 1.3120 – 1.3056 level, and bullish breakout of GBP/USD pair is likely to lead the Sterling prices towards the next target 1.3262 level. On the higher side, the next resistance is likely to be found around 1.3262 level. The 50 EMA and the technical indicators such as RSI, MACD, and 50 periods of EMA suggest a bullish bias in the Cable. Let’s consider taking buying trades above 1.3120 level.


USD/JPY – Daily Analysis

The USD/JPY pair was closed at 106.387 after placing a high of 106.575 and a low of 105.870. Overall the movement of the USD/JPY pair remained bullish throughout the day. The USD/JPY pair climbed to a fresh weekly high on Tuesday at 106.57 despite the broad-based U.S. dollar weakness. The rise in currency pair could be attributed to the risk-on market sentiment that weighed on safe-haven Japanese Yen and contributed to the currency pair’s gains.

The U.S. Dollar Index (DXY) was down on Tuesday by 0.33% on 92.98 level, but it could not stop USD/JPY pair to post gains on the day as the risk-on market environment made it difficult for safe-haven Japanese Yen to find demand in the market.

On the data front, at 10:00 GMT, the core Consumer Price Index for the year from Bank of Japan dropped to 0.0% in August from the anticipated 0.1% and weighed on Japanese Yen and added further in USD/JPY pair’s gains.

On the U.S. side, the Housing Price Index rose to 0.9% in June from the anticipated o.3% and supported the U.S. dollar. At 18:59 GMT, the Richmond Manufacturing Index also rose to 18 points from 10 in the forecast and supported the U.S. dollar. At 19:00 GMT, the C.B. Consumer Confidence declined to 84.8 from the projected 93.0 and weighed on the U.S. dollar. The New Home Sales increased to 901K from the expected 787K and supported the U.S. dollar.

Most of the economic data from the U.S. came in favor of the U.S. dollar on Tuesday and helped USD/JPY gain traction. Meanwhile, the improving market risk sentiment played an important role in increasing the USD/JPY currency pair prices. The risk appetite was raised in the market after the WHO released an initiative of equal and fair distribution of vaccine to countries worldwide along with the positive statement from both the U.S. & China about the trade deal.

According to the World Health Organization, 172 countries and multiple candidate vaccines were involved in talks to make the global access of vaccines easy and fair by participating in the COVAX facility. COVAX facility is an initiative to provide safe & effective vaccines after getting license and approval to countries around the world by working with vaccine manufacturers. For now, nine candidate vaccines have entered the initiative, and further nine are under evaluation while the major producers are under conversation to join the COVAX facility.

This raised hopes for the equal and easy distribution of vaccine doses not only in a few major countries but to each country worldwide. The fact that it will help recovery boosts the equity market, and hence, safe-haven Japanese Yen came under heavy selling pressure and raised USD/JPY pair.

Meanwhile, the video conference that was canceled by President Donald Trump on August 15 was held on Tuesday between U.S. Trade Representative Robert Lighthizer and U.S. Treasury Secretary Steven Mnuchin with Chinese Vice Premier Liu He. Both sides reaffirmed their commitment toward the phase-one trade deal even China has been lagging of the target of purchasing U.S. farm goods.

However, in the lingering US-china tensions, a positive statement from both sides gave a heavy selling pressure on safe-haven appeal and raised the risk sentiment helping USD/JPY pair to extend its daily gains.

Daily Technical Levels

Support Pivot Resistance
105.9500 106.2700 106.6800
105.5500 106.9900
105.2300 107.4000

USD/JPY – Trading Tips

The USD/JPY is trading within an upward channel, which is supporting the pair at 106.230. On the higher side, the USD/JPY may find an immediate resistance at 106.566 and 107.078. On the 2 hour chart, the 50 periods EMA is extending the buying trend in the USD/JPY pair. At the same time, the MACD and RSI are contradicting as the MACD suggests selling while the RSI is holding in a buying zone. The USD/JPY may trade bullish over 106.200 to target 107.084. Good luck! 


Categories
Forex Options

FX Options Market Combined Volume Expiries for 26th August 2020

Thank you for visiting the Forex Academy FX Options market combined volume expiries section. Each day, where available, we will bring you notable maturities in FX Options of amounts of $100 million-plus, and where these large combined maturities at specified currency exchange rates often have a magnetic effect on price action, especially in the hours leading to their maturities, which happens daily at 10.00 AM Eastern time. This is because the big institutional players hedge their positions accordingly. Each option expiry should be considered ‘in-play’ with a good chance of a strike if labelled in red, still in play and a possible strike if labelled in orange and ‘out of play’ and an unlikely strike if labelled in blue, with regard to the likelihood of price action meeting the strike price at maturity.

…………………………………………………………………………………………………………

FX option expiries for Wednesday, August 26 at the 10 am NY cut

-EUR/USD euro amount

  • 1.1775 792m
  • 1.1830 689m

EURUSD is in a tight range. A breach of the 1.1800 level will leave the door open for the1.1775 option expiry. A rejection paves the way for the 1.1830 option. Eurozone policymaker speeches and US data will be important before the New York cut.

-USD/JPY USD amount

  • 105.00 3.2bn
  • 105.40 839m
  • 105.50 383m
  • 105.75 1.1bn
  • 106.00 1.1bn
  • 106.15 420m
  • 106.50 399m
  • 106.60 570m
  • 107.03 1.3bn
  • 107.10 394m

USDJPY is oversold with a huge cluster of option expiries within the current range which should keep price action localised at least until the US data.

-GBP/USD GBP amount

  • 1.3150 385m

Cable is trading in a tight range with a 1.3150 looking like a barrier.

-AUD/USD AUD amount

  • 0.7250 732m

AUDUSD is in a bull trend, but the option is out of play. 0.7200 the barrier.

-NZD/USD NZD amount

  • 0.6520 299m

NZDUSD is stuck in a narrow sideways range.

………………………………………………………………………………….

As you can see on the preferred 1-hour chart(s), we have also plotted the expiration levels at the various exchange rate maturities and we have also labelled in red, orange and blue.  Therefore, if you see option expiry exchange rates labelled in red these should be considered in-play, because we believe there is a greater chance of the expiry maturing at these levels based on technical analysis at the time of writing. There is still a lesser possibility of a strike if they are in orange and so these are ‘in-play’ too. However, if we have labelled them in blue, they should be considered ‘not in-play’ and therefore price action would be unlikely to reach these levels, which are often referred to as Strikes, at the time of the 10 AM New York cut.

Our technical analysis is based on exchange rates which may be several hours earlier in the day and may not reflect price action at the time of the maturities. Also, we have not factored in economic data releases or keynote speeches by policymakers, or potential market volatility leading up to the cut.

Although we have added some technical analysis, we suggest you take the levels and plot them onto your own trading charts and incorporate the information into your own trading methodology in order to use the information to your advantage. Remember the higher the amount, the larger the gravitational pull towards the exchange rate maturity at 10:00 AM Eastern time.

If you want to learn how forex option expiries affect price action in the spot FX market see our educational article by clicking here: https://bit.ly/2VR2Nji

DISCLAIMER: Please note that this information is for educational purposes. Also, the maturities will look more or less likely to become a strike at 10 AM NY time due to exchange rate fluctuations resulting in a different perspective with regard to technical analysis, and also due to upcoming economic data releases for the associated pairs.

Categories
Forex Fundamental Analysis

Impact of ‘Bankruptcies’ News Release On The Forex Assets

Introduction

A bankruptcy on paper and in reality differ in several meaningful ways. The short and long-term implications both have to be fully taken into the picture before forming an opinion or drawing any inference from the Bankruptcy statistics. Contrary to popular belief, it is not as bad as it sounds and is more frequent for businesses to file for bankruptcy as a means to reset their business to become profitable. Correctly understanding bankruptcy, its implications, and its statistics can help us make better trade decisions in the long run.

What is Bankruptcy?

Bankruptcy is the legal state of an individual or a company that has become insolvent. When an individual or a company is unable to repay its debt, it can file a petition for bankruptcy in the federal court. When individuals lose their income source or when a business takes on continued periods of losses are likely to file bankruptcy.

The bankruptcy process starts when a petition is filed by the debtor or the creditor, although it is more common for the debtors to file for bankruptcy. Successful processing of a bankruptcy petition can benefit the debtor to be discharged of their debts, thus giving them the freedom from the overburdening debts and restart.

When a bankruptcy petition is processed, the assets of the debtor are evaluated, and an appropriate portion may be allotted to repay the creditors. Whether all of the assets are sold off to repay debt or not depends on the types of bankruptcies filed. Many a time, creditors may need to reorganize the debt to allow the debtor to pay off the debt in smaller installments over three to five years.

How can the Bankruptcies numbers be used for analysis?

On paper, all this may seem favorable to the debtor offering immediate relief from the overwhelming debts.  The debtor may not be required to pay at all if the debtor does not have assets or income or at least greatly waive off their debt installments. Successful proceeding of a bankruptcy petition can partially or entirely waive off debts for a chance to save your home or business from going-under.

Such an exemption comes at a cost, though. As mentioned, on paper, it seems like a favorable option for the debtor in a tight spot, but in the long-run, it has far-reaching implications. If a debtor is filing bankruptcy, chances are, their credit score has already gone wrong due to failed payment dues in past months. When the bankruptcy is filed, it will stay on the record of that individual or company for ten years. In this process, the credit rating goes low, and a remark of bankruptcy on record prevents you from being eligible for future credits, loans, mortgages, or even credit cards.

When lending sources are all cut off, then it is challenging for both individuals and businesses to become profitable. Some may even end up borrowing from sources where interest rates are much higher than the standard rates, ending up in deeper trouble than before.

Filing bankruptcy is more frequent for businesses to reorganize their remaining assets and come up with a new strategy to be profitable. All the bankruptcy cases are handled in the federal courts by a bankruptcy judge. They are classified as per the bankruptcy code that details different chapters for different types of bankruptcy case scenarios.

From a macroeconomic perspective, bankruptcy filing gives both the debtors and creditors a fresh start by allowing debtors to be eligible for credit and creditors to recover some portion of the credit. Having such a system that can accommodate failures of individuals and companies is a sign of a fair and inclusive economy that embraces and tolerates both ups and downs of individuals and businesses.

From a purely business and growth perspective, increasing bankruptcy cases is just plain bad for the economy as it indicates businesses are shutting down, and people are losing jobs. Both of those scenarios do no good for the economic growth and contribute negatively to both growth and consumer & business sentiment within the nation. Filing of bankruptcy thrashes the equity market performance of corporations as investors lose confidence in the business.

Recessions, war-times, or times like global pandemic observe an increasing number of bankruptcy cases indicating that the economy is not faring well. Hence, from an economic standpoint, the “fewer the better” would be the goal for a prosperous economy.

Impact on Currency

Filing Bankruptcy is often the last resort for the debtor when all other options are closed. Hence, the bankruptcy statistics are backward-looking or a lagging indicator confirming an ongoing past trend which could have been deduced from the past poor performance. Bankruptcy statistics would then be useful for economic analysts for analysis but does not serve as a useful indicator either for the equity or the currency markets. Hence, bankruptcy figures could be overlooked for other leading macroeconomic indicators for the currency markets.

Economic Reports

The United States Courts provide historical data of the quarterly reports of bankruptcy filings in the country on its official website. The Organization for Economic Co-operation and Development (OECD) also maintains bankruptcy statistics for reporting members. Moody’s analytics also provide personal and corporate bankruptcy filings on their official website.

Sources of Bankruptcy Statistics

The US Courts maintain bankruptcy filings records on its website.

The OECD Bankruptcy statistics are also helpful for quick reference of the OECD member countries.

Global Bankruptcy statistics are available on Trading Economics.

Moody’s analytics also report personal bankruptcies.

How Bankruptcies’Data Release Affects The Price Charts

Estimating the exact impact of bankruptcies on an economy is hard to quantify. Since the bankruptcies data is released quarterly, its impact on the forex market tends to be negligible because the data is backward-looking. The most recent data was released on June 30, 2020, at 8.00 AM ET and can be accessed from the United States Courts website here. The historical bankruptcies’ data in the US can be accessed at the Trading Economics website.

The screengrab below is from the quarterly bankruptcies’ data from Trading Economics.

As can be seen, the total number of bankruptcies in the United States decreased to 22,482 companies in the second quarter of 2020 from 23,114 companies in the first quarter of 2020.

Now, let’s see how this release made an impact on the Forex price charts.

EUR/USD: Before the Quarterly Bankruptcies Data Release on August 2020, 
Just Before 8.00 AM ET

As can be seen in the above 15-minute EUR/USD chart, the pair was trading on a weak downtrend. This trend can be affirmed since the 20- period Moving Average is decreasing in the steepness of its decline with candles forming closer to it.

EUR/USD: After the Quarterly Bankruptcies Data Release on August 2020, 8.00 AM ET

After the release of the bankruptcies data, the pair formed a 15-minute “hammer” candle. This pattern indicates that the USD became weaker against the EUR. This trend is contrary to the expectations since the number of bankruptcies had declined from the previous quarter. The pair adopted a bullish stance with the candles crossing above a now rising 20-period Moving Average.

Now let’s see how this news release impacted other major currency pairs.

GBP/USD: Before the Quarterly Bankruptcies Data Release on August 2020, 
Just Before 8.00 AM ET

The GBP/USD pair showed a similar weakening downtrend trend as observed with the EUR/USD pair before the release of the bankruptcies data. The 15-minute candles can be seen, forming closer to the 20- period Moving Average, whose downward steepness is decreasing.

GBP/USD: After the Quarterly Bankruptcies Data Release on August 2020, 8.00 AM ET

After the news release, the pair formed a 15-minute bearish “Doji star” candle. Similar to the EUR/USD pair, GBP/USD  adopted a bullish stance with the candles crossing above a now rising 20-period Moving Average.

AUD/USD: Before the Quarterly Bankruptcies Data Release on August 2020, 
Just Before 8.00 AM ET

AUD/USD: After the Quarterly Bankruptcies Data Release on August 2020, 8.00 AM ET

Unlike the downtrends observed with the EUR/USD and the GBP/USD pairs, the AUD/USD traded within a subdued neutral trend before the bankruptcies data release. The 15-minute candles were forming around an already flattened 20-period MA. After the data release, the pair formed a 15-minute bullish “Doji star” candle. It later traded in the same bullish pattern as observed in the other pairs.

Bottom Line

In the current age of the coronavirus pandemic, data on bankruptcies provide a vital indicator of the economic conditions. However, in the forex market, these data do not carry much significance, as shown by the above analyses.

Categories
Forex Market Analysis

Daily F.X. Analysis, August 25 – Top Trade Setups In Forex – Consumer Confidence in Focus! 

On the news front, the economic calendar is a bit busy today, and it may offer a medium impact on economic events from the U.S. and Eurozone. During the European session, the focus will remain on the German Final GDP q/q and German Ifo Business Climate data, while the U.S. C.B. Consumer Confidence and New Home Sales from the U.S. will be released during the New York session today. The dollar can gain straighten on positive forecasts.

Economic Events to Watch Today  


EUR/USD – Daily Analysis

The EUR/USD closed at 1.17953 after placing a high of 1.18828 and a low of 1.17539. Overall the movement of EUR/USD remained bearish throughout the day. The EUR/USD pair dropped on Friday and bottomed at 1.1753; it’s lowest since August 12. A stronger U.S. dollar and the poor economic data from Europe weighed on EUR/USD pair.

At 12:15 GMT, the French Flash Services PMI for August fell to 51.9 from the expected 56.3, and the previous 57.3, weighed on Euro. The French Flash Manufacturing PMI also declined to 49.0 against the estimated 53.0 and previous 52.4 and added pressure on single currency Euro.

At 12:30 GMT, the German Flash Manufacturing PMI rose to 53.0 from the anticipated 52.2 and supported Euro; however, the German Flash Services PMI came in as 50.8 against the expected 55.3 and weighed on Euro on Friday.

At 13:00, the Flash Manufacturing PMI for the whole Eurozone declined to 51.7 in August from the projected 52.7 and previous 51.8. The Flash Services PMI for the whole bloc also fell to 50.1 against the forecasted 54.6 and added pressure on EUR.

Apart from German Manufacturing PMI, all the PMI from the whole bloc, including biggest economies, came in against EUR, and hence, EUR/USD pair suffered. The data showed that only German manufacturing activity was expanded in August. At the same time, other countries, along with whole euro bloc’s manufacturing & services activities, were contracted in August. Meanwhile, the greenback was the top performer on Friday with DXY up by 0.5% on 93.5 level, the highest since Monday. The U.S. Dollar was already supported by the release of Fed Meeting minutes on Wednesday, and on Friday, the support was extended after the release of positive PMI and Home Sales data.

At 18:45 GMT, the Flash Manufacturing PMI and the Flash Services PMI were released from the U.S. The Manufacturing PMI surged to 53.6 against the expected 51.9, and the Services PMI was surged to 54.u from the 50.9 forecasted. The expansion in the Manufacturing & Services sector of the U.S. gave strength to the U.S. dollar. At 19:00 GMT, the Existing Home Sales in July exceeded the expectations of 5.40M and came in as 5.86Mand supported the U.S. dollar.

The strong U.S. dollar exerted more pressure on EUR.USD prices and dragged them down at the ending day of the week. Meanwhile, the Euro currency was also under pressure because of the resurgence of coronavirus cases in Europe. In recent days France, Germany, and Italy have experienced their highest daily case counts since the spring, and Spain has found itself amid a major outbreak.

Over the past two weeks, Spain has seen Europe’s fastest rising caseload with 142 positive cases per 100,000 people. The number had risen more than 3,000 by the time the state of emergency ended on June 21.

The EUR/USD pair was also under pressure on Friday because of the possible entry of a new phase of the pandemic in Europe. 

Daily Technical Levels

Support Pivot Resistance
1.1787 1.1797 1.1807
1.1777 1.1817
1.1767 1.1827

 EUR/USD– Trading Tip

The EUR/USD pair fell sharply from 1.1954 level to 1.1790 level. For now, the pair is likely to find an immediate resistance at 1.1806 level, and a bullish breakout of 1.1806 level can lead EUR/USD prices towards 1.1886 level. On the lower side, the violation of the 1.1751 level can extend the selling trend until 1.1706.


GBP/USD – Daily Analysis

 The GBP/USD pair was closed at 1.30627 after placing a high of 1.31488 and a low of 1.30534. Overall, the movement of the GBP/USD pair remained bearish throughout the day. The GBP/USD pair extended its previous day losses and fell further on Monday to a low of 1.3053 level. In the absence of significant macroeconomic data from the U.K. or U.S., the greenback’s market valuation remained the sole driver of GBP/USD pair on the day.

The U.S. Dollar Index dropped below 93 levels during the first half of the day because of upbeat market sentiment. The risk sentiment was fueled after the U.S. Food and Drug Administration (FDA) announced on Sunday that it had approved the blood-plasma treatment for coronavirus patients in case of emergency.

The blood plasma from the recovered patients of the virus could increase the health and decrease the morality, and it was approved to use for severe or emergency cases of coronavirus in America. This method has been used in many countries, and the USA has approved it now. U.S. President Donald Trump urged the recovered patients of coronavirus to donate their blood plasma so that fight against coronavirus pandemic could take its pace and recovery chances could increase.

The risk perceived GBP/USD pair gained from this news and rose in the early session on Monday; however, in late American sessions, the rising U.S. Treasury bond yields helped the U.S. dollar to gain traction and lifted the U.S. dollar Index. The DXY moved to a high of 93.30 and was up by 0.06% whereas, the U.S. 10-year Treasury bond yield was up by more than 2% on Monday.

The strong U.S. dollar in late session exerted pressure on GBP/USD pair that pulled its prices towards the downward track and hence paired posted losses.

Meanwhile, an internal British government document was leaked on the U.K. tabloid “The Sun” that allegedly outlined the country’s plans in a reasonable worst-case scenario. The second wave of coronavirus, along with the severe flooding and the flu with a no-deal Brexit, could cause a systematic economic crisis. According to that document, the major impact will be on unemployment, disposable incomes, business activity, international trade, and market stability.

The document said that social distancing & mask-wearing would be continued until 2021. The government document also revealed that the navy would be deployed to prevent illegal European fishing boats from clashing with British vessels. The document was dated as of July 2020, and also said that if the U.K. and E.U. failed to reach a post-Brexit trade deal, then hard borders and tariffs will come into effect on January 1, 2021.

Trade talks between both parties have stalled with no breakthrough in sight and the chief Brexit negotiator of European Union, Micheal Barnier has said that the talks were going even backward instead of moving forward. At the same time, the U.K. negotiator, David Frost, said that a little progress had been made. Both sides provide mixed views and raise the confusion amongst investors that have been weighing on GBP/USD pair.

Daily Technical Levels

Support Pivot Resistance
1.3082 1.3092 1.3103
1.3071 1.3113
1.3062 1.3124

 GBP/USD– Trading Tip

The GBP/USD pair is trading sideways above a strong support level if 1.3072. The support here is extended by 1.3074 level, where the bearish breakout of 1.3074 level can extend selling unto 1.3007 level. On the higher side, the next resistance is likely to be found around 1.3155 level. The 50 EMA and the technical indicators such as RSI, MACD, and 50 periods of EMA suggest a selling bias in the Cable. Let’s consider taking selling trades below 1.3075 level, while buying can be seen if the GBP/USD pair continues to close candles over 1.3075 level. 


USD/JPY – Daily Analysis

The USD/JPY pair was closed at 105.979 after placing a high of 105.995 and a low of 105.687. Overall the movement of the USD/JPY pair remained bullish throughout the day. The USD/JPY pair posted small gains on Monday amid the risk-on market sentiment after the FDA approved of coronavirus treatment. However, the lingering US-China tensions and the fact that the U.S. Congress was far from giving any news about the next stimulus kept the market risk sentiment limited.

The U.S. Dollar Index was up on Monday to 93.2 level, and the USD/JPY pair also rose because of improved demand for the U.S. dollar.

However, the main reason for the upward trend was a possible coronavirus treatment that was already being used in different countries. The U.S. Food and Drug Administration has approved the use of blood plasma from recovered patients to treat severely ill coronavirus patients.

The FDA approved this treatment only in case of an emergency and to recover the most severe cases. Whereas, President Donald Trump appealed to the Americans who have recovered from viruses to donate plasma.

This raised the market risk sentiment and weighed on safe-haven Japanese Yen that ultimately pushed the USD/JPY pair on high.

Japanese Yen remained on the back foot on Monday with global equity indexes posting gains at the start of the week. The Dow Jones Industrial Average was up by 0.8%, and the S&P 500 was up by 0.7% on Monday amid improved risk appetite.

Meanwhile, the next stimulus package was still not announced by the U.S. Congress as both Republicans & Democrats were having differences in the size of the package. On the US-China front, the United States and China have already signed the phase one trade deal earlier this year, and China has trouble living up to it. Beijing is supposed to increase the purchase of U.S. exports by 200 Billion U.S. dollars by the end of 2021 in exchange for tariff cuts on Chinese goods by the U.S.

Last week, both parties were scheduled to hold a video conference meeting to discuss the implementations of the phase-one trade deal and issue a review of its progress. But the meeting was canceled by the U.S. President Donald Trump in anger over Beijing for the pandemic outbreak.

The Trump administration has also denied rescheduling the meeting, and it is expected that the review will not be issued. This also raised the uncertainty and kept the risk sentiment under pressure that limited the gains in the USD/JPY pair.

Daily Technical Levels

Support Pivot Resistance
105.7700 105.8500 105.9500
105.6700 106.0300
105.6000 106.1300


USD/JPY – Trading Tips

On Tuesday, the USD/JPY is trading sideways in a broad trading range of 106.300 to 105.240. At the movement, the USD/JPY is tossing above and below 50 periods EMA, while the RSI and MACD are in support of a neutral trend. The recent series of Doji and Shooting start candles are suggesting indecision among traders. Sooner or later, we may see USD/JPY prices break out of the range. Once it happens, the USD/JPY may trade bullish over 106.300 to target 107.084. On the lower side, violation of 105.240 level can drive selling unto 104.300. Good luck! 

Categories
Forex Options

FX Options Market Combined Volume Expiries for 25th August 2020

Thank you for visiting the Forex Academy FX Options market combined volume expiries section. Each day, where available, we will bring you notable maturities in FX Options of amounts of $100 million-plus, and where these large combined maturities at specified currency exchange rates often have a magnetic effect on price action, especially in the hours leading to their maturities, which happens daily at 10.00 AM Eastern time. This is because the big institutional players hedge their positions accordingly. Each option expiry should be considered ‘in-play’ with a good chance of a strike if labelled in red, still in play and a possible strike if labelled in orange and ‘out of play’ and an unlikely strike if labelled in blue, with regard to the likelihood of price action meeting the strike price at maturity.

…………………………………………………………………………………………………………

FX option expiries for Aug 25 NY cut at 10:00 Eastern Time, via DTCC, can be found below.

– EUR/USD: EUR amounts

  • 1.1650 722m
  • 1.1800 608m
  • 1.1850 1.1bn
  • 1.1900 529m

EURUSD shows strong areas of support and resistance with the 1.1800 option looking favourite right now. German data up during the European session will be important for the next move.

– GBP/USD: GBP amounts

  • 1.3000 315m

GBPUSD will need to punch through some major support levels in order to reach the 1.30 option expiry.

– USD/JPY: USD amounts

  • 105.00 740m
  • 105.25 1.4bn

USDJPY looks set for a pullback from an area of resistance but the two option expiries are out of play.

………………………………………………………………………………….

As you can see on the preferred 1-hour chart(s), we have also plotted the expiration levels at the various exchange rate maturities and we have also labelled in red, orange and blue.  Therefore, if you see option expiry exchange rates labelled in red these should be considered in-play, because we believe there is a greater chance of the expiry maturing at these levels based on technical analysis at the time of writing. There is still a lesser possibility of a strike if they are in orange and so these are ‘in-play’ too. However, if we have labelled them in blue, they should be considered ‘not in-play’ and therefore price action would be unlikely to reach these levels, which are often referred to as Strikes, at the time of the 10 AM New York cut.

Our technical analysis is based on exchange rates which may be several hours earlier in the day and may not reflect price action at the time of the maturities. Also, we have not factored in economic data releases or keynote speeches by policymakers, or potential market volatility leading up to the cut.

Although we have added some technical analysis, we suggest you take the levels and plot them onto your own trading charts and incorporate the information into your own trading methodology in order to use the information to your advantage. Remember the higher the amount, the larger the gravitational pull towards the exchange rate maturity at 10:00 AM Eastern time.

If you want to learn how forex option expiries affect price action in the spot FX market see our educational article by clicking here: https://bit.ly/2VR2Nji

DISCLAIMER: Please note that this information is for educational purposes. Also, the maturities will look more or less likely to become a strike at 10 AM NY time due to exchange rate fluctuations resulting in a different perspective with regard to technical analysis, and also due to upcoming economic data releases for the associated pairs.

Categories
Crypto Market Analysis

Daily Crypto Review, August 25 – Bitcoin Whales List Reaches All-Time High; DeFi Projects Still Booming

Cryptocurrencies had a steady day, with most of them being in the slight green. Bitcoin is currently trading for $11,768, which represents an increase of 1.22% on the day. Meanwhile, Ethereum gained 4.32% on the day, while XRP gained 1.85%.

 Daily Crypto Sector Heat Map

When taking a look at top100 cryptocurrencies, Aave gained 33.55% on the day, making it the most prominent daily gainer. Kusama (26.13%) and The JUST (17.30%) also did great. On the other hand, Nervos Network lost 7.95%, making it the most prominent daily loser. It is followed by OMG Network’s loss of 7.59% and Siacoin’s drop of 7.53%.

Top 10 24-hour Performers (Click to enlarge)

Bottom 10 24-hour Performers (Click to enlarge)

Bitcoin’s dominance level has decreased slightly, with its value currently at 60.04%. This value represents a 0.16% difference to the downside when compared to our last report.

Daily Crypto Market Cap Chart

The cryptocurrency market cap increased in value over the course of the day. Its current value is $368.97 billion, which represents an increase of $6.26 billion when compared to our previous report.

_______________________________________________________________________

What happened in the past 24 hours?

_______________________________________________________________________

_______________________________________________________________________

Technical analysis

_______________________________________________________________________

Bitcoin

Bitcoin is at an important crossroad that will decide its short-term future. While it is currently stuck between $11,630 and $12,000, the largest cryptocurrency by market cap will soon have to decide on its direction. Even though a retest of the $11,630 support seems much more plausible, that does not mean that BTC will make a sharp move towards the downside. If the level holds, Bitcoin might have a good chance of bouncing towards $12,000 yet again.

The low volume also shows that a bigger move is on the horizon.

Traders should look for what BTC will do after it hits one of its support/resistance levels before making a trade.

BTC/USD 4-hour Chart

Technical factors:
  • Price is below its 50-period EMA and below its 21-period EMA
  • Price is slightly above its middle band
  • RSI is neutral (50.15)
  • Volume is below average and stagnant
Key levels to the upside          Key levels to the downside

1: $12,015                                1: $11,630

2: $12,300                                2: $11,460

3: $12,900                                 3: $11,090

Ethereum

Unlike Bitcoin that’s preparing for a move and trading with reduced volume and volatility, Ethereum had a great day and ended up making good gains. The second-largest cryptocurrency by market cap had a small volume spike, which was significant enough to push the price up and past the descending trend it was in for a couple of days.

Ethereum is now stabilizing at around $400, while its volume is decreasing.

Ethereum traders should look for Bitcoin’s next move, which ETH will most likely follow.

ETH/USD 4-hour Chart

Technical Factors:
  • Price is currently above its 21-period and its 50-period EMA
  • Price is at its upper band
  • RSI is neutral (52.30)
  • Volume is slightly increased from the previous days
Key levels to the upside          Key levels to the downside

1: $415                                     1: $400

2: $445                                     2: $361

3: $496                                      3: $340

Ripple

XRP spent the day consolidating above $0.285 level, which is regained the previous day. The third-largest cryptocurrency by market cap focused on stabilizing above $0.285, but without much success. While it is still technically above it, XRP would need a small move towards the upside (or some other sort of a decisive move) to confirm its position.

XRP traders should be careful around the $.285 level and pick their trade carefully based on where XRP will go.

XRP/USD 4-hour Chart

Technical factors:
  • Price is above its 21-period and below its 50-period EMA
  • Price is slightly above the middle band
  • RSI is neutral (48.63)
  • Volume is below average and stable
Key levels to the upside          Key levels to the downside

1: $0.31                                     1: $0.285 

2: $0.32                                     2: $0.266

3: $0.332                                  3:$0.2454


Categories
Forex Fundamental Analysis

Understanding The Importance Of ‘Small Business Sentiment’ In The Forex Market

Introduction

Small Businesses and self-employed account for a large portion of the private sector. Small and medium scale businesses’ success and failure impact a large section of the country’s population. Critical economic indicators like employment rate, consumer spending, GDP are all directly affected by the performance of small scale businesses. By paying attention to small business sentiment indices, the severity of economic conditions can be assessed more accurately, helping us to form more informed investment decisions.

What is Small Business Sentiment?

Small Business

The definitions of a small business differ across corporations, regions, and countries. The Australian Bureau of Statistics (ABS) defines a small business as an independent and privately owned, managed by an individual or a small group of people, and have less than 20 employees. A business having 20-199 employees is termed a medium scale business.

Small Businesses are generally diverse, but broadly they can be segregated into a few broad categories, though. One of those sectors includes providing services to other businesses and households that can include professionals like plumbers, home doctors, electricians, etc. Another sector includes retail outlets like grocery, bars, saloons, etc. Finally, another sector that these businesses can be categorized into is the niche service and goods providers in the manufacturing, construction, and agricultural sectors.

Given the diversity, a large number of activities are taken up by these businesses. In many areas where large businesses cannot reach out due to lack of business viability, these small ones plug the gap. For instance, a remote area having a population of about 50-100 people would not be suitable for a supermarket; instead, a small private grocery shop would do the trick.

Small Business Sentiment indices try to measure the general sentiment towards the business outlook in the current and coming months. Since the sentiment is abstract, the numbers are not precisely quantifiable and differ from person to person. Still, the sentiment indices are calculated as an average of a selected sample of small businesses every month or quarter. Higher and more positive numbers indicate a positive outlook towards business prospects and indicate the economy is likely to grow and prosper. On the other hand, low and negative numbers indicate a weak business prospect, and the economy is likely to slow down.

How can the Small Business Sentiment numbers be used for analysis?

In the case of Australia, that has over two million businesses that come under the category of small businesses, which is over 95% of the entire business sector. The large and established business sectors contribute to the remaining 5%. Since the failure rate of small businesses is quite high in any economy compared to the business giants, focusing on it gives us more accurate and economy sensitive data.

While big corporations generally have their profits nearly constant with mild swings during all business cycles, the small businesses are more sensitive, and their P/L (Profit/Loss) swings quite wildly over business cycles. Small businesses are more vulnerable and take a bigger hit from economic shocks resulting in closures or filing bankruptcy. In contrast, larger businesses are more resilient and can weather economic storms.

The small businesses contribute to a large share of employment; in Australia, it accounted for 43% of total employment. Small businesses are also generally the source of innovations where the smaller size of the organization gives room for the more creative expression of employees. For instance, in the video gaming industry, some of the most innovative gameplay mechanics have come from indie studios (small remote studios) that have had humble beginnings.

Overall the small-business sentiment gives more economy-sensitive data, where the direct impact and severity of economic conditions can be easily measured. The footprint of large businesses in terms of global or nationwide presence masks the underlying weaker economic growth in particular areas. For instance, an international giant like Sony may have had poor sales in the music industry, which are not reflected in its final sales figures if they had a good sale in the electronics department.

The high failure rate of small businesses can broadly impact the employment rate, consumer spending. The large scale failure of small businesses can be in general attributed to weak economic conditions, less consumer demand, high dollar value, lack of additional or tolerant policy from the Government to support small and medium businesses.

Impact on Currency

As the currency markets deal with macroeconomic indicators, small business sentiment indicators are overlooked for the broader and more inclusive business sentiment indicators like AIG MI (Australia Industry Group Manufacturing Index). The small business sentiment is useful for a more in-depth analysis of small regional companies and is useful for equity traders focusing on small company stocks. It is also useful for the Government officials to understand and draw out any support policies to maintain employment rate, and avoid bankruptcy to small-scale businesses.

It is also worth noting that not all countries maintain sentiment indices for small businesses, which makes analysis and comparison difficult for currency traders. Currency traders generally look for economic conditions across multiple countries to decide on investing in a currency; in that case, small business indices are not useful. Overall, it is a low-impact leading economic indicator that the currency markets generally overlook due to other alternative macroeconomic leading indicators.

Economic Reports

In Australia, the National Australian Bank publishes monthly and quarterly reports on the performance of small-business and their prospects on its official website. A detailed report on how different sectors are faring during current economic conditions and probable business directions are all listed out in the reports.

The National Federation of Independent Business (NFIB) Small Business Optimism Index is famous in the United States for reporting monthly small business sentiment on its official website.

Sources of Small Business Sentiment Indices

We can find the Small Business Sentiment indices for Australia on NAB. We can find consolidated reports of Small Business Sentiment for available countries on Trading Economics along with NFIB statistics.

How Small Business Sentiment Data Release Affects The Price Charts?

As mentioned earlier, the National Australian Bank (NAB) is the primary source of business sentiment in Australia. The bank publishes monthly, and quarterly NAB Business Sentiment reports. The most recent report was released on August 11, 2020, at 1.30 AM GMT and can be accessed at Investing.com here. A more in-depth review of the monthly business survey in Australia can be accessed at the National Australian Bank website.

The screengrab below is of the NAB Business Confidence from Investing.com. On the right, is a legend that indicates the level of impact the Fundamental Indicator has on the AUD.

As can be seen, low impact is expected on the AUD upon the release of the NAB Business Confidence report. The screengrab below shows the most recent changes in business confidence in Australia. In July 2020, the index improved from -8 to 0, showing that business sentiment in Australia improved during the survey period. Therefore, it is expected that the AUD will be stronger compared to other currencies.

Now, let’s see how this release made an impact on the Forex price charts.

AUD/USD: Before NAB BC Release on August 11, 2020, Just Before 1.30 AM GMT

As can be seen on the above 15-minute chart, the AUD/USD pair was trading on a neutral pattern before the NAB Business Confidence report release. This trend is evidenced by candles forming on a flattening 20-period Moving Average, indicating that traders were waiting for the news release.

AUD/USD: After NAB BC Release on August 11, 2020, 1.30 AM GMT

After the news release, the pair formed a 15-minute bullish candle. As expected, the AUD adopted a bullish stance and continued trading in steady uptrend afterward with a sharply rising 20-period Moving Average.

Now let’s see how this news release impacted other major currency pairs.

AUD/JPY: Before NAB BC Release on August 11, 2020, Just Before 1.30 AM GMT

Before the news release, the AUD/JPY pair was shifting its trading trend from neutral to an uptrend. Bullish candles are forming above the 20-period Moving Average.

AUD/JPY: After NAB BC Release on August 11, 2020, 1.30 AM GMT

Similar to the AUD/USD pair, the AUD/JPY pair formed a bullish 15-minute candle after the news release. The pair later continued trading in a steady uptrend.

AUD/CAD: Before NAB BC Release on August 11, 2020, Just Before 1.30  AM GMT

AUD/CAD: After NAB BC Release on August 11, 2020, 1.30 AM GMT

The AUD/CAD pair was trading in a similar neutral pattern as the AUD/USD pair before the news release. This trend is shown by candles forming on and around a flat 20-period Moving Average. After the news release, the pair formed a bullish 15-minute candle and adopted a bullish uptrend, as observed in the previous pairs.

Bottom Line

Theoretically, the small business sentiment is a low-impact indicator. However, in the age of Coronavirus afflicted economies, it has become a useful leading indicator of economic health and potential recovery. This phenomenon is what propelled the NAB Business Confidence indicator to have the observed significant impact on the AUD.

Categories
Forex Daily Topic Forex System Design

Introduction to the Evaluation of Trading Systems

Introduction

Once the trading system has been tested and optimized, the developer must achieve its evaluation with a pre-defined set of criteria, which would allow him to decide if the strategy is viable to use or not. To develop this stage, the developer needs to identify which criteria he should use to perform this process.

Why Evaluate a Trading System?

The evaluation of the trading system is the step that the system developer uses to decide if the strategy performance fits the investor’s objectives or if it would be necessary to further optimize the strategy.

Criteria to Evaluate a Trading System

There is a broad range of indicators to evaluate a trading system and compared it with itself or with other strategies. However, the most common indicators are listed below.

Net Profit 

Net Profit is a widely used indicator in the finance world and plays an important place in financial analysis. It measures how much money returns the strategy during the test period. The Net Profit is the result of the sum of all trade results.

Net Profit = SUM ( res(i))

where res(i) are the individual results

The use of this parameter could drive the system developer toward making a biased decision without a risk level consideration, especially when comparing different trading systems. Net Profit is dependent on many factors, such as the frequency of trades and position size; therefore, this figure by itself says nothing about the system except that it is profitable.

Average Trade

The average trade measures the trading system goodness of how much money could return or lose per trade the strategy. Its calculation is the result of Net Profit divided by the number of trades N.

Average Trade = Net Profit/ N

Net Profit should also consider the slippage and commissions spent during the test period.

Percentage of Profitable Trades

This indicator shows the number of winning trades over the total trades. The developer should understand that a trend following system could produce a low percentage of profitable trades and still be a feasible system. However, the developer should weigh how the system is balanced with the average winning trade/average losing trade ratio.

The percentage of profitable trades is computed, as

Percent Profitable = 100 x(Nr of wins/ N) where N is the total number of trades.

Profit Factor

The profit factor is an indicator that measures the gross Profit in relation to gross loss. This ratio is ideal for comparing different systems or the same system compared with different markets. According to Jaekle and Tomasini, a good trading system should have a profit factor higher or better than 1.5.

The profit factor is computed as

Profit Factor = Gross Profit/ Gross loss

where Gross Profit is the total Profit of the profitable trades, and Gross Loss is the total loss of the losing trades.

Drawdown

This popular indicator measures the largest loss or capital decline of a trading system. In other words, the drawdown is the reduction of the equity level. Jaekle and Tomasini, in their work, exposes three types of drawdown identifies as follows:

  1. End trade drawdown measures how much of the open Profit the trader give back before the exit from a specific trade.
  2. Close trade drawdown corresponds to the difference between the entry and exit price without considering what is going on within the trade.
  3. Start trade drawdown tells how much the trade went against the position side after the entry and before it started to go in the direction of the trade.

For simplicity, Jaekle and Tomasini propose closing trade drawdown because they consider it the “most significant.” At the same time, the developer should be careful to use this measure because it is dependent on the trade size

The average drawdown accepted by professional traders and money managers vary from 20% to 30%. Although 10% is considered an ideal drawdown, looking for too small drawdowns may limit the growth of a trading system.

Time Averages

Time averages measure the average time spent in all completed trades during a specific test period of the strategy. The developer should weight the average time elapsed for each trade and the risk taken on each position.

Proposed Preliminary Step

To perform the evaluation properly, a fundamental step is to normalize the trade record, by transforming it to trade only one unit per trade, and also by computing the results in terms of Profit versus risk. Once this is done, the results of a trading system can be properly compared to other similarly normalized systems or its previous variations.

Conclusions

In this educational article, we presented a group of indicators that could allow the system developer to decide with objective evidence what could be the best configuration to apply in the trading strategy or if the system is unviable.

At the same time, the evaluation process must weigh the potential profits with the risk involved during its execution and not make decisions based on a unique criterion, such as the Net Profit or the drawdown.

Suggested Readings

  • Jaekle, U., Tomasini, E.; Trading Systems: A New Approach to System Development and Portfolio Optimisation; Harriman House Ltd.; 1st Edition (2009).
Categories
Crypto Market Analysis

Daily Crypto Review, August 24 – YFI The Youngest DeFi Billionaire; IOTA Going Bankrupt

Cryptocurrencies spent most of the weekend recovering from the bearish move, which occurred late Friday and early Saturday. Bitcoin is currently trading for $11,731, which represents an increase of 1.11% on the day. Meanwhile, Ethereum gained 0.8% on the day, while XRP gained 1.71%.

 Daily Crypto Sector Heat Map

When taking a look at top100 cryptocurrencies, Cosmos gained 29.48% on the day, making it the most prominent daily gainer. IRISnet (21.33%) and The Midas Touch (18.49%) also did great. On the other hand, yearn.finance lost 8.32%, making it the most prominent daily loser. It is followed by Ren’s loss of 7.36% and Komodo’s drop of 6.67%.

Top 10 24-hour Performers (Click to enlarge)

Bottom 10 24-hour Performers (Click to enlarge)

Bitcoin’s dominance level has increased slightly and passed the 60% mark to the upside, with its value currently at 60.20%. This value represents a 0.46% difference to the upside when compared to our last report.

Daily Crypto Market Cap Chart

The cryptocurrency market cap experienced a decrease in value over the course of the weekend. Its current value is $362.71 billion, which represents a decrease of $10.46 billion when compared to our previous report.

_______________________________________________________________________

What happened in the past 24 hours?

_______________________________________________________________________

_______________________________________________________________________

Technical analysis

_______________________________________________________________________

Bitcoin

After a failed breakout of the ascending triangle, Bitcoin’s price started moving down until it reached $11,460 on Saturday. After reaching that level and not being able to pass it to the downside, Bitcoin bounced and started moving up slowly. The whole weekend was rather slow in terms of volatility, but extremely important in terms of where Bitcoin will end up. The fight for $11,630 was successful, and BTC is now above it, with the potential of going further up. However, the move to the upside will not go far with this volume, as it is way too low for any significant movement.

BTC traders should look for a trade near the $11,900 level, which might act as resistance.

BTC/USD 4-hour Chart

Technical factors:
  • Price is above its 50-period EMA as well as its 21-period EMA
  • Price is slightly above its middle band
  • RSI is neutral (54.45)
  • Volume is below average
Key levels to the upside          Key levels to the downside

1: $12,015                                1: $11,630

2: $12,300                                2: $11,460

3: $12,900                                 3: $11,090

Ethereum

Ethereum’s weekend was also spent in recovering from the bearish moves that occurred in the previous week. The second-largest cryptocurrency by market cap managed to stabilize at below-$400 levels, which it is now trying to pass to the upside. However, the moves which occurred in the past week created a downward-facing trend, which is creating resistance towards the upside, which Ethereum is struggling to pass with low volume, which it now has.

Ethereum traders can look for a trade after Ethereum breaks the trend (to any side).

ETH/USD 4-hour Chart

Technical Factors:
  • Price is currently above its 21-period and below its 50-period EMA
  • Price is at its middle band
  • RSI is neutral (49.72)
  • Volume is below average
Key levels to the upside          Key levels to the downside

1: $415                                     1: $400

2: $445                                     2: $361

3: $496                                      3: $340

Ripple

XRP’s chart looks no different than Bitcoin’s and Ethereum’s chart. The third-largest cryptocurrency by market cap spent the weekend recovering from what was lost during the bearish moves that occurred throughout the week. XRP stabilized at $0.28 and then gathered the strength to push past it. While the price is currently above the $0.285 level, it is not certain that it will stay that way. XRP would need a confirmation move in order to turn $0.285 into true support.

XRP traders can look for after XRP confirms its position, or after it drops below $0.285.

XRP/USD 4-hour Chart

Technical factors:
  • Price is currently above the 21-period and below the 50-period EMA
  • Price is slightly above the middle band
  • RSI is neutral (51.50)
  • Volume is stable and below average
Key levels to the upside          Key levels to the downside

1: $0.31                                     1: $0.285 

2: $0.32                                     2: $0.266

3: $0.332                                  3:$0.2454


Categories
Forex Options

FX Options Market Combined Volume Expiries for 24th August 2020

Thank you for visiting the Forex Academy FX Options market combined volume expiries section. Each day, where available, we will bring you notable maturities in FX Options of amounts of $100 million-plus, and where these large combined maturities at specified currency exchange rates often have a magnetic effect on price action, especially in the hours leading to their maturities, which happens daily at 10.00 AM Eastern time. This is because the big institutional players hedge their positions accordingly. Each option expiry should be considered ‘in-play’ with a good chance of a strike if labelled in red, still in play and a possible strike if labelled in orange and ‘out of play’ and an unlikely strike if labelled in blue, with regard to the likelihood of price action meeting the strike price at maturity.

…………………………………………………………………………………………………………

FX option expiries for Monday August 24 at the 10am NY cut

 -USD/JPY USD amount

  • 104.90 600m
  • 105.00 389m
  • 106.00 385m
  • 106.07 500m
  • 106.70 720m

USDJPY is looking for direction and is currently in a tight sideways range.

-GBP/USD GBP amount

  • 1.3050 235m

GBPUSD is in a tight sideways range after a couple of days of volatile trading. A firmer US dollar is keeping a lid on the pair right now. A retest of the support line seems on the cards leaving the door open for the one and only option expiry today.

-USD/CAD USD amount

  • 1.3265 510m

USDCAD is testing a support line but the option looks to be well out of play.

-NZD/USD NZD amount

  • 0.6555 241m

NZDUSD is in a tight sideways range with the option expiry close to the line of resistance.

………………………………………………………………………………….

As you can see on the preferred 1-hour chart(s), we have also plotted the expiration levels at the various exchange rate maturities and we have also labelled in red, orange and blue.  Therefore, if you see option expiry exchange rates labelled in red these should be considered in-play, because we believe there is a greater chance of the expiry maturing at these levels based on technical analysis at the time of writing. There is still a lesser possibility of a strike if they are in orange and so these are ‘in-play’ too. However, if we have labelled them in blue, they should be considered ‘not in-play’ and therefore price action would be unlikely to reach these levels, which are often referred to as Strikes, at the time of the 10 AM New York cut.

Our technical analysis is based on exchange rates which may be several hours earlier in the day and may not reflect price action at the time of the maturities. Also, we have not factored in economic data releases or keynote speeches by policymakers, or potential market volatility leading up to the cut.

Although we have added some technical analysis, we suggest you take the levels and plot them onto your own trading charts and incorporate the information into your own trading methodology in order to use the information to your advantage. Remember the higher the amount, the larger the gravitational pull towards the exchange rate maturity at 10:00 AM Eastern time.

If you want to learn how forex option expiries affect price action in the spot FX market see our educational article by clicking here: https://bit.ly/2VR2Nji

DISCLAIMER: Please note that this information is for educational purposes. Also, the maturities will look more or less likely to become a strike at 10 AM NY time due to exchange rate fluctuations resulting in a different perspective with regard to technical analysis, and also due to upcoming economic data releases for the associated pairs.

Categories
Forex Market Analysis

Daily F.X. Analysis, August 24 – Top Trade Setups In Forex – Choppy Sessions In Play! 

On the news front, the market isn’t expected to offer any major economic event today; therefore, most of the market movement is likely to be based upon technical levels. Choppy sessions are expected today.

Economic Events to Watch Today  


EUR/USD – Daily Analysis

The EUR/USD closed at 1.17953 after placing a high of 1.18828 and a low of 1.17539. Overall the movement of EUR/USD remained bearish throughout the day. The EUR/USD pair dropped on Friday and bottomed at 1.1753; it’s lowest since August 12. A stronger U.S. dollar and the poor economic data from Europe weighed on EUR/USD pair.

At 12:15 GMT, the French Flash Services PMI for August fell to 51.9 from the expected 56.3, and the previous 57.3, weighed on Euro. The French Flash Manufacturing PMI also declined to 49.0 against the estimated 53.0 and previous 52.4 and added pressure on single currency Euro.

At 12:30 GMT, the German Flash Manufacturing PMI rose to 53.0 from the anticipated 52.2 and supported Euro; however, the German Flash Services PMI came in as 50.8 against the expected 55.3 and weighed on Euro on Friday.

At 13:00, the Flash Manufacturing PMI for the whole Eurozone declined to 51.7 in August from the projected 52.7 and previous 51.8. The Flash Services PMI for the whole bloc also fell to 50.1 against the forecasted 54.6 and added pressure on EUR.

Apart from German Manufacturing PMI, all the PMI from the whole bloc, including biggest economies, came in against EUR, and hence, EUR/USD pair suffered. The data showed that only German manufacturing activity was expanded in August. At the same time, other countries, along with whole euro bloc’s manufacturing & services activities, were contracted in August. Meanwhile, the greenback was the top performer on Friday with DXY up by 0.5% on 93.5 level, the highest since Monday.

The U.S. Dollar was already supported by the release of Fed Meeting minutes on Wednesday, and on Friday, the support was extended after the release of positive PMI and Home Sales data.

At 18:45 GMT, the Flash Manufacturing PMI and the Flash Services PMI were released from the U.S. The Manufacturing PMI surged to 53.6 against the expected 51.9, and the Services PMI was surged to 54.u from the 50.9 forecasted. The expansion in the Manufacturing & Services sector of the U.S. gave strength to the U.S. dollar. At 19:00 GMT, the Existing Home Sales in July exceeded the expectations of 5.40M and came in as 5.86Mand supported the U.S. dollar.

The strong U.S. dollar exerted more pressure on EUR.USD prices and dragged them down at the ending day of the week. Meanwhile, the Euro currency was also under pressure because of the resurgence of coronavirus cases in Europe. In recent days France, Germany, and Italy have experienced their highest daily case counts since the spring, and Spain has found itself amid a major outbreak.

Over the past two weeks, Spain has seen Europe’s fastest rising caseload with 142 positive cases per 100,000 people. The number had risen more than 3,000 by the time the state of emergency ended on June 21.

The EUR/USD pair was also under pressure on Friday because of the possible entry of a new phase of the pandemic in Europe. 

Daily Technical Levels

Support Pivot Resistance
1.1787 1.1797 1.1807
1.1777 1.1817
1.1767 1.1827

 EUR/USD– Trading Tip

The EUR/USD pair fell sharply from 1.1954 level to 1.1790 level. For now, the pair is likely to find an immediate resistance at 1.1806 level, and a bullish breakout of 1.1806 level can lead EUR/USD prices towards 1.1886 level. On the lower side, the violation of the 1.1751 level can extend the selling trend until 1.1706.


GBP/USD – Daily Analysis

 The GBP/USD pair was closed at 1.30884 after placing a high of 1.32550 and a low of 1.30588. Overall the movement of GBP/USD pair remained bearish throughout the day. At 04:01 GMT, the GfK Consumer Confidence in August declined to -27 against the forecasted -25 and weighed on British Pound and added in the losses of GBP/USD pair. At 11:00 GMT, the Public Sector Net Borrowing increased to 25.9B from the expected 28.3B and supported British Pound. The Retail Sales for July also increased to 3.6% from the forecasted 2.0% and supported British Pound.

At 13:30 GMT, the Flash Manufacturing MI from Britain exceeded the expectations of 54.0 and came in as 55.3 and supported GBP. The Flash Services PMI also rose to 60.1 against the estimated 57.0 and supported GBP. At 15:00 GMT, the CBI Industrial Order Expectation in August was declined to -44 from the anticipated -34 and weighed on GBP/USD pair and added in its losses on Friday.

On the other hand, at 18:45 GTM, the Flash Manufacturing PMI from the U.S. surged to 53.6 from the anticipated 51.9 and supported the U.S. dollar that weighed on currency pair. The Flash Services PMI also surged to 54.8 against the anticipated 50.9 and supported the U.S. dollar. The Existing Home Sales exceeded the estimate of 5.40M and came in as 5.86M and supported the U.S. dollar that ultimately weighed on GBP/USD pair.

Meanwhile, on Brexit front, On Friday, the British and European Union negotiator made slight progress towards the post-Brexit trade deal in talks this week. Both sides were concerned that time to reach an agreement was running out before an end-year deadline.

The E.U. Chief negotiator, Micheal Barnier, said that those who were hoping for negotiations to move swiftly forward this week would be disappointed. However, his British counterpart, David Frost, said that a deal on post-Brexit relations was still possible and was still London’s goal, but it would not be easy to achieve.

Frost said that several significant areas remain to be resolved, and even when there was a broad understanding between negotiators, there was still much work to do as a time for both sides was short.

Britain shifted to be the leading country to ever leave the European Union on January 31 after 46 years of membership. Both sides are now negotiating a new partnership to be effective from 2021 on everything from trade and transport to energy and security. If both sides failed to reach an agreement, Britain would follow the World Trade Organization’s rules.

The attest round of talks between the U.K. & E.U. was also not fruitful, and it has decreased hopes for a post-Brexit deal. It means the hopes about the no-Brexit deal returned in the market and weighed on GBP/USD pair that caused a sudden fall in its prices on Friday.

The U.K. economy is also under pressure as the furlough scheme that has protected millions of jobs is scheduled to end in October. This would hit the labor market and increase unemployment, making it difficult to recover from the record 20% slump in the second quarter of this year.

These fears have also weighed on single currency Pound and kept the pair GBP/USD under pressure.

Daily Technical Levels

Support Pivot Resistance
1.3082 1.3092 1.3103
1.3071 1.3113
1.3062 1.3124

 GBP/USD– Trading Tip

On Monday, the GBP/USD pair is trading sideways above a strong support level if 1.3072. The support here is extended by 1.3074 level, where the bearish breakout of 1.3074 level can extend selling unto 1.3007 level. On the higher side, the next resistance is likely to be found around 1.3155 level. The 50 EMA and the technical indicators such as RSI, MACD, and 50 periods of EMA suggest a selling bias in the Cable. Let’s consider taking selling trades below 1.3075 level, while buying can be seen if the GBP/USD pair continues to close candles over 1.3075 level. 


USD/JPY – Daily Analysis

The USD/JPY pair was closed at 105.789 after placing a high of 106.070 and a low of 105.439. Overall the movement of USD/JPY remained almost flat yet slightly bullish. On Friday, the USD/JPY pair dropped in the first half of the day after the release of Japanese Manufacturing PMI and the persisting uncertainty due to ongoing geopolitical tensions. However, in the second half of the day, the USD/JPY pair recovered its early daily losses and rose to post slight gains amid better than expected U.S. economic data.

AT 04:30 GMT, the National Core CPI for the year declined to 0.0% from the estimated 0.1% and weighed on Japanese Yen. At 05:30 GMT, the Flash Manufacturing PMI from Japan in August rose to 46.6 against the estimated 45.0 and came in favor of Japanese Yen. The improvement in the manufacturing sector in Japan gave a push to Japanese Yen and dragged the pair USD/JPY to the lower level near 105.400.

However, after the release of positive macroeconomic data from the U.S., the USD/JPY pair started to rise and converted its daily losses in gains. At 18:45 GMT, the Flash Manufacturing PMI in August rose to 53.6 against the projected 51.9, and the Flash Services PMI rose to 54.8 against the anticipated 50.9.

The expansion in the U.S. manufacturing and services sector gave strength to the U.S. dollar that was more supported by the release of U.S. Existing Home Sales data. The Existing Home Sales in the U.S. for July rose to 5.86M from the anticipated 5.40M and gave a push to the U.S. dollar that added strength in USD/JPY pair.

The U.S. Dollar Index (DXY) that measures the value of the U.S. dollar against the basket of six major currencies rose by0.5% on Friday towards 93.5 level. It also helped USD/JPY pair to recover some of its daily losses on Friday.

Meanwhile, the ongoing geopolitical tensions between U.S. & China, along with the U.S. & Iran tensions, also kept the pair USD/JPY under pressure at the ending day of the week. On the US-China front, the US Trump administration denied acknowledging the plans to meet China over the discussion of implementations of the phase-one trade deal. The U.S. Commerce ministry spokesman Gao Feng said that in the coming days, the U.S. & China would hold meetings to discuss phase one trade deal.

However, the denial of any such meeting by Trump Administration added uncertainty in the market and kept the pair USD/JPY under pressure.

N the other hand, the U.S. called all U.N. sanctions to be restored on Iran after a violation of the 2015 nuclear deal. However, 13 out of 15 U.N. council members wrote against the U.S.’s request to impose sanctions on Iran as in 2018; the U.S. ended its legal terms with the 2015 nuclear deal by calling it the worst deal ever.

Meanwhile, the Chairman of China Banking and Insurance Regulatory Commission, Guo Shuqing said that the U.S. had placed domestic laws above international laws, which will affect the Chinese people and affect the whole world people including Americans. Shuqing also mentions that these sanctions by the U.S. on Hong Kong lacked legality and violated the market economy’s principles. The ongoing geopolitical tensions increased the uncertainty, which supported the Japanese Yen safe0haven status and contributed to the flat movement of the USD/JPY pair on Friday.

Daily Technical Levels

Support Pivot Resistance
105.7700 105.8500 105.9500
105.6700 106.0300
105.6000 106.1300


USD/JPY – Trading Tips

The USD/JPY is trading sideways in a broad trading range of 106.300 to 105.240. At the movement, the USD/JPY is tossing above and below 50 periods EMA, while the RSI and MACD are in support of a neutral trend. The recent series of Doji and Shooting start candles are suggesting indecision among traders. Sooner or later, we may see USD/JPY prices break out of the range. Once it happens, the USD/JPY may trade bullish over 106.300 to target 107.084. On the lower side, violation of 105.240 level can drive selling unto 104.300. Good luck! 

Categories
Forex Fundamental Analysis

What Is ‘Interbank Rate’ and What Impact Does It Have On The Forex Market?

Introduction

The Interbank rate is an essential tool used by the central authorities to control the money flow within the economy. Changes in the interbank rate can add or withdraw money from the system overall, which can stimulate growth or slow down the economy, respectively. The Interbank rate drives interest rates for bank loans, which are the significant sources of capital for businesses and the general public. The understanding of the Interbank rate is crucial for our analysis.

What is the Interbank Rate?

The interbank rate is the percentage rate at which the United States banks lend each other money. A country’s Central bank dictates the banking practices for the banks within the nation. For the United States, it is the Federal Reserve which decides the interest rates and the banking practices. The central banks, in general, demand 10% of their total deposits be held as reserves to maintain liquidity and meet withdrawal needs.

Based on the interbank rate, banks having excess cash can lend money to the banks, which are falling short of capital to meet their immediate requirements or to maintain their minimum reserves.

What is the Interbank Rate – Second Definition?

The interbank rate also refers to the rate at which banks exchange currencies in the global forex market. The forex market consists of an interbank market, which is a significant part of the forex market system overall. This interbank market consists of big players. Most of those are banks, large financial institutions, investment banks, and mutual funds corporations and do not include retail forex institutions or traders.

The interbank rate numbers are what you see when you search in Google the currency exchange rate for a particular pair, but this is not the rate at which you can trade a pair. This rate is only available for the interbank market participants who are usually big financial corporations trading in millions and billions. The price you see is a jacked-up price of the interbank rate in your platform. Your rate is the sum of interbank rate and the spread which your platform charges for trade as profit.

The minimum transaction in the interbank market is in millions; hence the retail traders will not be able to afford the interbank rate. The interbank market participants trade currencies to manage their exchange rate and control interest rate risk.

Although, you can neither control nor trade at the interbank rate, important for traders to be aware of the interbank rate to avoid getting scammed by Forex brokers who main charge way above the interbank rate. The decentralized system of Forex allows for self-regulation, and hence the interbank rates hand the actual exchange rates available to traders are competitive and self-correcting. However, novice traders who are not aware of this might lose money by paying an excessive spread to brokers.

Economic Reports

Federal Reserve determines the interbank rate, and the average of all the interbank rates in all the lending transactions between the banks in the United States is called the Fed Funds Rate.

The interbank credit system is applicable for a short period, usually ranging from overnight to a maximum of a week. Hence, the interbank rate is also called the Fed Funds Rate.

The Federal Reserve announces the Fed Funds Rate based on a variety of factors like inflation, GDP growth, recession, monetary policy, etc. On the 1st of every month, the Fed Funds Rate is released.

How can the Interbank Rate be Used for Analysis?

The Fed Funds Rate drives money in and out of the economy. The Fed Funds Rate drives the interest rate on bank loans that is available to the public and businesses.

A higher Fed Funds Rate would mean that loans are now expensive than before. To take a loan now would mean paying more interest rate. Hence the general public is discouraged from taking loans indirectly. On the other hand, now it would be more profitable to save as they receive a higher interest rate on their deposits. Both these factors can change the general public sentiment on money spending. A high-interest rate environment withdraws money from the economy, thereby slowing down economic activity as people are less willing to spend.

Conversely, a low interbank rate encourages banks to give loans at a cheaper rate, and hence more businesses and people will be able to afford loans; this will ultimately lead to the injection of money into the system overall. When more money is available to a company or an individual, the natural tendency is to increase spending, businesses may use for expansion plans. All of this will stimulate economic growth and result in printing higher levels of GDP.

Impact on Currency

Traders and investors can use the Fed Funds Rate as part of their analysis. Since Central authorities use the fed funds rate to manage the economy and money supply, a historical correlation of interest rates with GDP growth rates can help us to determine the direction of the economy and the value of its currency.  It is a proportional indicator meaning higher interbank rates relate to currency appreciating phenomenon and vice versa.

Higher Interbank rates result in banks paying out higher interest rates for deposits, which can also attract foreign investors to purchase domestic currency to make a deposit and earn better returns on their investment.  Therefore, an increase in capital flowing into the economy and decreased local currency circulation in the rest of the world, thereby increasing its demand and worth.

A low interbank rate results in increased money flow into the system, which can be inflationary, thereby depreciating the purchasing power of its currency. Conversely, a higher interbank rate results in decreased money circulation in the system, which will be deflationary for the economy, and the reduced demand for goods and services will increase the purchasing power of the currency as people would tend to save than spend.

Even though the interbank rate changes do not immediately get reflected in the macroeconomic numbers like GDP and currency value, it is a slow indicator in that sense that it takes a particular time (weeks to few months) to show its effect in actuality. It is also important to know that the authorities use the interbank rate as a response or corrective measure to the current economic situation.

It is more of a gate check for inflation or deflation. It is more of an effect to a cause and not a cause in itself. It is a passive indicator in comparison to other indicators. It reflects more the past and current economic activities than upcoming financial situations. The initial temporary volatility in the currency after the news release is typical, but the long term effect reflects after a certain number of weeks only.

Sources of Interbank Rates

We can find out the Fed Funds Rate from the official website of the Federal Reserve System of the United States: Federal Reserve SystemSelected Interest Rates. We can also find a historical graphical representation of the effective fed fund rate changes in the St. Louis FRED website. For reference – Fed Fund Rate

Impact of Interbank Rate News Announcement   

The ultimate goal of any fundamental analysis is usually to determine if there will be a hike or a cut in the interest rates. As mentioned earlier, the interbank rate can also be referred to as the Federal funds rate. In the US, the Federal Reserve releases the interbank rate is determined by the FOMC which meets eight times in a year to set this rate

Below is a screengrab of the Federal Funds Rate from Forex Factory. On the right, we can see a legend that indicates the level of impact the Fundamental Indicator has on the corresponding currency.

The snapshot below shows the latest release of the Federal Funds Rate on July 29, 2020, at 1.00 PM ET. In the latest release, the FOMC recommended that the rate remains within the target of 0% and 0.25%. This range was within the analysts’ expectations.

It is worth noting that this year, the Federal Reserve has conducted two emergency rate cuts to combat the Coronavirus inflicted economic shocks. The first emergency rate cut was on March 3, 2020, at 10.00 AM ET, as shown by the screenshot below. The Federal funds rate was reduced to a target range of 1.00% to 1.25% from the previous range of 1.50% to 1.75%.

At another unscheduled emergency meeting on March 15, 2020, at 4.00 PM ET, the FOMC cut the federal funds rate by 1.00% to a target range of 0.00% to 0.25%.

Now, let’s see how this news release made an impact on the Forex price charts.

EUR/USD: Before Interbank Rate release on July 29, 2020, Just Before 1.00 PM ET

As shown on the above 15-minute chart of the EUR/USD, the pair was on a progressing uptrend between 7.45 AM and 12.45 PM ET. This uptrend as evidenced by the subsequent bullish candles forming above the 20-period Moving Average.

EUR/USD: After Interbank Rate release on July 29, 2020, 1.00 PM ET

After the FOMC release of the Federal funds rate, there is a renewed volatility in the market. The initial market reaction was negative for USD since the FOMC kept the rate unchanged. The rate release did not result in a shift in the trend since most traders anticipate it and price in their expectations in the market.

Let’s quickly see how this new release has impacted some of the other major Forex currency pairs.

GBP/USD: Before Interbank Rate release on July 29, 2020, Just Before 1.00 PM ET

GBP/USD: After Interbank Rate release on July 29, 2020, 1.00 PM ET

The GBP/USD pair shows similar trends, as observed with the EUR/USD. There is a steady uptrend hours before the interbank rate release. Market volatility is present after the news release but not significant enough to alter the prevailing trend.

USD/CAD: Before Interbank Rate release on July 29, 2020, Just Before 1.00 PM ET

USD/CAD: After Interbank Rate release on July 29, 2020, 1.00 PM ET

For the USD/CAD pair, a weak uptrend is observed, with candles forming just around the 20-period Moving Average. After the interbank rate release, the pair shows the same weakness for the USD as observed with the EUR/USD and the GBP/USD.

Bottom Line

The interbank rate is a high-impact fundamental indicator in the forex market. The FOMC Statement, however, dampens its impact since it is focused on the future. It is therefore advisable for traders to avoid opening significant positions before this news release. Furthermore, reading the FOMC statement will help to gauge whether the Fed is hawkish or dovish about the future.

Categories
Forex Videos

Forex Options 3 – Option Pricing


Forex Options III – Option Pricing


Supply and demand

The price of a given option is determined in the real market by supply and demand. That means a buyer and a seller must agree on a determined price to complete a transaction. A buyer willing to buy at market price must pay the ask price. A seller wanting to sell at market price should accept the bid price. Options spreads are usually larger than spot spreads. For instance, the typical spread of a EURUSD spread is 3-4 pips, but its lower risk at a reduced cost makes them attractive to knowledgeable option traders.

A probability game


Options trading is a probability game. The long-term profitability of an options strategy is linked to the traders trying to buy undervalued options and sell overvalued options. Therefore, the trader should have a clear understanding of theoretical versus market valuations, and, in the case of FX Options, knowing the underlying market fundamentals.
The majority of options traders use an option as if it was the underlying, buying calls when they think the asset will go up and buying puts when considering it will go downward. The issue is that options are wasting assets, thus in most cases, that approach is unprofitable.

Structured approach


Most authors consider that to trade options successfully, a structured approach is necessary. A trading plan is needed, and, in addition, developing the discipline to follow it.
The benefits of a structured approach are:
Emotions are eliminated in the decision-making process
There is no psychological need to be right
The best thinking effort is made before the battle, avoiding subjective decisions

The Theoretical Pricing Model

Options are complex investment products as it involves estimating the odds the price of an underlying asset to surpass the strike price within a given time lapse. The most used model is The Black-Scholes equation that uses the price, volatility, time, and interest rates to compute an option’s fair price. The basic idea of the Black-Scholes model is that the right to delay a decision ( to buy an asset at a specific price) has a value, which can be computed.
A general trait of these models is the assumption that the distribution of prices in the market is Gaussian or something close to it, on a logarithmic scale. Although the Gaussian distribution is an approximation to the way prices move, it is essential to understanding the pricing model’s statistical nature.

Under this model, the price movements of the underlying assets move also following the Normal Distribution. If you’ve followed us in our Stats for traders” video series, you’d understand by now that 68,2% of the values following the bell-shaped curve lie within one standard deviation (SD) from the mean and 95.4% of them lie within two SDs.
That means only 31.8% lie away more than one SD, and just 4.6% go farther than two SDs. In the case of an option, we are interested in only one side of the bell curve. In this context, only 15.9% of the data points lie beyond 1 SD, and 2.3% beyond two SDs.

The Black-Scholes-Merton Formula

C(S0,t) = S0N(d1) -Ke-r(T-t) N(d2)

S0N(d1): The Intrinsic value
-Ke-r(T-t)N(d2): The time value of the option

d1 and d2 are calculations of the area of a point in the curve, which will show the price’s odds to reach that point.

As said, the Black-Scholes-Merton equation assumes that price movements follow the Gaussian Distribution. That, combined with an expiring date and the knowledge of the volatility (sigma) of the asset, are the key ingredients to assess the fair price of the option.
If we were to buy at the absolutely fair price, the model would predict zero gains and zero losses in the long term. But the volatility in the market is not constant but changing. Therefore, the ability to evaluate which options are cheap or expensive, under our forecasted scenario showing a higher (or lower) future volatility is one of the elements for success.

In the next video of this series, we will develop the volatility concept applied to options.


Recommended reading:
THE OPTION TRADER’S GUIDE TO PROBABILITY, VOLATILITY, AND TIMING , by Jay Kaeppel

Categories
Forex Videos

Forex Options 2 – Intrinsic Value & Time Value

Forex Options II – INTRINSIC VALUE AND TIME VALUE

As we have seen in our previous video, Options have value, called the premium. The premium is the cost of buying the option and varies depending on its strike price distance to the spot price.
As we can see on the graph 1, depending on whether the spot price is above, equal or below the strike price, it is said s call option is “in-the-money,” “at-the-money,” or “out-of-the- money” (Conversely, “out-of-the-money,” at-the-money” and “in-the-money” for a put option.)
The value of the option (premium) in a determined moment is composed of its intrinsic value and time value.
Premium = Intrinsic Value + Time Value

Intrinsic value


The intrinsic value of an option is the amount by which it is in-the-money. The intrinsic value part of the premium is not reduced or lost by the passage of time. On a Call option, it is the difference between the spot price and the strike price of the underlying asset. On a Put option, the intrinsic value is equal to the subtraction of the strike price and the asset’s spot price. If the option is at the money or out of the money, its intrinsic value is zero.
We can see that the intrinsic value is not dependent on how much time is left until its expiration. It only tells how much of the value of the asset is included in the price. If the intrinsic value is zero, then the premium has only time value, which decreases over time.

Time Value

The time value (Theta) can be thought of as the amount by which the premium exceeds its intrinsic value. Also called Extrinsic value, the time value has a direct relation to time, but also to changes in volatility. The time value of an option expiring in three weeks has less time value than a similar option expiring in six weeks. That is logical, as the buyer can profit more time from the movement of the option.
Since American options can be exercised any time before expiration, an option premium cannot go below its intrinsic value. This means that the cheaper the option, the less real value is included in the price. The price of out of the money options are lower as the strike price moves further out of the money. That is because the odds of being profitable at expiration decrease with distance from strike to spot price.
The time value has a kind of snowball behavior. It decreases slowly when far away from expiration, but it accelerates and depreciates faster and faster. On the expiration date, the option’s value is only its intrinsic value, which means the option has to be in the money.
As the option is deeper in the money, it has less time value and more intrinsic value. This also means the option behaves more and more as its underlying asset. This is related to the Delta getting closer to 100 ( or -100 in the case of puts). The higher the Delta, the option captures a higher percentage of the movement of its underlying asset.

That’s all for today. In the next videos will explain the basic strategies using options.


Recommended reading:
THE OPTION TRADER’S GUIDE TO PROBABILITY, VOLATILITY, AND TIMING , by Jay Kaeppel

Categories
Forex Price Action

Trendline Trading: Major Chart’s Support/Resistance and Take-Profit Target

In today’s lesson, we are going to demonstrate an example of trendline trading where the price trends towards the South by obeying a down-trending trendline. In one of our lessons, we learned the importance of choosing a chart for trendline trading. In today’s example, we find out one more point to go with that. Let us get started.

It is an H4 chart. The chart shows that the price heads towards the South by having a bullish correction. The chart shows that the price produces a double bottom. The buyers may keep their eyes on the chart to go long upon having a breakout at the neckline.

The price makes a breakout at the neckline and heads towards the North. It makes a bearish correction and resumes its bullish journey. The last wave suggests that the buyers may push the price towards the level, where the price made its bearish move earlier.

It does not. The price finds its resistance and makes a strong bearish move. It makes a breakout at the last swing low. What does that mean? It means we have two swing highs. With those, we can draw a down-trending trend line and wait for the price to go towards the trendline’s resistance to go short in the pair.

The price attempts to go towards the trendline’s resistance several times. However, it comes back to its horizontal support again. If we look at the horizontal support, the price bounces at the level three times. It becomes daily support, considering the number of H4 candles. On the other hand, the trendline’s resistance is an H4 resistance. The question is whether the H4 trendline traders should wait to go short from the trendline’s resistance or not? Let us proceed to the next chart and find more about it.

The chart produces a bearish engulfing candle. The price trends towards the South from the same trendline’s resistance. It produces another bearish reversal candle in the same chart.  Ideally, trendline traders should trigger a short entry right after the last candle closes by setting their take profit at the horizontal support. This is how the daily support is respected as well as the H4 sellers go short in the pair by using the trendline trading strategy. Let us see how the trade goes.

Wow! The price heads towards the South with good bearish momentum. It hits the target and makes a breakout at the horizontal support. It means the trendline is still active. The sellers may wait again for the price to go towards the trendline’s resistance and to get a bearish reversal candle to go short in the pair.

We must choose the right chart for trendline trading to take entry and we must remember the bigger time frame’s support/resistance to set take profit. If the risk-reward ratio is at least 1:1, we may take entry. If it is less than 1:1, we may skip taking entry and concentrate on some other charts.

Categories
Forex Market Analysis

Russell 2000 in Consolidation, Expecting for More Upsides

Overview

The Russell 2000 Index raised over 64% off its lowest level of the year, advancing from the extreme bearish to the extreme bullish sentiment zone. The incomplete complex corrective structure, still in progress, calls for more upsides in the coming trading sessions.

Market Sentiment Overview

This year, the Russell 2000 index is underperforming by 6.24% (YTD); however, it continues its recovery from the first quarter massive sell-off, when the U.S. index plummeted until its lowest level of the year at 953.77 pts, currently advancing 64.38% off its lows. 

The Russell 2000’s daily chart shows it’s moving inside the 52-week high-low range, exposing the development of a consolidation formation in the extreme bullish sentiment zone. Simultaneously, the 71-point reading observed in the fear and greed index reveals a bullish bias, helping support the upward bias that now prevails on the Russell 2000 Index. 

On the other hand, Russell 2000’s volatility index shows it’s moving in the extreme bearish sentiment zone, which increases the bullish perspective for the U.S index grouping the 2,000 small-cap U.S. companies.

Consequently, both the market structure consolidating in the extreme bullish sentiment zone and the decreasing volatility observed, lead us to expect further upsides for the following trading sessions, which could make it advance till its opening level of the year, at 1,672 pts.

Elliott Wave Outlook

The short-term overview under the Elliott wave perspective is shown in its 4-hour chart, which reveals the structure of a bullish sequence that remains intact since March 23rd when Russell 2000 found fresh buyers at 963.62 pts.

In the previous chart, we distinguish Russell 2000’s upward progression, moving in a complex corrective formation identified as a double three pattern (3-3-3) of Minute degree, marked in black, which belongs to a wave B of Minor degree labeled in green. 

The complexity level in the corrective sequence could be understood under the alternation principle context. Observing the first chart and considering the aggressive sell-off, lasting about in one month (since mid-February till mid-March), the alternation principle states that after a high-momentum level movement, a reduced-momentum move comes next, and vice versa.

Currently, Russell 2000 advances in wave (c) of Minuette degree, which began on July 10th when the U.S. index ended the wave e of the triangle pattern corresponding to wave (b) in blue. Once wave (b) was completed, the market participants pushed prices higher, carrying it till the 1,608 level on August 11th after the Russell 2000 Index found stiff resistance, which ended wave iii of Subminuette degree identified in green.

Consequently, we expect a limited sideways movement during the following trading sessions before continuing its advance toward fresh highs. Russell’s next upward movement could boost it to the 1,702.17 level, to test last February’s highs.

Categories
Forex Options

FX Options Market Combined Volume Expiries for 21st August 2020

Thank you for visiting the Forex Academy FX Options market combined volume expiries section. Each day, where available, we will bring you notable maturities in FX Options of amounts of $100 million-plus, and where these large combined maturities at specified currency exchange rates often have a magnetic effect on price action, especially in the hours leading to their maturities, which happens daily at 10.00 AM Eastern time. This is because the big institutional players hedge their positions accordingly. Each option expiry should be considered ‘in-play’ with a good chance of a strike if labelled in red, still in play and a possible strike if labelled in orange and ‘out of play’ and an unlikely strike if labelled in blue, with regard to the likelihood of price action meeting the strike price at maturity.

…………………………………………………………………………………………………………

FX option expiries for Friday, August 21st at the 10 am NY cut

-EUR/USD euro amount

  •  1.1750 534m
  •  1.1875 719m
  •  1.2000 546m

EURUSD pair failed to retest the 1.1900 level and is triggering stops in a renewed bear trend. Euro area and US data all out later will be important for the pair and create volatility.

-USD/JPY USD amount

  •  104.50 910m (not on the chart as out of play)
  •  105.00 551m
  •  106.00 747m
  •  107.10 680m

USDJPY is in a low volume bear trend. US data up later will prove key for the pair in the current market turmoil.

-GBP/USD GBP amount

  •  1.3090 201m

GBPUSD good retail sales numbers gave the Pound a lift today but a possible double top looms. It will be all about the US dollar from here. The option is out of play.

-USD/CAD USD amounts

  •  1.3225 505m
  •  1.3250 1.4bn

USDCAD is bouncing off of a line of support and trading in a narrow range. US and CAD data up later will test the pair.

-NZD/USD NZD amount

  •  0.6555 241m
  •  0.6580 301m

NZDUSD found resistance after a pullback from a strong bear trend. USD will rule today, with data up later providing the impetus for the next move.

-EUR/GBP euro amount

  •  0.9050 722m

EURGBP – The Pound is in control. The option is out of play.

………………………………………………………………………………….

As you can see on the preferred 1-hour chart(s), we have also plotted the expiration levels at the various exchange rate maturities and we have also labelled in red, orange and blue.  Therefore, if you see option expiry exchange rates labelled in red these should be considered in-play, because we believe there is a greater chance of the expiry maturing at these levels based on technical analysis at the time of writing. There is still a lesser possibility of a strike if they are in orange and so these are ‘in-play’ too. However, if we have labelled them in blue, they should be considered ‘not in-play’ and therefore price action would be unlikely to reach these levels, which are often referred to as Strikes, at the time of the 10 AM New York cut.

Our technical analysis is based on exchange rates which may be several hours earlier in the day and may not reflect price action at the time of the maturities. Also, we have not factored in economic data releases or keynote speeches by policymakers, or potential market volatility leading up to the cut.

Although we have added some technical analysis, we suggest you take the levels and plot them onto your own trading charts and incorporate the information into your own trading methodology in order to use the information to your advantage. Remember the higher the amount, the larger the gravitational pull towards the exchange rate maturity at 10:00 AM Eastern time.

If you want to learn how forex option expiries affect price action in the spot FX market see our educational article by clicking here: https://bit.ly/2VR2Nji

DISCLAIMER: Please note that this information is for educational purposes. Also, the maturities will look more or less likely to become a strike at 10 AM NY time due to exchange rate fluctuations resulting in a different perspective with regard to technical analysis, and also due to upcoming economic data releases for the associated pairs.

Categories
Forex Market Analysis

Daily F.X. Analysis, August 21 – Top Trade Setups In Forex – Eyes in PMI Figures! 

On the news front, eyes will remain on the Manufacturing PMI and Services PMI figures from the Eurozone, U.K., and the United States. Almost all economic figures are expected to perform better than previous months, perhaps due to the lift of lockdown. Price action will depend upon any surprise changes in the PMI figures.

Economic Events to Watch Today  


EUR/USD – Daily Analysis

Today in the Asian trading hours, the EUR/USD currency pair has succeeded in stopping its Thursday’s losing streak and continues to gain positive traction just closer to 1.1900 level, mainly due to the broad-based U.S. dollar weakness, triggered by the dismal U.S. Jobless Claims data. The upbeat market sentiment and on-going uncertainty surrounding the much-awaited U.S. fiscal stimulus also weighed on the safe-haven U.S. dollar and contributed to the currency pair gains. 

Across the pond, the shared currency continues to gaining bullish traction as most of the investors believe that the European Union (E.U.) will reach an agreement on a coronavirus recovery package for its members in late July. This, in turn, the currency pair has been flashing green since the week start. On the contrary, the rising coronavirus cases in Germany and France turned out to be a major factor that kept the lid on any further gains in the currency pair. 

As of writing, the EUR/USD currency pair is currently trading at 1.1882 and consolidates in the range between the 1.1856 – 1.1883. However, traders are cautious about placing any strong position ahead of German PMI. Moving on, the currency pair will likely put further bids if the preliminary German and Eurozone Markit manufacturing, services and composite PMI data for August blow past expectations on the day, this, in turn, bolstering hopes for faster economic recovery. On the contrary, the said, EUR/USD’ currency pair may face losses and revisit Thursday’s low of 1.18 if the German and Eurozone data prints below estimates. 

However, this data is scheduled to release at 07:30 GMT, and it is anticipated that German Manufacturing PMI increased to 52.5 from July’s 51. But, the progress pace in the activity is expected to have increased in August. Likewise, the Eurozone Manufacturing PMI is anticipated to increase to 52.9 from 51.8. Thus, the above-forecast data will fuel recovery hopes and decrease the case for further monetary stimulus from the European Central Bank. 

On the flip side, the data published by the U.S. showed that 1.106 million Americans declared unemployment benefits during the previous week, exceeding the anticipated 925,000 claims and last Thursday’s 971,000 figure. As a result, the U.S. dollar failed to maintain its previous Fed-gains and edged lower. 

In the meantime, the U.S. House Speaker Nancy Pelosi stated, This time seems not right for a smaller coronavirus relief bill.” The Democrat earlier showed a willingness to cut the aid package amount demand in half to renew hopes of America’s much-awaited stimulus. But as of now, the uncertainty remains on the cards amid the policymaker’s differences.

As in result, the broad-based U.S. dollar reported losses on the day as the possibility of the U.S. Congress agreeing to a fiscal stimulus bill this month has weakened amid political differences, which eventually destroyed hopes for a quick U.S. economic recovery. As well as, the doubts over the U.S. economy recover further fueled after the dismal US Jobs data. However, the losses in the U.S. dollar helped the currency pair to stay higher. Whereas, the U.S. Dollar Index that tracks the USD against a bucket of other currencies was down, inching down 0.09% to 92.692 by 10:13 PM ET (3:13 AM GMT).

At the coronavirus front, the figures of coronavirus cases increasing day by day. Whereas, the total number of cases crossed more than 231,284 figures so far, as per the report of German disease and epidemic control center, Robert Koch Institute (RKI). Although, these fears have been playing a negative role to cap further gains in the currency pair.

The market traders will keep their eyes on the German and Eurozone Markit manufacturing, services, and composite PMI Data. As well as, the headlines concerning the US COVID-19 aid package, virus figures, and Sino-American trade can also impact the pair’s movement.

Daily Technical Levels

Support Pivot Resistance
1.1817 1.1843 1.1884
1.1775 1.1911
1.1749 1.1952

 EUR/USD– Trading Tip

The EUR/USD pair has violated the sideways range of 1.1853 to 1.1830, and now it’s heading higher towards the next technical resistance level of 1.1915 level. On the lower side, the EUR/USD is likely to gain support at the 1.1860 level. Below 1.1860, the next support is likely to be found around the 1.1832 level. The bullish bias remains dominant today.


GBP/USD – Daily Analysis

The GBP/USD pair was closed at 1.32135 after placing a high of 1.32246 and a low of 1.30642. Overall the movement of GBP/USD pair remained bullish throughout the day. The Pound continued its strength against the U.S. dollar on Thursday amid increased hopes that the U.K. and E.U. will find a breakthrough in the latest round of post-Brexit talks that will conclude on Friday.

Few investors were betting that both sides will be able to find common ground on the key sticking issues, including access to British fishing waters and the level playing field rules, as the latest round of talks is set to end on Friday. The level playing field rules consist of a set of standard rules to ensure firms in the U.K. and E.U. compete on an equal footing, and Britain has been arguing against it.

The rise in GBP/USD pair on Thursday was followed by the increased optimism around the Brexit talks and the broad-based U.S. dollar weakness amid poor than expected U.S. jobless claims.

Investor’s focus has now shifted more towards the final round of Brexit talks in September, to see whether a deal could be reached. E.U. Brexit negotiator Michel Barnier has said that an agreement should be agreed by October to allow the E.U. to ratify the deal.

It has already clear that if no deal was agreed between U.K. and E.U., then U.K. will follow the WTO terms, which will be harsh than the current trade agreement that will lapse at the end of Brexit transition period on December 31.

However, earlier Prime Minister Boris Johnson decided against extending the transition period beyond the end of 2020 and signaled optimism that a deal could be reached by the fall, it triggered bullish momentum in the GBP/USD pair.

On the U.S. front, the Philly Fed Manufacturing Index declined to 17.2 from the expected 21.0 and weighed on the U.S. dollar. The Unemployment Claims from last week also rose to 1106K from the expected 930K and weighed on the U.S. dollar. The weak U.S. dollar added gains in the GBP/USD pair and closed the day with a strong bullish candle.

On Friday, the Retail Sales and Public Net Borrowings from Britain, along with the Consumer Confidence and Manufacturing & Services PMI data, will release that will impact on GBP/USD pair. The more important release will be the result of the latest Brexit talks with E.U. that will strongly impact the GBP/USD pair. From the U.S. side, the Flash manufacturing & Services PMI data will remain under focus by investors.

 Daily Technical Levels

Support Pivot Resistance
1.3108 1.3167 1.3271
1.3005 1.3329
1.2946 1.3433

 GBP/USD– Trading Tip

On Friday, the GBP/USD pair is trading at 1.3250 level, and the pair was trading in between an ascending triangle pattern that has now been violated. The triangle pattern was extending resistance at 1.3125 level, and above this, the next resistance is likely to be found around 1.3267 level. At the same time, the support stays at 1.3186 and 1.3137 level. Bullish bias seems dominant today.


USD/JPY – Daily Analysis

The USD/JPY pair was closed at 106.111 after placing a high of 106.150 and 105.101. Overall the movement of the USD/JPY pair remained bullish throughout the day. After falling for three consecutive days, the USD/JPY pair rose sharply and reached above 106.00 level on Wednesday amid broad-based U.S. dollar strength. 

The FOMC minutes of the July meeting revealed that policymakers supported cap bond yields and made it unlikely for the Fed to introduce yield curve control in September. In response to Fed minutes, the U.S. Dollar Index rose above 93 levels, and the U.S. 10-year Treasury yields rose about 0.9% and supported the U.S. dollar that ultimately gave strength to USD/JPY pair on Wednesday.

The sharp rally in USD/JPY was also supported by the comments of a senior Trump administration official who said that a new stimulus relief bill of small amount than $1 trillion or $3 trillion could be agreed upon and provide strength to the economy. He proposed a new bill of $500 billion as the previously expected stimulus bills proposed by Republicans & Democrats was failed to reach a consensus. This new bill also raised hopes and supported the U.S. dollar that pushed USD/JPY prices further on the upside.

On the data front, at 04:50 GMT, the Core Machinery Orders in June from Japan declined to -7.6% from the previous 1.7% and fell short of the expected 2.1% and weighed on Japanese Yen that added strength to the advancing USDJPY pair. Whereas, the Trade Balance from Japan showed a deficit of -0.03T against the forecasted -0.44T and the previous -0.41T and supported Japanese Yen.

On the other hand, the US-China relations were further dented after Donald Trump revealed the main reason behind the delay in review meetings between U.S. & Chinese officials on August 15 on Wednesday. According to Trump, he was furious over Beijing’s handling of coronavirus situations and disturbing the global economy, and that was the reason he canceled the review meeting. He said that he did not want to meet China for now.

The negative statement a day after blacklisting the Chinese telecom Huawei group in America escalated the tensions further and weighed on risk sentiment. This helped the U.S. dollar gain strength against its safe-haven status and raised the USD/JPY pair in the market.

Mark Meadows, the White House Chief of Staff, informed on Wednesday that no new high-level talks were rescheduled between the U.S. & China as two sides were already in touch regarding the implementation of the phase-one trade deal. This raised the risk sentiment and weighed on Japanese Yen that ultimately added gains in USD/JPY pair.

Daily Technical Levels

Support Pivot Resistance
105.6200 105.9200 106.1000
105.4300 106.4100
105.1300 106.5900


USD/JPY – Trading Tips

The USD/JPY has violated the upward trendline support level of 106.345, as it fell sharply in the wake of increased safe-haven appeal in the market. At the movement, the USD/JPY pair is holding below 50 periods EMA, while the RSI and MACD are in support of bearish trend. The recent candle is closing above 105.344 level, suggesting strong odds of bullish correction until 106. However, the violation of 106 can lead to USD/JPY prices towards the 104.600 support level. Good luck! 

Categories
Crypto Market Analysis

Daily Crypto Review, August 21 – OMG Network Token Up Over 100% Today; Tether Moving 1 Billion USDT From Tron to Ethereum Blockchain

While most of the top cryptocurrencies took the day to consolidate or advance slightly, Ethereum tokens were the most volatile and moved up or down with much more intensity. Bitcoin is currently trading for $11,835, which represents an increase of 0.56% on the day. Meanwhile, Ethereum gained 1.39% on the day, while XRP gained 1.01%.

 Daily Crypto Sector Heat Map

When taking a look at top100 cryptocurrencies, OMG Network gained 106.88% on the day, making it the most prominent daily gainer. 0x (48.58%) and Flexacoin (42.15%) also did great. On the other hand, Ren lost 14.05%, making it the most prominent daily loser. It is followed by Reserve Rights’ loss of 7.07% and Waves’ drop of 6.93%.

Top 10 24-hour Performers (Click to enlarge)

Bottom 10 24-hour Performers (Click to enlarge)

Bitcoin’s dominance level has decreased slightly and went under the 60% mark yet again, with its value currently at 59.74%. This value represents a 0.7% difference to the downside when compared to our last report.

Daily Crypto Market Cap Chart

The cryptocurrency market cap experienced a sharp increase in value over the course of the day. Its current value is $373.17 billion, which represents an increase of $9.41 billion when compared to our previous report.

_______________________________________________________________________

What happened in the past 24 hours?

_______________________________________________________________________

_______________________________________________________________________

Technical analysis

_______________________________________________________________________

Bitcoin

After a failed breakout of the ascending triangle, Bitcoin’s price started moving down sharply towards $11,630. The move, as we noted in our previous articles, stopped there. Bitcoin spent the past 24 hours mostly consolidating after a brief moment of bullish presence, which brought its price above $11,800 levels.

This move towards the upside, no matter how small it is, shows that Bitcoin is in a great spot at the moment, and it would take a lot to shake it out of this extremely bearish mid-term position.

BTC traders should be looking for a trade above $12,000, or after the push towards it fails.

BTC/USD 4-hour Chart

Technical factors:
  • Price is at its 50-period EMA and below its 21-period EMA
  • Price slightly below its middle band
  • RSI is neutral (48.45)
  • Volume is average (descending)
Key levels to the upside          Key levels to the downside

1: $12,015                                1: $11,630

2: $12,300                                2: $11,460

3: $12,900                                 3: $11,090

Ethereum

Ethereum spent the day struggling at the $415 level, as the fight for whether it will end up above or below the level is still continuing. The second-largest crypto by market cap recovered from its drop to $395 after hitting a semi-descending line, which acted as support/resistance since Aug 5.

This fight for $415 clearly shows the fight between two mindsets: bulls who are extremely bullish when it comes to DeFi and everything related, and bears which are scared of the skyrocketing ETH transaction fees as well as of the ICO scenario that happened around 2017.

Ethereum traders should wait for ETH to establish itself above or below $415 before trading.

ETH/USD 4-hour Chart

Technical Factors:
  • Price is currently at its 21-period and its 50-period EMA
  • Price is at its middle band
  • RSI is neutral (47.15)
  • Volume is slightly below average
Key levels to the upside          Key levels to the downside

1: $415                                     1: $400

2: $445                                     2: $361

3: $496                                      3: $340

Ripple

XRP’s chart looks a lot like BTC’s chart in the past couple of days. The third-largest cryptocurrency by market cap stopped moving towards the downside after hitting $0.285, which held up quite nicely. XRP then got a small boost towards the $0.29, where it is now consolidating.

With both 21-period and 50-period moving averages right above the price, XRP would require a strong bullish initiative in order to move towards $0.31, which (at the moment) seems unlikely.

Traders can look for an entry within the range between $0.285 and $0.31.

XRP/USD 4-hour Chart

Technical factors:
  • Price is currently below the 21-period and 50-period EMA
  • Price is slightly below the middle band
  • RSI is neutral (46.15)
  • Volume is descending (approaching average)
Key levels to the upside          Key levels to the downside

1: $0.31                                     1: $0.285 

2: $0.32                                     2: $0.266

3: $0.332                                  3:$0.2454


Categories
Forex Fundamental Analysis

How The ‘Corruption Rank’ Data Impacts A Nation’s Currency

Introduction

Corruption can very well be defined as seeking private gain through abuse of power that one has been entrusted. The biting effects of corruptions include:

  • Erosion of confidence in the monetary and economic system;
  • Hampering economic development;
  • Increase in current account deficits; and
  • Encouraging the growth of shadow economies

So, how does this affect a country’s currency valuation? Well, through GDP, of course! This correlation is explained in detail later on in this article.

Understanding Corruption Rank

Corruption rank is the ranking of countries worldwide based on how the countries’ public sector has been corrupted. It measures the extent of corruption by politicians and other public officials. Due to its nature of illegality and secrecy, there is no single indicator that directly measures the levels and extent of corruption in each country. The best measure of corruption rank is the Corruption Perceptions Index (CPI) published by Transparency International.

The CPI is used to rate the countries based on perceived levels of corruption on a sliding scale from 0 to 100. A score of 0 is considered the most corrupt. A country with a score of 100 is considered to be clean of corruption. The CPI is constructed based on the opinions of business executives, public policy experts, financial journalists, and risk analysts globally.

The CPI is a result of 13 rigorous assessments and surveys on wide-ranging issues on corruption collated by several reputable institutions around the world, including the World Bank and African Development Bank. These assessments and surveys are conducted in the two years preceding the publication. They incorporate a combination of qualitative and quantitative analysis which captures the manifestations of corruption, including:

  • Misuse of public resources;
  • Effectiveness of the prosecution of corruption cases by the judiciary;
  • The extent of bribery by firms and individuals to secure contracts, avoid taxations and payment of duties;
  • Bureaucratic loopholes that foster corruption; and
  • The effectiveness of anti-corruption measures implemented by the government

How Corruption Rank Impacts the Economy

To better understand how the corruption rank of a country influences its currency, we first must understand how corruption impacts a country’s economy.

Corruption inherently impacts the economy negatively. A specific study by the World Bank shows that the GDP per capita in countries with low CPI is about 60% less than for countries with a higher CPI. The negative effects of corruption are:

Overreliance on debt

Corruption results in a significant leakage in the budget. A country is thus forced to rely on debt, usually denominated in foreign currency. The interest payment leads to a higher share of revenue allocated to repayment in the short term instead of economic investments. This higher share of foreign borrowing also results in the local currency crisis.

Inefficiencies in the allocation of resources

Through bribery, the allocation of tenders is usually awarded to individuals and firms who are not qualified. As a result, most public projects are not completed, and the benefits to the economy foregone.

Creation of a shadow economy

Corruption facilitates the growth of several firms that avoid official registrations. As a result, the economy experiences a deficit in terms of taxation, import, and export duties payable. Consequently resulting in low GDP.

The exit of investors

Corruption leads to investors pulling their businesses out. This exit leads to reduced economic activities and accompanied by job losses.

A lower share of foreign direct investment (FDI)

Foreign investors often shun countries with rampant corruption since they seek a fair operating environment. Donor agencies such as IMF and World Bank also reduce their total outflows into such countries. Therefore, the recipient countries’ economy fails to benefit from such investments, which would have a multiplier effect within the economy. Also, because FDI is usually denominated in foreign currency, it usually boosts the recipient countries’ currency strength.

Reduced innovation

Corrupt countries offer very little protection in terms of patents and copyright protection. The lack of legal protection framework results in massive exportation of technology from such countries, thus denying the local economies the growth benefits.

Increase in current account deficits

Corruption creates a disincentive to invest in the local manufacturing and production industries. Apart from the drop in job creations, this leads to overreliance on importation to fill the local demand.

There is a direct inverse relationship between corruption levels in a country and its currency. The inverse correlation is because countries with higher perceptions of corruption have poor economic performance, while those with lower perceptions of corruption have better economic performance.

Consequently, a change in the corruption ranking is often accompanied by a corresponding change in the country’s GDP. In 2019, Sweden dropped in ranking from position 3 to position 4; this was coincided by a 6.37% drop in its annual GDP. During the same period, Malaysia ranked position 51 from 61, a period which coincided with a 1.68% annual GDP growth.

Source: ResearchGate 

How Corruption Rank Impacts a Currency

Although it is a rarely observed indicator, forex market investors should keep an eye on the annual release of the corruption rank. Because the corruption rank is based on two years’ worth of data, it is evident that the corruption rank signifies the underlying fundamental changes in a country’s economy.

High levels of corruption typically tend to be accompanied by a deteriorating economy. It is a known fact that the strength and fluctuation of a country’s currency are tied to its economic performance. Therefore, this is accompanied by a reduction in the valuation of the currency in the forex market.

Any improvements in the rank could forebode that the economy has been performing better, which will be accompanied by a significant appreciation in the country’s currency. Conversely, a drop in the corruption rankings signifies a deterioration in the economic conditions, which will result in the long-term changes in the currency’s value.

Sources of Data

The corruption perceptions index and the corruption rank are released annually by Transparency international. The corruption perceptions index can be accessed here and the corruption rank here.

How Corruption Rank Release Affects The Forex Price Charts

The corruption rank published annually by Transparency International rarely moves the forex market. It is, however vital for the forex traders to keep an eye out for CPI rank. As we have already discussed in this article, the CPI provides crucial information about the conditions of the underlying fundamentals of a country’s economy. The corruption rank is released annually following a two-year assessment and analysis. The latest CPI data for 2019 ranking 198 countries was released on January 23, 2020. A highlight of the release can be found on the Transparency International’s website.

Below is a snapshot of the top and bottom performers. The legend indicates the level of corruption in the country.

In 209, the US fell in rankings by one position, from 22 to 23 out of the 198 countries that were ranked. The screengrab below shows this position.

EUR/USD: Before Corruption Rank release on January 23, 2020

On the above chart, we have plotted a 20-period Moving Average on the EUR/USD chart. As can be seen, the pair had been on a consistent downtrend on the four-hour candlestick pattern. This downtrend is evident since the candlesticks are trending below the 20-period Moving Average. This similar downtrend on the four-hour candlestick chart can be observed on GBP/USD and NZD/USD, as shown by the charts below.

AUD/USD: Before Corruption Rank release on January 23, 2020

NZD/USD: Before Corruption Rank release January 23, 2020

For long-term traders, the pattern offers a great opportunity to go short on the above pairs, since the prevailing downtrends would favor them. Let’s now see how the price responded to the release of the corruption rank by Transparency International.

EUR/USD: After Corruption Rank release on January 23, 2020

After the release of the corruption rank, a persistent downtrend in the EUR/USD pair can still be observed. As shown on the daily chart above, the EUR/USD pair had a bullish candle on January 23, 2020. This strength is even though the US dropped in the corruption rank. Its CPI score dropped from 71 in 2018 to a score of 69 in 2019.

However, against the AUD, the USD can be observed to have weakened momentarily. The pair later regained its bullish trends. It is worth noting that the momentary strength in the AUD is because Australia performed better in the corruption ranking by climbing one position, as shown by the snapshot below.

The chart below shows the daily price action of the AUD/USD pair after the news release.

AUD/USD: After Corruption Rank release on January 23, 2020

The USD weakened against the NZD after the release of the corruption ranking. This weakness can be attributed to the fact that New Zealand ranked first with a score of 87. This ranking is shown by the screengrab below.

As can be seen on the daily chart below, USD weakened against the NZD after the news release.

NZD/USD: After Corruption Rank release on January 23, 2020

Corruption rank can be seen to have some mild effects on the price action of the selected pairs, but not enough to alter to the trend observed before its release. Although most forex traders rarely observe it due to the annual nature of its release, corruption rank provides vital information about the underlying fundamentals of an economy. All the best!

Categories
Forex Market Analysis

Daily F.X. Analysis, August 20 – Top Trade Setups In Forex – Jobless Claims In Focus! 

The news site of the market is likely to offer high impact events from the U.S. while the major focus will remain on the Philly Fed Manufacturing Index and Unemployment Claims. U.S. dollar may exhibit mixed bias until the release of these events as Philly fed manufacturing is expected to perform badly, and the Jobless claims are likely to perform well.

Economic Events to Watch Today  


EUR/USD – Daily Analysis

The EUR/USD currency pair has stopped its previous day bearish streak and recovered from the 27-month lows amid speculative interests and strong bond auction. However, the recent declines in the currency pair from near two-year highs of 1.1956 were mainly directed by a broad-based U.S. dollar recovery. As of now, the broad-based Us dollar has erased some of its gains but still hovering on the bullish track. This, in turn, the currency pair became able to put some modest bids and stop its previous losing streak. 

On the EUR side, the ongoing rise in new coronavirus cases in Spain, Germany, France, and Italy has been fueling the fears over the second-wave of the virus across Europe, which might put the shared currency under pressure and become the key factor that will cap any upside in the currency pair. At the moment, the EUR/USD currency pair is currently trading at 1.1843 and consolidating in the range between the 1.1831 – 1.1857. Moving on, the traders seem cautious to place any strong bids ahead of U.S. Jobless Claims and ECB minutes.

The broad-based U.S. dollar has many things to cheer on the day. Be it the weaker pace of surge in the COVID-19 cases from New York and Florida or hopes of the U.S. stimulus package, not to forget the latest Federal Open Market Committee (FOMC) minutes, which showed that the officials lacked support for the yield curve control, as one of the policy options. However, the broad-based U.S. dollar was being supported by all these things.

However, the ongoing worries about the growing coronavirus case in most places and worsened US-China relations also helped the U.S. dollar put the safe-haven bids. Despite the ongoing coronavirus (COVID-19) and Sino-American tensions, the U.S. President Donald Trump gave the latest warning during the daily press conference that the U.S. is going to announce punitive measures Iran. As per the keywords, “U.S. intends to restore nearly all U.N. sanctions on Iran.” In the meantime, the American Secretary of State Mike Pompeo also warned the Dragon Nation and Russia not to interfere in this matter to save Tehran as they did in the recent past. However, these lingering tension kept the market trading sentiment under pressure and provided support to the U.S. dollar as safe-haven status.

It is worth mentioning that the minutes from the July Fed meeting released Yesterday pushed back against additional measures like the yield curve control, under which the central bank targets a specific yield level at the short or long end of the curve. Meanwhile, the Federal Reserve indicated that it would think about changing its monetary policy to stick to dynamic monetary policy for far extended than previously expected. 

Across the pond, the intensifying coronavirus virus cases in Germany and France fueled the fears of fresh lockdowns in Europe’s biggest economies, which might weigh on the shared currency. As per the latest report, the reported coronavirus cases increased to 226,914, with a total of 9,243 deaths on Wednesday. Whereas, the cases raised by 1,510 in Germany on Wednesday against Tuesday +1,390. The death toll rose by 7, as per the German disease and epidemic control center report, Robert Koch Institute (RKI).

Looking forward, the market traders will keep their eyes on the U.S. Jobless Claims, Philly Fed Manufacturing Survey, and the European Central Bank (ECB) policy meeting minutes, which is scheduled to release later today. The headlines concerning the US COVID-19 aid package, virus figures, and Sino-American trade will not lose its importance.

Daily Technical Levels

Support Pivot Resistance
1.1792 1.1873 1.1916
1.1749 1.1997
1.1668 1.2041

 EUR/USD– Trading Tip

The EUR/USD pair is trading in a sideways range of 1.1853 to 1.1830, and violation of this range can determine further trends in the market. On the higher side, the EUR/USD can trade bullish until 1.1885 level on the breakout of 1.1850. On the lower side, a breakout of the 1.1830 level can lead EUR/USD until the 1.1792 level.


GBP/USD – Daily Analysis

The GBP/USD pair was closed at 1.30986 after placing a high of 1.32670 and a low of 1.30934. Overall the movement of GBP/USD pair remained bearish throughout the day. The GBP/USD pair lost all of its previous day gins and declined on Wednesday amid the broad-based U.S. dollar strength after the FOMC meeting minutes were released.

In the early daily session, the GBP/USD pair rose to its highest since last week of December 2019 on the back of better than expected macroeconomic data from the United Kingdom but failed to maintain gains and dropped below 1.310 level. The decline was backed by the sudden strength in the U.S. dollar after the Trump administration proposed another stimulus relief bill.

In the early trading session, the Consumer Price Index from Great Britain was released at 11:00 GMT that rose to 1% from the expected 0.6% and supported GBP. The year’s Core CPI also rose to 1.8% against the estimated 1.3% and the previous 1.4% and supported GBP. The Sterling was again supported after the release of PPI Input for July that surged to 1.8% from the forecasted 1.1%. In July, the PPI Output also rose from the expected 0.2% but remained flat with the previous 0.3%. The Raw-Material Price Index for the year from the U.K. increased to 1.6% from the previous 1.1% and exceeded the expectations of 1.2%. AT 13:30 GMT, the Housing Price Index for the year came in as 2.6%.

The positive and better than expected macroeconomic data from the U.K. gave strength to Pound that took the currency pair GBP/USD to its 8th month highest level at 1.32670. However, in the late trading session after the release of FOMC meeting minutes, the GBP/USD pair started to decline and lost all of its gains from Tuesday.

The minutes revealed that the FOMC was worried about the economic recovery, while some members of the committee suggested that to promote the economic recovery and achieve the 2% inflation target, additional accommodation was necessary.

Furthermore, as opposed to the $1 trillion or $3 trillion stimulus package, a new stimulus relief bill was proposed by the Trump administration on Wednesday of worth $500 Billion. It came in as the consensus on previously recommended bills by Democrats and Republicans has not been achieved yet. This raised hopes and U.S. dollar bars in the market and added additional losses in the GBP/USD currency pair.

Meanwhile, the Brexit talks have been resumed, and outlook of talks still suggested differences as several media reports suggested that U.K. wanted British truckers to be able to pick up and drop off goods both inside E.U. countries and between them. But Brussels has denied as they consider the proposal fundamentally unbalanced, this also weighed on GBP/USD pair on Wednesday.

 Daily Technical Levels

Support Pivot Resistance
1.3037 1.3153 1.3212
1.2978 1.3328
1.2862 1.3388

 GBP/USD– Trading Tip

On Thursday, the GBP/USD pair is trading at 1.3250 level, and the pair was trading in between an ascending triangle pattern that has now been violated. The triangle pattern was extending resistance at 1.3125 level, and above this, the next resistance is pretty much likely to be found around 1.3267 level. At the same time, the support stays at 1.3186 and 1.3137 level. Bullish bias seems dominant today.


USD/JPY – Daily Analysis

The USD/JPY pair was closed at 106.111 after placing a high of 106.150 and 105.101. Overall the movement of the USD/JPY pair remained bullish throughout the day. After falling for three consecutive days, the USD/JPY pair rose sharply and reached above 106.00 level on Wednesday amid broad-based U.S. dollar strength. 

The FOMC minutes of the July meeting revealed that policymakers supported to cap bond yields and made it unlikely for the Fed to introduce yield curve control in September. In response to Fed minutes, the U.S. Dollar Index rose above 93 levels, and the U.S. 10-year Treasury yields rose about 0.9% and supported the U.S. dollar that ultimately gave strength to USD/JPY pair on Wednesday.

The sharp rally in USD/JPY was also supported by the comments of a senior Trump administration official who said that a new stimulus relief bill of small amount than $1 trillion or $3 trillion could be agreed upon and provide strength to the economy. He proposed a new bill of $500 billion as the previously expected stimulus bills proposed by Republicans & Democrats was failed to reach a consensus. This new bill also raised hopes and supported the U.S. dollar that pushed USD/JPY prices further on the upside.

On the data front, at 04:50 GMT, the Core Machinery Orders in June from Japan declined to -7.6% from the previous 1.7% and fell short of the expected 2.1% and weighed on Japanese Yen that added strength to the advancing USDJPY pair. Whereas, the Trade Balance from Japan showed a deficit of -0.03T against the forecasted -0.44T and the previous -0.41T and supported Japanese Yen.

On the other hand, the US-China relations were further dented after Donald Trump revealed the main reason behind the delay in review meetings between U.S. & Chinese officials on August 15 on Wednesday. According to Trump, he was very angry over Beijing’s handling of coronavirus situations and disturbing the global economy, and that was the reason he canceled the review meeting. He said that he did not want to meet China for now.

The negative statement a day after blacklisting the Chinese telecom Huawei group in America escalated the tensions further and weighed on risk sentiment. This helped the U.S. dollar to gain strength against its safe-haven status and raised the USD/JPY pair in the market.

Mark Meadows, the White House Chief of Staff, informed on Wednesday that no new high-level talks were rescheduled between the U.S. & China as two sides were already in touch regarding the implementation of the phase-one trade deal. This raised the risk sentiment and weighed on Japanese Yen that ultimately added gains in USD/JPY pair.

Daily Technical Levels

Support Pivot Resistance
105.4100 105.7800 106.4600
104.7200 106.8400
104.3500 107.5200


USD/JPY – Trading Tips

The USD/JPY has violated the upward trendline support level of 106.345, as it fell sharply in the wake of increased safe-haven appeal in the market. At the movement, the USD/JPY pair is holding below 50 periods EMA, while the RSI and MACD are in support of bearish trend. The recent candle is closing above 105.344 level, suggesting strong odds of bullish correction until 106. However, the violation of 106 can lead to USD/JPY prices towards the 104.600 support level. Good luck! 

Categories
Forex Options

FX Options Market Combined Volume Expiries for 20th August 2020

Thank you for visiting the Forex Academy FX Options market combined volume expiries section. Each day, where available, we will bring you notable maturities in FX Options of amounts of $100 million-plus, and where these large combined maturities at specified currency exchange rates often have a magnetic effect on price action, especially in the hours leading to their maturities, which happens daily at 10.00 AM Eastern time. This is because the big institutional players hedge their positions accordingly. Each option expiry should be considered ‘in-play’ with a good chance of a strike if labelled in red, still in play and a possible strike if labelled in orange and ‘out of play’ and an unlikely strike if labelled in blue, with regard to the likelihood of price action meeting the strike price at maturity.

…………………………………………………………………………………………………………

FX option expiries for Thursday, August 20 at the 10 am NY cut

-EUR/USD euro amounts

  •  1.1750 797m
  •  1.1770 585m
  •  1.1800 833m
  •  1.1840 584m
  •  1.1850 1.9bn
  •  1.1900 1.4bn
  •  1.1950 1.3bn

EURUSD is consolidating after the push lower.

-USD/JPY USD amount

  •  107.00 1.2bn

USDJPY is consolidating. The next move will likely be on the back of US data out later. The option at 107.00 is out of play.

-GBP/USD GBP amounts

  •  1.3100 231m
  •  1.3110 214m

GBPUSD is caught in a bear trend. The directional bias remains tilted to the downside, but the push may only come after US jobs data out later.

-AUD/USD AUD amount

  •  0.7120 566m

AUSUSD is off its lows and finding support. If the 0.7150 level can be breached to the downside it will leave the door open for a strike at the New York cut for the only option here today.

-USD/CADn USD amount

  •  1.3250 660m

USDCAD is in a pullback from its high. If the resistance line is breached at 1.3232 the option expiry will be on the cards. Again, the US data will be important.

-NZD/USD NZD amount

  •  0.6555 241m

NZDUSD price action is in the vicinity of the option. The pair will follow US dollar strength or weakness during the European session. US jobs data will be key to the next trend.

………………………………………………………………………………….

As you can see on the preferred 1-hour chart(s), we have also plotted the expiration levels at the various exchange rate maturities and we have also labelled in red, orange and blue.  Therefore, if you see option expiry exchange rates labelled in red these should be considered in-play, because we believe there is a greater chance of the expiry maturing at these levels based on technical analysis at the time of writing. There is still a lesser possibility of a strike if they are in orange and so these are ‘in-play’ too. However, if we have labelled them in blue, they should be considered ‘not in-play’ and therefore price action would be unlikely to reach these levels, which are often referred to as Strikes, at the time of the 10 AM New York cut.

Our technical analysis is based on exchange rates which may be several hours earlier in the day and may not reflect price action at the time of the maturities. Also, we have not factored in economic data releases or keynote speeches by policymakers, or potential market volatility leading up to the cut.

Although we have added some technical analysis, we suggest you take the levels and plot them onto your own trading charts and incorporate the information into your own trading methodology in order to use the information to your advantage. Remember the higher the amount, the larger the gravitational pull towards the exchange rate maturity at 10:00 AM Eastern time.

If you want to learn how forex option expiries affect price action in the spot FX market see our educational article by clicking here: https://bit.ly/2VR2Nji

DISCLAIMER: Please note that this information is for educational purposes. Also, the maturities will look more or less likely to become a strike at 10 AM NY time due to exchange rate fluctuations resulting in a different perspective with regard to technical analysis, and also due to upcoming economic data releases for the associated pairs.

Categories
Crypto Market Analysis

Daily Crypto Review, August 20 – ETH Plummets Due To Skyrocketing Transaction Fees; $12,000 Level Too Strong For Bitcoin

While most of the top cryptos had a slightly red day, Ethereum tokens mostly did great. Bitcoin is currently trading for $11,732, which represents a decrease of 0.25% on the day. Meanwhile, Ethereum lost 1.26% on the day, while XRP lost 1.24%.

 Daily Crypto Sector Heat Map

When taking a look at top100 cryptocurrencies, OMG Network gained 26.67% on the day, making it the most prominent daily gainer. yearn.finance (20.13%) and Qtum (10.04%) also did great. On the other hand, Balancer lost 19.84%, making it the most prominent daily loser. It is followed by Compound’s loss of 9.50% and Waves’ drop of 8,97%.

Top 10 24-hour Performers (Click to enlarge)

Bottom 10 24-hour Performers (Click to enlarge)

Bitcoin’s dominance level has increased slightly and passed the 60% mark, with its value currently at 60.44%. This value represents a 0.77% difference to the upside when compared to our last report.

Daily Crypto Market Cap Chart

The cryptocurrency market cap experienced a slight increase in value over the course of the day. Its current value is $364.76 billion, which represents an increase of $0.56 billion when compared to our previous report.

_______________________________________________________________________

What happened in the past 24 hours?

_______________________________________________________________________

_______________________________________________________________________

Technical analysis

_______________________________________________________________________

Bitcoin

After a brief break of the $12,000 level, Bitcoin fell down and is controlled by BTC bears for the second day in a row. The largest cryptocurrency by market cap has moved towards the $11,630 support level (as we said in our previous article) and tried to test its strength. The level held up, and Bitcoin is now consolidating right above it.

This bear push was caused by several factors, but mostly because of the immense resistance at around $12,000 and the challenges Ethereum faces with its incredibly high transaction fees (Bitcoin acts as a “representative” to all the cryptos, so it affects others, but is also affected by others).

BTC traders should be looking for a trade when Bitcoin breaks $11,630 to the downside or pushes towards $12,000 again.

BTC/USD 4-hour Chart

Technical factors:
  • Price is below its 50-period EMA and its 21-period EMA
  • Price is between its lower and middle band
  • RSI is slightly tilted towards the oversold area (41.97)
  • Volume is average
Key levels to the upside          Key levels to the downside

1: $12,015                                1: $11,630

2: $12,300                                2: $11,460

3: $12,900                                 3: $11,090

Ethereum

Even though Ethereum’s social sentiment is still extremely high due to the craze over DeFi, it is a fact that ETH’s transaction fees have been skyrocketing as the demand for DeFi increased. This fact, along with Bitcoin not being able to break the $12,000 mark, caused the second-largest cryptocurrency by market cap to drop below its $415 support level (now resistance). The drop stopped around $400 and changed direction, trying to retake its previous highs. However, the $415 resistance level confirmed its strength, leaving ETH below it.

Ethereum traders should look for a trade when ETH breaks $415 to the upside.

ETH/USD 4-hour Chart

Technical Factors:
  • Price is currently below its 21-period and its 50-period EMA
  • Price is slightly above its lower band
  • RSI is descending (39.54) and approaching oversold levels
  • Volume is average
Key levels to the upside          Key levels to the downside

1: $415                                     1: $400

2: $445                                     2: $361

3: $496                                      3: $340

Ripple

XRP has had quite a bad day, as it essentially nullified any previous moves towards the upside. The third-largest cryptocurrency by market cap dropped to $0.285 levels (and even below it at one point). While the level held up and secured XRP’s position above it, for the time being, XRP does not look like it will make another move towards the upside soon.

Traders can look for a trade when XRP breaks $0.285 to the downside.

XRP/USD 4-hour Chart

Technical factors:
  • Price is currently below the 21-period and 50-period EMA
  • Price is slightly above the lower band
  • RSI is neutral (40.49)
  • Volume is descending (though it is slightly elevated)
Key levels to the upside          Key levels to the downside

1: $0.31                                     1: $0.285 

2: $0.32                                     2: $0.266

3: $0.332                                  3:$0.2454


Categories
Forex Basic Strategies

Reliable Way To Make 30-Pips A Day In The Forex Market

Introduction

The 30 pips a day is a trading strategy that is based on market continuation pattern. This strategy is very profitable and has a long history of providing a substantial gain. Therefore, if you can implement this strategy well, you can make a decent profit from the forex market. This strategy is focused on a quick gain from the market; therefore, the currency pair that usually make a fast move is recommended for this strategy.

In this trading strategy, we will use the following elements:

  • 10 EMA and 26 EMA to identify the market direction. The main reason for using the Exponential Moving average over the simple moving average is that it provides the most reliable result in a short timeframe.
  • We will use 5-minute timeframe for trading as our focus is to make a quick gain from a short move.
  • We will implement the strategy in GBPJPY pair as it provides fast move in a short timeframe.

30 Pips a Day Trading System

In this trading strategy, we will consider the trend as an uptrend if the 10 EMA crosses the 26 EMA. Similarly, we will consider the trend as a downtrend if the 10 EMA crosses the 26 EMA. The reason for choosing the GBPJPY pair is that it has a higher daily movement compared to the other major currencies. GBPJPY pair can move 100-200 pips a day while most of the major currency pairs can move 60-100 pips a day.

However, our aim is not to catch every move during the day. Instead, we will focus on a little part of it, like 30 pips. That’s why the name of this trading strategy is 30 pips a day. In this trading strategy, the Potential Trading Zone is significant.

What is the Potential Trading Zone?

It is the zone where we will make trades based on our trading element. It is usually the reversal zone from where the price is likely to reverse from the current direction. Therefore, we will make the buying and selling decision at this zone depending on the current market trend.

In the above example, we can see that the major trend of the currency pair down. Despite the downtrend, the price will move up with a corrective speed, which is a minor counter-trend rally. In the 30 pips a day trading strategy, we will focus on the minor trend reversal movement and wait for the price to return to the major trend.

We can find the same market movement in the uptrend where the price will come down with a corrective speed. Later on, we will focus on the price zone from where the price is likely to resume its major trend.

Sell Setup Using the 30 Pips a Day Trading Strategy

  • Identify the major trend. If the primary trend is down, we will focus on sell trades only.
  • Find the location of price where 10 EMA crosses down the 26 EMA.
  • Do not sell immediately after the crossover. Wait for the price to make a retracement.
  • Enter the sell as soon as the candle crosses the potential trading zone halfway between the 10 and 26 EMA.
  • Stop-loss should be 15-20 pips.
  • Take profit should be 30 pips.

Example of 30 Pips a Day Sell Setup

In the above image, we can see that the 10 EMA crossed below the 26 EMA and moved up. The crossover is the first indication of sell entry. Later on, the trade setup comes as soon as price creates a bearish candle after a bullish rejection.

Buy Setup Using the 30 Pips a Day Trading Strategy

  • Identify the major trend. If the major trend is bullish, we will focus on buy trades only.
  • Find the location of price where 10 EMA crosses above the 26 EMA.
  • Do not buy immediately after the crossover. Wait for the price to make a retracement.
  • Enter the buy as soon as the candle crosses the potential trading zone halfway between the 10 and 26 EMA.
  • Stop-loss should be 15-20 pips.
  • Take profit should be 30 pips.

Example of 30 Pips a Day Buy Setup

In the above image, we can see that the 10 EMA crossed above the 26 EMA and moved down. The crossover is the first indication of buy entry. Later on, the trade setup comes as soon as price creates a bullish candle after a bearish rejection.

Alternative Trading Entry for 30 Pips a Day

  • If you don’t have enough time to manage your trade, you can simply use a pending order.
  • Once the candlestick comes back after the primary crossover, wait for a reversal candle to appear. Later on, place a buy stop or sell stop above or below the reversal candlestick.
  • You can place the stop loss above or below the candle high or low with some buffer. However, you can use the nearest swing points as a stop loss level also. Moreover, to take profit, you can set it to 30 pips.

Pros and Cons of 30 Pips a Day Trading Strategy

Like other trading strategies, 30 pips a day trading strategy has both strength and weakness.

Pros

  • As the GBPJPY pair is very volatile, it is straightforward to make 30 pips daily.
  • In a trending market, this strategy works well.
  • This strategy works well in Asian and London Session.

Cons

Summary

Let’s summarize the 30 pips a day trading strategy:

  • Identify the trending market in the GBPJPY pair.
  • Move to the 5-minute chart and identify a market where 10 EMA crosses the 26 EMA.
  • Wait for correction and enter the trade as soon as market rejects from the potential trading zone.
  • Set stop loss at 15-20 pips and take profit at 30 pips.

In every trading strategy, trade management is an important part. In the forex market, we anticipate the movement of various currency pairs and every pair moves in a different way. Therefore, if you face some consecutive losses, it is better to take a break from trading and enter the trade again as soon as the market starts to move as you expect.

Categories
Forex Market Analysis

Daily F.X. Analysis, August 19 – Top Trade Setups In Forex – Eyes on FOMC Meeting Minutes! 

On the news front, the eyes will remain on the FOMC Meeting Minutes, which are not expected to show a rate change but will help us understand U.S. economic situation and policymakers’ stance on it. Besides, the Inflation reports from the U.K. and Eurozone are also likely to drive some price action during the European session today.

Economic Events to Watch Today  


EUR/USD – Daily Analysis

The EUR/USD pair was closed at 1.19308 after placing a high of 1.19654 and a low of 1.1863. Overall the movement of the EUR/USD pair remained bullish throughout the day. The EUR/USD pair rose and extended its gains for the 6th consecutive day on Tuesday amid heavy selling pressure surrounding the greenback. The pair EUR/USD surged to its highest level since May 2018 amid broad-based U.S. dollar weakness as it followed the U.S. Treasury bond yields.

The U.S. Treasury bond yield on 10-year note lost more than 4% on the day, and the U.S. Dollar Index fell to its lowest daily close in more than two years at $92.30. Other than the persistent sell-off in the U.S. dollar, the single currency Euro found extra sustain in the solid appetite for riskier assets on the back of strong hopes over a moderate economic recovery in the region. It was increased by the news that a coronavirus vaccine could be out sooner than expected.

The risk sentiment was also supported by the investors’ confidence about the strength of the U.S. economic recovery, helped by strong earnings from retail giants Home Depot and Walmart.

The stocks were up on Tuesday as S&P 500 futures rose by 0.2%, the Dow futures contract rose by 0.4%, and while Nasdaq 100 futures moved up by 0.3%. According to a fund manager survey from Bank of America on Tuesday, showed that investors were at their most bullish trend on financial markets since February. The rise in the equity market helped increase risk appetite and EUR that is a riskier asset gained from such activity in the market.

On the data front, there was no macroeconomic data to be released from the Europe side; however, from the U.S. side, at 17:30 GMT, the Building Permits exceeded the expectations of 1.33M and came in as 1.50M in July in comparison of 1.26M of June and supported U.S. dollar. The Housing Starts also rose to 1.50M and exceeded the forecast of 1.23M and supported the U.S. dollar. Positive data from the U.S. side supported the dollar and limited the additional gains in EUR/USD pair on Tuesday.

On Wednesday, the Eurostat will release the inflation report for the Euro area. Markets expect the Core Consumer Price Inflation that excludes the volatile food and energy prices to remain flat at 1.2% on a yearly basis.

From the U.S. side, the FOMC meeting minutes will also be released to provide fresh clues about the movement of the EUR/USD pair.

Daily Technical Levels

Support Pivot Resistance
1.1873 1.1920 1.1975
1.1818 1.2022
1.1772 1.2077

 EUR/USD– Trading Tip

The EUR/USD pair has already violated the resistance level of 1.1912 level, which is now working as a support. On the 4 hour timeframe, the pair is supported by an upward channel at 1.1915, while the resistance stays at 1.1962 level. Bullish bias seems dominant, and it may lead the EUR/USD prices towards the 1.1998 level today. The RSI, MACD, and 50 EMA are all in support of buying trends. 


GBP/USD – Daily Analysis

The GBP/USD pair was closed at 1.32373 after placing a high of 1.32496 and a low of 1.30924. Overall the movement of GBP/USD pair remained strongly bullish. The GBP/USD pair continued to extend gains and rose for 4th consecutive day on Tuesday on the back of a combination of factors. The uncertainty over the next round of U.S. stimulus aid to support the U.S. economic recovery from the coronavirus pandemic has depressed the U.S. dollar. The falling U.S. Treasury bond yields further weighed on the already declining greenback and added gains in the GBP/USD pair.

The Sterling hit 8-months high on Tuesday as a new round of Brexit talks began, and the U.K. still believes that it can agree on a post-Brexit trade deal with the E.U. next month. On Tuesday ahead of the Brexit talks, a European Commission spokesman said that a deal would need to be agreed on by October. On the other hand, Mr. Barnier said that this date required an agreement to be ratified before the U.K.’s current post-Brexit transition period ends in December.

After the last round of negotiations in London, Barnier accused the U.K. of not showing willingness to break the deadlock over difficult issues. In response, David Frost replied that the E.U. had offered to break the deadlock but failed to honor the fundamental principles that the U.K. had repeatedly made clear.

On the data side, at 17:30 GMT, the Building Permits from the United States was increased to 1.50M from the forecasted 1.33M in July, and the Housing Starts also rose to 1.50 M from the expected 1.23M and supported U.S. dollar. The economic figures from the U.S. were mostly ignored by the investors as the focus was all shifted towards the new round of Brexit talks.

However, the U.S. dollar was weak across the board on Tuesday as the U.S. Dollar Index collapsed to its lowest level in more than two years at 92.28 and was having a tough time recovering. This added pressure on the greenback and added gains in the GBP/USD pair on Tuesday.

However, the losses in the U.S. dollar helped the currency pair to take bids on the day. 

 Daily Technical Levels

Support Pivot Resistance
1.3136 1.3193 1.3291
1.3037 1.3349
1.2980 1.3447

 GBP/USD– Trading Tip

The GBP/USD pair is trading at 1.3250 level, and the pair was trading in between an ascending triangle pattern that has now been violated. The triangle pattern was extending resistance at 1.3125 level, and above this, the next resistance is pretty much likely to be found around 1.3267 level. At the same time, the support stays at 1.3186 and 1.3137 level. Bullish bias seems dominant today.


USD/JPY – Daily Analysis

The USD/JPY pair was closed at 105.407 after placing a high of 106.050 and a low of 105.281. Overall the movement of the USD/JPY pair remained bearish throughout the day. The USD/JPY pair moved to a fresh 2-week lowest level around 105.20 regions after the U.S. dollar selling pressure picked up pace during the late session.

The currency pair witnessed some strong follow-through selling for the third consecutive session and extended its bearish slide from 107.00 level. The downfall in USD/JPY pair was exclusively sponsored by the broad-based U.S. dollar weakness under pressure due to impasse over the next round of U.S. fiscal stimulus measures.

The additional pressure on the U.S. dollar was exerted by the declining U.S. Treasury bond yields that undermined the already weak sentiment across the greenback. The U.S. Treasury bond yield on the 10-year note fell by 2.8% on Tuesday that weighed on the U.S. dollar.

Apart from the U.S. Treasury, the escalating tensions between the U.S. & China, drove some safe-haven flows towards the Japanese Yen that further added in the downward momentum of USD/JPY pair on Tuesday.

Meanwhile, the positive opening in the U.S. equity markets failed to impress the bullish traders, and the pair USD/JPY continued moving in the downward direction and closed its day near the monthly low that was set on August 6.

On the data front, at 01:00 GMT, the TIC Long-Term Purchases for June exceeded the forecast of 108.0B and came in as 113.0B and supported the U.S. dollar. At 17:30 GMT, the Building Permits from the U.S. rose to 1.50M against the projected 1.33Mand the Housing starts rose to 1.50M from the projected 1.23Mand supported U.S. dollar that helped limit the additional losses in pair.

There was no news regarding the date of the review of the phase-one trade deal between both nations on the US-China front. It is expected that the review will be published after the targets of U.S. purchases by China will be met.

As per the deal, China has to increase its purchases of U.S. farm and manufactured products, energy, and services by $200 billion over the next two years. So far, China has made imports of products from the U.S. worth about $40.2 billion that is less than 50%. China still has far to go to meet the requirement as it was affected by the pandemic induced lockdowns; however, ever since the lockdown has been eased, China’s imports have increased. U.S. officials have said that they were satisfied with the trade deal progress so far.

On the negative side, the blacklisting of Huawei’s telecom group on Yesterday raised concerns regarding the escalated tensions between China & the U.S. and supported the bearish trend in the USD/JPY pair.

Daily Technical Levels

Support Pivot Resistance
105.1100 105.5900 105.9000
104.8000 106.3800
104.3100 106.6900


USD/JPY – Trading Tips

The USD/JPY has violated the upward trendline support level of 106.345, as it fell sharply in the wake of increased safe-haven appeal in the market. At the movement, the USD/JPY pair is holding below 50 periods EMA, while the RSI and MACD are in support of bearish trend. The recent candle is closing above 105.344 level, suggesting strong odds of bullish correction until 106. However, the violation of 106 can lead to USD/JPY prices towards the 104.600 support level. Good luck! 

Categories
Forex Options

FX Options Market Combined Volume Expiries for 19th August 2020

Thank you for visiting the Forex Academy FX Options market combined volume expiries section. Each day, where available, we will bring you notable maturities in FX Options of amounts of $100 million-plus, and where these large combined maturities at specified currency exchange rates often have a magnetic effect on price action, especially in the hours leading to their maturities, which happens daily at 10.00 AM Eastern time. This is because the big institutional players hedge their positions accordingly. Each option expiry should be considered ‘in-play’ with a good chance of a strike if labeled in red, still in play and a possible strike if labeled in orange and ‘out of play’ and an unlikely strike if labeled in blue, with regard to the likelihood of price action meeting the strike price at maturity.

…………………………………………………………………………………………………………

FX option expiries for Wednesday, August 19 at the 10 am NY cut

-EUR/USD euro amount

  • 1.1900 1.7bn

EURUSD is oversold nut not finding early buyers in the European session. Eurozone CPI numbers due up shortly may add weight to the next directional push. Otherwise, the bull trend is looking tired.

-USD/JPY USD amount

  •  104.00 1.0bn
  •  104.50 360m
  •  105.00 962m
  •  105.25 530m
  •  105.80 480m
  •  106.00 374m
  •  106.50 450m

USDJPY is overbought after a pullback from an extensive bear rally with the Yen being bought as a safe haven currency.  If the US dollar takes a breather from its recent battering we should see the current exchange rate hold in this area.

………………………………………………………………………………….

As you can see on the preferred 1-hour chart(s), we have also plotted the expiration levels at the various exchange rate maturities and we have also labeled in red, orange, and blue.  Therefore, if you see option expiry exchange rates labeled in red these should be considered in-play because we believe there is a greater chance of the expiry maturing at these levels based on technical analysis at the time of writing. There is still a lesser possibility of a strike if they are in orange and so these are ‘in-play’ too. However, if we have labeled them in blue, they should be considered ‘not in-play’ and therefore price action would be unlikely to reach these levels, which are often referred to as Strikes, at the time of the 10 AM New York cut.

Our technical analysis is based on exchange rates which may be several hours earlier in the day and may not reflect price action at the time of the maturities. Also, we have not factored in economic data releases or keynote speeches by policymakers, or potential market volatility leading up to the cut.

Although we have added some technical analysis, we suggest you take the levels and plot them onto your own trading charts and incorporate the information into your own trading methodology in order to use the information to your advantage. Remember the higher the amount, the larger the gravitational pull towards the exchange rate maturity at 10:00 AM Eastern time.

If you want to learn how forex option expiries affect price action in the spot FX market see our educational article by clicking here: https://bit.ly/2VR2Nji

DISCLAIMER: Please note that this information is for educational purposes. Also, the maturities will look more or less likely to become a strike at 10 AM NY time due to exchange rate fluctuations resulting in a different perspective with regard to technical analysis, and also due to upcoming economic data releases for the associated pairs.

Categories
Crypto Market Analysis

Daily Crypto Review, August 19 – Cryptos Heavily in the Red, YFI Token Breaks $11,000 and Approaches BTC’s Price Level

Almost every single cryptocurrency in the top100 was in the red today after Bitcoin broke $12,000 to the downside. Bitcoin is currently trading for $11,685, which represents a decrease of 4.7% on the day. Meanwhile, Ethereum lost 5.56% on the day, while XRP lost 9.4%.

 Daily Crypto Sector Heat Map

When talking about top100 cryptocurrencies, yearn.finance gained 19.51% on the day, making it the most prominent daily gainer. THETA (17.62%) and Swipe (17.28%) also did great. On the other hand, Numeraire lost 10.95%, making it the most prominent daily loser. It is followed by BitTorrent’s loss of 10.14% and Fetch.ai’s drop of 9.94%.

Top 10 24-hour Performers (Click to enlarge)

Bottom 10 24-hour Performers (Click to enlarge)

Bitcoin’s dominance level has increased slightly (even though it is still under the 60% mark), with its value currently at 59.77%. This value represents a 0.13% difference to the upside when compared to our last report.

Daily Crypto Market Cap Chart

The cryptocurrency market cap experienced a decrease in value over the course of the day. Its current value is $364.20 billion, which represents a decrease of $20 billion when compared to our previous report.

_______________________________________________________________________

What happened in the past 24 hours?

_______________________________________________________________________

_______________________________________________________________________

Technical analysis

_______________________________________________________________________

Bitcoin

After finally breaking $12,000 with confidence, Bitcoin is now falling hard below it (click on the arrow of the image). The largest cryptocurrency by market cap is dropping below $11,700 at the moment on bearish momentum. If the cryptocurrency manages to break below the 11,600 level, the next target will be 11,087. Right now, it is heavily oversold, so we can also expect a bounce back to near $12,000.

BTC traders should look for a trade after the cryptocurrency decides on whether it will end up above or below $11,600, as this is a strong support level.

BTC/USD 4-hour Chart

Technical factors:
  • Price is below its 50-period EMA and below its 21-period EMA
  • Price is below its lower band.
  • RSI is dropping (34) and approaching the oversold area
  • Volume is above average
Key levels to the upside          Key levels to the downside

1: $12,015                                1: $11,630

2: $12,300                                2: $11,460

3: $12,900                                 3: $11,090

Ethereum

Ethereum’s social sentiment is still on the rise with the increased interest in DeFi. Even though the second-largest cryptocurrency by market cap is losing heavily in the past 24 hours, the $400 support level should hold, and ETH is (for the time being) safe above it. The next move Ethereum makes will most likely be caused by Bitcoin’s move, as the largest cryptocurrency by market cap is preparing an explosive move towards (most likely) the upside. That, though, should wait a bit, since cryptos are still under selling pressure.

Traders should look for a trade when ETH regains a higher and steady volume.

ETH/USD 4-hour Chart

Technical Factors:
  • Price is currently below its 21-period and its 50-period EMA
  • Price is below its lower B.B.
  • RSI is descending (36) approaching oversold levels
  • Volume is average
Key levels to the upside          Key levels to the downside

1: $445                                      1: $415

2: $496                                     2: $400

                                                  3: $361

Ripple

XRP’s bold move towards the upside, which came after announcing that its company (Ripple) will focus its business model on the XRP token rather than using it as a side solution, got nullified. The third-largest cryptocurrency by market cap dropped below the $0.31 level and as low as $0.29 (which is where it is at now).

Traders can look for a trade after XRP moves above or below its immediate support/resistance levels, or within the current trading level.

XRP/USD 4-hour Chart

Technical factors:
  • Price is currently below the 21-period and 50-period EMA
  • Price is below the lower B.B.
  • RSI is dropping (38.6)
  • Volume increased in the last hours
Key levels to the upside          Key levels to the downside

1: $0.32                                     1: $0.31  

2: $0.332                                   2: $0.285

                                                3:$0.266


Categories
Forex Course

144. Trading The Channel Breakouts In The Forex Market

Introduction

Breakout trading is one of the easiest and most common and smartest ways to trade the market. It doesn’t matter whether you are a scalper, intraday trader, investor, or a swing trader; you can always make money in the market if you master the breakout trading only.

Breakout trading is an attempt to enter in the market when the price action moves outside the significant price range, most of the time it takes an immense amount of power to break the significant areas, and you will always witness the spikes, fake-outs near the breakouts, this is because both of the parties tries to dominate the shows.

What is a Price Channel?

A price channel is a state of the market that connects the swing high and swing higher lows in an uptrend. Conversely, in a downtrend, it connects the swing low and lower low. The upper trend lines act as a resistance to the price action, and the lower trend lines act as a support line on the price chart. The price respects these areas by staying inside the price channel. When the opposite party becomes dominates, then we witness the breakout in a channel.

Trading Channel Breakouts

Buy Trade 1

The price chart below represents a channel breakout in the CAD/JPY forex pair.


As we can see, the sellers are getting weaker in the channel, and as a result, soon after the breakout price action changed its trend. So, around 81.55, the price action broke to the north and printing a brand new higher high.

Buy Trade 2

The image below represents the formation of a price channel in the CAD/JPY forex pair.

As we can see, the below price chart represents our entry-exit and stop loss in this pair. So during the downtrend, both buyers and sellers were holding equal power. Near to the 78.00 area, price action broke to the north, and after the breakout, we took a buy-entry. After our entry, the price made a brand new higher high, but the hold at the most recent higher high convinced us to close our trade at the 88.37 level.

Sell Trade 1

The image below represents the formation of a Price channel in a downward trend.


The image below represents our entry, stop loss, and take profit in this Forex pair. The channel is typically formed when there is no trend, or when the trend is about to end. On a lower timeframe, we can trade inside the Channel, but on this timeframe, the break below the 78.30 level indicates that the sellers stole the show, and are ready for a brand new lower low.

Sell Trade 2

The image below represents a channel breakout in the AUD/JPY Forex pair.

Right after the price action approaches the most recent support area, it just got shot down and broke below the Channel. The strong red breakout candle is an indication for us to go short in this pair and right after our entry, we have witnessed a brand new lower low.

Trading channel breakouts is this simple. But minute details like drawing channel lines accurately is crucial. Let’s learn more breakout trading techniques in the upcoming lessons. For now, don’t forget to take the quiz.

[wp_quiz id=”85204″]
Categories
Forex Fundamental Analysis

Everything About ‘Social Security Rate’ – An Important Fundamental Forex Driver

Introduction

During the recent Coronavirus pandemic, the whole debate about social security has taken CenterStage. At a point in life, we all grow old. Since not everyone will go through life-saving for retirement, our main worry then would be; how to pay bills on time, how to provide for our families should we lose out jobs or become incapable of working.

Social security attempts to anticipate all this and offer practical solutions. So why should forex traders care about the social security rate? This article seeks to understand what impact of social security rate has on a country’s currency. To establish this, we first need to understand what it is and what it entails.

What is Social Security?

Social security has been given several definitions. In the UK, it is considered to be any form of monetary assistance from the government towards individuals who have inadequate or no income. In the US, social security is a federal program that is meant to provide retirees, the poor and the disabled with income and health insurance.

Thus, social security is the guarantee that a government gives to its vulnerable citizens that in the event they are exposed to a specific future risk, they will be looked after. The social security program, therefore, uses public resources to provide economic support for private citizens.

What is Social Security Rate?

This rate is the percentage of earnings that is charged on both the workers and their employers. It is used to fund the social security program.

How it is Calculated

Various countries have different mechanisms of arriving at the social security rate for both the employed and self-employed.

In the US, the social security rate is 15.3%. It is a combination of a 12.4% social security tax and Medicare tax of 2.9%. In 2020, the 12.4% social security tax is applied on everyone for all income up to $137,700; any amount earned beyond this threshold is exempt from the social security tax. The social security tax is deducted on an individual’s payroll through payroll withholding by the employer. This rate is split in half between the employee and the employer.

Therefore, an individual contributes 6.2% for social security and 1.45% of their earnings while the employer matches the other half. The employer then remits the withheld amount together with their contribution to the IRS. For those that are self-employed, since they are the employee and the employer at the same time, they have to pay both halves of the social security tax. In the UK, the social security rate is 14%. A comprehensive list of current and previous social security rates for every country can be found on the Trading Economics website.

Purpose of the Social Security

Conventional taxes are meant to be a revenue source for government expenditure or meant to be punitive. The social security tax is meant to a safety net for the contributors should they fall on hard times. It also functions as an economic guarantee for the most vulnerable in society. The chart below shows the dependency on social security benefits by various household income class in the US.

Source: AARP

Some of the benefits of the social security program include:

Retirement benefits

This offers workers and their dependents a replacement income for when they choose to retire. The earliest retirement age is 62 years. For one to be eligible for retirement benefits, they need to have worked for a minimum stipulated period. This period differs depending on the country. In the US, it is for ten years. The amount of money received largely depends on one’s lifetime earnings and the cost of living.

Disability benefits

Also known as disability insurance, the Social Security and Supplemental Security Income disability is meant to provide an income for the disabled. For one to be eligible, they need to have worked for a minimum number of years, depending on the age when the disability occurred.

Medical cover

This is the health insurance coverage that covers part of medical bills for ageing workers, people with permanent health conditions and those with disability.

Survivors benefits

This is meant to help those who are bereaved to cope

Social Security Rate and the Economy

The social security program differs in every country. However, in every economy, such programs are meant to provide stability to the households by providing a replacement stream of income, hence avoiding poverty. In the US alone, close to 56 million people are recipients of social security benefits.

Source: International Labour Organization

As shown in the chart above, higher expenditure in terms of social security corresponds to a higher GDP per capita. While some might argue that a higher social security rate reduces the amount of disposable income, the multiplier effect generated by the resultant social security benefits outweighs any short term loss.

It is worth noting that the families and individual who receive these benefits use the income to purchase goods and services. In 2019, it was estimated that the social security program injected over $1 trillion into the economy. Therefore, the presence of social security helps to maintain demand in the economy in times of crises and some cases, increase the demand.

The benefits of the social security program have a powerful multiplier effect within the economy. The businesses that receive this income from the consumers use it to increase production and hire more employees. These expansions, in turn, generate more revenue for the government to use in national expenditure while the earnings by the employees serve to create more consumption and increased savings.

How Social Security Rate Impacts Currency

As we have already established above, a higher social security rate creates a multiplier effect that generates more revenue within the economy. The strength of a country’s currency is a reflection of its economy. The growth in the national economy, therefore, corresponds to the appreciation in the value of the currency.

Conversely, lowering the social security rate will reduce the multiplier effect within the economy, which leads to shrinking of the national economic growth. For forex traders, lowering the social security rate could be a foreboding of a looming reduction in the national GDP growth, prompting expansionary monetary and fiscal policies. Therefore, in the long run, a low social security rate leads to the weakening of a country’s currency against other pairs.

How Social Security Rate News Release Affects The Forex Price Charts

Forex traders rarely pay any attention to the release of the new social security rates. This inattentiveness is because as an economic indicator, the social security rate is a low impact indicator. However, it is essential nonetheless to know how the news release of the social security rate affects the price action of different pairs.

In the UK, the national government through the Department for Work and Pensions sets the social security rate and is reviewed annually. A breakdown of the UK social security rate can be found HM Revue and Customs website. It should be noted that for the past 25 years, the US government has not changed the social security rate, as can be seen here. Below is a screengrab from the Trading Economics’ website on the UK and US social security rates.

UK social security rate

US social security rate

In the latest release on April 6, 2020, around 1100 GMT, the UK government revised the social security rate upwards from 12% to 14%. Now, let’s see how this news release made an impact on the Forex price charts.

GBP/USD: Before social security rate release April 6, 2020

We plotted a 20-period Moving Average on a one-hour GBP/USD chart. As can be seen on the chart above, the pair is in recovery with the candles crossing over the 20-period Moving Average and subsequently forming above it.

For the GBP/NZD and GBP/AUD pairs, the market is in a general downtrend before the announcement of the hike in the social security rate. This trend is evidenced by the subsequent candles forming below the 20-period Moving Average, as shown in the charts below.

GBP/NZD: Before social security rate release April 6, 2020,

GBP/AUD: Before social security rate release April 6, 2020

For forex traders, going long on the GBP/USD wile short on the GBP/NZD and GBP/AUD pairs would have been an excellent trading opportunity since the prevailing market trends would favour them.

Let us now see if the release of the new social security rates changed the market trend for these pairs.

GBP/USD: After social security rate release April 6, 2020

In theory, raising the social security rate should be positive for the GBP. Bust, as can be seen in the GBP/USD one-hour chart, the news release, did not have any impact on the pair to change the market trend significantly. The lack of impact can be observed for the GBP/NZD and the GBP/AUD pairs as shown by the charts below.

GBP/NZD: After social security rate release April 6, 2020

GBP/AUD: After social security rate release April 6, 2020,

Whereas the social security rate plays a significantly important role in the overall economy and the GDP, it is apparent that its impact in the forex market is negligible.

Categories
Forex System Design

Introduction to Optimization of a Trading System

Introduction

Once the system developer tested and validated the trading system, the next stage corresponds to the optimization process. The developer will estimate different values for the key model parameters.
This educational article will introduce the basic concepts in the optimization process of a trading system.

The Optimization Process

Before getting started into the optimization process, the developer must weigh and adjust the investor’s interests with the purpose of the optimization and limitations both the strategy and reality. In this regard, the optimization must align with realistic objectives. For example, the drawdown should not exceed 10% of the trading account, or to obtain a yearly net profit of 15% from the invested capital.

The optimization of a trading system is the stage that seeks the best or most effective use, which allows investors to obtain the highest performance of the trading system. In this context, the optimization could be the search of what inputs could maximize the profits or accomplish the investor’s requirements to minimize the drawdown. To achieve this, the developer must evaluate the variables that conform to the rules and formulas that define and models the system’s structure.

The system developer must consider that an incorrect optimization can drive to obtain serious errors. For this reason, the optimization process is a critical stage in trading system development.

What is the Optimization of Trading Systems?

In general terms, the optimization process is a mathematical method oriented to improve or find an “optimal” solution to a specific problem. In the trading system development, the optimization corresponds to the best parameter selection that allows the strategy to obtain the peak performance in the real market.

Getting Started

Once the system developer tested the trading strategy’s capability to catch market movements, the steps to start the optimization are as follows:

  1. Selection of the model parameters that have the most significant impact on the system’s performance; if a model’s variable is not relevant, it could be fixed.
  2. Selection of a significant range of data needed to test the parameter to be optimized. This range must generate a significative sample to study the model. For example, the amount of data required to evaluate a 20-day moving average is lower than the one needed to assess a 200-day moving average.
  3. Selecting the data sample size. It must be representative enough to ensure the statistical validity to make estimations. The size also must be representative of the market as a whole.
  4. Selection of the model evaluation type, this stage will depend on the evaluation type, objective, or test criteria; this selection will change depending on the kind of trading model.
  5. Selection of the test result evaluation type, this stage must evaluate the results of the optimization process with a statistical significance, meaning the results are not due to chanve. For example, a P-value below 5% would be statistically “significant,” and below 1% would be “highly significant.” Additionally, the average and the standard deviation of the results must be evaluated. As a final note, profit spikes should be considered as abnormal and be discarded.

The figure summarizes the five selections that the system developer must take before to start the optimization process.

Conclusions

The optimization process is a critical stage that comes after the testing process. In this stage, the system developer seeks to determine the appropriate value for the most robust trading strategy implementation. 

Nevertheless, before starting with the optimization, the developer must take a set of decisions, such as which the objective of the optimization? Is it realistic?

Once defined the target of the optimization, the developer must select which parameters to optimize, the range of data to be used in the analysis, how much data will require the sample, which will be the evaluation type of the model, and the evaluation criteria of the test results.

Finally, when all these five steps have been completed, the system developer is ready to start to perform the optimization.

Suggested Readings

  • Jaekle, U., Tomasini, E.; Trading Systems: A New Approach to System Development and Portfolio Optimisation; Harriman House Ltd.; 1st Edition (2009).
  • Pardo, R.; Design, Testing, and Optimization of Trading Systems; John Wiley & Sons; 1st Edition (1992).
Categories
Forex Market Analysis

Daily F.X. Analysis, August 18 – Top Trade Setups In Forex – Boosted Safe-Haven Plays! 

On the news front, the market isn’t expected to offer any major or high impact economic event until Wednesday. Therefore, the eyes will remain on the COVID19 cases and U.S. FOMC meeting minutes, which are coming out tomorrow to drive further price action in the market.

Economic Events to Watch Today  


EUR/USD – Daily Analysis

The EUR/USD has managed to maintain its previous day winning streak and taking further bids just below the 1.1900 level while representing 25% gains on the day mainly due to the broad-based U.S. dollar weakness, triggered by the on-going uncertainty surrounding the much-awaited U.S. fiscal stimulus. 

On the other hand, the US-EU trade concerns turned bitter as the U.S. keeps increasing the hardships for the E.U. goods, which eventually becomes the key factor that capped further upside momentum for the currency pair. In the meantime, the rising coronavirus cases in Germany also turned out to be a major factor that kept the traders cautious. As of writing, the EUR/USD currency pair is currently trading at 1.1893 and consolidates in the range between the 1.1865 – 1.1898. 

The U.S. dollar losses were further bolstered by the uncertainty over the next round of the U.S. fiscal stimulus measures, as the U.S. Congress members failed again from signaling any talks on the much-awaited stimulus amid political differences, which continued to fuel doubts over the U.S. economic recovery.

As we all know, the online meeting between the world’s top two nations I,e the U.S. & China, has been postponed without giving any future dates that were initially scheduled for Saturday. Despite this, the conflicting tone remains on the card as the Trump administration keeps increasing the hardships of companies from China. The U.S. diplomats recently announced punitive measures for Huawei in their latest attack for China. However, these gloomy headlines tend t cap further gains in the equity market, which might help the U.S. dollar put the safe-haven bids ahead.

Across the pond, the US-EU trade concerns still not showing any sign of slowing down as the U.S. decided to maintain its 25% tariffs on a range of E.U. goods. This happens after the White House realized that the E.U. is not doing enough to obey with the WTO’s ruling over state aid to Airbus. However, these updates could halt the upward momentum in the currency pair.

At the coronavirus front, the actual coronavirus cases increased to 225,404, with a total of 9,236 deaths. Whereas, the cases raised by 1,390 in Germany on the day against the previous day +738. The death toll rose by 4, as per the German disease and epidemic control center report, Robert Koch Institute (RKI).

At the USD front, the broad-based U.S. dollar reported losses on the day as the possibility of the U.S. Congress agreeing to a fiscal stimulus bill this month has weakened amid political differences, which eventually destroyed hopes for a quick U.S. economic recovery. In the absence of significant data/events on the day, the market traders will keep their eyes on the headlines concerning the US COVID-19 aid package, virus figures, and Sino-American trade.

Daily Technical Levels

Support Pivot Resistance
1.1838 1.1860 1.1891
1.1807 1.1913
1.1785 1.1945

 EUR/USD– Trading Tip

The EUR/USD pair has already violated the resistance level of 1.1862, which is now working as a support. On the 4 hour timeframe, the pair is supported by an upward trendline at 1.1880, while the double top resistance stays at 1.1916 level. Bullish bias seems dominant, and it may lead the EUR/USD prices towards the 1.1916 level today.


GBP/USD – Daily Analysis

Today in the Asian trading session, the GBP/USD currency pair remains on the bullish track and registered 4th day of winning streak while taking rounds near the 1.3120 and 1.3137 range mainly due to the broad-based U.S. dollar selling bias. That was triggered by the uncertainty surrounding the much-awaited coronavirus (COVID-19) relief package from America. The upbeat market mood also undermined the safe-haven U.S. dollar and contributed to the currency pair gains. 

The upbeat market sentiment backed by multiple factors helped overshadowed the U.K.’s current economic slowdown and distracted from anxieties that the country is likely heading into an unemployment crisis. This, in turn, underpinned the local currency and gave further support to the major. At a particular time, the GBP/USD currency pair is currently trading at 1.3139 and consolidating in the range between 1.3095 – 1.3141. However, the pair’s traders seem cautious to place any strong bids ahead of the key 7th-round of EU-UK talks concerning Brexit.

It is worth mentioning that the cable pair has many more to cheer on the day. Be it broad-based U.S. dollar weakness or upbeat market trading sentiment, not to forget the Brexit talks, these all factors are supporting the currency pair for the time being, at least.

At the Brexit front, the hopes of the trade deal next week got further fueled by the UK PM Boris Johnson’s previous comments that the United Kingdom will not accept aligning to rules of the E.U. at the coming round of post-Brexit discussions. Even though the trade deal is agreed between the U.K. and E.U., as per the U.K. Express report, the E.U. fishermen could clash with U.K. fishermen.

The coming round of talk becomes the last scheduled meet; policymakers earlier showed a willingness to extend the talks till September if needed. According to the BBC report, the E.U. chief negotiator Michel Barnier said that the agreement would be needed by October to ratify before the current post-Brexit transition period ends in December. However, the policymaker from both sides keeps alleging each other while citing failures to agree over the key issues like fisheries, level playing field, and jurisdiction rules, to name a few.

Across the pond, the UK Chancellor Rishi Sunak shows a willingness to extend the furlough scheme after rising unemployment rate and hence reopened support scheme for self-employed. However, the improving market mood helped overshadowed the U.K.’s current economic recession fears and concerns that the country is expected to heading into an unemployment crisis. 

The currency pair gains were also supported by the positive report that Imperial College London’s coronavirus (COVID-19) vaccine candidate is set for the next phase represents the Tory government’s efforts to control the pandemic.

On the other hand, the U.S. and China continue to struggle over one issue or the other. The Trump administration keeps increasing the hardships of companies from China by adding 38 Huawei facilities to the U.S.’ economic blacklist while also arresting a Chinese spy.

Whereas, the uncertainty over the next round of the U.S. fiscal stimulus measures remain on the cards, as the U.S. Congress members failed again from signaling any talks on the much-awaited stimulus amid political differences, which continued to fuel doubts over the U.S. economic recovery.

As in result, the broad-based U.S. dollar failed to gain any positive traction and extended its previous long bearish bias as doubts over the U.S. economic recovery remain amid coronavirus stimulus package. However, the losses in the U.S. dollar helped the currency pair to take bids on the day. 


Daily Technical Levels

Support Pivot Resistance
1.3075 1.3099 1.3124
1.3050 1.3148
1.3027 1.3173

 GBP/USD– Trading Tip

The GBP/USD pair is trading at 1.3137 level, and the pair was trading in between an ascending triangle pattern that has now been violated. The triangle pattern was extending resistance at 1.3125 level, and above this, the next resistance is pretty much likely to be found around 1.3189 level. At the same time, the support stays at 1.3125 and 1.3085 level. Bullish bias seems dominant today.


USD/JPY – Daily Analysis

The USD/JPY currency pair extended its previous session losing streak and dropped further below 106.50 marks mainly due to the broad-based U.S. dollar four-day consecutive weakness, buoyed by the impasse over the next round of the U.S. fiscal stimulus measures. On the other hand, the upbeat market sentiment, backed by the optimism over a potential vaccine for the highly infectious coronavirus, undermined the safe-haven Japanese yen and helped currency pair to limit its deeper losses. In the meantime, the downbeat preliminary readings of Japan’s second quarter (Q2) Gross Domestic Product (GDP) also undermined the safe-haven Japanese yen currency and became one of the major factors that capped further downside for the currency pair. Currently, the USD/JPY currency pair is currently trading at 106.36 and consolidating in the range between 106.31 – 106.67.

Despite concerns about the ever-increasing coronavirus cases across the world and worsening US-China relations, the investors continued to cheer the optimism over a potential vaccine for the highly contagious coronavirus disease. Also, supporting factors could be the suspension of the US-China online meeting regarding the trade deal. 

On the contrary, the fears of growing COVID-19 cases in the U.S., Australia, Japan, and some of the notable Asian nations like India continually fueling doubts over the economic recovery. As per the latest report, France recorded more than 3,000 new cases for the second day while Australia’s state Victoria marked the highest death loss, which resulted in an extended state of emergency until September 13. Singapore also reported 86 cases on the weekend. At the same time, New Zealand imposed fresh lockdowns after recording increased cases of Covid-19. However, these gloomy updates kept challenging the market risk-on tone, which might weaken the safe-haven JPY and help limit losses for the major.

Apart from the virus woes, the long-lasting tussle between the world’s two largest economies remained on the cards as China’s ambassador to the U.S. recently gave warning against the U.S. move to send ships to the South China Sea, which could raise further tensions between both nations and harm the trade deal. Whereas, President Trump announced yesterday that TikTok should give its U.S. operations to another company within one-month, or it will be banned in the U.S. due to significant security threats. In return, China’s Foreign Ministry recently said on the day that it would firmly oppose to U.S. actions.

As we mentioned, the downbeat preliminary readings of Japan’s second quarter (Q2) Gross Domestic Product (GDP) also gave some support to the currency pair. The world’s 3rd-largest economy declined by a 27.8% annualized pace during the second quarter of 2020. However, this marked the biggest economic fall on record and was led by the coronavirus-induced lockdown.

Daily Technical Levels

Support Pivot Resistance
105.7300 106.2000 106.4600
105.4800 106.9200
105.0100 107.1800


USD/JPY – Trading Tips

The USD/JPY has violated the upward trendline support level of 106.345, as it fell sharply in the wake of increased safe-haven appeal in the market. At the movement, the USD/JPY pair is holding below 50 periods EMA, while the RSI and MACD are in support of bearish trend. The recent candle is closing above 105.344 level, suggesting strong odds of bullish correction until 106. However, the violation of 106 can lead USD/JPY prices towards the 104.600 support level. Good luck! 

Categories
Forex Options

FX Options Market Combined Volume Expiries for 18th August 2020

Thank you for visiting the Forex Academy FX Options market combined volume expiries section. Each day, where available, we will bring you notable maturities in FX Options of amounts of $100 million-plus, and where these large combined maturities at specified currency exchange rates often have a magnetic effect on price action, especially in the hours leading to their maturities, which happens daily at 10.00 AM Eastern time. This is because the big institutional players hedge their positions accordingly. Each option expiry should be considered ‘in-play’ with a good chance of a strike if labelled in red, still in play and a possible strike if labelled in orange and ‘out of play’ and an unlikely strike if labelled in blue, with regard to the likelihood of price action meeting the strike price at maturity.

…………………………………………………………………………………………………………

FX option expiries for Tuesday, August 18 at the 10am NY cut

-EUR/USD euro amount

  •  1.1750 1.2bn

EURUSD remains bid on US dollar weakness. Little chance of a pullback to the option expiry.

-USD/JPY USD amount

  •  105.50 631m
  •  106.00 481m
  •  106.60 361m

USDJPY will likely pause for a breather at least until the US data today. The 105.50 option looks favourite.

-NZD/SD NZD amount

  •  0.6525 271m
  •  0.6550 256m

NZDUSD is sideways trading in a tight consolidation range. Both options are in the money.

………………………………………………………………………………….

As you can see on the preferred 1-hour chart(s), we have also plotted the expiration levels at the various exchange rate maturities and we have also labelled in red, orange and blue.  Therefore, if you see option expiry exchange rates labelled in red these should be considered in-play, because we believe there is a greater chance of the expiry maturing at these levels based on technical analysis at the time of writing. There is still a lesser possibility of a strike if they are in orange and so these are ‘in-play’ too. However, if we have labelled them in blue, they should be considered ‘not in-play’ and therefore price action would be unlikely to reach these levels, which are often referred to as Strikes, at the time of the 10 AM New York cut.

Our technical analysis is based on exchange rates which may be several hours earlier in the day and may not reflect price action at the time of the maturities. Also, we have not factored in economic data releases or keynote speeches by policymakers, or potential market volatility leading up to the cut.

Although we have added some technical analysis, we suggest you take the levels and plot them onto your own trading charts and incorporate the information into your own trading methodology in order to use the information to your advantage. Remember the higher the amount, the larger the gravitational pull towards the exchange rate maturity at 10:00 AM Eastern time.

If you want to learn how forex option expiries affect price action in the spot FX market see our educational article by clicking here: https://bit.ly/2VR2Nji

DISCLAIMER: Please note that this information is for educational purposes. Also, the maturities will look more or less likely to become a strike at 10 AM NY time due to exchange rate fluctuations resulting in a different perspective with regard to technical analysis, and also due to upcoming economic data releases for the associated pairs.

Categories
Crypto Market Analysis

Daily Crypto Review, August 18 – Crypto Fundamentals Booming: Bitcoin Above $12,000; XRP Skyrocketing to $0.315

The cryptocurrency market made gains over the course of the day as Bitcoin broke the $12,000 mark. Bitcoin is currently trading for $12,247, which represents an increase of 3.61% on the day. Meanwhile, Ethereum gained 1.12% on the day, while XRP gained 5.14%.

 Daily Crypto Sector Heat Map

When talking about top100 cryptocurrencies, Flexacoin gained 27.98% on the day, making it the most prominent daily gainer. yearn.finance (26.80%) and Fetch.ai (25.97%) also did great. On the other hand, Algorand lost 14.78%, making it the most prominent daily loser. It is followed by Chainlink’s loss of 12.26% and THORChain’s drop of 10.18%.

Top 10 24-hour Performers (Click to enlarge)

Bottom 10 24-hour Performers (Click to enlarge)

Bitcoin’s dominance level has increased slightly (though it is still under the 60% mark), with its value currently at 59.64%. This value represents a 0.47% difference to the upside when compared to our last report.

Daily Crypto Market Cap Chart

The cryptocurrency market cap experienced a solid increase in value over the course of the day. Its current value is $384.43 billion, which represents an increase of $11.03 billion when compared to our previous report.

_______________________________________________________________________

What happened in the past 24 hours?

_______________________________________________________________________

_______________________________________________________________________

Technical analysis

_______________________________________________________________________

Bitcoin

Bitcoin finally broke $12,000 with confidence, after a couple of days slowly preparing for this move. The largest cryptocurrency by market cap broke out from a large ascending triangle formation and pushed up to $12,470 before falling back down slightly. However, for now, Bitcoin is safe above $12,000 even though it is moving towards the downside. It will most likely test the closest support level in the short term.

This (relatively) sudden break above $12,000 came as a result of many things, but mostly increased interest in DeFi which is making people enter the crypto space (which they do through Bitcoin) and because of institutional investors such as Pantera capital (which just recently announced raising $165 million)

BTC traders should look for a trade after Bitcoin retests its support level.

BTC/USD 4-hour Chart

Technical factors:
  • Price is above its 50-period EMA and its 21-period EMA
  • Price is slightly below its top B.B.
  • RSI is elevated (63.83)
  • Volume is decreasing (one-candle spike)
Key levels to the upside          Key levels to the downside

1: $12,000                                1: $11,630

2: $12,300                                2: $11,460

                                                 3: $11,090

Ethereum

Ethereum’s social sentiment was booming as more and more people started investing in DeFi tokens. As this happened, more and more institutional investors grabbed ETH. This made the second-largest cryptocurrency by market cap establish its place above $415 with no signs of going below it in the short future.

When talking about the past 24 hours, Ethereum made a push towards $450 (accompanied by skyrocketing volume), which it did not have the strength to complete. The move died down, and Ethereum is now consolidating at the $430 level.

Traders should look for a trade when ETH regains steady volume.

ETH/USD 4-hour Chart

Technical Factors:
  • Price is currently above its 21-period and its 50-period EMA
  • Price is at its middle B.B.
  • RSI is neutral (52.68)
  • Volume is average (one-candle spike)
Key levels to the upside          Key levels to the downside

1: $445                                      1: $415

2: $496                                     2: $400

                                                  3: $361

Ripple

XRP made a bold move towards the upside after announcing that its company (Ripple) will focus its business model on the XRP token. As more emphasis was put on developing XRP as the main solution rather than a side solution, more investors flocked and bought XRP.

The third-largest cryptocurrency by market cap pushed past $0.31 and even $0.32, ultimately reaching $0.3275 as the top of the move. As it could not sustain itself above the $0.32 level, XRP fell below it and started a consolidation/confirmation period right between $0.31 and $0.32.

Traders can look for a trade after XRP moves towards $0.32 to break it or towards $0.31 to test the support level.

XRP/USD 4-hour Chart

Technical factors:
  • Price is currently above the 21-period and 50-period EMA
  • Price is slightly below the top B.B.
  • RSI is elevated (63.26)
  • Average volume (two-candle spike)
Key levels to the upside          Key levels to the downside

1: $0.32                                     1: $0.31  

2: $0.332                                   2: $0.285

                                                3:$0.266