
Introduction
Households Debt to Income is another metric that is used to assess the relative wealth and standard of living of people in the nation. It can give us hints on the spending patterns and circulation of currency and liquidity of the nation overall. Hence, Households Debt to Income ratio is beneficial for economists, investors, and also to deepen our foundation in fundamental analysis.
What is Households Debt to Income?
Debt-to-Income (DTI): The DTI is an individual financial measure that is defined as the ratio of total monthly debt payments to his monthly gross income.
Gross income refers to the income received from the employer or workplace and does not include any of the tax deductions.
The DTI is calculated using the below-given formula.
Disposable Personal Income (DPI): Disposable Personal Income, also called After-Tax Income, is the remainder of an individual’s income after all federal tax deductions. Hence, It is the amount people are able to spend, save, or invest.
Household Debt Service Ratio and Financial Obligations Ratio: The household Debt Service Ratio (DSR) is the ratio of total household debt payments to Disposable Personal Income (DPI).
Mortgage DSR: It is the total quarterly required mortgage payments divided by total quarterly Disposable Personal Income.
Consumer DSR: It is the ratio of aggregate quarterly scheduled consumer debt payments to total quarterly Disposable Personal Income (DPI). The Mortgage DSR and the Consumer DSR together form the DSR.
Financial Obligations Ratio: It is a broader measure than the Debt Service Ratio (DSR) as it takes into account rent payments, auto lease deductions, house owners’ insurance, and property tax.
How can the Households Debt to Income numbers be used for analysis?
DTI is a personal financial metric that is used by banks to determine the individual’s credit eligibility. A DTI ratio should be no more than 43% to be eligible for mortgage credit, but most banks prefer 36% as a healthy DTI ratio to lend money.
The household Debt Service Ratio & Financial Obligations Ratio is more useful, and large scale public data releases for fundamental analysis. The proportion of income that goes into servicing debt payments determines Discretionary Income, Personal Savings, and Personal Consumption Expenditures. Higher the Households Debt to Income ratio, the lesser the money available for other needs.
The Households Debt to Income measures the degree of indebtedness of Households, or in other words, it measures the burden of debt on Households people. The higher the numbers, the greater the load and lesser freedom to spend on other things. As debt burden increases, Discretionary Spending (i.e., for personal enjoyment) decreases, and the income is used entirely to meet the necessities only.
An increase in DPI or decrease in debt payment (by foreclosure or servicing all installments at once) is the two ways to reduce the Debt to Income percentage.
The Households Debt to Income is an essential metric for Government and Policymakers as dangerously high levels in these figures is what led to the financial crisis of 2008 in the United States.
Impact on Currency
High Households Debt to Income figure slows down the economy as debt durations are usually serviced for years. Higher numbers also indicate decreased spending as people spend more money to save and to maintain repayments. This cut back on expenditures results in slowing down businesses, especially those based on Discretionary items (ex: Fashion, entertainment, luxury, etc.) take a severe hit. The overall effect would be a lower print of GDP, and in extreme cases, it can result in a recession.
Households Debt to Income is an inverse indicator, meaning lower figures are good for economy and currency. The numbers are released quarterly due to which the statistics are available only four times a year, and the limitations of the data set make it a low impact indicator for traders. It is a long-term indicator and shows more of a long-term trend. It is not capable of reflecting an immediate shift in trends due to which the number’s impact is low on volatility and serves as a useful indicator for long-term investors, economists, and policymakers.
Economic Reports
The Board of Governors of the Federal Reserve System in the United States releases the quarterly DSR and FOR reports on its official website. The data set goes back to 1980.
DSR & FOR Limitations: The limitations of current sources of data make the calculation of the ratio especially tricky. The ideal data set for such an estimate requires payments on every loan held by each household, which is not available, and hence the series is only the best estimate of the debt service ratio faced by households. Nonetheless, this estimate is beneficial over time, as it generates a time series that captures the critical changes in the household debt service burden. The series are revised as better data, or improved methods of estimation become available.
Sources of Households Debt to Income
The DSR and FOR figures are available here:
Graphical and Comprehensive summary of all the Households Debt related are available here:
Households Debt to Income for various countries is available here:
Households DTI – TradingEconomics
How Households Debt to Income Affects The Price Charts
Within an economy, the household debt to income is vital to indicate the consumption patterns. In the forex market, however, this indicator is not expected to cause any significant impact on the price action. The household debt to income data is released quarterly in the US.
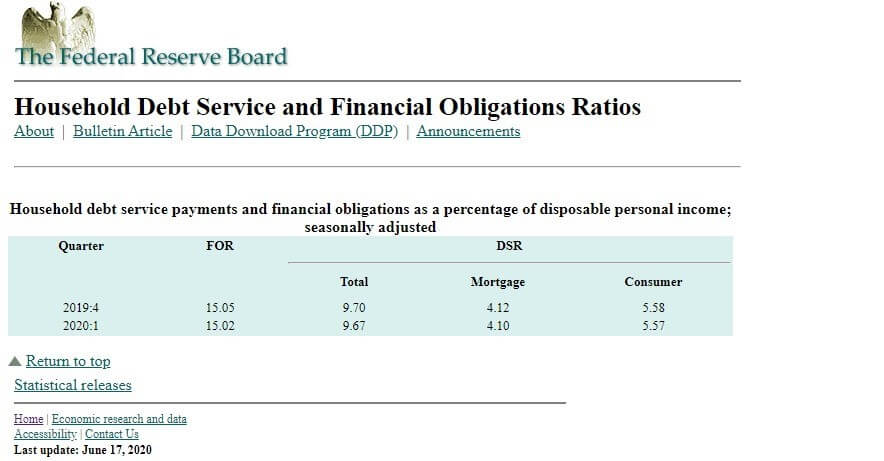
The latest release was on July 17, 2020, at 7.00 AM ET. The screengrab below is from the Federal Reserve website. It shows the latest household debt service and financial obligations ratios in the US.
The debt service ratio for the first quarter of 2020 decreased from 9.7% in the fourth quarter of 2019 to 9.67%. Theoretically, this decline in the debt to income ratio is supposed to be positive for the USD.
Let’s see how this news release made an impact on the Forex price charts.
EUR/USD: Before Households Debt to Income Release on June 17,
2020, Just Before 7.00 AM ET
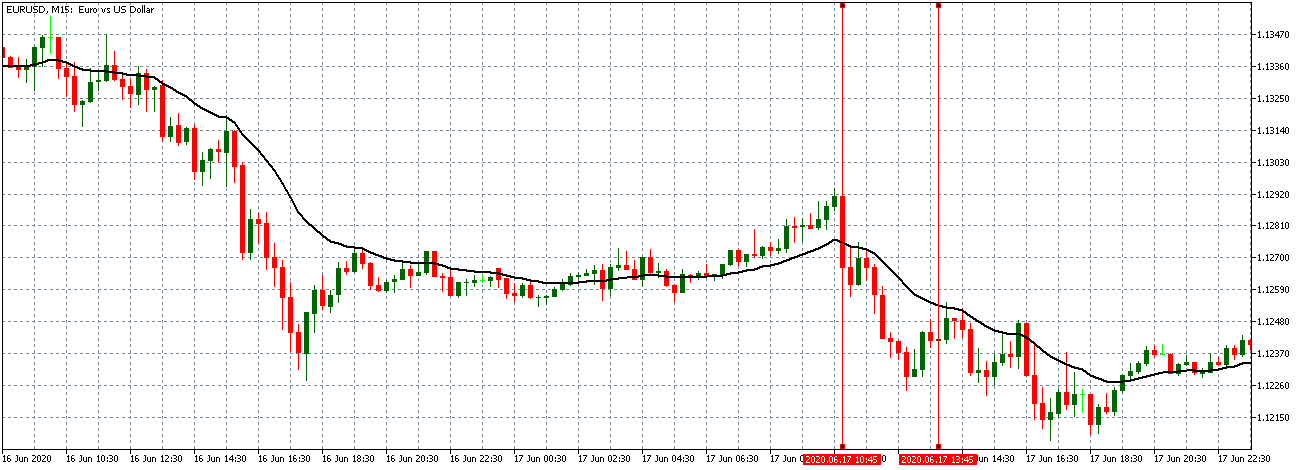
Before the news release of the household debt to income, the EUR/USD pair was trading on a steady downtrend. This trend is evidenced by the 15-minute candles forming below the 20-period Moving Average, as shown in the chart above.
EUR/USD: After Households Debt to Income Release on June 17,
2020, 7.00 AM ET
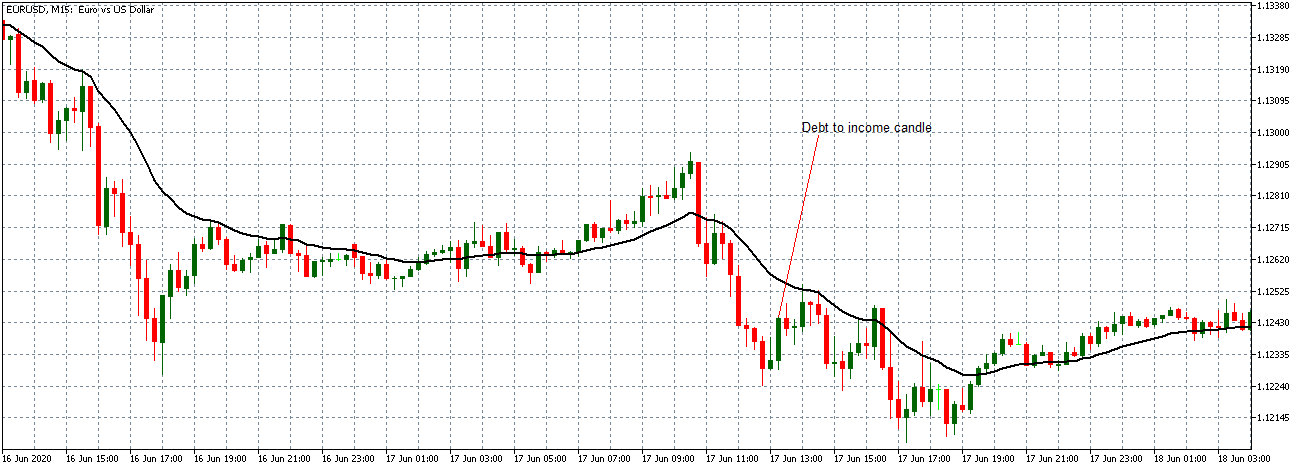
After the news release, the pair formed a bullish 15-minute candle indicating that the USD had weakened. The weakening of the USD is contrary to a bearish expectation since the households’ debt to income had reduced, the USD would be stronger. The pair later continued to trade in the previously observed downtrend.
Now let’s see how this news release impacted other major currency pairs.
GBP/USD: Before Households Debt to Income Release on June 17,
2020, Just Before 7.00 AM ET
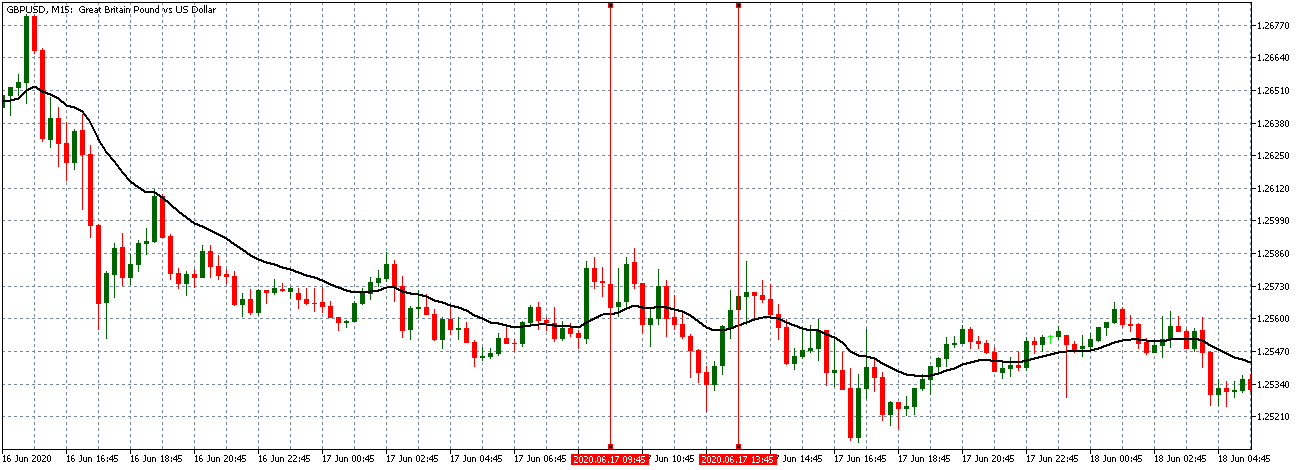
Before the news release, the GBP/USD pair had been attempting to recover from a short-lived downtrend. This recovery is evidenced by the candles crossing above a flattening 20-period Moving Average.
GBP/USD: After Households Debt to Income Release on June 17,
2020, 7.00 AM ET
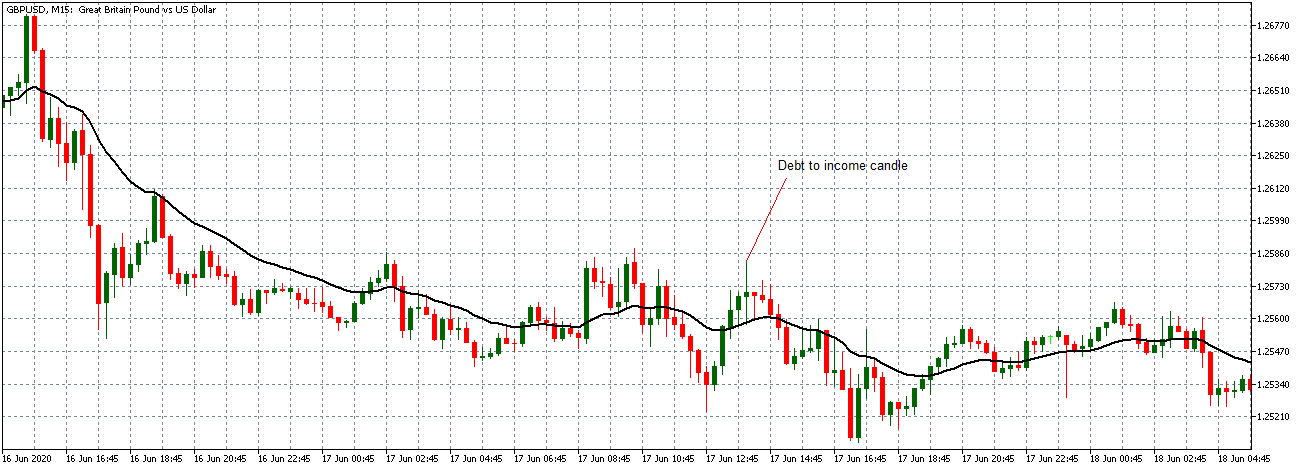
After the news release, the pair formed a 15-minute bullish “Doji star” candle. The pair traded within a neutral trend afterward with the 20-period Moving Average flattening. As observed with the EUR/USD pair, GBP/USD did not react accordingly, as theoretically expected, to the positive households’ debt to income data.
AUD/USD: Before Households Debt to Income Release on June 17,
2020, Just Before 7.00 AM ET
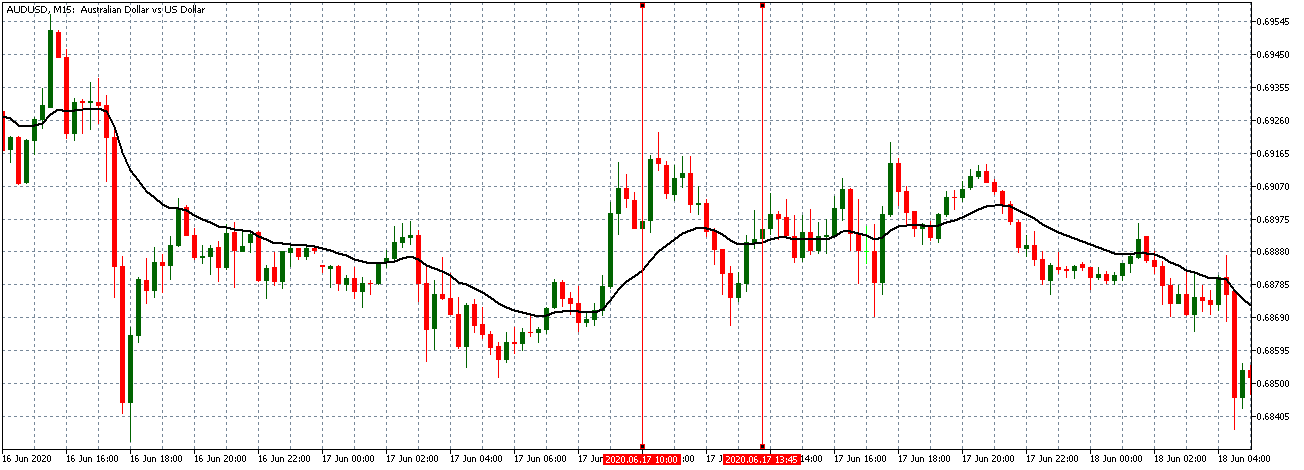
AUD/USD: After Households Debt to Income Release on June 17,
2020, 7.00 AM ET
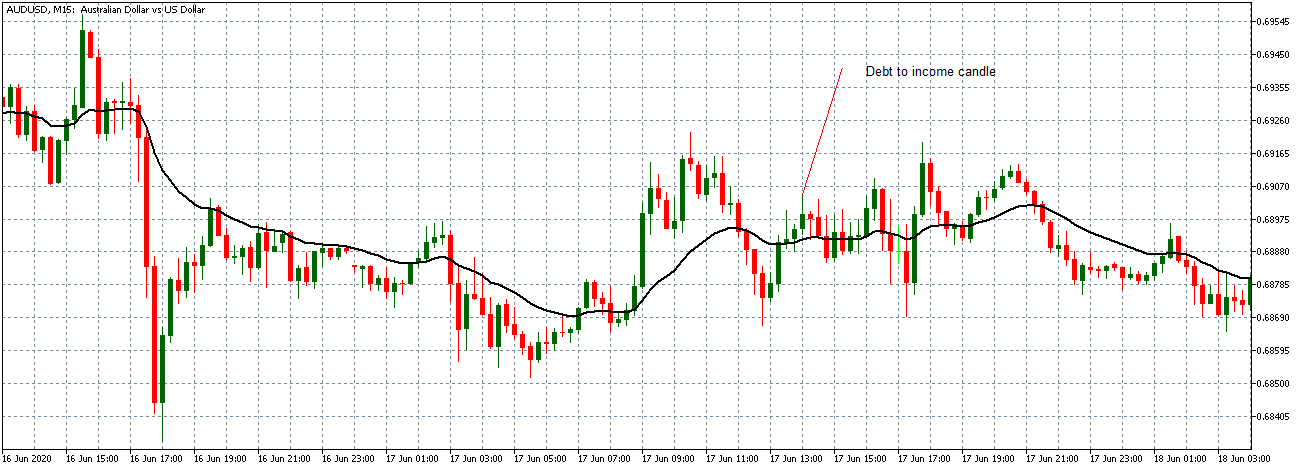
Before the news release, the AUD/USD pair showed a similar trend as the GBP/USD pair attempting to recover from a short-lived downtrend. As can be seen, the 20-period Moving Average has already started flattening before the news release.
After the data release, the AUD/USD pair formed a 15-minute bullish candle. The pair continued trading in a neutral trend with candles forming on a flat 20-period Moving Average.
From the above analyses, the news release of the household to debt income data produced contrary effects on the USD. More so, the indicator’s impact on the currency pairs is negligible.