Categories
Forex Videos

Fundamental Analysis For Novices – Eurozone Services Sentiment!

,

Fundamental Analysis For Novices – Eurozone Services Sentiment


Welcome to the fundamental analysis for novices educational video.  In this session, we will be looking at the eurozone services sentiment indicator.

It doesn’t matter if you are an occasional trader,  a day trader,  or an institutional size trader,  one aspect of trading which is an absolute must is to regularly refer to an economic indicator such as this one,  in order to plan your trades around the release of countries’ economic data releases.

Many Traders only trade on economic data releases, as soon as the data is released, they will have orders already placed into the market or execute instant trades depending on the statistical data releases as they come out into the market.  This is called trading on fundamental news flow.  It can cause extreme volatility in the market.  This is just one of the reasons why you need to be informed as to when countries release their economic data statistics into the market, and where these are usually released at set times and subject to an embargo.

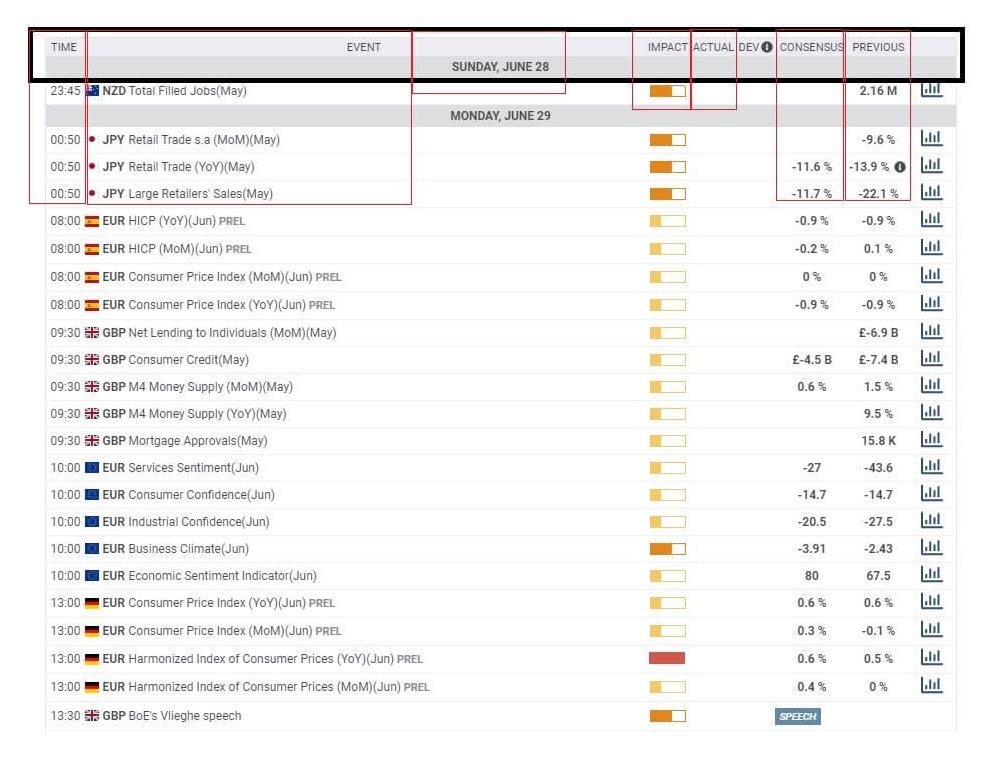
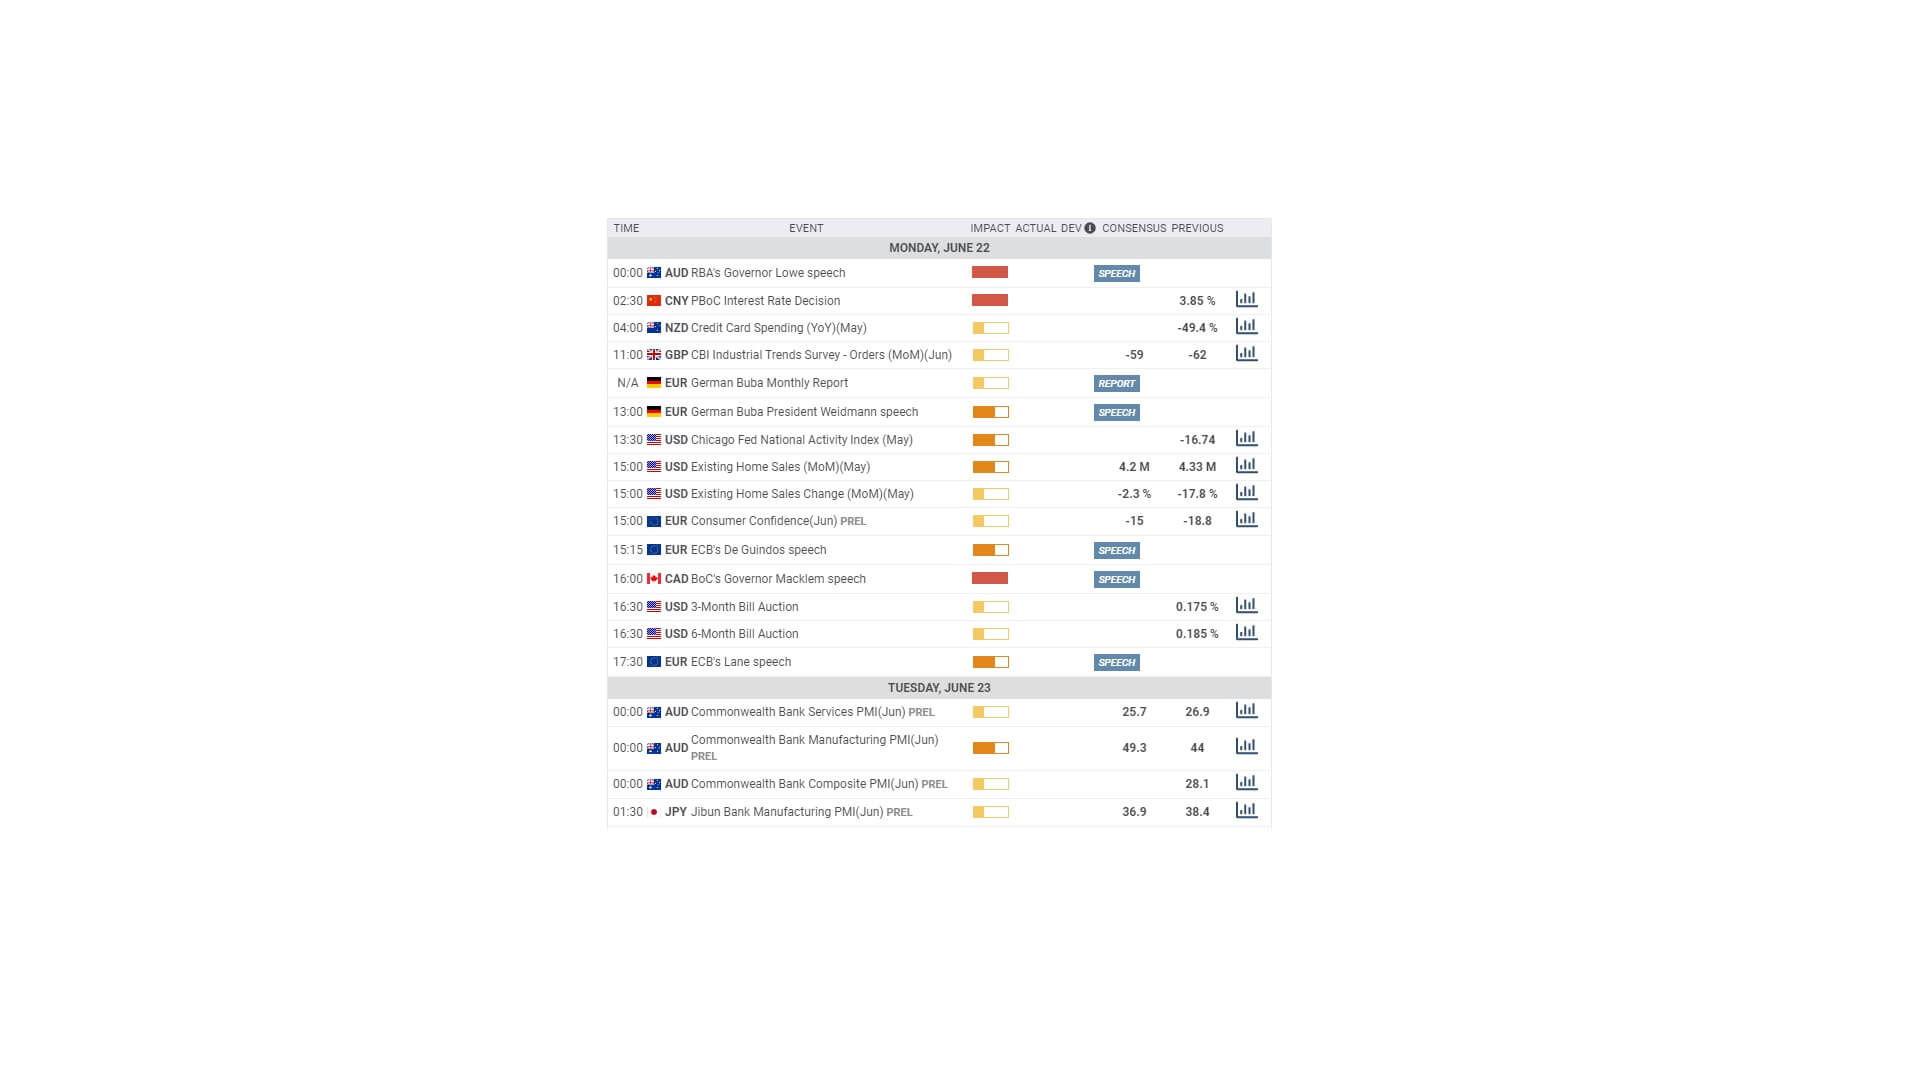
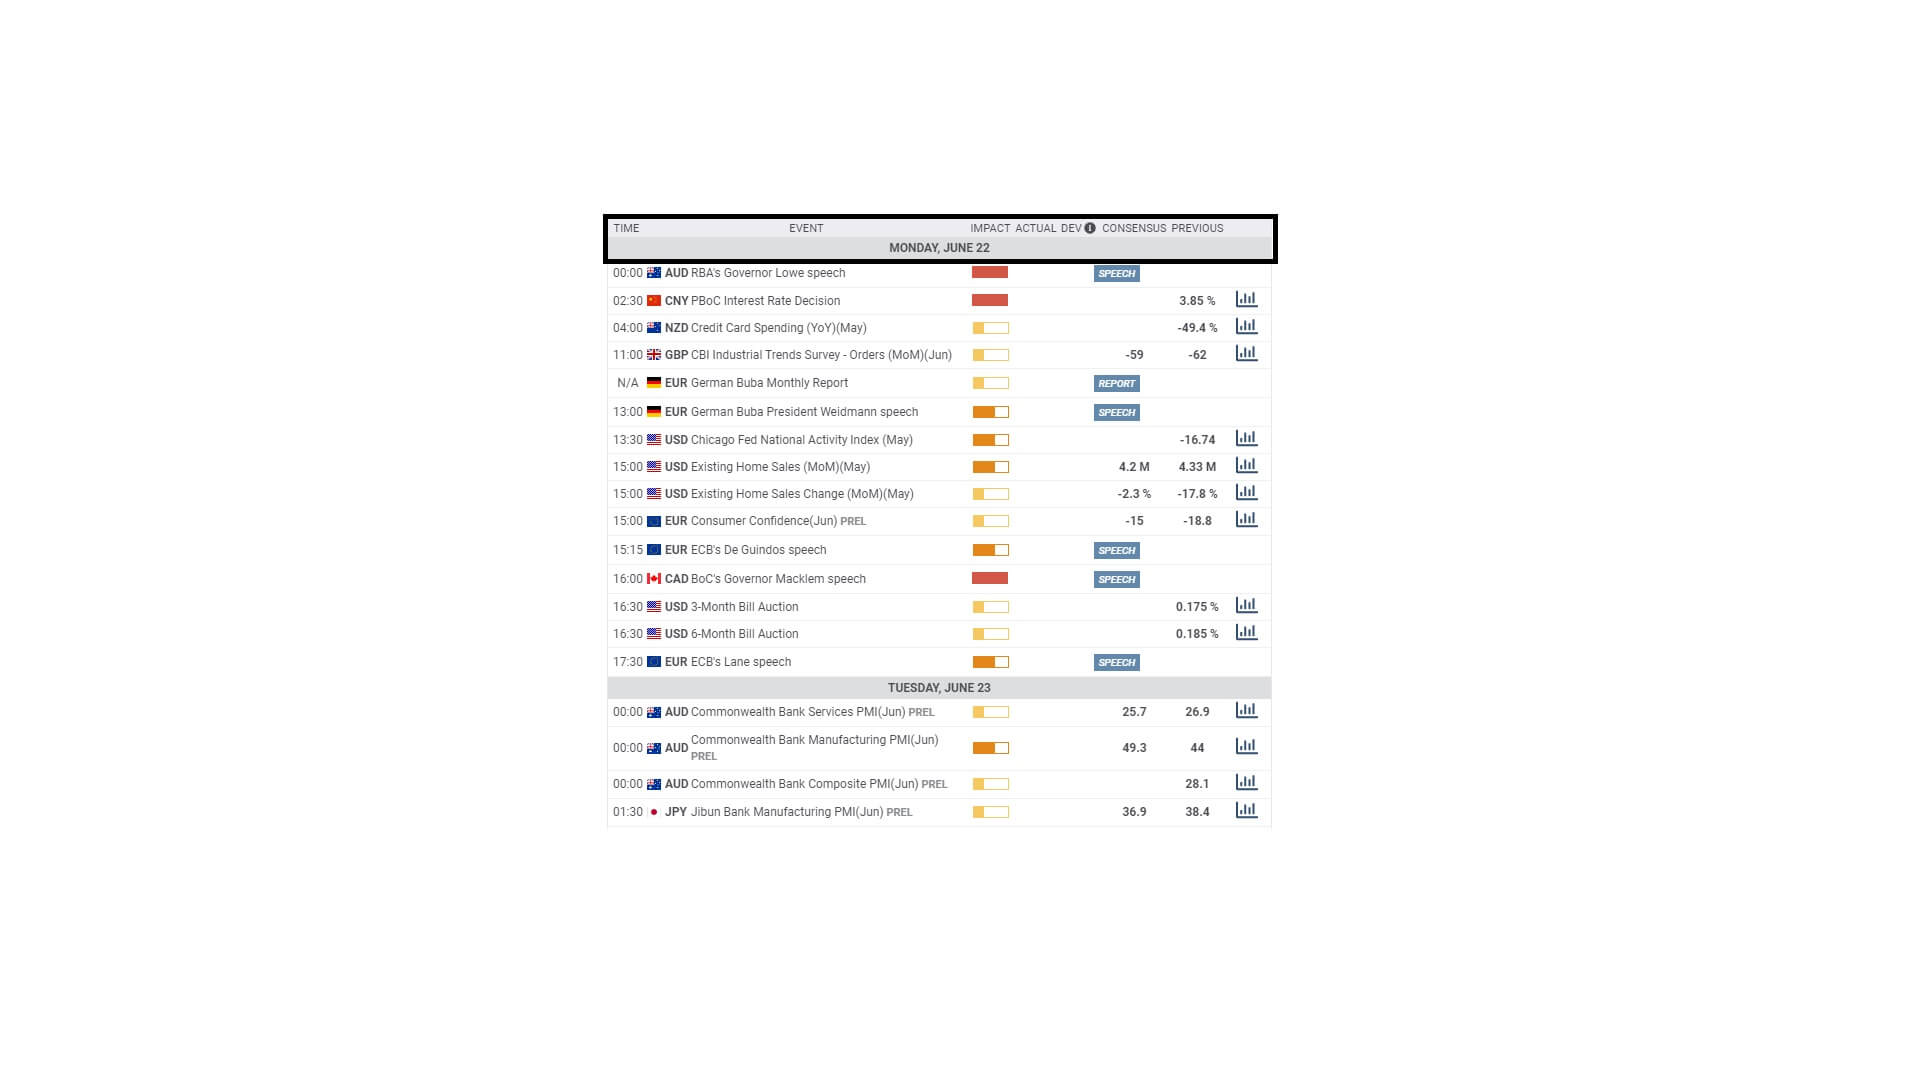
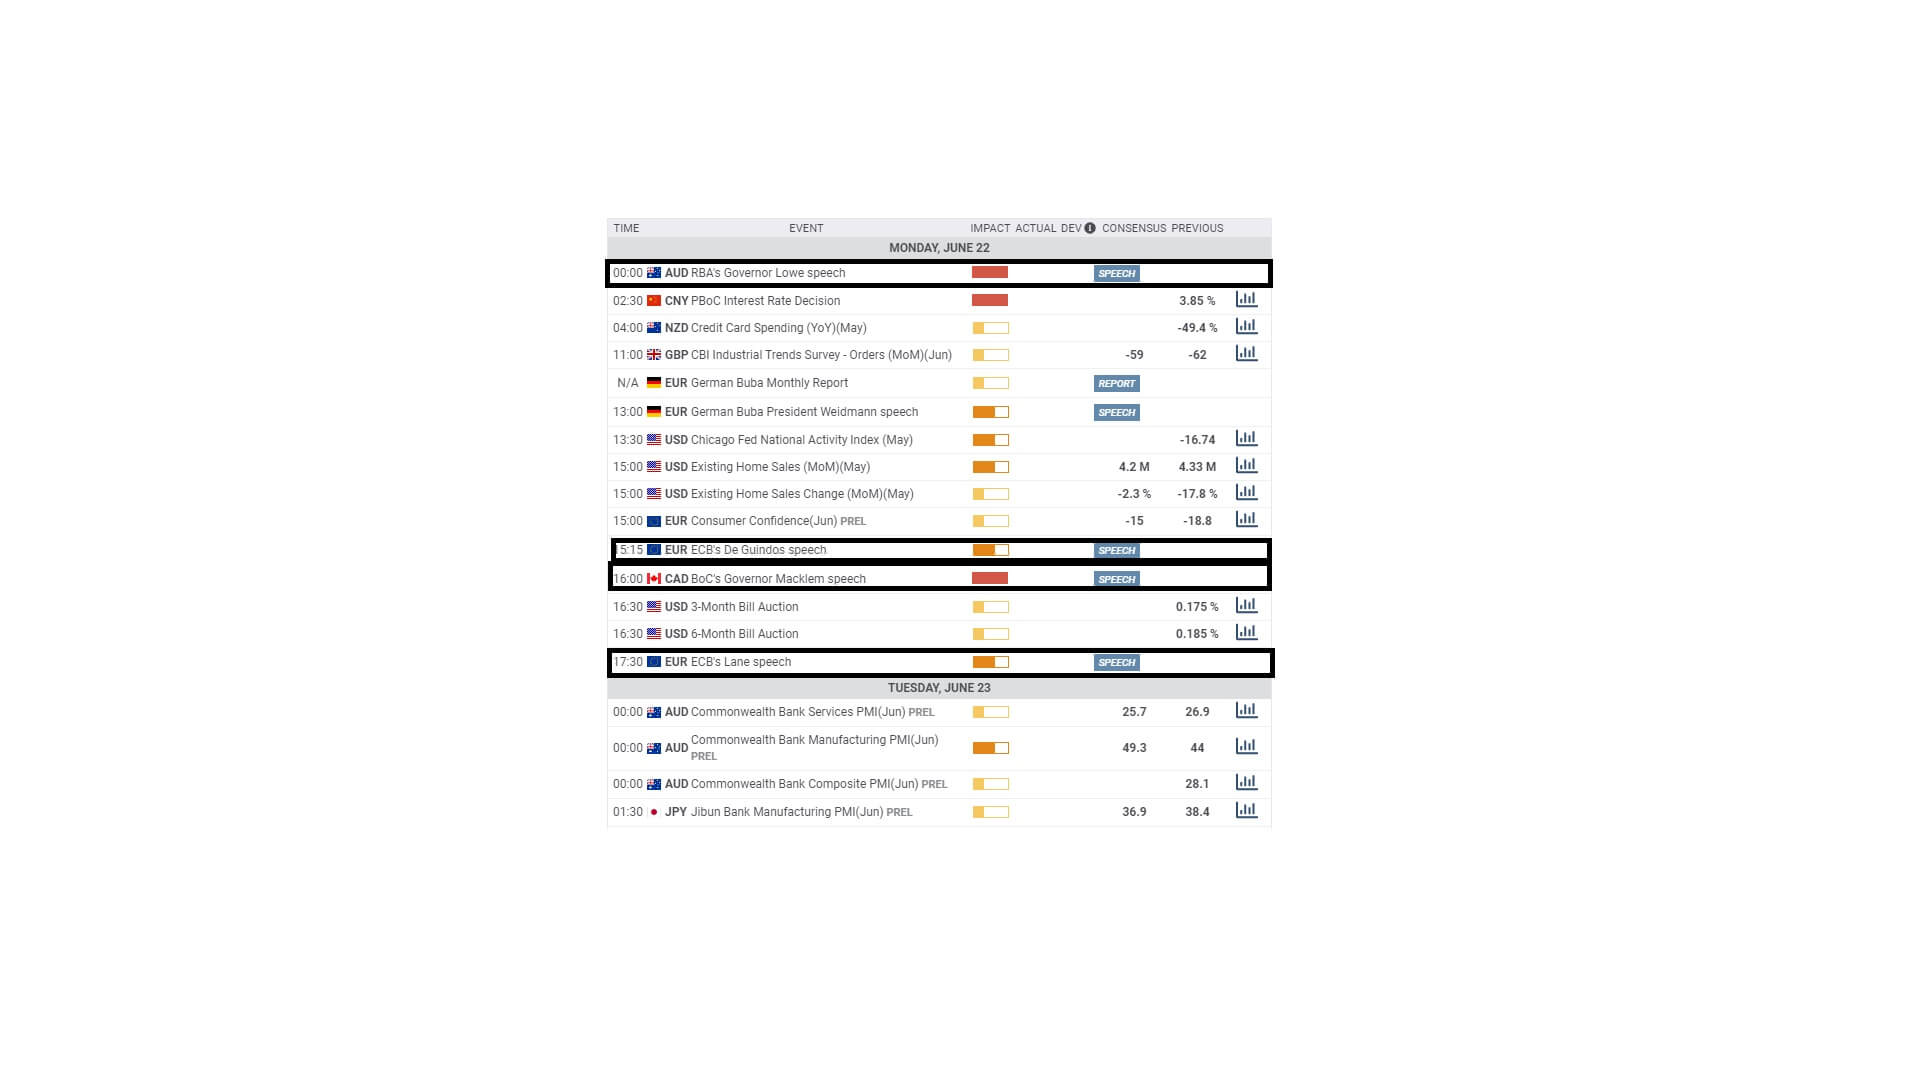
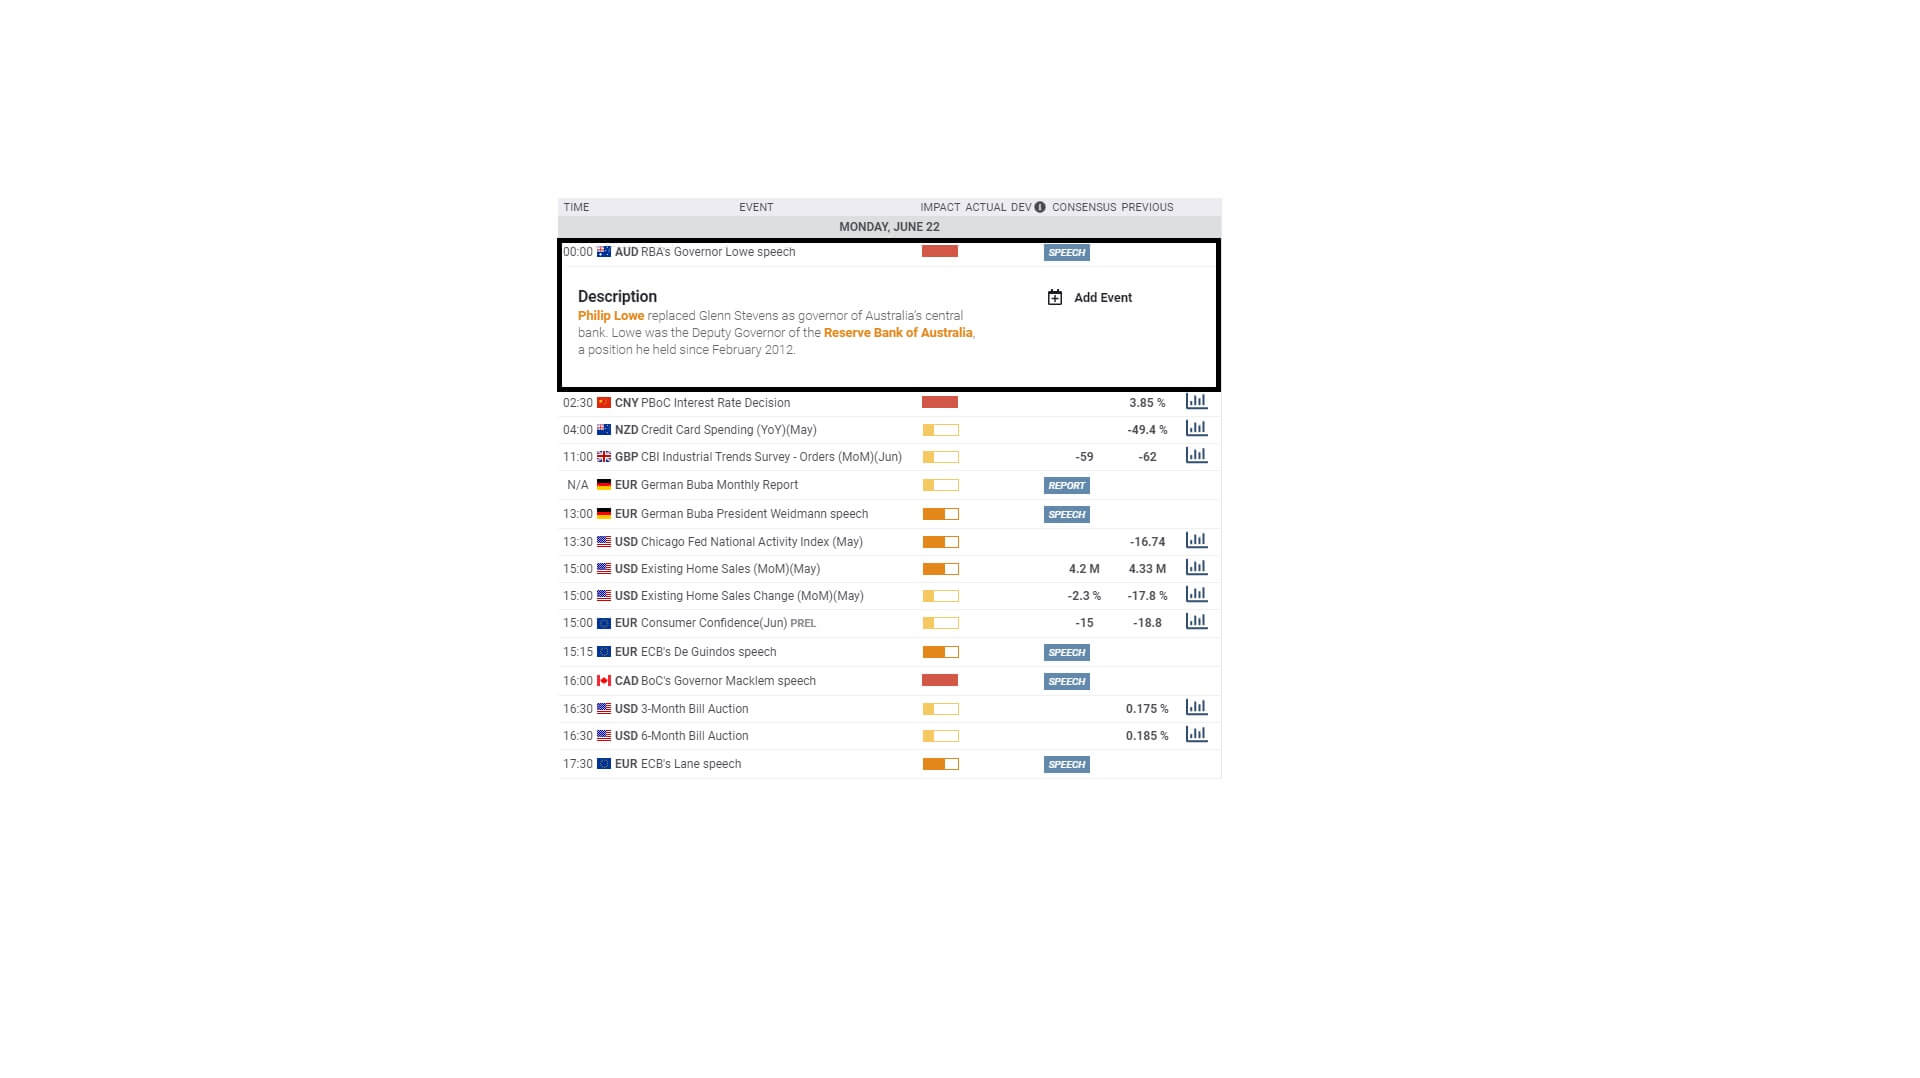
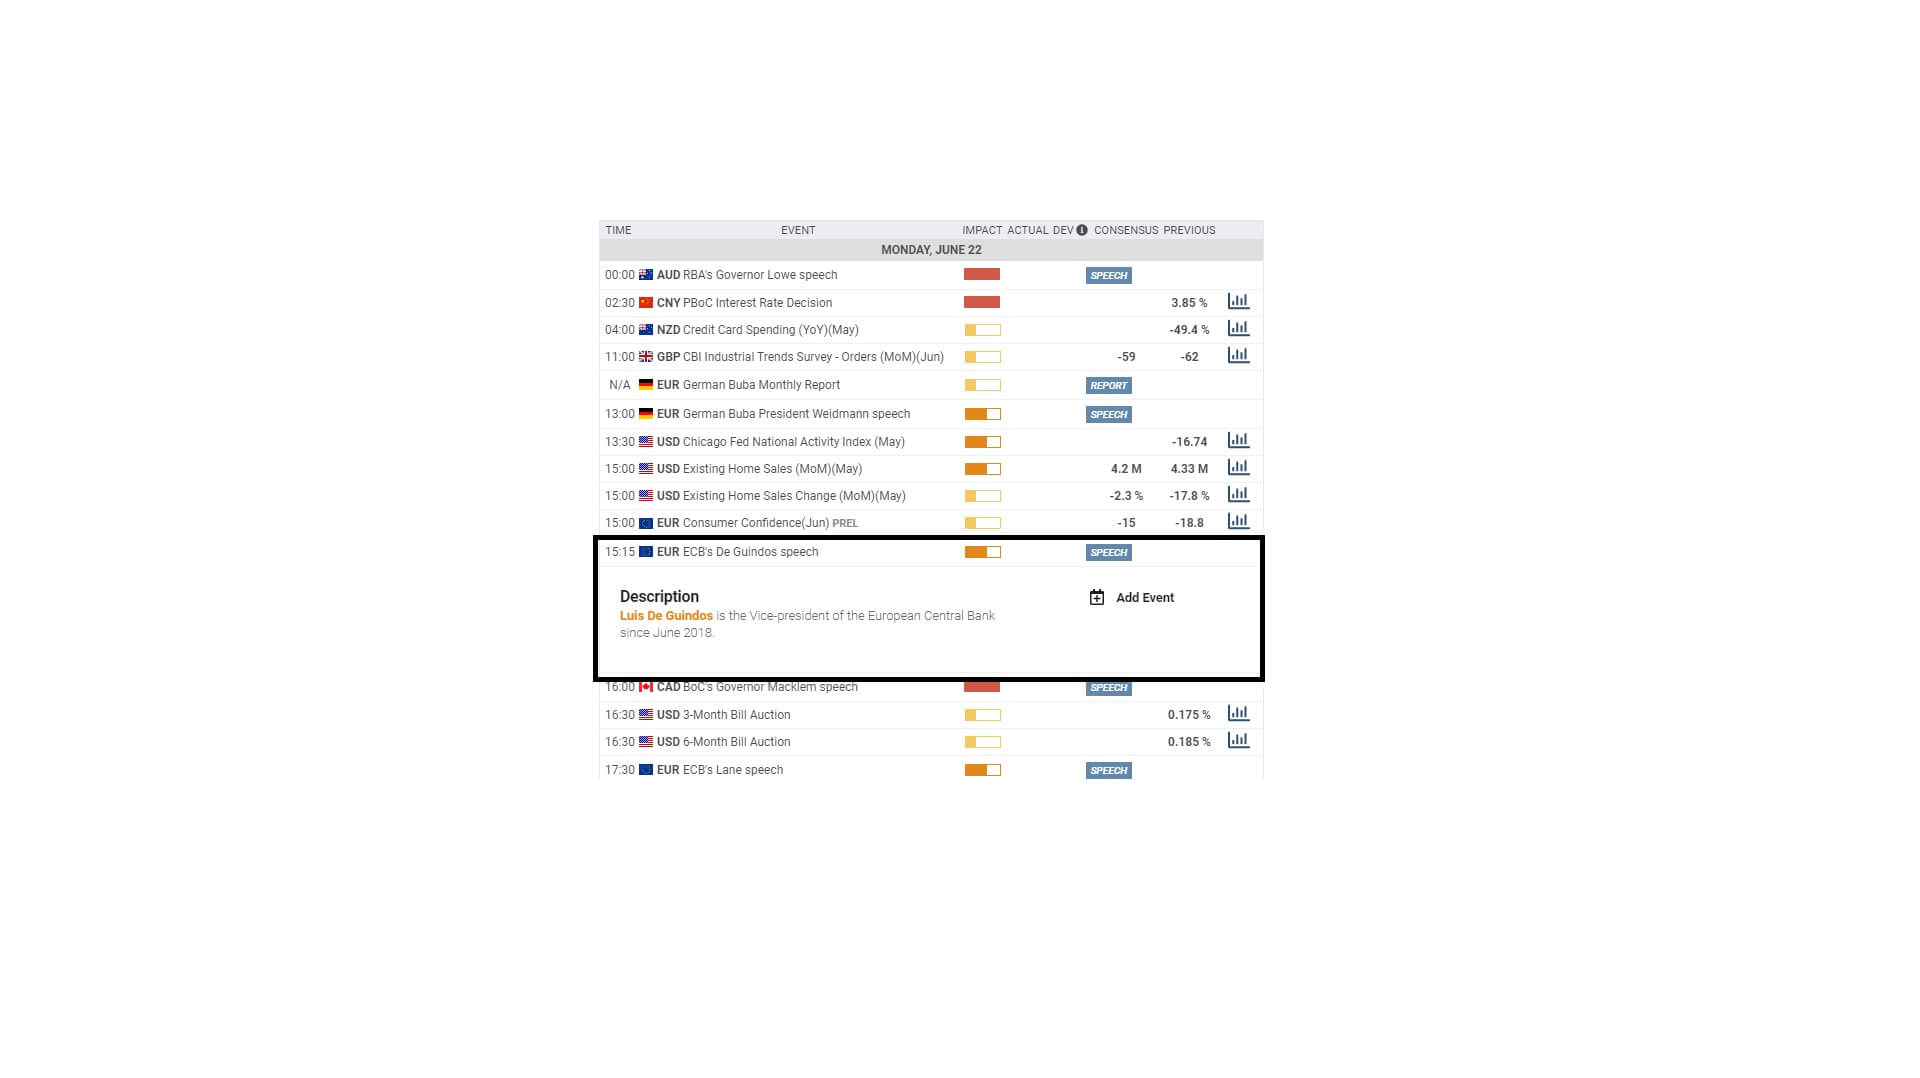
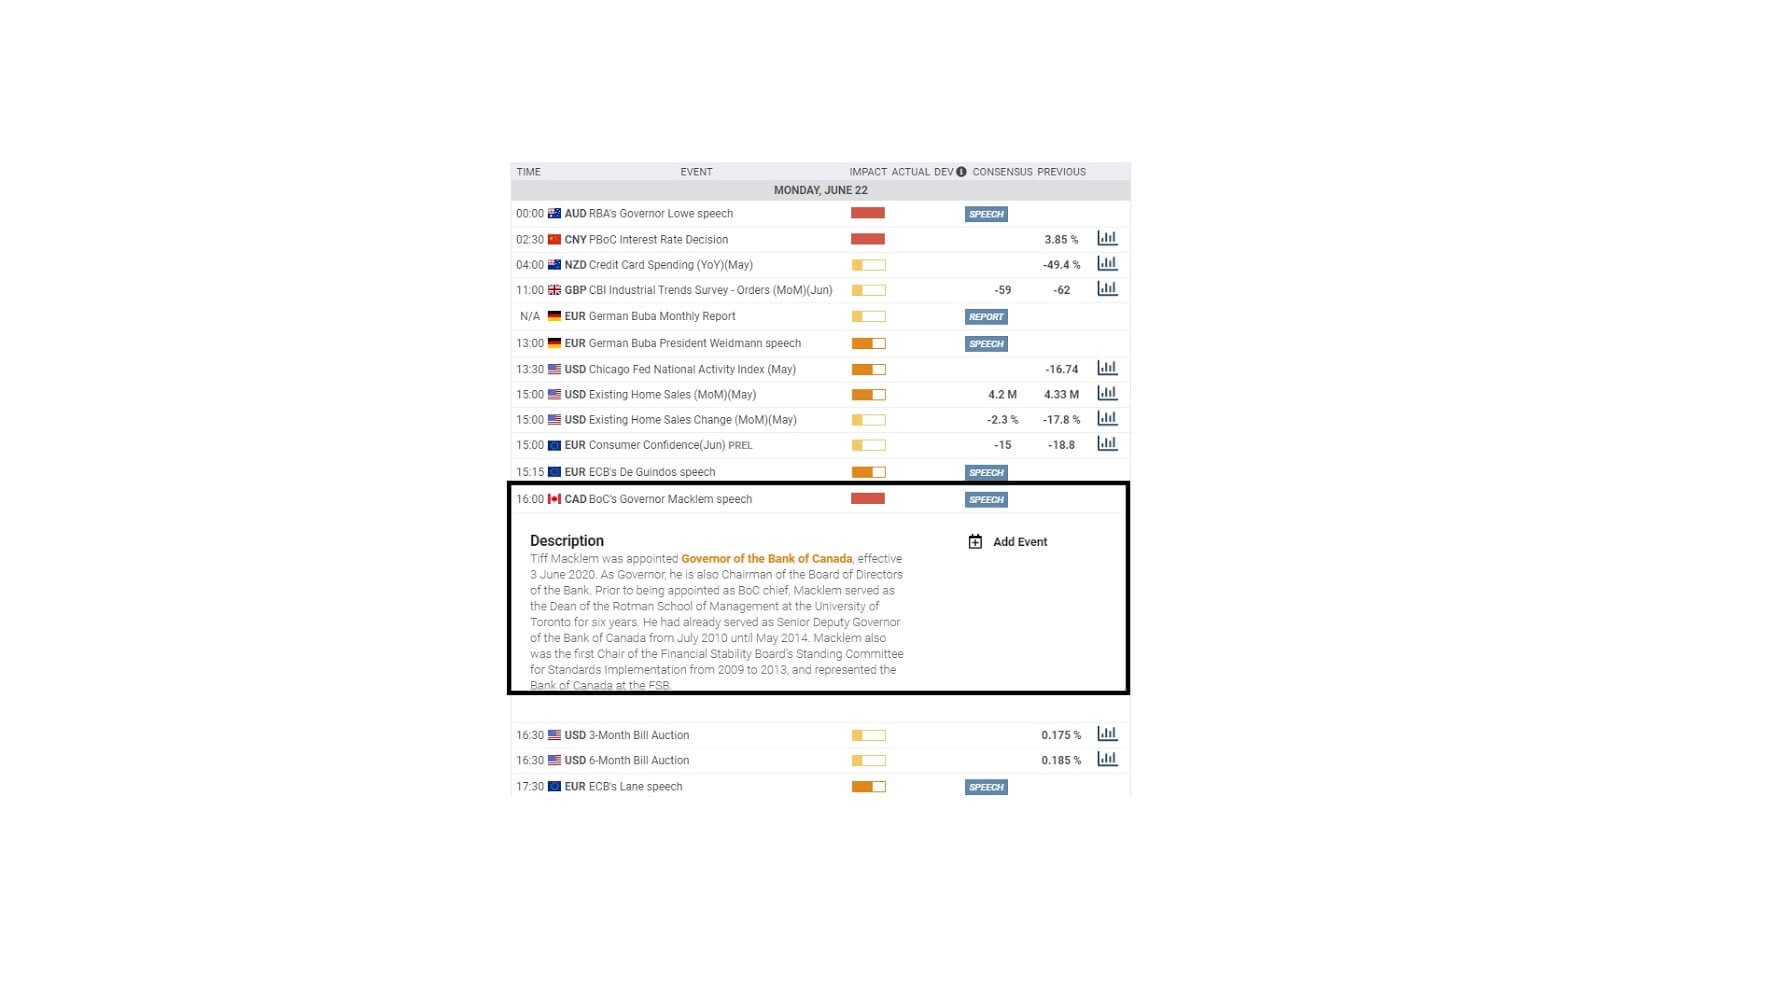
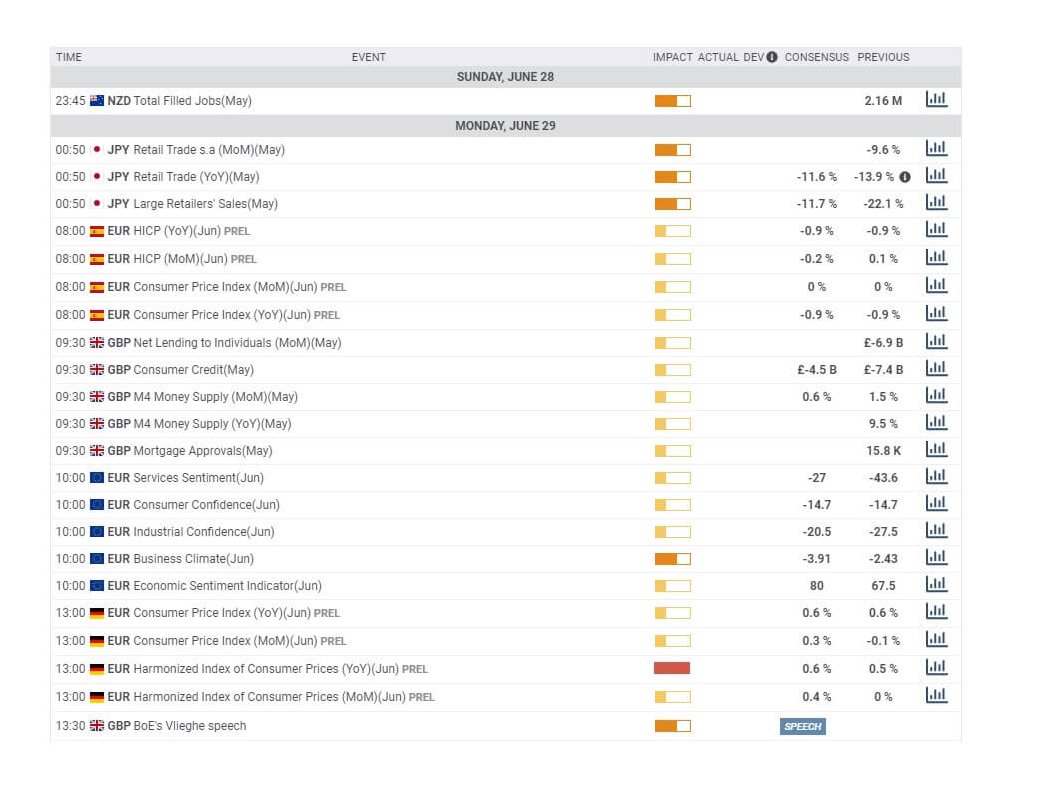
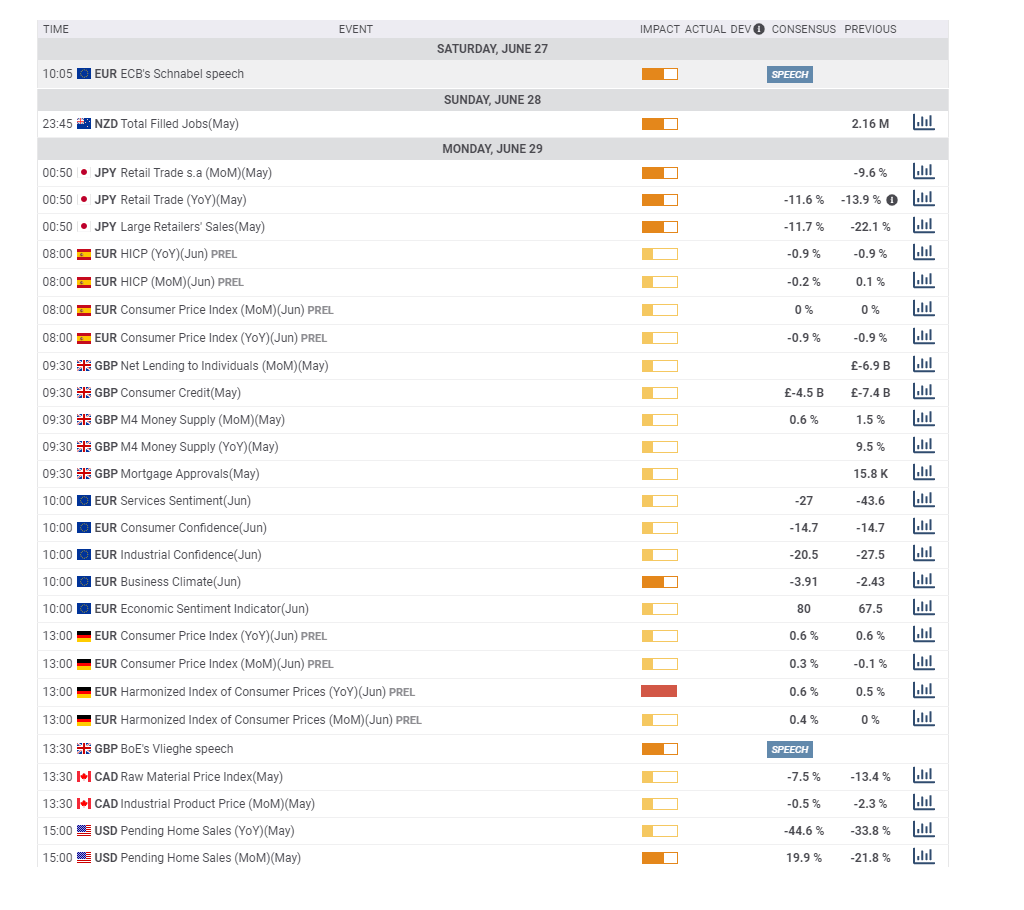
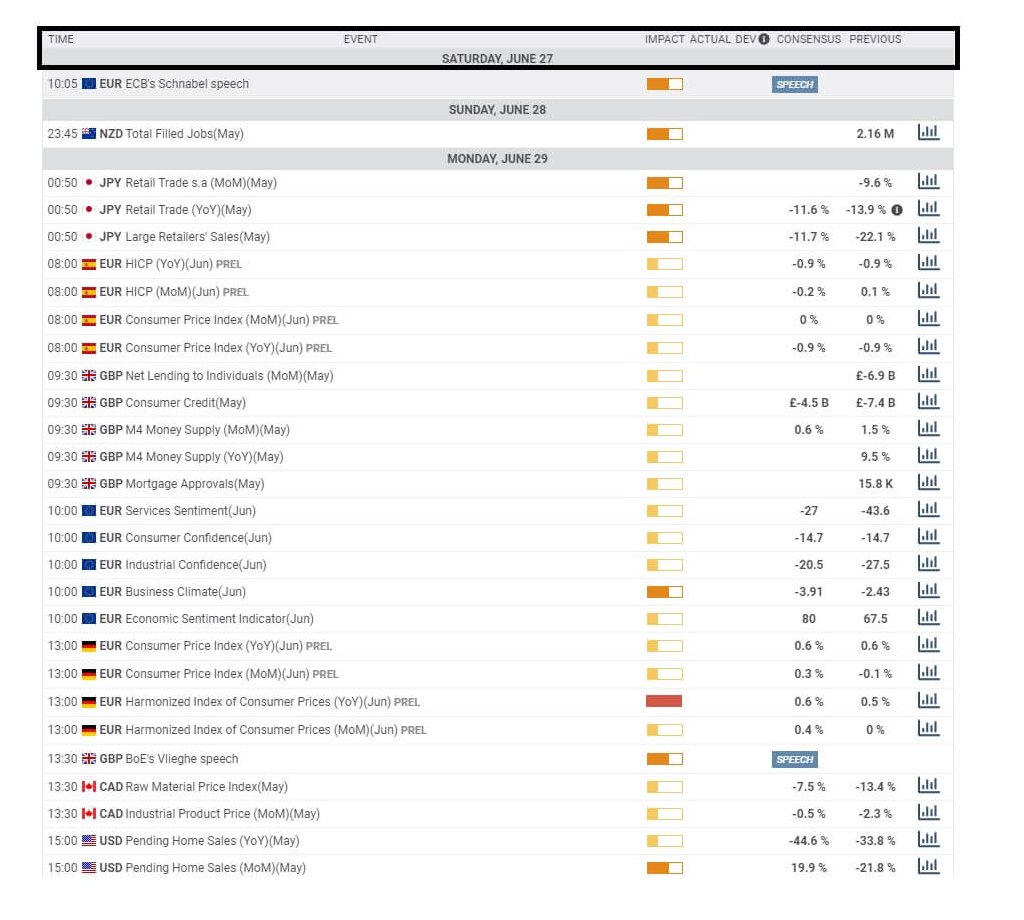
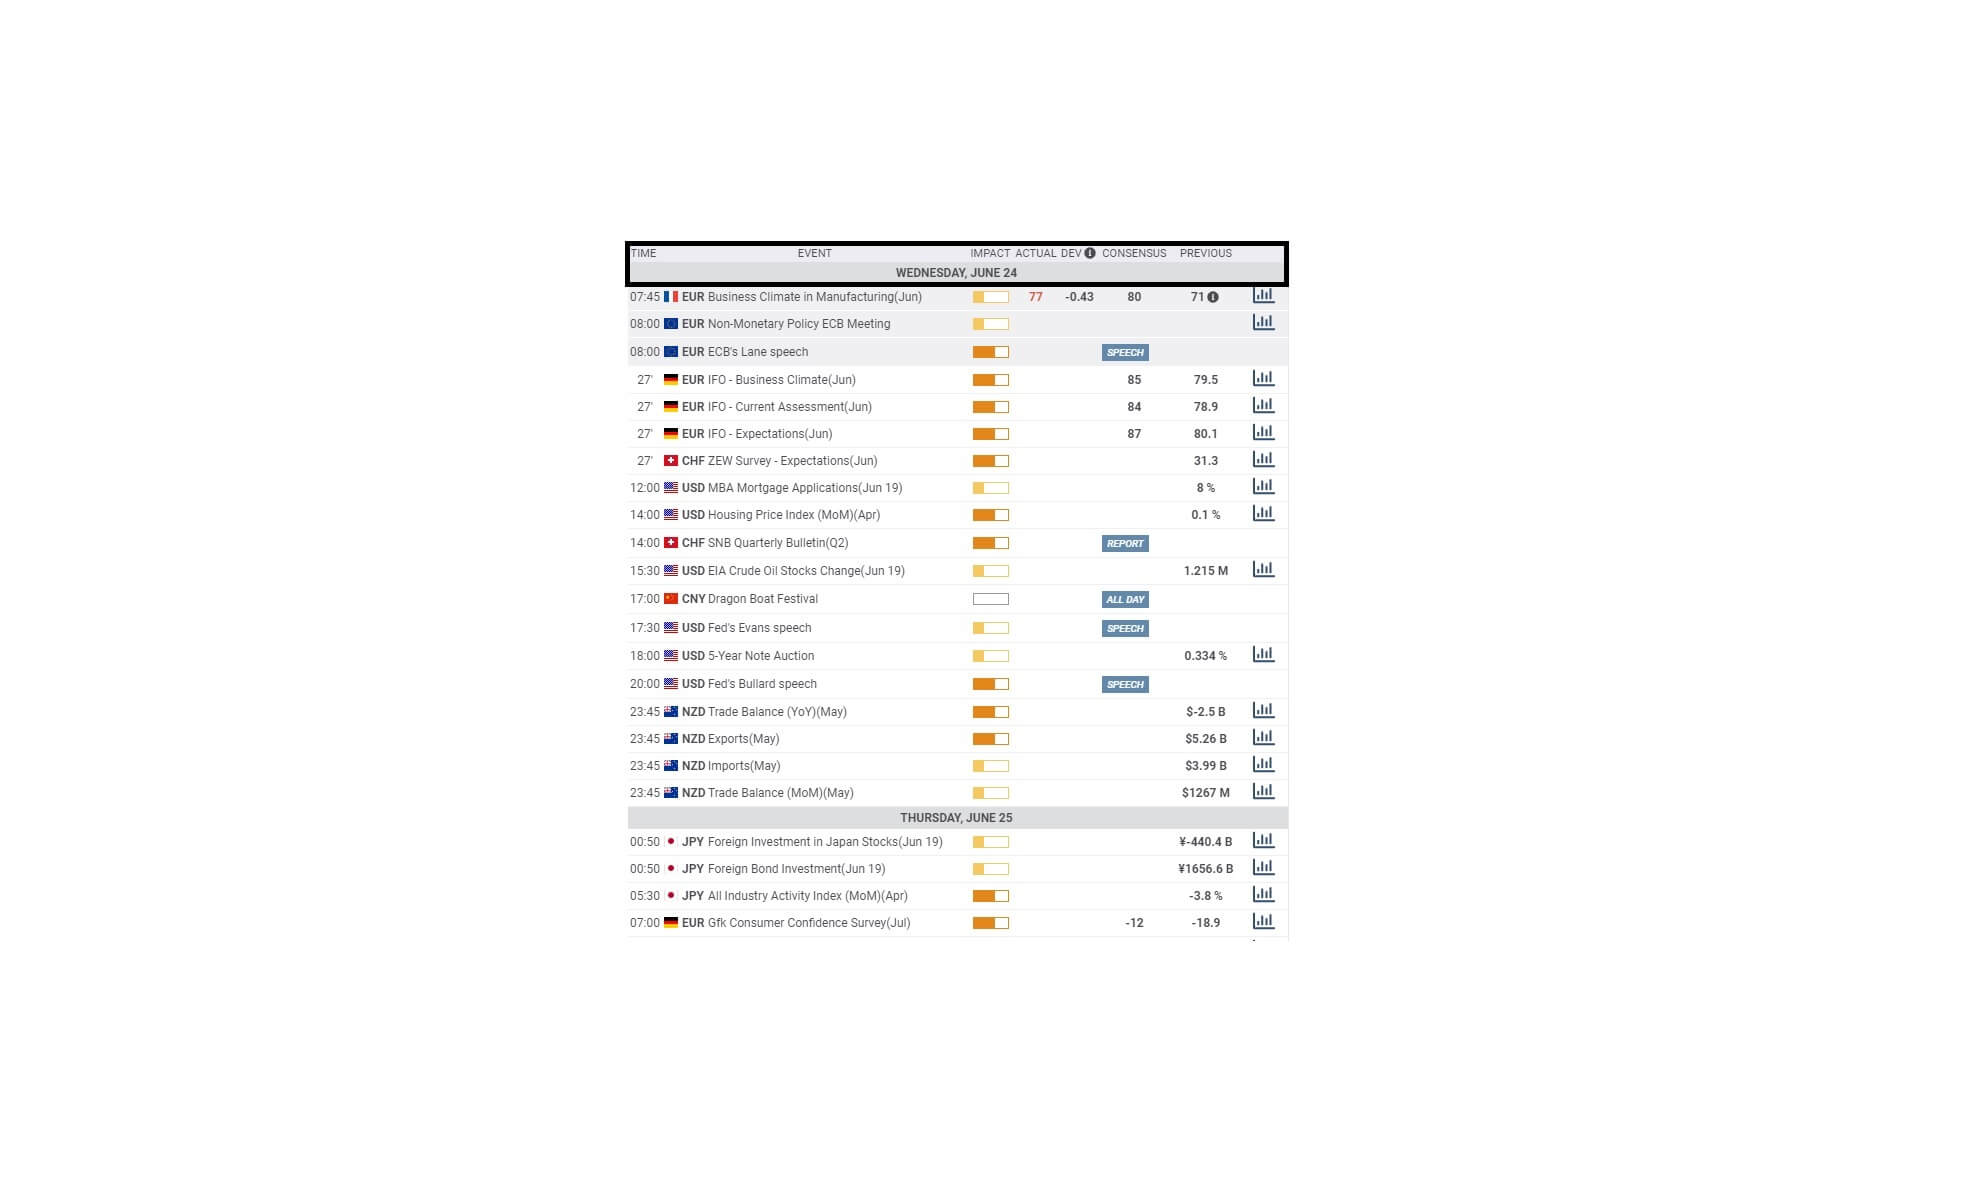
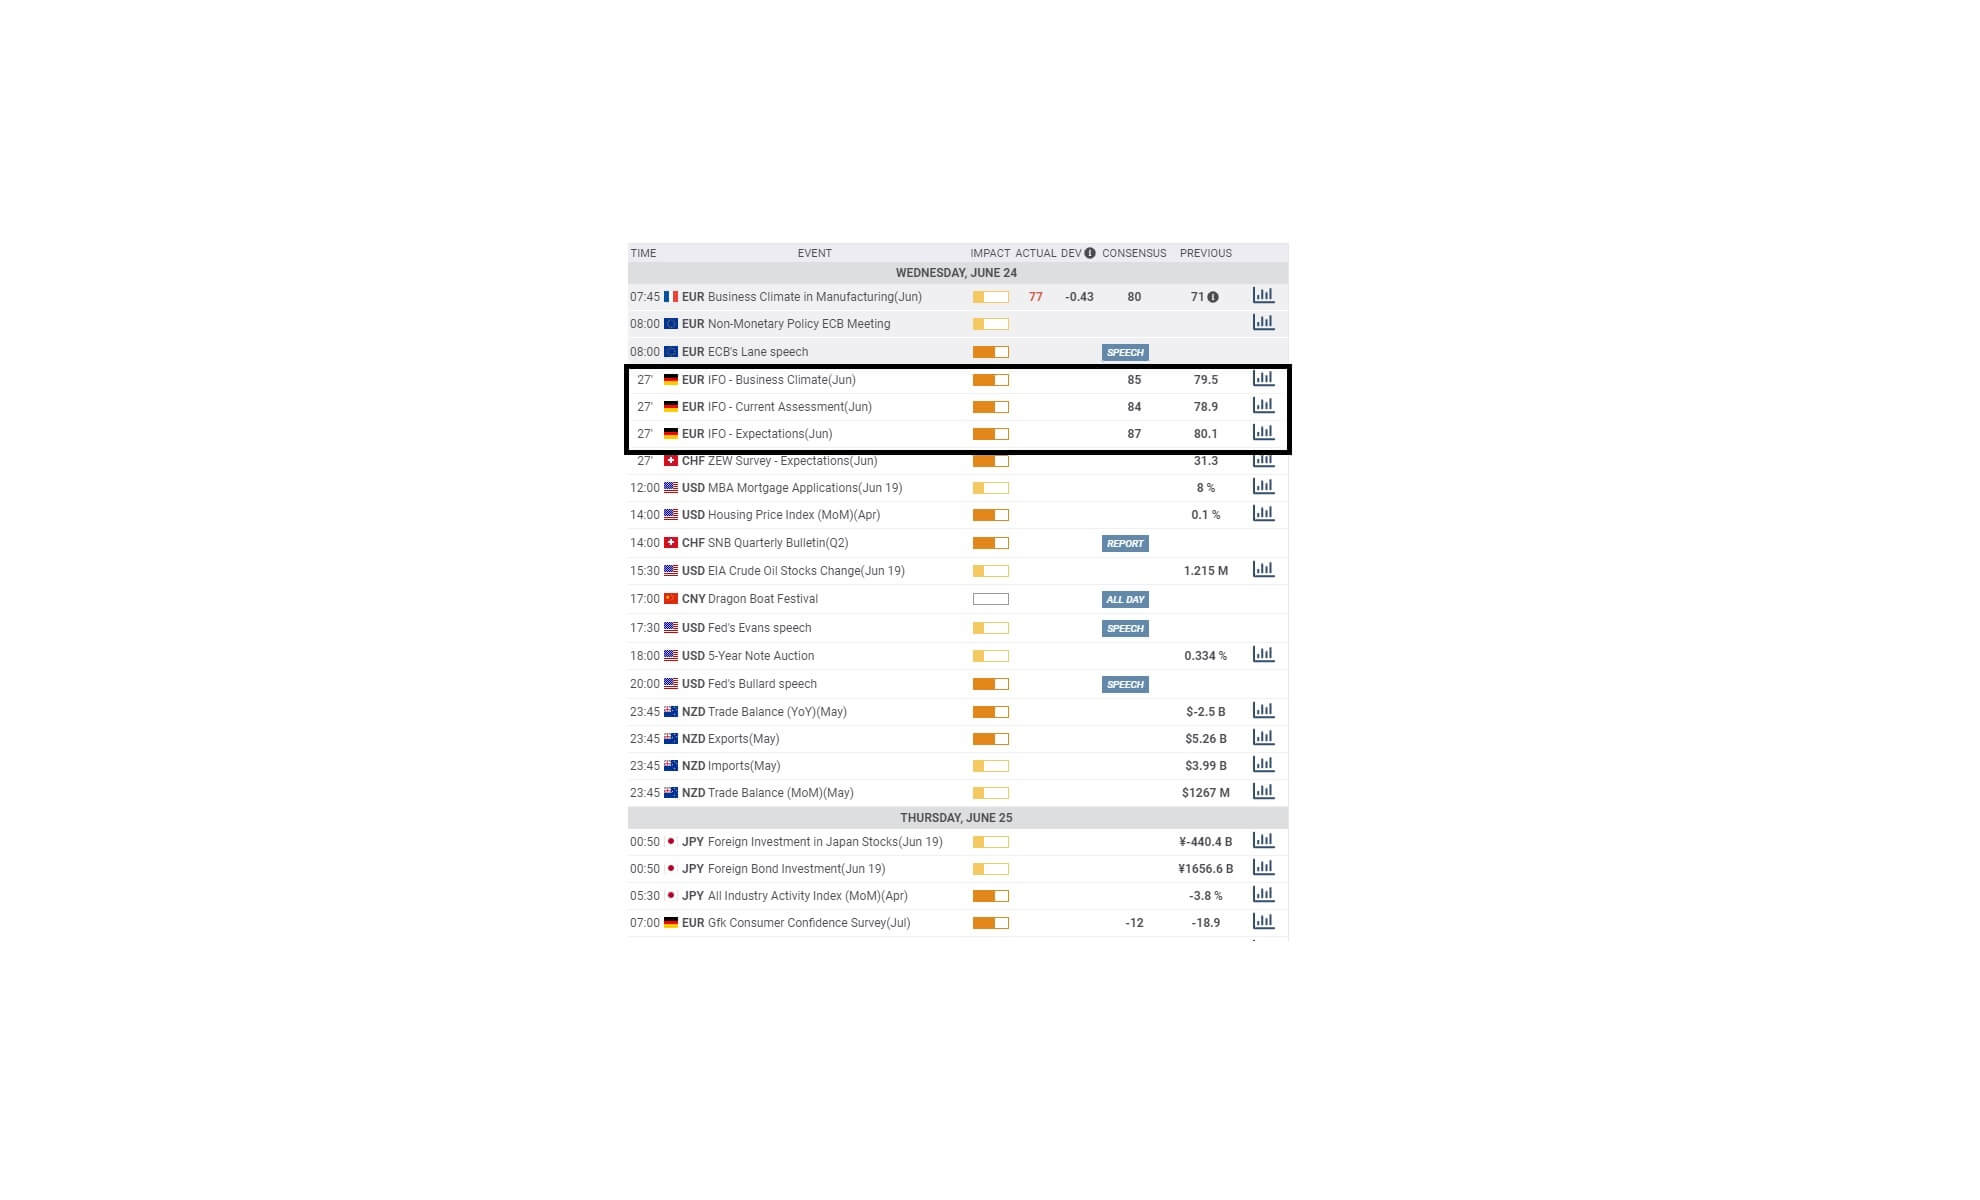
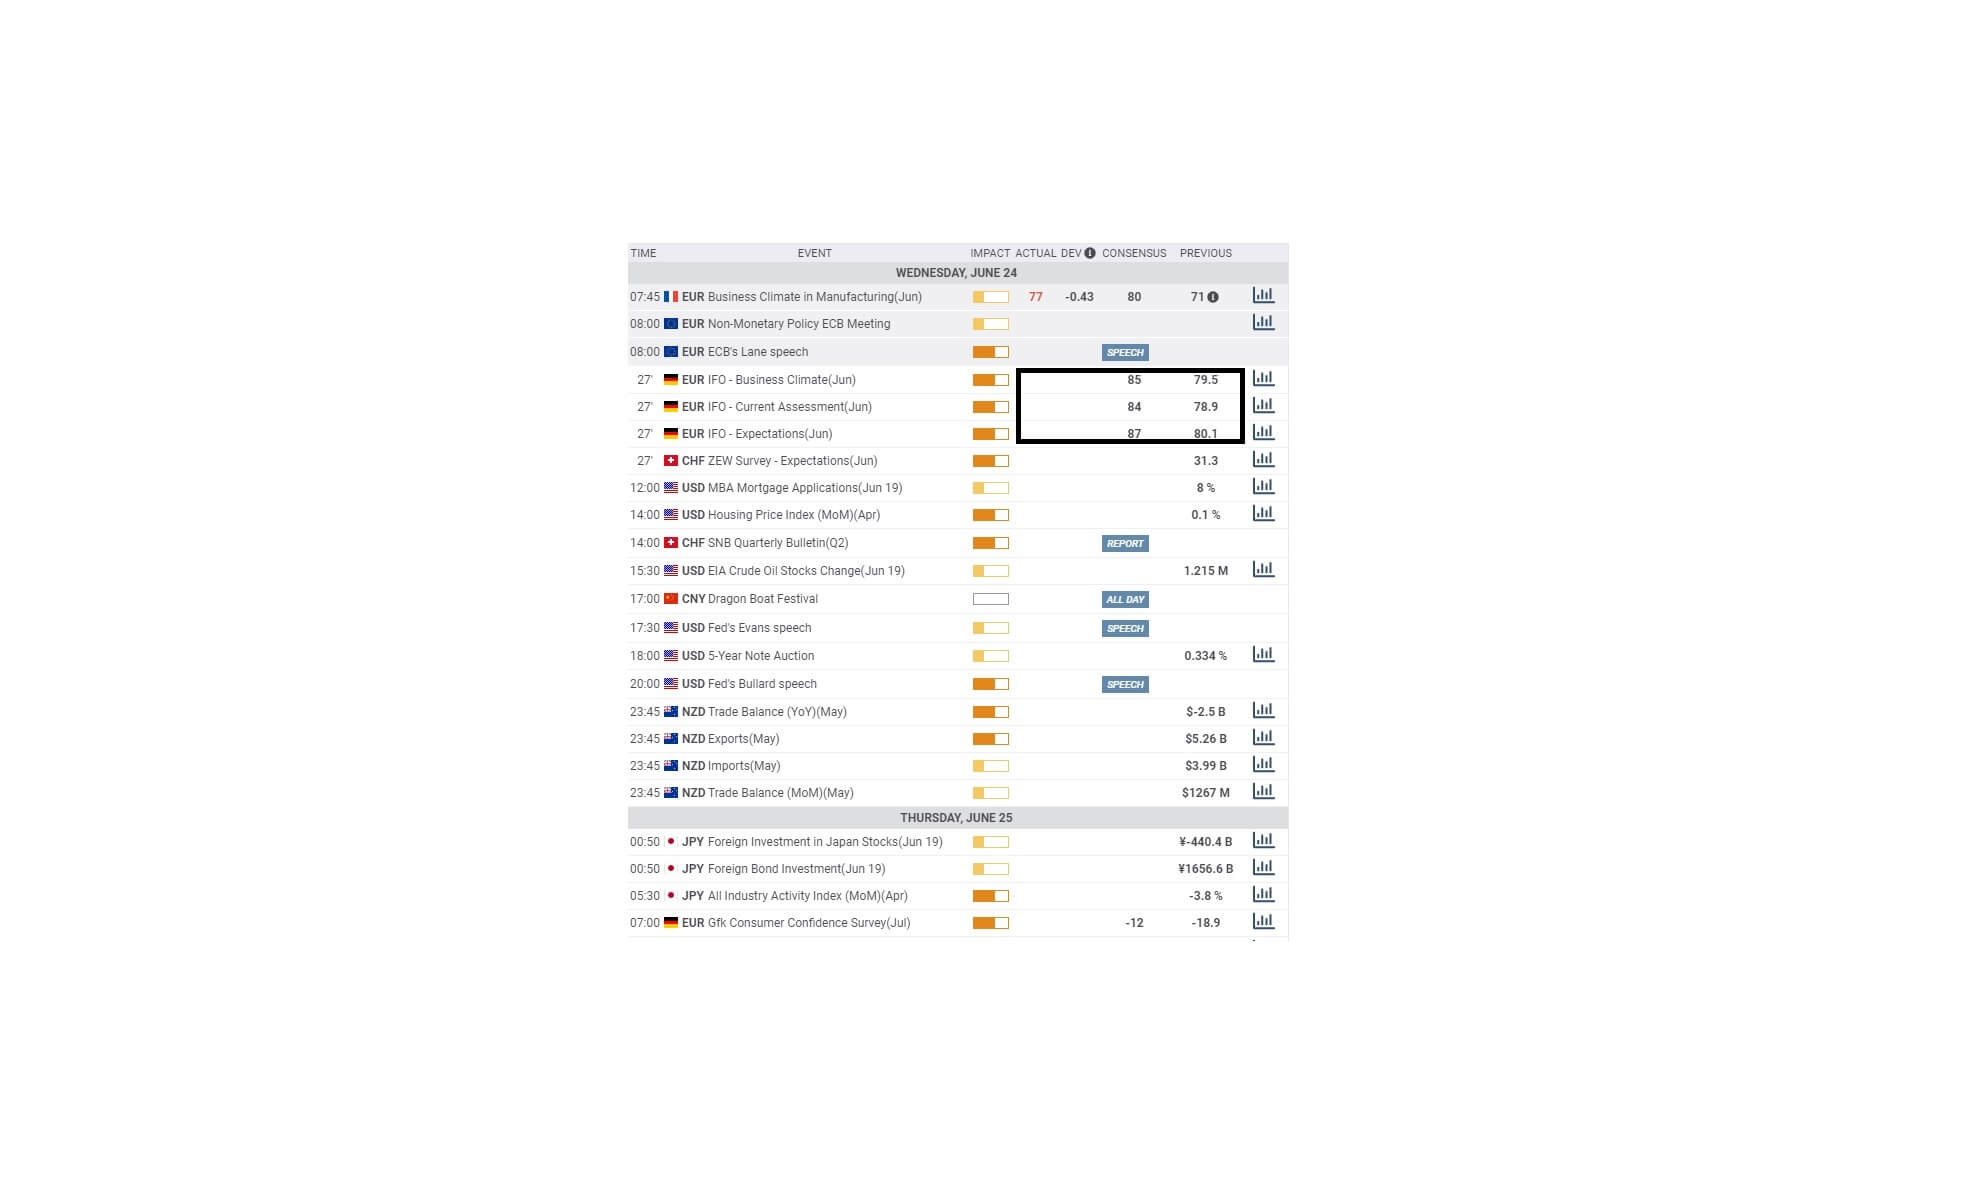
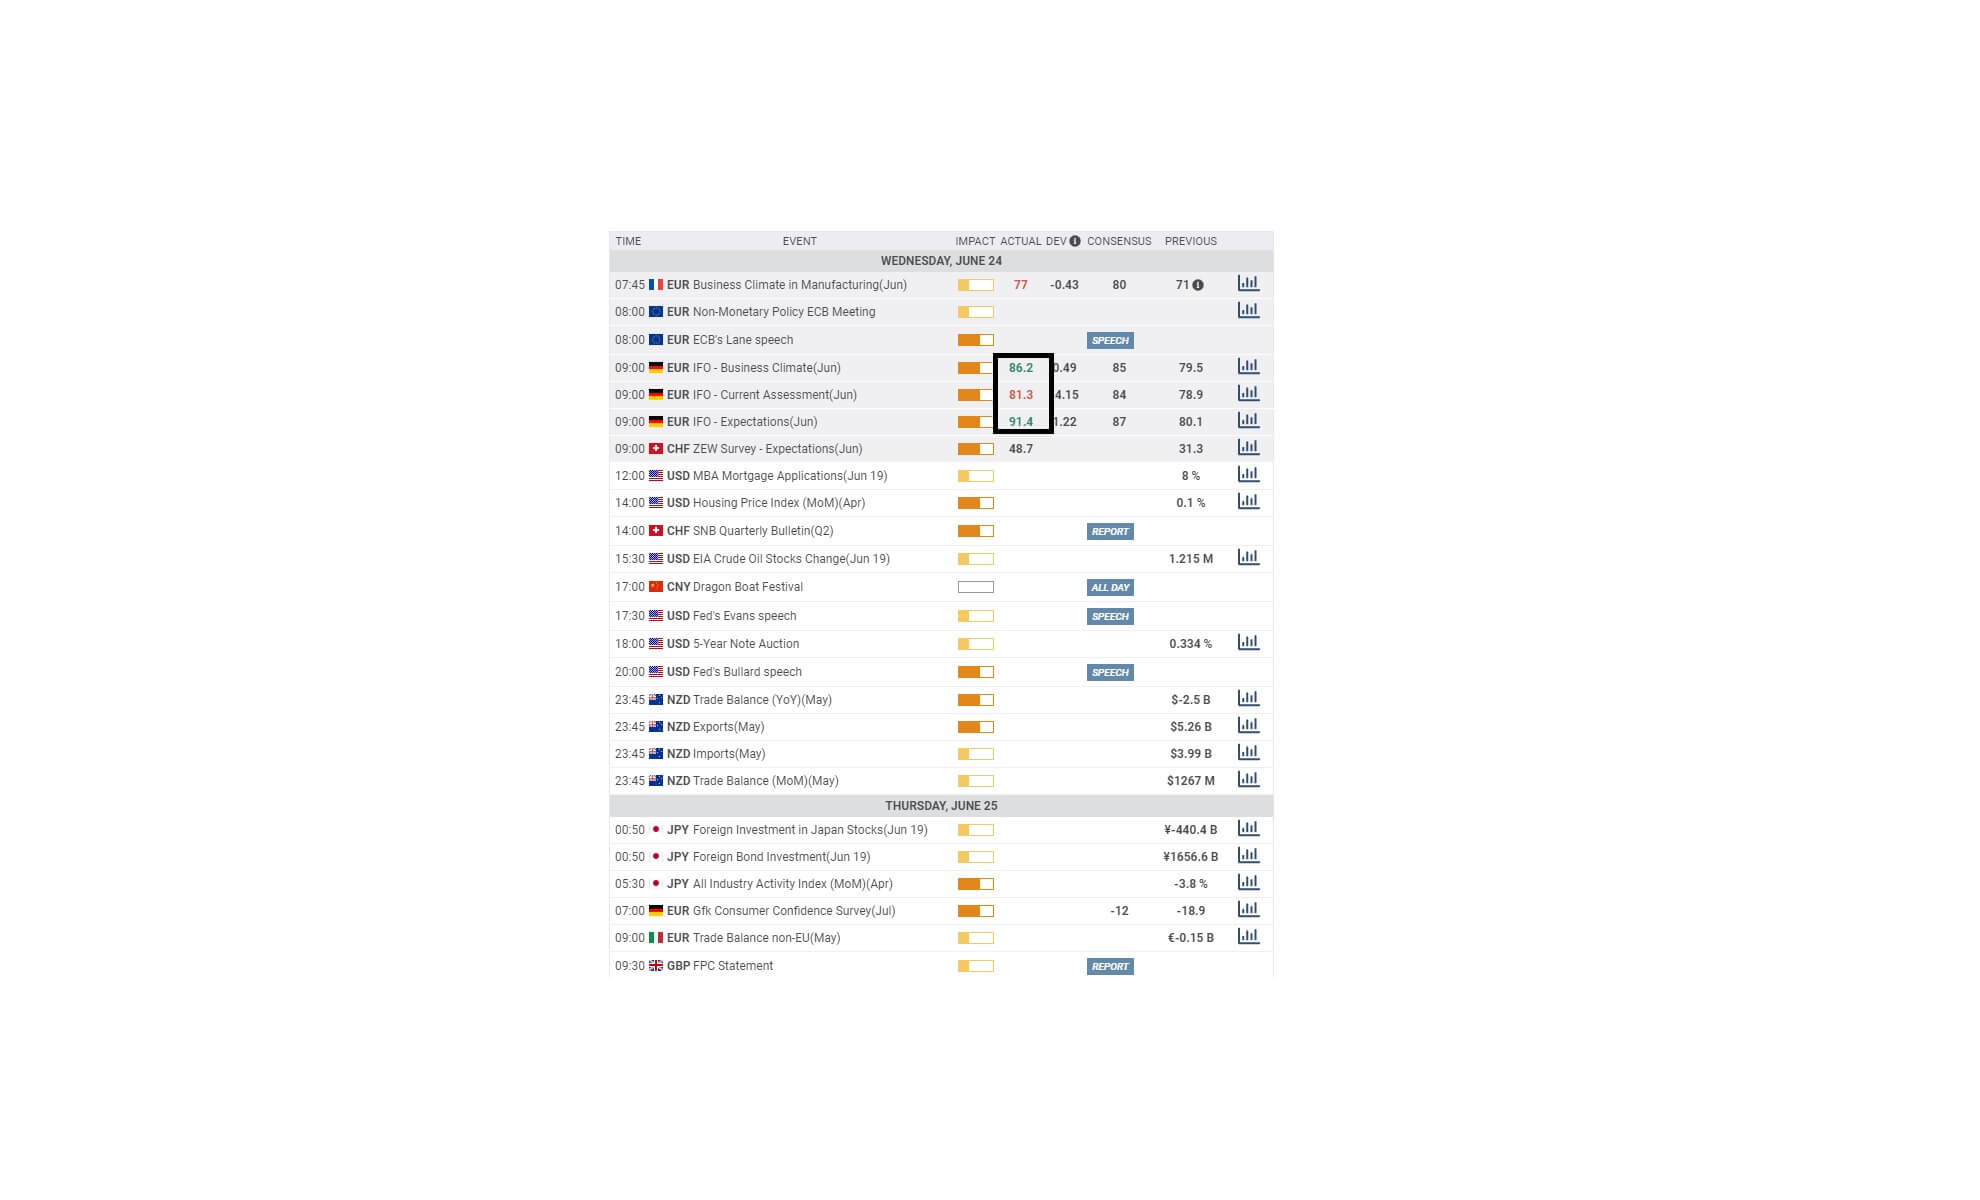
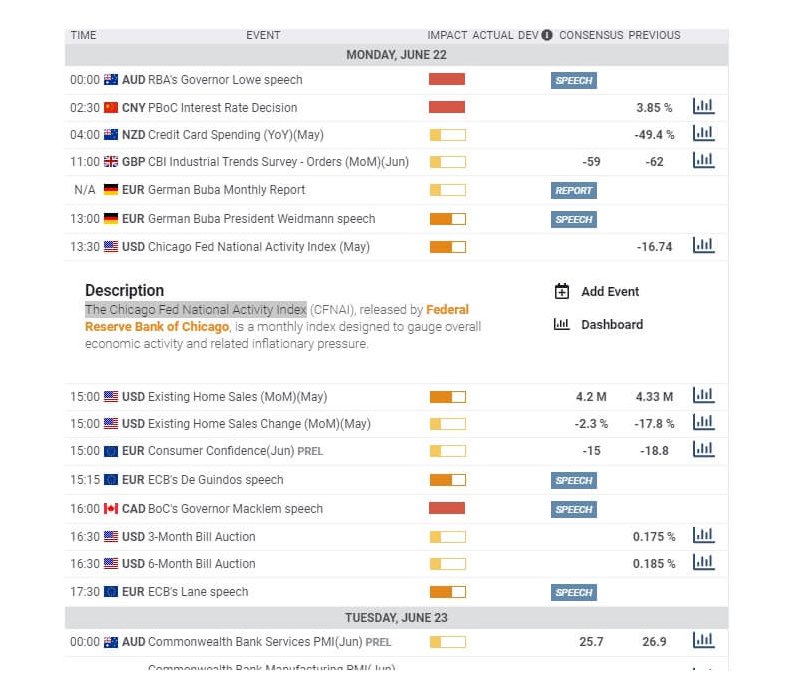
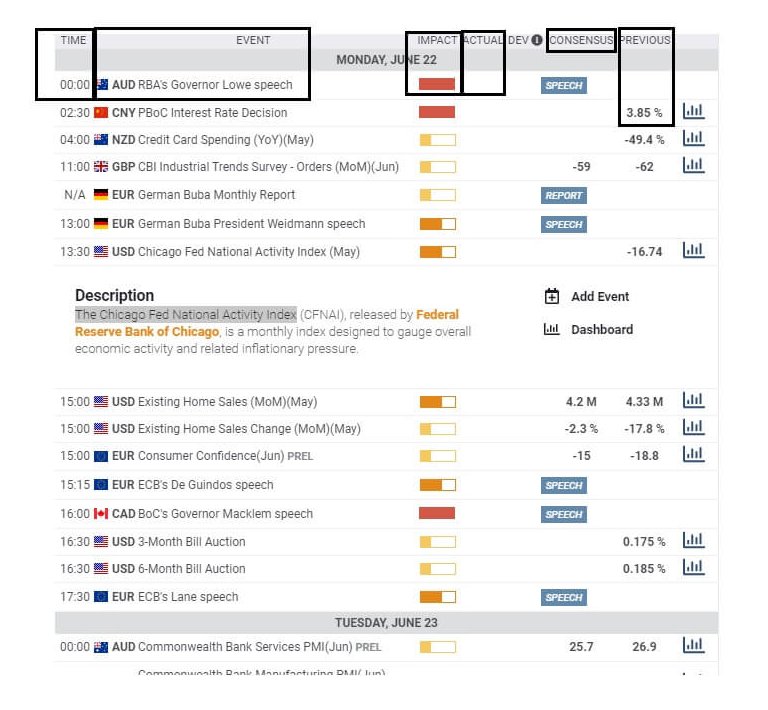
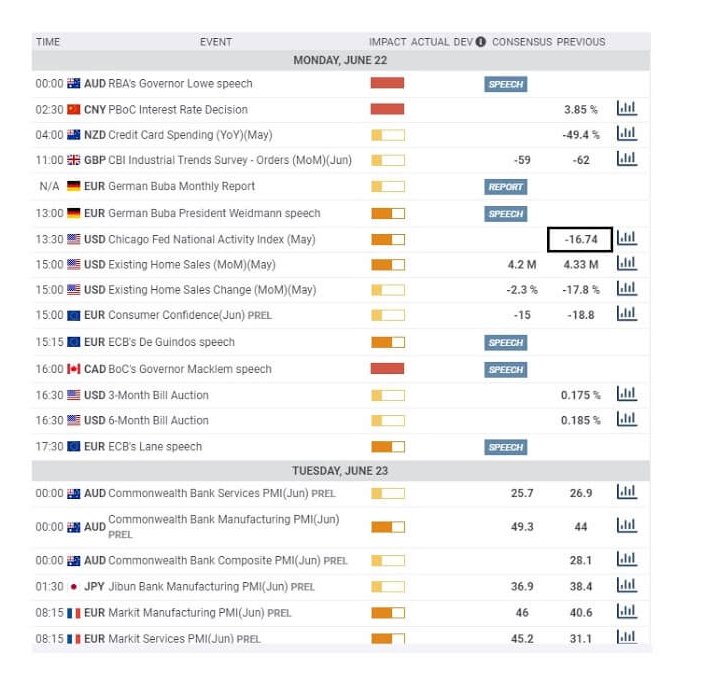
Most brokers will provide their traders with an economic calendar,  and the critical components are the time of the release, which may not necessarily be in the local time, the type of event, showing the country and the data to be released, including which aspect of the economy it refers to, the date and date. The impact that it will likely have upon its release, which will typically be in three levels – low – medium and high risk. Where high risk is more likely to cause volatility in the market.  A general consensus amongst economists and analysts with regard to what they expect the level to be, and the previous data release.
The economic data release is typically updated weekly, monthly, quarterly, and annually.

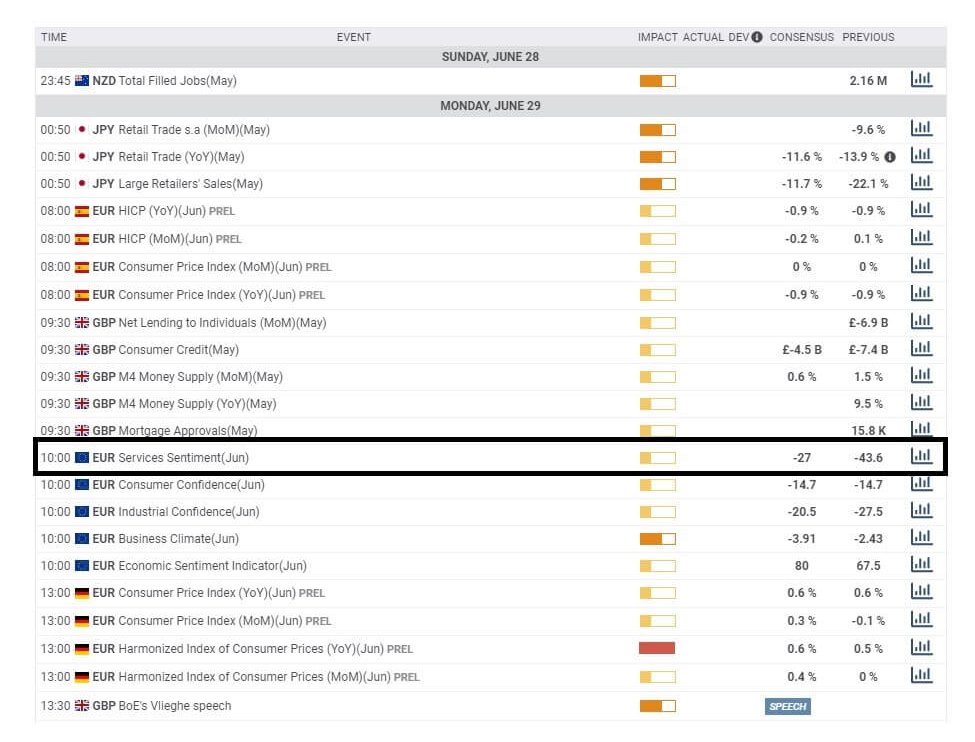
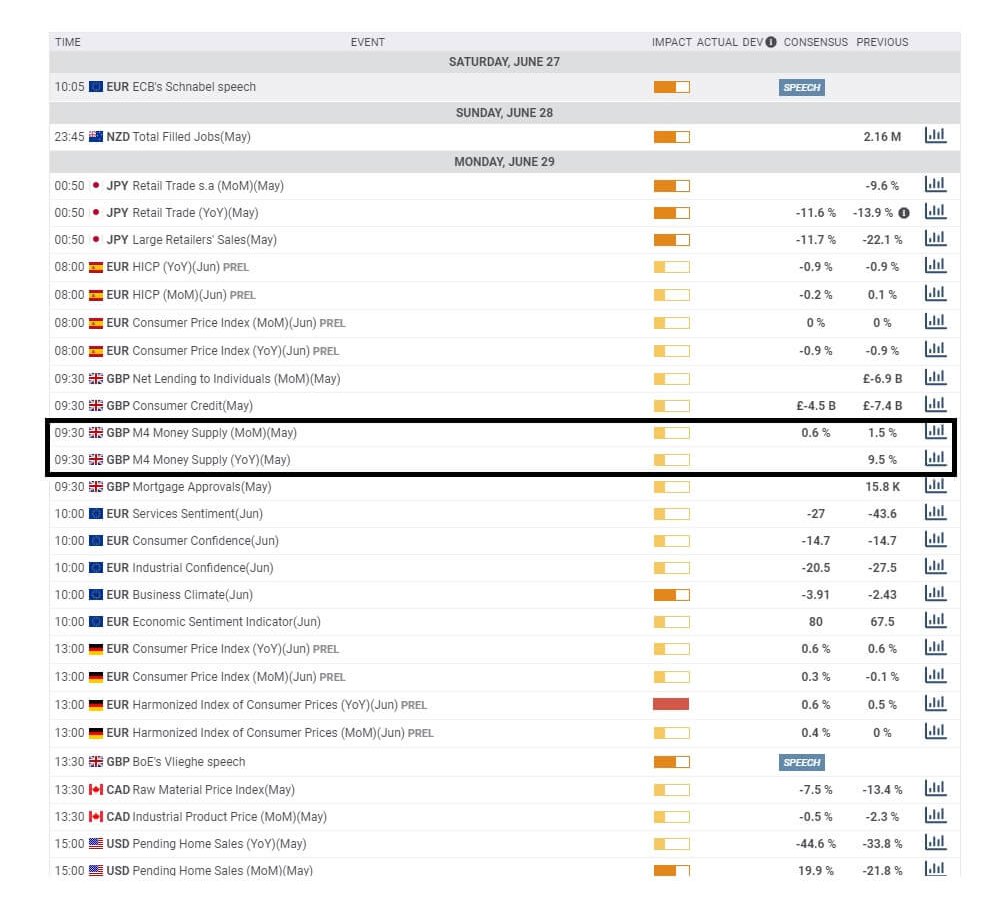
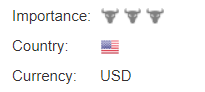
Here we can see that our area of interest today is the eurozone services sentiment for June, which is set to be released at 10 am British Summer Time on Monday the 29th of June.  The impact level is set to low, the consensus value is  – 27,  and the actual figure for the previous month of May was – 43.6.


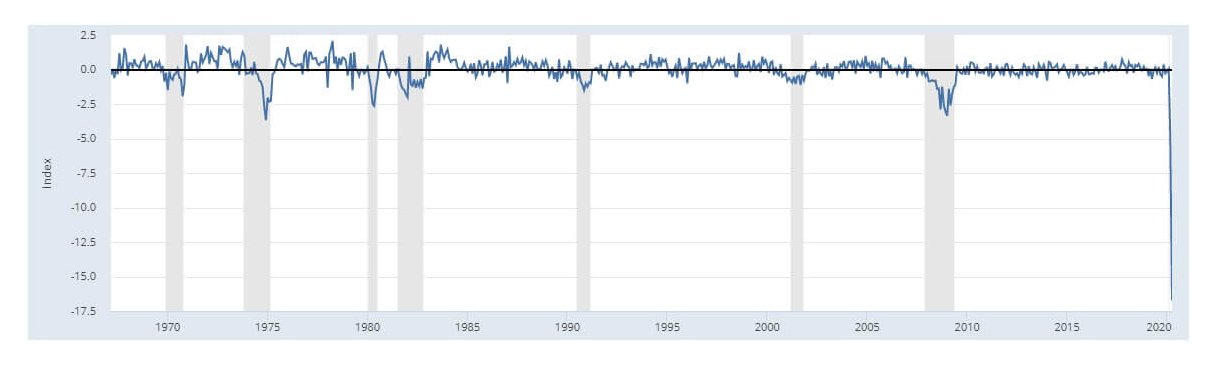
So, what is the eurozone services sentiment indicator? The indicator is calculated on a monthly basis by the European Commission and is seasonally adjusted.
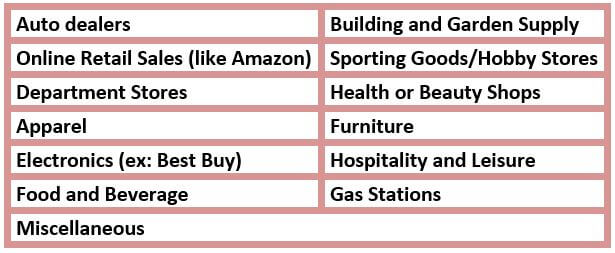
The services sector comprises firms only in-service industries such as: transportation, information, trading and securities, investment, insurance, mortgages, waste management, private healthcare and social assistance, arts, entertainment, etc.

A sample of 18000 companies across the eurozone are surveyed about business conditions for the last three months, and where they are asked three questions:

If business conditions have improved, worsened, or remained the same over the last three months,

If the demand for their services has increased, decreased, or stayed the same over the last three months.

And they are also asked a question about the expected demand for their services in the next three months, and whether they think it is expected to grow, fall or stay at the same level.

Each respondent’s answer is weighted to the relevance of their contribution to their country’s economy and where each country’s response is weighted with regard to their contribution to the Eurozone area.

Let’s just go back to the economic calendar for June, and although the impact of value is set too low, we can see that the previous figure for May was – 43.6, which is incredible, and was obviously this low because of the coronavirus impact.  The consensus value is -27, which is a much greater improvement on the previous month’s figure, and where economists and analysts are predicting a general improvement in this indicator.  Huge deviations from the consensus, especially if the released data is worse than the previous month’s figure, will, in actual fact, cause extreme market volatility.

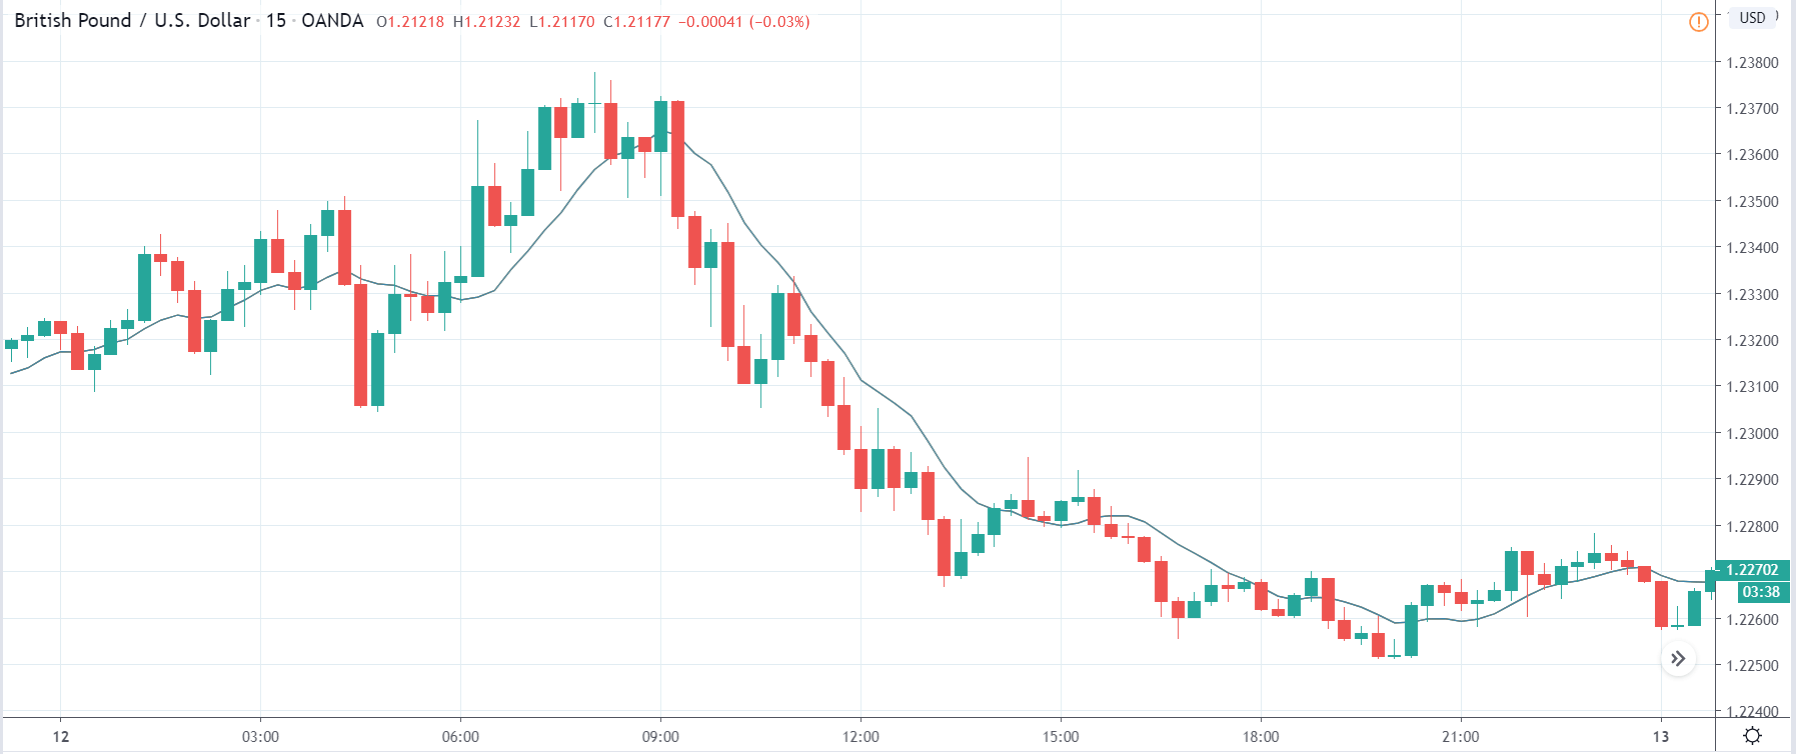
The reason the indicator is is so important is because it tells the market if conditions are improving in the Eurozone area in which case should the figure come out at -27 as per economists’ expectations or even better this would be considered good news for the eurozone and we might expect the euro to gain in exchange rate values against its counterparts.

Should the figure be worse than -27,  this would show that in actual fact conditions in the service sector across the eurozone are not improving and the businesses in this sector have a pessimistic outlook for the next quarter, and this might have a negative impact on the Euro currency which might then fall in exchange rates against its counterparts.

Bear in mind, that if businesses have an optimistic view, they will be employing more people, perhaps borrowing more money to expand their businesses, it also means that the general population is using more services because they have a more optimistic view of the circumstances in the eurozone area as things improve from the virus conditions.  And so there is a huge knock-on effect with regard to jobs, extra demand for services, and a generalized getting back to normal.

The opposite applies should the respondents have a completely negative out view for the next quarter.

Categories
Cryptocurrencies

BitLox Wallet Review: What Are Its Key Features And How Does It Work?

BitLox hardware wallet is perhaps one of the best and most secure crypto wallets available today. It is developed by a Hong Kong-based company, BitLox Limited, and has been around since 2015. It offers incredible features and is capable of safety features like maintaining as much as 100 separate wallet addresses. What’s more, 50 of these wallet addresses are hidden and can only be unlocked by providing a unique PIN for that specific wallet.

But can BitLox compete with the likes of Trezor and Ledger? We provide you with detailed insight into everything you need to know about BitLox in this review. We also look at some of its key features, security, pros, and cons, as well as the supported cryptocurrencies.

Key Features

Cross-platform support: BitLox is capable of supporting several platforms, including Windows, Chrome OS, Android, Mac OS, Android, and iOS. 

Alphanumeric keypad: The device features a fantastic keypad that ensures you enter your PIN securely. An alphanumeric keypad provides you don’t have to tap into the screen display. 

Mnemonic recovery phrase: BitLox provides its users with an option of generating 12, 18, or 24-word phrases. Users can use the phrase to recover their funds or private keys in case their wallet is damaged or lost.

Hidden wallets: The best thing about BitLox is that it is capable of generating several hidden wallets for enhanced protection. It offers users the ability to enter an additional PIN that grants access to hidden wallets and can allow up to 50 hidden wallet addresses in total.

PIN encryption: The device allows users to create a highly sophisticated and more personalized PIN of up to 60 characters. Additionally, unlike the majority of hardware wallets, it is alphanumeric, which also means that it does not use numeric PINs.  

Titanium casing: The hardware comes in a titanium casing, which makes it durable. The company claims that it is “indestructible” and can withstand almost anything.  

Anonymity: The fact that it is a hardware wallet also means that it can be used anonymously. The only thing the device displays is the public address and does not reveal any personal information of the sender or recipient in all their transactions. 

BitLox Security

BitLox prides itself as one of the best crypto wallet companies offering exceptional features. Its ability to integrate top-notch features is, in fact, one of the primary reasons why crypto users choose it over other hardware wallets in the market.

Among some of its top features are the full hierarchical deterministic feature, 24-word mnemonic code, and the BIP39 and BIP32, which can be used to recover the wallet in case it is lost or damaged. What’s more, users are also required to enter the first PIN to unlock the device and the second PIN to open each wallet. 

BitLox has three levels of security. These include:

Level 1

A 4-8 digit PIN and 12-word mnemonic recovery phrases are generated.

Level 2

The 18-word mnemonic is generated, and users can create their PIN containing up to 20 characters. It also features advanced methods such as AEM.

Level 3

A 24-word mnemonic recovery phrase is created. Users are also required to enter a PIN for each transaction. 

How to Set Up BitLox Wallet

Step 1: Power on the device

Boot the device by holding down the power button for about 2 seconds. You might also want to connect it to a USB port to start the initial charging process. 

Step 2: Select your desired language

Once the device is fully charged, you can start your set up process by choosing your ideal language. BitLox supports ten international languages. Ensure you select a familiar type to avoid any setbacks. 

Step 3: Create passwords

Users are required to create passwords depending on three choices. Here is a highlight of some of these choices.

  • Standard– You will be required to create random numeric PINs with lengths between 4 and 8 digits. What’s more, you will need to back up a 12-word mnemonic back up phrase. 
  • Advanced– You are required to set PINs of up to 60 characters alphanumeric and a backup 18-word mnemonic phrase
  • Expert– This level will require the selection of PINs of up to 60 characters and a backup 24-word mnemonic phrase.  

Note that all the above security levels have an anti-device tampering recognition phrase setting that will require users to key in a specific PIN for every transaction. For safety reasons, ensure you write down your passwords in a safe location or PINs that can be easily memorized. 

Step 4: Device formatting 

At this point, the device will automatically format the storage area to prepare the device for use. Wait for the process to complete before you can proceed to the next step.

Step 5: Wallet setup

You will be prompted to enter your initial PIN based on the level of security you chose. Notably, if you don’t want to create a new wallet automatically, you can skip the process by pressing X until the process is canceled. 

Step 6: Set your wallet PIN

If you choose to create a wallet automatically, you will be prompted to set a new PIN for your wallet. 

Step 7: Backup mnemonic phrase 

After going through all the above steps, you will see a backup mnemonic screen. Ensure you write down the phrase and store it in different places to avoid losing it. 

Step 8: Complete setup 

Complete the setup by downloading the mobile app from the official website. You will be required to scan the QR code on the device to connect it with your mobile app. 

How to Send Funds from Your Wallet

Once the device is connected to your mobile app, you will be provided with a list of wallet addresses to add to your device. Choose your desired wallet and follow the prompts. What’s more, if you want to access a hidden wallet, you will be required to make a direct entry to the wallet number and enter the required PIN. 

After doing so, you can now choose the “send” option and enter the recipient’s address. You might also want to adjust the fee to at least 0.0001. This will help to expedite the process. Tap “SEND” on your mobile and click “DONE” when the sending process is complete. You will have successfully sent funds to your desired address with the highest form of security. 

How to Receive Funds

Receiving funds on your BitLox wallet is quite easy. All you need to do is click on the “RECEIVE” button to display the QR code and tap “share” to send the code to other people. In case you might need additional addresses, you can create a new one, but only after using the previous. Note that the device is designed to continue displaying the QR code even after the device is switched off as the e-paper screen does not use power. 

Supported Cryptocurrencies

BitLox specializes in storing only one type of cryptocurrency – Bitcoin. Even so, they have indicated on their website that they might be looking to add altcoin support and Ethereum. 

Customer Care 

Customer care support at BitLox can be reached through email and by phone, which is very impressive for cryptocurrency-related companies. Additionally, they offer a detailed user guide and recordings about setting up and utilizing the wallet. 

These recordings can be heard clearly, and you will find them to be quite helpful. What’s more, the guides will take you through setting up the wallet, how to use different exchanges on the site, and how to start using your wallet. 

Also, if you can’t break through to anybody on email or the telephone number provided, you can connect with them directly via their dedicated live chat. It also runs a Twitter and Facebook account. Its timely customer care response is among some of the critical things that make BitLox a reliable platform. 

Pros and Cons of BitLox

Pros

  • Powerless E-paper display continues to display addresses even when turned off
  • German menu
  • Titanium casing
  • Provides absolute anonymity
  • Full keyboard
  • Compatible with multiple platforms

Cons

  • Supports bitcoins only

Final Verdict: Is BitLox Security Worth Your Money?

If you are looking for a crypto hardware wallet that will guarantee top-notch security for your funds, you should try out BitLox. It is not only capable of encrypting all your transactions but also provides users with a simple and easy-to-use method of sending or receiving funds. It also offers quite a wide range of exceptional features. The only downside is that it only supports one type of cryptocurrency. Try it out, and there is no doubt that you will experience positive results.  

Categories
Forex Chart Basics Forex Daily Topic

Trading the Double Top and Double Bottom Pattern

Introduction

In our previous articles, we had reviewed several technical formations that render signals for potential market-entry setups in a trend reversal context or trend continuation.

In this educational article, we will review the characteristics of the double top and double bottom pattern.

The Nature of Double Top and Bottom

The double top and double top formations are the most popular trend reversal technical patterns in financial markets. These patterns characterize themselves by developing an internal “M” and “W” structures on double tops and double bottoms respectively.

Considering the fractal nature of financial markets, the technical trader can detect these formations in any timeframe, from intraday chart to monthly range. 

The double top formation tends to be tough to identify, especially if the second peak is higher than the first one. This situation occurs because the technical trader could be waiting for the uptrend continuation or a bullish trap.

The Setup Rules

The price action will generate an entry signal if the price breaks and closes below (or above) the swing between both peaks (or valleys), as shown in the following figure.

The stop-loss order will take place above the last high (or low); this distance between the entry-level and the previous top (or bottom) is known as the swing size, as illustrated in the last figure. 

The double top/bottom pattern holds an easy way to identify the profit target level. The technical rule says that if the swing size is 50 pips, the profit target will locate at 50 pips from the entry-level.

The Behavior of the Double Top and Bottom Formation

Thomas Bulkowski, in his “Encyclopedia of Chart Patterns,” described the performance of double top and bottom considering some shape variations as a rounded peak or a spike. 

In general, Bulkowski reveals that on average, the break-even and failure rate of the double top pattern is 11.5%, while the percentage of break-even and failure of double bottom is 6.5%. However, the double top formation tends to reach its price target 71.5%, while the double bottom tends to strike its target 51.25% of times.

Bulkowski summarizes its finds stating that some variations of double top and bottom patterns with a narrow range perform better than those that show a wide one.

Conclusions

In this educational article, we reviewed the essential reversal formation known as the double top and double bottom pattern. The setup studied provides the technical trader a one to tone risk to reward ratio, which could be increased as the trade advances in favor of the trend.

In the next article, we’ll review the use of Fibonacci tools as retracements and extensions to identify trade opportunities.

Suggested Readings

  • Fischer, R., Fischer J.; Candlesticks, Fibonacci, and Chart Patterns Trading Tools; John Wiley & Sons; 1st Edition (2003).
  • Bulkowski, T.; Encyclopedia of Chart Patterns; John Wiley & Sons; 2nd Edition (2005).
Categories
Cryptocurrencies

D’CENT Wallet In-Depth Review: Is It a Safe Wallet or a Scam?

D’CENT is perhaps the only crypto wallet hardware with biometric security. Since its invention six years ago, the hardware wallet has managed to gain recognition as one of the safest and simplest ways to store cryptocurrencies. Although the industry is dominated by some of the earliest crypto technology companies like Trezor and Ledger, D’CENT integrates quite a good number of unique features.

In addition to being one of the best cryptocurrency wallets in the market, what are some of the top features that make it stand out from the crowd? Read on as this review seeks to provide you with detailed insight into some of the key features, pros and cons, security features, and how it compares to other popular wallets in the market. However, before we go into detail, let’s first find out some of the top key features.

Key Features

Built-in fingerprint reader: The hardware is designed with a fingerprint scanner to provide full security for your wallet as well as make your transactions easier and faster.

OLED display: D’CENT features a 128 x 128 pixels display screen, which is large enough to provide users with a comfortable view of their transactions.

Four scroll buttons: For easy navigation, the device comes with four scroll-wheel buttons to allow users to scroll up, down, and sideways. 

PIN code and biometric authentication: The wallet can be accessed via biometric authentication or PIN. 

Bank-grade EAL5: D’CENT is designed with multi-IC architecture and a bank-grade EAL5 for optimum security.

Security chips: It comes with secure wallet chips that will not expose your private keys to external applications.

Bluetooth connectivity: The device supports Bluetooth connectivity for a secure connection and low energy consumption to your mobile device. Users can connect their wallets to other personal computers through the USB connection. 

Hardware Wallet Security 

D’CENT hardware wallet is perhaps one of the best hardware wallets that offer top-notch security. It comes with multiple levels of security, which makes it almost impossible to infiltrate. Despite being one of the latest in the market, it is also one of the first to offer biometric authentication. What’s more, it can also be accessed via PIN code and integrates such features as two-factor verification. 

D’CENT hardware wallet is also certified as EAL5+, which means that it offers the highest level of security against any online penetration. Notably, this is also the same kind of security integrated into such hardware wallets as Ledger Nano X, which is used in securing credit and debit cards. It also uses a state-of-the-art multi-IC architecture that combines a custom-designed operating system to protect against conceivable attacks like keyloggers, backdoors, and spyware. 

Design and Build

D’CENT is specially designed in a unique way than the majority of popular hardware wallets. One of the unique features that make it stand out from the crowd is its fingerprint reader. It is among the best biometric wallets that integrate a form factor that is reminiscent of a portable media player.

Besides, it features a 1.1 inch OLED display (128×128 pixel resolutions) and a micro USB port. It is also quite easy to interact with the device. Besides the power button and the central fingerprint, you only need to utilize the circular control bar with four control buttons to operate the gadget. Weighing 36 kg and measuring 43.2mm x 10.8mm, D’CENT is perhaps one of the largest wallets in the market. 

D’CENT is robust and supports a wide range of services, including insurance, government, financial services, and also facilitates a myriad of P2P transactions. The wallet has also received positive feedback from its customers. Its impressive QR code, Bluetooth connectivity, and biometric verification are among the key things that have significantly contributed to its success. 

D’CENT Unboxing

D’CENT is specially designed with a shrink-wrapped box, a short micro USB cable, a D’CENT hardware wallet device, a user guide, a recovery metal plate, and a getting started card. The recovery card is used to store your 24-word recovery seed.

D’CENT: Getting Started 

Setting up the device is quite easy and will probably take a few minutes. What’s more, it doesn’t require the use of a mobile phone. You are only required to press the power button down to power on the device for one or two seconds and select your desired language – either Chinese, Japanese, Korean, or English. After confirming with the OK button, you can go ahead and select the “create wallet” option to set up a new digit pin. 

You will be asked to scan your finger several times to confirm the biometric security feature. Next, you will be provided with the 24-word recovery phrase that you’ll need to record and keep safe. This will be important in case you need to recover your wallet in case you lose or break your D’CENT wallet device. 

The last option will require you to back up the recovery seed. Confirm that you have entered the right details before going to the next step. After doing so, your device will be ready for use. In order to start managing your cryptocurrencies or performing any transactions, you will need to download their official mobile app from iOS or Google Play Store. 

Note that you should ensure to write down the recovery seeds or the mnemonic codes to avoid losing funds from your wallet in case the device is damaged or lost. The best way to preserve it is to write it down and keep it in a safe place. 

Synchronizing biometric wallet with your mobile app

The best thing about D’CENT is that once the device is connected to your mobile app, synchronization starts almost immediately. To set up your Android device to function with your hardware wallet, you are required to connect with USB or Bluetooth. To pair the two devices with Bluetooth, ensure you turn on the Android device’s Bluetooth and scan for the device. 

You should find the device’s name on your mobile phone. Once they have been successfully paired, you will be good to go. To connect the device with OTG, you will need to enable the OTG function on your device and use USB storage to connect. You will receive a notification on your device that it has successfully connected.

Note that when the synchronization is complete, you should notice the Bluetooth icon on the upper right corner of the screen on the mobile app. What’s more, ensure the Bluetooth LED stays on to avoid interrupting the connection. In case the synchronization process does not begin automatically, try turning on and off your device and start over the synchronization process all over again. 

D’CENT Hardware Wallet Pros and Cons

Pros

  • It is easy to use
  • Supports multiple cryptocurrencies
  • Huge display
  • Fast recovery of lost or stolen data
  • It is easy to generate private keys
  • Its Bluetooth connectivity enables the device to consume less energy
  • Comes with a 585 Ma durable battery 
  • Offers secure and secure firmware updates
  • Supports multiple wallets
  • The wallet is secured by biometric authentications and a PIN

Cons

  • Supports fewer cryptocurrencies compared to other wallets

How Does D’CENT Compare to Other Hardware Wallets?

Compared to the majority of hardware wallets in the market, its biometric features ensure it stands out as one of the best cryptocurrency wallets in the market. However, its Bluetooth and OTG support function makes it vulnerable to hacking and online attacks from other networks.

Some of the hardware wallets such as Cobo Vault offer more reliable security due to their ability to restrict external connections. The only downside of D’CENT is that there are other devices that offer better features such as NFC and touchscreen functions. 

Final Verdict: Is D’CENT Wallet Worth Your Money?

D’CENT is considered one of the best options for anyone looking for a safe and straightforward way to conduct crypto transactions. It integrates an amazing design, top-notch security features, and quite a variety of cryptocurrencies. Additionally, one of the best things about D’CENT is that it uses state-of-the-art Multi-IC architecture that combines a custom-designed operating system with a Secure Element (SE).    

Categories
Forex Chart Basics

How to Guess Support/Resistance Level Well Ahead?

In today’s example, we are going to demonstrate an example of a fundamental character of support/resistance. We know the importance of support/resistance in trading. Thus, if we get a clue about spotting support/resistance well ahead, it comes out handy. Let us find out whether it is possible or not.

This is a daily chart. The chart shows that the price heads towards the North with good bullish momentum. It makes bearish correction and keeps resuming its bullish journey. With naked eyes, we see that the price finds its support at three points. Let us investigate the chart with some drawings on it.

We have spotted out three points where the price gets rejection twice. When the price makes a bullish move, at its second wave, it finds its support at the third arrowed point. It works with a simple equation. Can you guess what that is?

Let us draw a line. We see that the price gets rejection at the same level twice. It means it is a level of resistance when the price is bearish. The price breaches the level later and finds its support at the same level. It produces a bullish reversal candle and heads towards the North. Once the price makes a bullish breakout, the buyers shall wait for the price to make a bearish correction. If the level produces a bullish reversal candle, the pair may head towards the North by offering a long entry. This is what happens here. Let us see the same chart by zooming out.

This is the same chart. We have spotted out two significant points and spotted them with two arrows. I assume this time you guess what I am going to say. Yes, the price makes a bullish breakout and finds its support at the breakout level. This is the level, which is a level of resistance in this chart. Since it gets broken and the chart produces a bullish reversal candle, the buyers may go long in the pair again. Let us draw a line here.

See how the price reacts here. Upon producing a Morning Star, the price heads towards the North with good bullish momentum. The price makes even a stronger move this time.

The plan of a buyer should be eyeing on the level to get a bullish reversal candle where the price finds its resistance when it is bearish and vice versa. This makes traders’ life easy, and in the end, it helps them make a better trading decision.

Categories
Forex Basic Strategies

Trading The Rapid Fire Strategy – A Reliable Scalping Technique

Introduction

In recent times, the scalping style of trading has gained a lot of attraction from all types of traders. These strategies are characterized by high-volume trading, which is designed to enter the market frequently to make just a few pips.

Most scalping strategies are built using indicators that can make it extremely tough for beginners who are new to the markets. This is one of the reasons why scalping is not recommended for new traders. Whichever scalping strategy we use, we need to make sure that the broker’s platform allows us to employ the strategy on the lowest time frames.

The two scalping techniques we will be discussing are – Rapid-fire and Piranha. These strategies are developed on the 1 minute and 5 minutes time frame charts, respectively. These two time-frames provide ample opportunities to enter in and out of the market several times a day.

Although scalping can be exciting, it can lead to fatigue and loss of concentration due to constant monitoring of the markets. Therefore, besides just knowing about the strategy, one should meditate and learn to be away from the markets when not required. Overtrading does not profit all the time.

The rapid-fire strategy has two basic requirements:

Highly liquid currency pair | Lower timeframe

This criterion led to the development of the strategy on the 1-minute time frame chart using the EUR/USD currency pair. With this strategy, one can find around 30 to 40 trading opportunities every day.

Time Frame

The rapid-fire strategy works well with the 1 minute and even 2 minutes time frame charts, where each candlestick represents one minute of price movement.

Indicators

We use two indicators for the rapid-fire strategy with the following settings.

  1. Parabolic SAR – Step size 0.02 | Maximum 0.2
  2. A simple moving average (SMA) with period 50 and apply to close.

Currency Pairs

The strategy is designed specifically for most liquid currency pairs as EUR/USD, GBP/USD, USD/JPY, and a few others. However, the EUR/USD pair is the most preferred pair for the strategy.

Strategy Concept

The rapid-fire is basically a trend trading strategy. So, we will be applying the strategy on the pullback of a major trend. The strategy combines two trend indicators, SMA 60 and Parabolic SAR, with the appropriate setting. The SMA is used to identify the major trend of the market. This means we look to buy the currency pair when the price is above the SMA, and similarly, we look to short the pair when the below the SMA.

The Parabolic SAR is used to give the exact entry signal after identifying the market direction and pattern. Once we identify the direction, when the price moves above or below the parabolic SAR, we take a trade based on the current position of the price. Let us understand this in detail.

Trade Setup

In order to explain the step by step procedure of the strategy, we have considered the EUR/USD currency pair where we will be applying the strategy on the 1-minute time frame chart. It is advised not to switch to a time frame any lower than 1 minute as it is very hectic.

Step 1

Since it is a trend trading strategy, the first step is to identify the major trend of the market and wait for a retracement. If the retracement comes close to the SMA, it is the ideal case of a pullback. The longer the price remains above or below the SMA, the stronger is the trend.

In our example, we see the market is in an uptrend, as shown in the below image, where the price is well above the SMA for a long time.

Step 2

We can see that there are two dotted lines of the parabolic SAR, an upper one, and another is the lower. The next and most crucial step of the strategy is looking for the entry signal. In case of an uptrend, when the price retracement comes in from the highest point, the price is below the parabolic SAR, which means the price is still in its retracement frame. When the price goes above the upper dotted line of the parabolic SAR, it signals a continuation of the trend, and we enter right at the close of the candle above the SAR.

In the below image, we can see how the price crosses the parabolic SAR and signals an upward price movement.

Step 3

This is the final step of the strategy, where we determine our take-profit and stop-loss levels for the strategy. The stop loss is placed below the previous ‘low,’ or in some cases below the second previous low if the previous low is too close. In case of a downtrend, it is above the previous ‘high.’ As the stop loss is not too big, the risk to reward ratio is more than 1 for this strategy. The take-profit is set at 15-20 pips above or below the entry price, depending on ‘long’ or ‘short’ position.

In our case, the risk to reward of the trade was 1.5, where the market moves further above the take-profit point. Since we are trading with the trend, the trade has the potential to move much further, and thus, one can use trailing stop loss to maximize the gains.

Strategy Roundup

The rapid-fire strategy could also give another entry signal during the course of current trade. It is common to encounter consecutive trade signals one after the other, simply because of the low time frame being used. However, it requires a lot of practice before one can spot them. One should know how to manage the trades, especially when the setups come in fast and furious. The rapid-fire strategy works best in trading markets, which requires quick thinking and swift reactions.

Categories
Crypto Videos

SK Telecom Thinks Blockchain Can Revolutionise Phone Insurance!


SK Telecom Thinks Blockchain Can Revolutionize the Phone Insurance Industry

South Korean telecommunications company, SK Telecom, made an announcement of a blockchain-based document submission process for their mobile phone insurance. This new protocol is an improvement to the company’s current antiquated paper-processing methods.
Until now, users had to visit a technical repair office in order to receive insurance benefits for their damaged phones. Successful visits would be concluded with a claim receipt, which they would then have to forward via email to the insurance company. The new protocol, which lies on the blockchain, will greatly improve how this system operates.

SK Telecom’s new system allows its customers to skip this outdated process and complete everything they wanted online, quickly and securely.

The announcement SK Telecom made states that replacing paperwork with electronic certificates will be used to help the company to safely and securely manage inquiries sent to the insurance companies. They also hope that the blockchain-powered new method will help with the prevention of document forgery.

Blockchain saving money and improving performance

SK Telecom expects this method to ensure fewer costs for mobile phone service centers as well as insurance companies, as well as to improve processing speed, allowing them to handle customer complaints in a more timely manner.
The company states that Samsung’s Galaxy series will be the first phone fully compatible with the new service.

Kim Seong-soo, SK Telecom’s sales manager, even said that the adoption of Blockchain technology will certainly expand to “various service areas in the future.”

Categories
Forex Videos

Fundamental Analysis For Novices – Money Supply!

Fundamental Analysis For Novices – Money Supply  


Thank you for joining our educational video four fundamental analysis for novices. In this video, we will be looking at Money Supply as an economic indicator.


Successful traders use economic calendars to tell them when governments are due to release statistics regarding the health of that particular nation’s economy.  Such data release information can be found on an economic calendar such as this one.  The majority of brokers provide an economic calendar, and you should refer to it every day in order to avoid trading around times of possible extra market volatility surrounding the release of high impact economic data.

The critical components of an economic calendar are the day, date and time, the actual event, the likely impact of the data, the actual data upon release, the previous data for comparison, and a market consensus of what the likely figure will be.

Here we can see that on Monday, June 29th at 9:30 BST Great Britain will release is M4 money supply data for May and also the year on year update, and where the economic impact is considered to be low.

All countries pay particular attention to money supply, but in the UK, the M4 Money supply data Is released by the Bank of England. Basically, it is an indicator that tells the market how much sterling is in circulation, in both notes, coins as well as money held in bank accounts.

Typically, more money in the system usually reflects lower interest rates and where this might generate more investment while increasing the amount of money in consumers’ bank accounts, which thereby stimulates spending.

Intern businesses will buy more materials to increase production for consumers’ needs, and this increased business activity might also have an effect on the labour market, which might see more employment during such times.

The opposite would apply if money supply falls, which could be a reflection on economic growth rates.
There are various types of money supply levels from M0, M1, M2, M3, and M4. And you might hear terms such as broad money supply, Narrow money, I’m very in degree as to the type and size of a council in which the monies and coins are kept.

Money supply data is published periodically by the country’s Central Bank or the Federal Reserve as in the United States, and where they release the pertaining data on a weekly and monthly basis. Their respective treasuries issue paper and coin currency depending on their requirements, which will change from time to time, depending on economic circumstances.  For example, during the economic crisis brought on by the coronavirus, central banks have issued more money into their economies for banks to hold on reserve in order to extend credit.

M4 is the bank of England’s main measure of money supply and would be a comparison of M3 measures in many other countries. The Bank of England does not set a target for money supply. However, the monetary data does throw lights on the incremental outlook for inflation, and because government’s do usually have targets for inflation M4 money supply does play a significant aspect in the UK economy. At the moment the British government, like most, is extremely active in providing stimulus to shore up the British economy from the effects of the coronavirus, this stimulus, or quantitative easing as it is known, is a policy aimed at boosting money supply.

Although the M4 money supply data will not usually be a market-moving indicator, it is important that traders keep tabs on all governments’ money supply data, and quantitative easing in particular, in order to gauge what each country’s government is doing in this area.

Categories
Crypto Guides

What Are The Different Business Models Based On Blockchain Technology?

Introduction

With the invention of bitcoin, Blockchain has become mainstream. Industry experts in almost all industries are exploring Blockchain to change their business models to make use of decentralization to achieve more transparency, thereby gaining more profits. The business model is nothing but how the business is operated to make money ultimately.

With features like immutability, transparency, and decentralization, Blockchain can create ripples in any industry that haven’t seen much change for some decades. Blockchain’s mainstream application has been in finance, which has seen rapid changes though Blockchain hasn’t been implemented to a considerable extent yet.

Implementing Blockchain isn’t an easy task. Hence, one should consider all the available technologies first and implement Blockchain only if any other current technology doesn’t make the same impact of Blockchain if implemented. The technology shouldn’t be useful not only for the business but for the end-users as well.

Let us look at some of the blockchain business models below:

Blockchain as a Service (BaaS)

The days are gone where the businesses try to host everything on their own. Investing in large servers, hiring staff to maintain them is a costly process, and no one wants to do it anymore unless they have large amounts of money to burn. Hence everyone wants to move to the cloud. When it comes to Blockchain, if one has to set up a blockchain network, they must search for blockchain experts who are rare and costly to obtain the talent, if any.

Train your existing staff, which is again time-consuming; hence BaaS plays a vital role in implementing Blockchain in any business. Blockchain as a Service is also provided by cloud providers where a lot of scary backend stuff can be set up and maintained by them while the business can only focus on their business. Large cloud providers like AWS, Microsoft Azure, IBM, Oracle are already offering BaaS services.

Securities

Securities is one of the exact innovational models which didn’t exist before Blockchain. Security tokens offer ownership of an asset. A token can be classified as a security token if a profit is expected from the primary asset linked to the digital asset.

For example, a piece of gold bar say 1kg can be owned by multiple people in the form of security tokens as the price of the gold increases the value of the security token increases and vice versa. If the ICO of such tokens is adequately implemented with all the rules abided, the security tokens have immense opportunities.

Utility Tokens

Whenever we buy some material things, we look at the utility of the material to gauge our satisfaction. Utility tokens do the same thing in the businesses they use. Each utility tokens have a purpose, role, and features in the environment they are used to. In our articles, we have seen DAO’s, which can be accumulated to deserve the voting rights for the DAPPs to be developed.

DAO’s are a perfect example of Utility tokens. Ripple acts as a utility token in the banks involved with the Ripple ecosystem. The tokens can be used as a currency as well in the confined environment. The value of the utility tokens increases depending on the number of roles and purposes it has in the intended environment.

Development Platforms

Development platforms like Ethereum, Hyperledger, Tron play a vital role in the augmentation of blockchain technology. The development of DAPPs on these platforms is secure in implementing the technology as, by default, they offer Blockchain’s fundamental properties. The more DAPP’s in the network, the more influential the platform will be as more people will be using the same.

The deployment of DAPPs in the Ethereum platform needs the payment in terms of Gas, the platform’s local currency, which allows one to use it. In the same way, to use the Neo platform, users have to pay in Gas, the platform’s local currency. Even the DAPPs may collect a nominal fee in terms of Gas again to use the apps, thus improving the functionality continuously.

Categories
Forex Fundamental Analysis

‘GDP From Manufacturing’ – Understanding The Macro Economic Indicator & Its Impact

Introduction

GDP from Manufacturing is significant for many developing economies. It is their primary driver for economic growth to improve the standard of living and generate wealth. Manufacturing Sector has supported a large share of jobs in the economy. 

Manufacturing Sector has helped many economies to come out of underdeveloped status to developing nation status. Hence, understanding GDP from Manufacturing has varying significance in different countries is suitable for macroeconomic view in the international markets.

What is the GDP from Manufacturing?

Gross Domestic Product

GDP is a basic measure of a country’s total economic output. It is the total monetary value of all the goods and services produced within the country regardless of citizenship (resident or foreign national).

It is the market value of all the finished goods and services within a nation’s geographical borders for a given period. The period is generally a quarter (3 months) or a year. The commonly used term “size of the economy” refers to this economic indicator. The USA has the world’s largest economy, and it means it has the highest nominal GDP or highest economic output.

Manufacturing

It is producing goods for use or sale labor, processing equipment, or machinery. It is a process that could be physical, chemical, or mechanical. The manufacturing sector mainly uses raw materials to make finished goods for consumption by end customers or intermediate goods for other manufacturing industries. For example, a car Manufacturing company could import raw iron ore metal, and process it to produce metal car body parts.

In the lifecycle of a finished good, the Manufacturing comes in as the second stage in the supply chain right after the source of raw materials. The manufacturing sector includes plants, factories, mills, and generally use power-driven machinery in their process. The manufacturing sector can also include small businesses, or home startups like bakeries, candy stores, or custom tailors, etc.

How can the GDP from Manufacturing numbers be used for analysis?

Manufacturing is an essential component of GDP. In the United States, it contributed 11.6% of total GDP. Manufactured products make up half of the total United States exports. In the United States alone, the Manufacturing Sector has 12.85 million jobs, about 8.5% of the total workforce. The importance of the Manufacturing Sector is evident from the rapidly developing economies like China, Japan, and India. 

The industrialization has been the main propellent for economic growth in these countries that put them back on the map. With export-led growth, China has primarily used Manufacturing Sectors to achieve growth rates of 10% and above to catch up with the advanced economies like the United Kingdom, and the United States. Manufacturing Sector is a labor-intensive sector, and it requires skilled labor. Despite the advent of modern technologies, equipment, and automated machinery, it still requires skilled laborers to fill the gaps.

Developing economies do not have a competitive edge over the developed economies in the services sector. But they do have the advantage in the Manufacturing and Industrial Sectors due to the availability of cheap labor. The low costs associated with a low standard of living and maintenance attracts business to establish their production centers in such countries. For example, an autoworker in Detroit makes 58 dollars an hour compared to 8 dollars in Mexico.

With an improved standard of living in developed economies like the United States, the cost of labor is high in comparison. It is the primary reason for the decline in the Manufacturing Sector growth in the developed economies for over two decades, paired with rapid growth in developing economies during the same period. 

With many developed economies transitioning more into the services sector, the Manufacturing Sector has lost its fair share in developed economies while developing ones like China have significantly increased their Manufacturing Industry production levels. 

About Thirty percent of the GDP of China comes from the Manufacturing Sector alone. Hence, we can understand that the Manufacturing Sector is the primary source of growth for many developing countries. The above plot shows the increase in Manufacturing Production in China. It is steady and steep growth. The vertical axis is plotted in CNY HML (Chinese Yuan Hundred Millions).

As the countries develop, they start to get involved in the Service sector by investing the wealth generated from the Manufacturing Sector to come on par with developed economies and establish a total equilibrium. But there is a long way to go before all developing economies become developed.

Impact on Currency

The GDP from Manufacturing in itself is not a high impact indicator, as the broader measures like Real GDP and GDP Growth Rates are more important for the Currency Markets. GDP from Manufacturing does not paint the full picture of the economy. It can be an essential tool for the Central Authorities to keep track of Manufacturing Sector performance and its implications to the economy.

As established, the Manufacturing Sector is a significant contributor to economic growth for developing economies. Hence, changes in this sector widely affect the overall economic health, and all the dependent industries therein. It is a proportional and lagging indicator. Higher GDP from Manufacturing is good for the economy and its currency, and vice-versa.

Economic Reports

For the United States, the Bureau of Economic Analysis releases quarterly GDP figures on its official website every quarter. The release schedule is already mentioned on the website and is generally released one month after the quarter ends.

In the full report, we can extract the GDP from Manufacturing figures. We can also go through GDP by Industry to get the Manufacturing Industry performance in the report. The World Bank actively maintains track of GDP by Sector figures of most countries on its official website.

Sources of GDP from Manufacturing

For the United States, the BEA reports are available below: 

World Bank also maintains the Manufacturing Sector’s contribution as a percentage of GDP on its official website, as given below for reference. ‘GDP From Manufacturing’ of various economies can be found here.

Impact of the ‘GDP from Manufacturing’ news release on the price charts

The manufacturing sector is crucial for the development of a country. The growth of machinery output and technological improvements are the main drivers of economic growth. The service sector, too, is dependent on most of the manufactured goods. Manufacturing also revives the economy by creating tens of millions of new jobs, eradicating recession.

Therefore, the manufacturing sector contributes a significant part of the GDP of a country. When we drill down to the fundamental analysis of the currency, investors do not look at the manufacturing sector’s contribution alone but consider the distinct GDP as the leading indicator of economic growth.

For example, we will be analyzing the influence of GDP on various currency pairs and see the impact it makes on the value of a currency. The below image displays the previous and latest GDP in the United Kingdom released in May, where we see a significant drop in the GDP compared to the previous month. Let us find out if the market reacts positively or negatively to the news release.  

GBP/USD | Before the announcement:

We shall start our analysis with the GBP/USD currency pair, where the above image shows the properties of the pair before the news announcement. We can see in the above image that the market is in a downtrend, and recently the price has been moving within a ‘range.’ Since the GDP announcement is a high impact event, we should wait for the news release to clarify the direction of the market.  

GBP/USD | After the announcement:

After the news announcement, we witness a slight amount of volatility in the currency pair where the price initially goes up, and later it closes with a wick on the top. We do not observe the kind of impact that was expected due to the news release may be because the market had already priced in a negative outlook. Since the impact was less, we should look to trade the currency pair based on technical indicators and chart patterns.     

GBP/CAD | Before the announcement:

GBP/CAD | After the announcement:

The above images represent the GBP/CAD currency pair, where we see in the first image that the market seems to be resuming the downtrend after a price retracement to the resistance. Given that the impact of GDP announcement is high, we will look to take a ‘short’ only after confirmation from the market. There is a probability that the market may turn to the upside from this point if the news comes out to be positive for the British Pound.

After the news announcement, we see that the price rises above the moving average, and it closes with some bullishness. Even though the GDP data was fragile, traders bought British Pound and strengthened the currency. One of the reasons could be that the market has factored in the negative expectations, which led to a positive reaction after the news release. One should analyze the pair technically before taking a position in the currency.  

EUR/GBP | Before the announcement:

EUR/GBP | After the announcement:

The above images are of the NZD/GBP currency pair, where we see that the market is in a steady uptrend before the news announcement, signifying the enormous amount of weakness in the British Pound. Ideally, we will be looking to buy the currency pair after a suitable price retracement to the ‘support’ or ‘demand’ area. By the way, we should also not forget that the news release can reverse the trend.

After the news announcement, we see that the market reacts negatively to the news release but positive for the British Pound since it is on the right-hand side of the currency. The volatility slightly increases to the downside, which is evident from bearish ‘news candle.’

That’s about ‘GDP from Manufacturing’ and its influence on the Forex market after its news release. If you have any questions, please let us know in the comments below. Good luck!

Categories
Cryptocurrencies

Corazon Hardware Wallet In-Depth Review

With a price tag of over $1,000 in its Gold model, Corazon is the world’s most expensive hardware wallet. It is because it is built in partnership with Singaporean luxury accessory and Trezor-creator SatoshiLabs. As you may have guessed, Corazon’s functionally is just as the Trezor Model T. It features premium features such as a titanium casing and plenty of top-notch security features. What’s more, while the design of the Trezor Model Ts can be relatively easy to copy, Corazon’s titanium case is almost impossible to imitate. 

But besides its highly secure and fantastic design, how does it compare to other cryptocurrency hardware wallets in the market? What are some of the top features? Read on for an insight into everything you need to know about it in this review. However, before we go into details, let’s first take a peek into some of its top features.

Corazon Key Features

OS compatibility: Corazon is compatible with almost any kind of operating system, including Windows, Android, iOS, macOS, and Linux.

Hierarchical deterministic: It is another way of saying that the wallet can be backed up with seed phrases. They are a series of unique passwords that are mainly aimed at helping users retrieve their funds in case the device is lost or stolen. 

User-friendly: The device integrates an easy-to-use interface that is ideal for both beginners and experts. 

Open source: Corazon is open-source, which also means that it is available for anyone to use or suggest changes, which makes it the safest and easy to trust cryptocurrency hardware wallet. 

Multi-currency: The device supports over 700 cryptocurrencies. These include but aren’t limited to Ethereum, Bitcoin, Litecoin, Monero, ZCash, Cardano, Ripple’s XRP, Tether, Tezos, and all ERC-20 tokens. 

Titanium case: Corazon is housed in an aerospace-grade titanium case assembled by GRAY® and CNC machine. 

Password protected: In order to access the device, users are required to use a PIN to be granted access.

Duress passwords: Corazon hardware wallet is specially designed with a unique feature that allows users to set up hidden sub-wallets that can be accessed using one-time passwords.

Corazon Security

Designed the manufacturers of Trezor, Corazon integrates one of the best security features in the crypto world. The wallet has an unbroken security record. Just like Trezor, Corazon has no confirmed cases of hacks or any practical attack. It integrates several unique security features such as a titanium casing that is more durable than Trezor’s. Among other security features include hierarchical deterministic settings that allow users to back up their seed phrases.

These phrases can be used to retrieve funds in the event users forget or lose their passwords. Additionally, Corazon provides its customers with a duress password that can be used to open hidden sub-wallets. All you have to do is activate the feature during set up. The device is also open-sourced, which means that it is made available to everyone, and users can suggest changes, which also contributes to making it one of the safest crypto wallets in the market.

Unboxing the Crypto Device

As the world’s most expensive cryptocurrency hardware, Corazon’s packaging is premium. First off, the box is sealed with two tamper-proof features that are “government-issued” and is quite clean. The device is also sleek and minimalistic. It has a unique titanium-case design, which carries over to the box’s contents. Under the foam piece are crypto-related documentation and a recovery seed card used to record the back up to their private keys.

Under that is a relatively long USBC-to-USB cord. Notably, the codes seemingly look a lot better than the majority of Amazon’s. Overall, the company has ensured it has lived up to its long reputation is building stellar aesthetics and high-end product designs. The device’s physicality is, without a doubt, phenomenal. Besides the material used in its design, it has a subtle finish, brushed texture, and a lovely space grey color. 

Set up and Configuration

Setting up the device is quite simple. All you are required to do is follow the prompts. Below is a detailed guide on how to go about it:

Step 1: Visit trezor.io

Type trezor.io in your browser and select the Trezor Model T product

Step 2: Install Trezor Bridge and follow the prompts 

Here, you will be required to follow the prompts on your browser to install Trezor Bridge. 

Step 3: Install the system firmware

Plugin the device into your computer and install the firmware. After doing so, unplug the Corazon device and re-plug it in after installation. Refresh the site, and you will see a welcome message.

Step 4: Create a new account

After the welcome message, you will either be prompted to create a new account or back up your account. In this case, let us choose to create a new account.

Step 5: Create your backup

Immediately after creating your new account, you will be prompted to create a backup. It is imperative to ensure you have the backup to be assured safety if you lose your wallet. 

Step 6: Write down the backup

Here, you are required to write down the backup phrase as they appear on the app. You can use the swipe button to bring up the next. Ensure you right down the right words to avoid inconveniences in the future.

Step 7: Name your device

The best thing about Corazon is that it provides you with the ability to name the device. You can comfortably brand the device with your name or nicknames. 

Step 8: Assign PIN

Here, you will be required to set a PIN that will suit you best. You can use it to access the device whenever you see fit.

How to Use The Device

Here is an insight into how to use the Corazon device:

  1. Start by selecting the cryptocurrency you want to send or receive.
  2. Press “receive” or “send” on the tab on your wallet.
  3. Choose “show full address” to reveal the receiving address when sending funds.
  4. To make a payment, go to send payment and select “send.”
  5. Paste the recipient’s address and input the amount you want to send
  6. You can go ahead and send your desired amount.

Customer Support

Besides the fact that it is one of the most beautifully designed crypto hardware wallets in the market, Corazon offers exceptional customer care support. It integrates a dedicated team of crypto enthusiasts that are mainly aimed at ensuring users get the best out of the platform. You can either contact them via email or live chat 24/7.

Further, their support team also helps their users to verify messages and use their private keys to connect to either their Mycrocrpto or Mytherwallet as their Ethereum network signatory. They also help users exchange currencies directly with the Trezor app. All you need is to contact them via live chat, and you will be guided on the process.

Notably, among some of the partnered crypto exchange companies include Change Now and Changelly. All you need to do is ensure your quoted Bitcoin cash network fee is less than $0.01, and you will be good to go.

How Does Corazon Compare to Other Wallets?

The best and most obvious comparison is Trezor. The device is capable of providing users with the most secure way of keeping your cryptocurrency safe from any online attack. However, that does not mean that Corazon does not integrate all the above features. It goes further and beyond to offer fantastic design and a titanium casing that ensures users are provided with the highest form of security. 

Pros and Cons of Corazon Hardware Wallet

Pros

  • Features a touch-screen LCD 
  • Has a premium built quality
  • Multi-currency
  • Titanium sealed 
  • It has a beautiful design
  • Hierarchy deterministic feature 
  • Military-grade security

Cons

  • Has a high price tag

Final Verdict: Is Titanium Trezor Corazon Worth Your Money?

Based on the above review, there is no doubt that Corazon has proven to be quite an expensive device for anyone looking to invest in a crypto wallet hardware for the first time.

If you are looking for a premium crypto hardware wallet that is capable of guaranteeing top-notch security, you should try out Corazon. Having been manufactured by the Trezor’s team, there is no doubt that you will get the highest protection for your funds. The majority have tried it out and experienced exceptional results, why don’t you try it out and experience it yourself.

Categories
Forex Chart Basics Forex Daily Topic Forex Price-Action Strategies

Spotting Out Support/Resistance is an Art

Support/Resistance levels are one of the most important factors in trading. In today’s lesson, we are going to demonstrate an example of adjustment in determining the support/resistance level.

Forex market gets volatile from time to time. It often produces spikes. Sometimes traders have to count those spikes to determine support/resistance level, and sometimes they do not have to do that. We try to learn when we have to count, and when we do not have to count those.

This is an H1 chart. However, any chart may look like this. If we are to draw support/resistance levels here, we may find out the two most significant points where the price bounces and where it gets a rejection from. Let us proceed to the next chart with those two lines.

Look at the level of drawn support. The price bounces at the level and produces a bullish inside bar. It comes back at the level and bounces twice. At the second bounce, it produces a long lower shadow and heads towards the North. We may skip counting the spike here and draw the level of support at where the price produces a bullish inside bar and bounces twice later.

Look at the level of resistance. This is where we have counted spikes since the price reacts at the level earlier. However, we may have to adjust it later. We will be able to find this out later as far as price action is concerned.

When the price comes back down, it breaches the level of support and produces a good bullish candle. However, there is a gap, and the price goes back within the previous level of support. Thus, we may still consider the drawn level as a significant level of support.

The price heads towards the North and breaches the level of drawn resistance. The price comes back within the drawn level again. The drawn level is still a significant level of resistance since the price reacts to it. However, we have a new highest high, which must be counted.

The price heads towards the South and reacts to the level of drawn support again. Upon producing a bullish inside bar, it heads towards the North again. Here are two questions.

  1. Where would you set your take profit level as a buyer?
  2. Do you have anything else to do here?

As a buyer, you may consider taking your profit at the previously drawn level. Here we have drawn the level of resistance with a little adjustment. Have you noticed it? Yes, this is what you have to do. Spotting out significant points and monitoring price action around them are two most important things to be able to make adjustments with the support/resistance level. To be able to trade accordingly, we often need to do this. Thus, we must learn the art of adjusting the support/resistance level.

Categories
Cryptocurrencies

Coinapult Wallet Review: Features, Pros and Cons, Privacy, and Supported Currencies 

When we talk of crypto wallets with a highly sophisticated security system, Coinapult leads the pack. The wallet was established in 2011 and boasts a team of specialists dedicated to providing crypto enthusiasts with a secure and easy way to send or receive cryptocurrencies. 

In 2015, they teamed up with Crypto Capital, a licensed financial institution, to offer seamless transactions and facilitate the accessibility of Bitcoins across the globe. Headquartered in Panama City, Panama, one of the top features at Coinapult is its security. It integrates SSL-encryption and two-factor authentication, plus their wallets have the multi-signature feature, which significantly enhances its security. 

Coinapult is easy to use and integrates intuitive features such as Tender Wallet Bot (Telegram), which allows users to send funds to other users through the in-app chat. In this Coinwallet crypto wallet guide, we take an in-depth look into its features, pros and cons, privacy, and many more. However, before we get into details, let’s first explore some of its top features. 

Coinapult wallet features

Superb security: Security is the greatest concern at Coinapult. For this reason, the wallet integrates a couple of top-notch features, including enhanced protection from DDoS attackers and SSL encryption. It also features such advanced security features, email reports of logins, and many more.

OS compatibility: Coinapult is also compatible with almost any operating system, including API, Web Interface, Windows, iOS, and Android. All you need to do is install the app. 

Traditional currency support: Unlike the majority of crypto wallets, Coinapult integrates a couple of traditional currencies, including US Dollar (USD) and Euros (EUR).

Security features

Password encryption: Apart from an elastic multi-stage wallet strategy that ensures 80 to 90% of your funds are secure, Coinapult uses an additional password protection mode to secure its users’ funds.  

Cold storage: As an added security measure, users can store their crypto assets or data in a USB-like device in a highly secure offline environment. What’s more, all this data is stored under a multilayered security system under a registered “custodian.”

Offline configuration: The best thing about Coinapult is that its settings can be configured offline. It is possible to configure the most sensitive aspects of your wallet’s security without an internet connection. 

Coinapult Privacy

One of the main reasons why crypto enthusiasts seek the services of Coinapult is because it adheres to privacy. The wallet integrates numerous privacy features such as a 2-factor authentication and a white list option. Plus, 80-90% of their user’s funds are stored offline. 

Moreover, all its transactions are required to pass through an enhanced verification process that requires users to provide their PINs or passwords to access the wallet. Their keys are also stored in an exchange platform to calculate crypto index prices, generate dynamic bidding as well as asking prices depending on transaction classes.  

Supported currencies 

Coinapult prides itself as one of the most popular coins with quite a huge number of currencies in the market. What’s more, it supports both traditional and cryptocurrencies. Below is an insight on some of these coins:

  • Cryptocurrencies supported: Bitcoin (BTC), Litecoin (LTC), Ethereum, DASH, Bitcoin Cash,  and many more. 
  • Traditional currencies: Euros (EUR), US Dollar (USD), Sterling pound (GBP)

In addition to these currencies, Coinapult also offers Gold and Silver commodities trading. 

Setting up the Coinapult wallet

Coinapult maintains one the easiest and fastest method to transfer, send, and accept Bitcoin payments. Below is a detailed guide on how to go about setting up your wallet:

Step 1: Download and install Coinapult

The first step is to download Coinapult. You can find it from Google Play, iOS, macOS. Alternatively, if you are using a desktop platform, you can sign up at https://coinapult.com/signup to create a new account. 

Step 2: Create a new account 

Whether using a mobile or desktop platform, the first step is going to the website’s homepage and creating an account. Ensure that you enter the required credentials before going to the next step.

Step 3: Backup your recovery phrase

This is perhaps the most important step while setting up a new wallet at Coinapult. You will be required to backup your recovery phrase, preferably writing it down on a piece of paper.  

Step 4: Verify your email

After registering an account, you will be required to verify your email before your account can be activated.

Step 5: Choose your ideal currency at https://coinapult.com/locks/

After activating your account, it is imperative to ensure you choose a list of your ideal currencies. 

Step 6: Fill in the total amount you want to send or receive

Key-in the amount you wish to send or receive at the “lock amount” box before heading to the next step.

Step 7: Complete your transaction

After going through all the above steps, your account will be ready for use. You will have successfully sent funds to your desired address through an encrypted .zil domain. It is that simple. 

Note that for a transaction to be successful, the platform should show the resulting invoice of the other transacting party at the top right corner. For subsequent transactions, you are required to repeat these steps. Bear in mind that the quick and easy merchant setup does not include bank statement capabilities. 

How to Send Bitcoin to an Address via SMS

So, what if you don’t have internet access? You can still send funds to any address – as long as they are registered with Coinapult. Technically, the addition of this feature also means that you can send Bitcoin to anyone across the world, with or without the internet. 

The best thing about this feature is that if the recipient does not have an existing account, one is automatically created. They will receive a confirmation message that their Bitcoin has successfully been sent and stored in their wallet as well as instructions on how to withdraw these coins.

To use the SMS feature, however, you will need to key in certain commands.

First, you will need to sign in and add your phone number. Use the command “send” + recipient’s phone number + {amount of Bitcoins}. Below is an example of such a command:

You: send +57744433331.3456

Coinapult: Send 3.4995btc to 8885532221 and Respond “yes 1q2hj6” to confirm

You: yes 2r4hh4

Coinapult: Funds sent. Balance: 4.56btc

Wallet security 101

Now that you have successfully created your Coinapult wallet, there are several things you should take into consideration. These include:

  • Watch out for malicious malware on your PC: Some malware is capable of using vulnerabilities in your PC to access your private keys. Ensure you have installed a powerful antivirus to enhance your safety.
  • Keep your recovery phrase safe: Note that in case you lose your “word seed,” “recovery phrase,” or “root key,” it is impossible to access your account. 

Customer support

Coinapult takes pride in its exceptional support team. They provide their customers with real-time feedback via their email or live chat. What’s more, they offer a plethora of user-friendly guides as well as a detailed Frequently Asked Questions (FAQs) section. 

Additionally, you can also contact them via their interactive social media platforms, including Facebook, Twitter, and LinkedIn accounts. 

Coinapult Wallet Compared to Other Competitors

Coinapult is indeed one of the most secure crypto wallets with sophisticated security features. It integrates 2-factor authentication and has a centralized validation mode of transaction. Further, it is quite easy to send or receive funds to the crypto wallet. You can even send your coins via SMS, which makes it a better method for individuals without an internet connection as well as for on-the-move transactions. 

All you need to do is follow the prompts while sending SMS commands, and you’ll be good to go. What’s more, it also features some amazing features, such as sending Bitcoin via email or directly from the Telegram app. The ability to integrate these unique features makes it one of the best platforms in the market. 

Pros and Cons of Coinapult Wallet

Pros

  • Its security is top-notch
  • The registration process is quite easy and straightforward
  • It is open-source
  • 2-factor authentication
  • Multi-signature

Cons

  • One may consider their customer support sluggish

Final Verdict: Is Coinapult Wallet Worth Your Money? 

Although Coinapult is not the top-rated crypto wallet in the market, it has gained a reputation and features among the safest platforms. It would be the go-to option for crypto enthusiasts looking for a Bitcoin wallet that supports such traditional currencies as the US Dollar (USD) and Euro (EUR). 

Categories
Crypto Guides

‘Decred’ – The First Of Its Kind Autonomous Digital Currency

Introduction

Decred (DCR) stands for Decentralized Credit and it is an autonomous digital currency. As the name says, it brings decentralized decision-making and governance to the platform in the form of votes from both miners and holders of the coin. The value proposition of this coin is that it is secure, adaptable, and sustainable on its own.

The coin is secure since it uses the combination of proof of work (POW) and Proof of Stake (POS) hybrid consensus mechanism. Hence, it is more expensive in order of magnitude to attack a hybrid model. The adaptable part of the coin is because of the voting rights granted to its miners and holders, providing them their say in the project level decisions. This will prevent hard forks and help in developing technology as we go further.

Lastly, they are sustainable as 10% of each block reward goes to the treasury. This leads to a very flexible model to incentivize the miners/contractors for their work.

How does the hybrid POW/POS work?

🏳️ The first block is mined using standard Proof of Work mechanism.

🏳️ Randomly five validators with a stake in the system are chosen from the pool to validate the block.

🏳️ If three out of the five validators are in consent with the validity of the block, the block gets added to the blockchain.

🏳️ 60% of the reward goes to the block miners, 30% of the reward goes to the validators while 10% of the reward goes to the Decred project treasury.

While the POW mechanism is pretty the same, POS needs some explanation in the context of Decred.

🏳️ People with DCR should buy some tickets to be part of the validators pool in the system

🏳️ For each block, only 20 tickets are allowed, and hence you have to pay some fee if you have to be selected as a validator quicker

🏳️ Once you are selected as a validator, your ticket will be treated as immature until 256 blocks are mined, approximately equal to 20 hours.

🏳️ Once your ticket is entered into the lottery pool, five validators are chosen randomly, and hence one has to wait for their chance. The system is designed in such a way that the chance of a ticket being selected as a validator is 99.5% before its expiry, which is four months in general.

Security

It is estimated that it is nearly 22 times more expensive to hack a hybrid POW/POS consensus mechanism than a pure POW network. Hence the system is very secure.

Governance

As we have already said before, the project level decisions are taken in the form of voting by both miners and holders of the DCR. Decred has never done an ICO or take funds from any private organization. They have created their funds like Dash, with every 10% of block reward going to the treasury. This treasury is maintained via DAO’s, decentralized autonomous organizations, which run on their own. This is how it works.

  • Anyone in the community can propose an improvement proposal for a small fee to avoid any spam.
  • Stakeholders, miners/holders can vote on the projects that they would likely to be received funding
  • Once approved, the funds are released in the form of a decentralized autonomous entity (DAE’s).

Decred is an excellent project due to its governance system. There are thousands of cryptocurrencies, but it’s scarce that any one of them has a good governance mechanism. A suitable governance mechanism ensures the network’s credibility and also forking of any form is avoided. Decred is a highly underrated project which should be recognized for its innovation. Cheers!

Categories
Forex Basic Strategies

How To Trade The ‘Higher High Failure’ Countertrend Strategy?

Introduction

There are millions of strategies out there in the market. Some work exceptionally well, while some fail miserably. Trading successfully is not about knowing several strategies, but about one strategy that works consistently. All professional traders are never in the hunt for trying out different strategies. They have expertise in a single strategy and know when to apply it and when not to.

Here, in this article, we shall be walking you through a simple yet extremely strategy that both day and positional traders can apply. Besides, we will enlighten you on the dos and don’ts of the strategy.

Understanding a Trend

The most evident state of the market is a trend. It is indeed the best state to trade as one can easily bet on the market’s direction. In technical terms, the trend is the state of the market, where the price makes higher-highs/higher-lows or lower-lows/lower-highs.

A trend alone can be of different types – based on the pattern. The above image of a trend is how an ideal trend looks like. However, the number of occurrences of this type of trend is very less. Apart from the ideal trending market, we can have other types of the same state.

Figure 1: In this type, the market breaks about the Support and Resistance (purple line), retraces through the line, and then makes another higher high.

Figure 2: Here, the market makes a HH by breaking about the S&R (purple line), pulls back insignificantly, away from the S&R, and makes a higher high.

Figure 3: The market made HH passing through the S&R, retraced a little, tried to make a higher high, and failed. Later, it retraced more than the previous time, and then successfully made a HH.

What is the ‘Higher High Failure’ Countertrend Strategy?

The “Higher High Failure” countertrend strategy is based on the third figure of the above image. It is named countertrend because the overall trend of the market is up, but the strategy is to take a short position.

According to the strategy, in an uptrend, if the market fails to make a higher high on the very first attempt, then one can prepare to go short on the security.

Logic

In a sequence of higher highs and higher lows, if the market fails to break above the recent HH, it is an indication that the trend is preparing for another push down before heading up. The failure also indicates that the buyers are not strong enough to push the market higher with one retracement. Since the buyers are slowing down, one can swing down from the seller before the market resumes its trend. Note that the length of this south wing depends on the strength difference of the buyers are sellers.

Trading the Higher High Failure Strategy

Consider the below chart of Euro / US Dollar on the 1H time frame. We can see that the market is in an uptrend making higher highs and higher lows.

The most recent higher high made by the market was 1.11834. The market then retraced to 1.1098, tried to make a new high from the previous one, but failed by leaving a wick on the top.

The failure to make a higher high indicates that the buyers are losing momentum, and as a result, the sellers could temporarily take over the market. In addition, the wick on the top at the resistance area signifies the strength of the sellers. Thus, right after the price shoots down at holds below the S&R (grey ray), one can go short on the pair.

Take Profit Placement

Since the buyers shot up from 1.10988 the previous, we can expect a reaction from the same level. Hence, 1.10988 would be the safest level to place the take profit level. If the sellers are strong in momentum, one can ride down until the S&R.

Stop Loss Placement

Stop-loss few pips above the wick can keep you away from getting stopped out. But it is risky to keep the stop loss right above the resistance level.

On the flip side, this strategy will work like a charm on a downtrend as well. For a downtrend, the strategy could be termed as a “Lower Low Failure” countertrend strategy. Let’s take an example of the same and understand how to trade a down-trending market.

In the below chart of GBP/CAD, we can see that the market is in a downtrend, making lower lows and lower highs. Level 1.70006 was the most recent LL. The market retraced to the S&R and tried to make a new LL but failed. During the failure to make a LL, a spinning top candle appeared, which was then followed by a bullish candle to close above the LL level. This confirms that the sellers are have temporarily faded out, and the buyers are going take over the market.

Take Profit Placement

Take profit can be placed at the price where the market tried to make a lower low previously. In this example, the TP would be at the S&R.

Stop Loss Placement

The safest stop loss for this strategy would be right below the price where it failed to make a LL.

Important Points to Note

  • The price should attempt to make a higher high and fail. The strategy cannot be considered for an equal high.
  • After the failure to make HH, the price should hold below the S&R level.
  • The strategy will not work if the price makes HH, holds, and then drops below the S&R.
  • Since it is countertrend trade, make sure to take profits at every hurdle.
  • The stop loss must be above the high of the higher high failure, NOT right at the resistance.

We hope you found the strategy interesting and useful. Do test it out in the live market and let us know the results in the comment section below. Cheers!

Categories
Forex Price Action

Do Not Abandon a Chart with Choppy Price Action

In today’s lesson, we are going to demonstrate an example of a chart where the price gets caught within two horizontal levels and makes a bullish breakout. We try to find out what it has to offer and how the price action goes. Let us get started.

The price makes a strong bullish move. Upon finding its resistance, it is in a bearish correction. The buyers may eagerly wait to go long in a chart like this if the chart makes a breakout at the last highest high. The last two candles come out as bullish candles. It seems that the price may have found its support.

The chart shows that two lines may be drawn by using significant levels, where the price reacts several times. The buyers may eye on the price and hope that the chart makes a breakout at the level of resistance to offer them a long entry.

The chart shows that it does not make a breakout at the highest high. However, it gets rejection and makes another bearish move towards the level of support. Here is an interesting thing. The sellers may wait for the chart to make a breakout and offer them a short entry here since the level is a double top resistance.

The chart does not make a breakout, but it produces a long bullish engulfing candle. It gets rejected again and heads towards the South. Upon having a bounce, it heads towards the North. Two horizontal levels may be drawn, which is called horizontal channel or box channel. The price may go either way. Now, the buyers are to wait for a bullish breakout and go long in the pair.

After a long while, the chart makes a bullish breakout. The buyers may wait for the price to make a correction/consolidate and produce a bullish reversal candle to offer them a long entry.

The price makes a bearish correction and seems to have found its support. It produces a doji candle. The buyers may get ready to trigger a long entry. Some buyers may flip over to the smaller chart to trigger a long entry, and some may go long above the last highest high. Some may wait for a bullish engulfing candle closing above resistance. It depends on their trading strategy.

The chart produces a bullish engulfing candle closing above consolidation resistance. The price may head towards the North with good bullish momentum as far as the last candle’s attributes are concerned.

The price heads towards the North and hits 1R within the next candle. The last candle comes out as a bearish inside bar. It suggests that the price may consolidate and make a bearish correction. In the end, the buyers have made some green pips.

The market ranges most of the time. When it makes a breakout, it does not take too long to offer an entry. In today’s lesson, we have seen that the price makes us wait for a long. It takes a long time to make a breakout. Traders must keep their eyes on such charts and wait for the price to take a direction. In the end, even a choppy chart may end up offering a good entry too.

Categories
Forex Daily Topic Forex Videos

Fundamental Analysis For Novices – German IFO Indicators

Fundamental Analysis For Novices – German IFO Indicators 

Thank you for joining our educational video four fundamental analysis for novices. In this video, we will be looking at the German IFO Indicators.


One of the absolute must-dos for traders is to routinely analyze economic data releases from governments around the world. These show the economic health of that particular nation’s economy.  This data can be found on an economic calendar such as this one.  The majority of brokers provide an economic calendar, and you should refer to it every day in order to avoid trading around times of possible extra market volatility surrounding the release of high impact economic data.
The key components of an economic calendar are the day, date and time, the actual event, the likely impact of the data, the actual data upon release, the previous data for comparison, and a market consensus of what the likely figure will be.

INSERT WHAT IS THE GERMAN IFO

This is a German business sentiment index. The data is compiled by the Munich based CESIFO Group. The institute conducts a survey of around 9000 German businesses, including manufacturing, the service sector, trade and construction, and focuses on their assessment of the business situation, including their short-term planning.  Each response is weighted according to the significance of the particular firm’s importance within the German economy. The data is compiled in such a way to reflect outcomes between – 100 and plus 100.  where the lower, the worse for the German economy and vice versa.  The IFO is a leading indicator.

Here we can see that the IFO economic indicator is due for release in 27 minutes and where the data is released in three components: business climate for June, current assessment for June, and Expectations for June.  The impact of value is medium, and that means there is a possibility that the data release can cause volatility in the market upon release.

The consensus values are highlighted and are expected to be slightly higher in each case for the previous releases for May 2020.  This means that economists and market analysts are predicting the IFO releases will be an improvement on the previous month.

This is the technical analysis of a 1-hour time frame for the euro US dollar pair just prior to the release of the IFO number.

This is the actual data release for each of the three components. While all three are better than the previous month’s figures for May, the current assessment component is slightly lower than the consensus value.

After an initial dip lower due to volatility at the time of the release, a slight bid tone returns to the pair. Traders saw a positive figure, which was above the previous release, and this was considered to be good for economic growth, and therefore traders viewed this as bullish for the Euro. A lower reading would have had the opposite effect.

A short while after the markets had time to analyze the data and listen to some negative comments, post-release, from the German finance minister, the pair pushes lower.

It is always advisable when trading around important data releases, such as the German IFO economic indicator, to wait until such time as the market has done its own analysis and then try and get on to a trend once it is started to develop.

Categories
Cryptocurrencies

Best Decentralized Messaging Apps 

We live in times when personal privacy and security have never been more prized. And this is because we live in a digital age where anyone with enough resources can track your communications and whereabouts at will. Governments are particularly notorious at this. It’s not uncommon to find a government is peeping into the private communications of its citizens. It’s even worse when you’re considered a dissident in an authoritarian regime. 

There’s also the issue of cybercriminals and extortionists who are looking for loopholes or embarrassing information in private communications to blackmail people. Or they may threaten to expose your sensitive data such as credit cards, social security info, bank info, email passwords, or medical records – if you don’t pay up.

Everyone deserves privacy and the freedom to live without being spied on. Some apps, such as WhatsApp and Telegram, have stepped in to provide users with secure and encrypted messaging. But these apps have a centralized architecture, meaning the companies maintain control of the servers. As such, users can never really be absolutely certain whether their communications are indeed safe or not. 

This is where blockchain comes in. Blockchain enables a decentralized, cryptographically encrypted, and peer-to-peer messaging platform that’s not just safe, but also free of the whims of governments.

In this article, we’ll take a look it’s some of the best decentralized messaging apps out there today. 

#1. Dust

Co-founded by Mark Cuban, Dust is a blockchain-based texting app developed by Radical App. The app’s main attention points are privacy and security. Dust’s distinction from the rest of many privacy-focused apps is a timed self-erasure of messages which occurs after 24 hours. You can also unsend any message at any time. It even notifies you when a person on the other end screenshots your conversation. 

As is to be expected with privacy messengers, conversations on Dust are end-to-end encrypted and not accessible by anyone, including the developer team. Also, you can delete messages from another user’s phone in real-time. And once a message is gone, it’s gone. 

 #2. Sense.Chat

Sense Chat is a fast and decentralized texting app that runs on the EOS blockchain. The app has several interesting features that are traditionally lacking in messaging apps. From chat channels where users can indulge on a number of topics, to peer-to-peer video chats, to content creators (who, by the way, can be tipped by other users). 

Founder and CEO Crystal Rose Pierce said this about the app: “SENSE is building blockchain communication tools for everyone. We see Sense. Chat being integrated into any EOS dApp with a community. We’re building tools for content creators, community managers, token holders, and game players.” 

The app uses a peer-to-peer verification system that allows users to secure the system, avoid scams, and single out fake accounts. You can even earn SENSE, a cryptocurrency, by being active in the community and inviting others. 

#3. Crypviser

Crypviser is a secure messaging app that lets users send and receive messages on an automatically encrypted blockchain platform. The app seeks to eliminate man-in-the-middle (MITM) attacks so that no party can sneak in into your text messages or audio or video calls. 

It’s impossible for anyone to attack your messages since encryption keys are distributed, in a truly decentralized fashion, across several nodes on the blockchain. 

On Crypviser, you can share as many files as you want without any size restrictions – something that’s common with most messaging apps, including WhatsApp and Facebook. 

Also, Crypviser features a “Screenshot and Data Forward Control feature,” which prevents anyone from screenshotting, forwarding, or copying your text messages. There is also the option of hiding your chats with particular contacts by enabling a password that will hide the conversations between you and the said contact. And lastly, users can set a time for messages to self-destruct on both ends at a determined time.

#4. Status

Status is a decentralized messaging app based on the Ethereum blockchain. On the app, you get to have complete control over your information. The app protects not only your data but also your metadata – ensuring the ultimate privacy. 

Status is also more than a messaging platform. It comes with a cryptocurrency wallet that allows you to send and receive cryptocurrency. You can even interact with Ethereum-based decentralized applications (DApps), play games, and more.

#5. Sylo 

Sylo is a decentralized messaging platform that also doubles as a cryptocurrency wallet. It allows you to “keep your assets, your contacts, and your conversations all in one place.” Sylo operates on a decentralized platform, affording you top-notch privacy and security. All communications are end-to-end encrypted, and the developers neither need nor access your data. 

The platform is also equipped with a host of DApps that you can interact with, and even unlock a whole world of premium features with the protocol’s tokens known as SYLOs. 

SYLO says there’s no ‘big brother’ watching your activities, and you don’t need to provide your email or phone number to set up an account. 

Using the platform, you can search and add any ERC20 tokens and even custom-create your own tokens. You can even check your crypto balance at any time in your preferred currency. It currently supports the following currencies: USD, NZD, EUR, JPY, AUD, CAD, KRW, SGD, INR, and GBP.

#6.  BeeChat

BeeChat is a blockchain-based messaging and DApps platform. The app saves encrypted data on the blockchain, ensuring no one can access your messages since the encryption keys are distributed across multiple nodes on the network.

The app supports a cross-chain function for both Ethereum and EOS, meaning you can selectively store your data on either blockchain. It also supports the Telegram protocol, which enables Telegram users’ contact to automatically match to BeeChat. Users can even host a chat of thousands of users using the messaging and video chat functionalities. 

#7. Tox

Tox is a free, encrypted, and open source messaging platform that allows you to have private conversations. It’s decentralized, meaning it cannot be attacked, shut down, or made to turn over data by government, regulatory, or law enforcement agencies. It also means server outages are a thing of the past. 

Tox wants you to know that it’s completely free – both in price and free as in freedom. As it says on the website, “There are no corporate interests, and no hidden agendas.” Being open-source means that you can modify, use and share it – because it’s made “by the people who use it – people fed up with the existing options that spy on us, track us, censor us, and keep us from innovating.” Tox also supports limitless file sharing, so you can share whatever size of media files with your family and friends.

Final Words

Blockchain comes to the rescue again, this time on private and secure messaging. And thanks to the ingenuity of smart developers out there, private messaging seekers now have an impressive variety of messaging platforms to choose from. And in keeping with the decentralization theme, some even come with the extremely timely feature of peer-to-peer transfer of money. What’s not to like? 

Categories
Forex Fundamental Analysis

The Impact Of ‘GDP From Agriculture’ News Announcement On The Forex Price Charts

Introduction

Economic output from the Agriculture Sector is non-negotiable for the economy. The increasing population must be fed and meet the demands of consumption at all times. Hence, the Central Government is committed to making positive growth in the Agriculture Sector. Agriculture Sector is the primary sector where Government Spending goes.

Since food is an essential commodity, it is an ever-green industry that will never run out of demand. Hence, understanding this sector can help us understand dependent industries’ performance and expenses associated with personal consumption.

What is GDP from Agriculture?

Gross Domestic Product 

GDP is the measure of a country’s total economic output. It is the total monetary value of all the goods and services produced within the country regardless of citizenship (resident or foreign national).

It is the market value of all the finished goods and services within a nation’s geographical borders for a given period. The period is generally a quarter (3 months) or a year.

Agriculture Sector

Also, it accounts for all the activities associated with crop production called the Primary Sector of an economy. From the point of cultivation to end-marketing of the food products all are accounted under the Agriculture Sector. It primarily includes farming, fishing, and forestry.

The quick increase in the world population has put pressure on the Agriculture sector to bring innovations through science and technology to increase crop yield. Agriculture Sector is the primary source of food for a country’s population.

The Agriculture Sector goes beyond farm business and includes farm-related industries like Food Service and Food Manufacturing (Packaged Foods, Processed Foods).

How can the GDP from Agriculture numbers be used for analysis?

The agriculture sector contributes about 6.4% of the World GDP. The most significant contributor to this being China, followed by India. China accounts for 19.49%, and India accounts for 7.39% of total agricultural output. The United States is in third place. 

It is necessary to understand the economic output of Agriculture is a function of population, as China, India, and the USA are ranked in population terms in the same order.

The three sectors of the economy, namely, primary Sector, secondary (Industry) Sector, and tertiary (Service) sector, contribute to the overall GDP. It is common for developed nations to have a high contribution to GDP from the Service Sector. Developing economies like China, Japan would have higher contributions from the Industry Sector. The underdeveloped economies would have Agriculture or Primary Sector as a leading contributor to GDP.

In the United States, the entire Agriculture Sector contributes about 5.4% of the GDP. The farms have only contributed 1% of GDP, and the rest is contributed to by the dependent industries that rely on agricultural input to produce goods. The Food Service, Textiles, Beverages, Processed Foods, Tobacco products, etc. contribute the remaining 4% to the GDP.

11% of the total U.S. employment is accounted for by the Agriculture Sector, which is about 22 million jobs in 2018. Food accounts for 13% expenditure of an average American Household. 

It is essential to understand that food is an essential requirement for conducting our livelihood. Hence, Government Spending first prioritizes the Agriculture Sector and releases benefit programs to assist the sector and maintain and grow its economic output. The society and Government will quickly collapse if the Agriculture Sector slows down, and that is why it is called the “Primary Sector.”

The Government Outlays on Food Programs and Nutrition Assistance exceeds that of any other federal program. Improper management and assistance to the Agriculture Sector can lead to price hikes in the food industry. It would trigger a negative response from the public that could cost them in the next elections. Hence, the Government is committed to assisting the Agriculture Sector at all times, good or bad.

Impact on Currency

GDP from Agriculture in itself is not a high impact indicator, as the broader measures like Real GDP and GDP Growth Rates are more important for the Currency Markets. 

GDP from Agriculture does not paint the full picture of the economy, but can be an essential tool for the Central Authorities to keep track of Agriculture Sector performance. Businesses dependent on Agriculture input may use this data to understand potential business opportunities amongst different countries. Still, for the International Currency Markets, it does not serve as a useful indicator.

It is a proportional and lagging indicator. Higher GDP from Agriculture is good for the economy and its currency, and vice-versa.

Economic Reports

For the United States, the Bureau of Economic Analysis releases quarterly GDP figures on its official website every quarter. The release schedule is already mentioned on the website and is generally released one month after the quarter ends.

In the full report, we can extract the GDP from Agriculture figures. We can also go through GDP by Industry to get the Construction Industry performance in the report. Major international organizations like the World Bank, CIA World Factbook, etc. actively maintain GDP by Sector figures of most countries on their official website.

Sources of GDP from Agriculture

For the United States, the BEA reports are available in the sources mentioned below. 

GDP -BEAGDP by Industry – BEAFARM – GDP

The St. Louis FRED keeps track of all the GDP and its related components in one place on its official website hereWorld Bank also maintains the Agriculture Sector as a percentage of GDP on its official websiteWe can find GDP sector composition for different countries here. We can find the consolidated list of Agriculture – GDP figures for most countries here.

Impact of the “GDP from Agriculture” news release on the Forex market

The agricultural sector plays an essential role in the process of economic development of a country. It contributes to the economic prosperity of advanced countries, and its role in the economic development of underdeveloped countries is of vital importance. In other words, countries where per capita real income is low, the emphasis is laid on agricultural and other primary industries.

History tells us that agricultural prosperity contributed considerably to the national income and the GDP. When we are talking about the impact of this contribution on the currency, we will have to say that it is least and not of much importance to investors. They look at broader data, which is the GDP, and make decisions based on the reading. 

In today’s example, we will examine the impact of GDP on different currency pairs and observe the volatility due to the news announcement. The below image shows the latest quarter GDP data of Australia, where it was more or less the same as in the quarter. Let us find out the reaction of the market to this news release.

AUD/USD | Before the announcement:

We will first look at the AUD/USD currency pair to observe the impact of GDP on the Australian dollar. In the above image, we see that the market is in an uptrend, and recently the price seems to have retraced the up move. This is an ideal chart pattern for joining the trend, but since a significant news announcement is due, we need to wait to understand the impact it creates on the chart.

AUD/USD | After the announcement:


After the news announcement, the market moves higher, where the price rises sharply above the moving average. The bullish ‘news candle’ is a consequence of better than expected GDP data, which was higher by 0.2%. Although it was marginally less than the previous quarter, it turned out to be positive for the currency. This is a confirmation sign of trend continuation where one can expect a new ‘higher high.’      

AUD/JPY | Before the announcement:

AUD/JPY | After the announcement:

The above images represent the AUD/JPY currency pair, where the market moves within a ‘range’ before the news announcement. We also notice an initial reaction from the ‘support’ where the price has moved higher from the ‘low.’ Since economists have forecasted a lower GDP estimate in the fourth quarter, it is not recommended to take a ‘long’ position before the news release.

After the news announcement, we see that the price quickly moves up, and market surges to the upside. As the GDP data was beyond expectations, traders bought Australian dollars and strengthened the currency. Therefore, the news release has a hugely positive impact on the currency pair. In this pair, once needs to be cautious before taking buy trade as the price is at the top of the ‘range.’ 

GBP/AUD | Before the announcement:

GBP/AUD | After the announcement:

The above images are that of GBP/AUD currency pair, where we see that before the news announcement, the market has retraced the downtrend by more than half, indicating that the Australian dollar has gained strength newly. After the occurrence of trend continuation candlestick patterns, it could result in a flawless sell trade. However, there is also a probability that the news release could change the dynamics of the chart.

After the news announcement, market crashes and the price significantly moves lower. As the GDP data was positive for the economy, it leads to bullishness in the Australian dollar resulting in the price fall. One could take a risk-free ‘short’ position at this point, expecting the market to move much lower.

That’s about ‘GDP from Agriculture’ and its impact on the Forex market after its news release. If you have any questions, please let us know in the comments below. Good luck!

Categories
Forex Basic Strategies

Learning To Trade The 123 Pattern Reversal Trading Strategy

Introduction

Strategies that we discussed in the previous set of articles were based on indicators and price action patterns. We are going into the trading strategies, where we will combine popular candlestick patterns and price action. The next two articles will discuss the 123 patterns as a reversal trading strategy and continuation trading strategy. First, we will look at the 123 pattern as an indicator of the end of a trend and also a market reversal. Hence, it is also known as the 123 top and bottom pattern.

The 123 top and bottom is a very powerful pattern that signals a reversal of a trend. It is also used as a trend continuation pattern, which we will be discussing in detail shortly. First, let us discuss the 123 patterns as a reversal trading strategy.

Time Frame

A fascinating feature of this strategy is that it applies to all time frames starting from 15 minutes to ‘daily.’ Before trying this strategy on extremely small time frames such as the 5 minutes or 1 minute, a lot of experience is required.

Indicators

As mentioned earlier, in this strategy, we will not be using any technical indicators. The only prerequisite of the strategy is to have a clear understanding of the 123 patterns before reading about the strategy.

Currency Pairs

The strategy is suitable for trading in all currency pairs. However, it is suggested to look for the trading opportunities in major and few minor currency pairs only as the patterns are more reliable and evident in these pairs.

Strategy Concept

The strategy begins by identifying three main points. For example, in an uptrend, when the market hits a new high, label that point as 1. We then wait for the price to pull back to a short-term support area. This point is labeled as 2. Finally, when the price moves up to an area between points 2 and 3, we label this as point number 3. We then take an entry at a suitable location, which we will address in the later part of the strategy.

The pattern is complete when the price stays below point 2. The strategy is to sell the currency pair on the break of point 2. The take-profit of the strategy is placed at a point that results in a 1:2 risk-to-reward ratio. The stop loss is put just above point 3, whereas a more conservative stop loss is placed just above the move, in order to maximize the risk to reward. The trader will be able to make this choice by trading the pattern again and again. Let us understand the step by step process of the strategy.

Trade Setup

In order to illustrate the strategy, we have considered the GBP/AUD currency pair, where we will look for ‘short’ trades by identifying the 123 top patterns. In this example, we are applying our strategy on the 15 minutes time frame and during one of the major trading sessions.

Step 1

The first step of the strategy is to look for point 1, which is essentially the highest point of a trend. The criteria for selection of point 1 is that the market should reach it’s previous low or high twice before it starts moving lower or higher.

In our example, we can see that the previous lows have been tested multiple times, and thus we have chosen the highest point as our point number 1.

Step 2

The next step is to mark the point number 2. When the market pulls back to the recent support or resistance area after reacting from point 1, we mark this as point 2. Remember that the price should not only reach that area but also react and move higher (for uptrend) or lower (for downtrend). This confirms the key technical level.

Step 3

The formation of the 123 pattern is complete after identifying the third point. When the market moves in the area between points 1 and 2 and later comes goes back to point 1, the point from where the market reversed becomes our point 3. Now the next step of the strategy is discovering the ‘entry.’

Step 4

In this step, we will be discussing the ‘entry.’ There are two ways of entering the market in this strategy. The first one is an aggressive way to take an entry on a break of point 2, and as the market starts moving in that direction. Traders who are confident about the pattern and have belief in the market can opt for such an ‘entry.’ The second one is a conservative approach where one takes an ‘entry’ at the test of the previous support or resistance. This gives additional confirmation that the market is ready to go in a favorable direction.

In this case, we have entered the market right after point 2 is broken, which is a little aggressive.

Step 5

Finally, we need to determine our stop-loss and take-profit levels for the strategy. The stop loss is placed a little higher than point 3, or if one wants to maximize their risk to reward ratio, he/she can place it at a 50% mark between point 2 and point 3. The take-profit is placed at a point where the resultant risk to reward is at least 1:2. However, if there is a hurdle in between, profits can also be taken at such points.

Strategy Roundup

The 123 pattern is a major trend reversal pattern is one of the best strategies for trend reversals. One can trade using this strategy on any time frame. The strategy is based on the idea that the market is losing momentum in the direction of the major trend and could reverse any moment. The probability of this strategy is high and does not require knowledge of technical indicators.

Categories
Forex Assets

XPT/USD – How Expensive Is It To Trade This Commodity Asset Class?

Introduction

Platinum is one of the rarest precious metal found in the Earth’s crust. Only a few hundred tons are produced annually. The name Platinum is derived from a Spanish word platina (little silver).

Similar to how other precious metals like Gold and Silver are traded in the exchange market, Platinum is also actively traded in the market. Its ISO code is XPT and is highly traded against the US Dollar with the ticker XPT/USD.

Understanding XPT/USD

Platinum is a precious metal that is measured in troy ounces (Oz). The market price of XPT/USD represents the value of the US Dollar for one troy oz of Platinum. It is quoted as 1 XPT per X USD. For instance, if the current market price of XPT/USD is 814.50, then it means that each oz of Pl is worth 814.50 USD.

XPT/USD Specification

Spread

It is the difference between the bid and the ask prices. The typical spread in Platinum is usually around 700 pips.

Fee

Unlike currency pairs, Platinum is traded as a Contract for difference (CFD). There are three different types of the fee charged for such trades:

  • Commission charge
  • Overnight fee

Thus, the total fee will be,

Total fee = Spread + commission + overnight

For our example, we shall ignore the overnight fee as it completely depends on how long aa trader is willing to hold his positions. So, the revised fee will be,

Total fee = Spread + commission = 700 + 200 = 900 pips

Trading Range in XPT/USD

The trading range is a representation of volatility in the pair for different time frames in a tabular format. It gives the minimum, average, and maximum volatility in the pair for various time frames.

Procedure to assess Pip Ranges

  1. Add the ATR indicator to your chart
  2. Set the period to 1
  3. Add a 200-period SMA to this indicator
  4. Shrink the chart so you can assess a large time period
  5. Select your desired timeframe
  6. Measure the floor level and set this value as the min
  7. Measure the level of the 200-period SMA and set this as the average
  8. Measure the peak levels and set this as Max.

XPT/USD Cost as a Percent of the Trading Range

Cost as a % of the trading range illustrates the variation in the cost of trade by considering the time frame and volatility of the instrument. Mathematically, it is the ratio of the volatility value and the total cost represented in terms of a percentage.

Total fee = Spread + commission = 700 + 200 = 900 pips

Trading the XPT/USD

Platinum is one of the highly traded commodities in the exchange market. But its trading volume is lesser than Gold Spot and Silver Spot. Nonetheless, it has enough volatility and liquidity for retail traders to participate in the market.

Platinum is primarily driven by supply and demand that comes from fundamental factors. These factors are different from that of Gold and Silver, yet some do apply on Pl. When it comes to technical analysis, all the techniques apply that is used in other markets.

As mentioned, Platinum is traded as CFD, and each trade has a commission, overnight, and spread involved in it. This fee is fixed irrespective of the volatility of the market and the time frame traded. But there is a catch here. Even though the fee is fixed, the fee varies relatively. Meaning, a trader aiming high profit must pay the same fee as a trader aiming for small profits. The former is typically a large time frame trader, while the latter is a trader trading relatively smaller time frame.

Since the timeframe is something that cannot be fixed, one can relatively reduce costs by considering the volatility of the market. As the above table evidently depicts, as the volatility increases, the relative fee on the trade decreases. Thus, one must consider trading when the volatility of the pair is at or above the average volatility.

Categories
Crypto Videos

Binance Is Now 10x Faster After the Biggest Update In It’s History – Ready For The Next Bullrun!

Binance 10x Faster After the Biggest Update in its History

Binance just completed its largest upgrade on June 28, making the platform even faster, announced Binance’s founder and CEO Changpeng Zhao, better known as CZ.

CZ’s thoughts on the update and the next bull run

The largest trading platform in the world has reportedly re-written all code and switched its matching engine to a new programming language, all in an attempt to make it faster and more suitable for even the most demanding traders. It’s said to be Binance’s biggest upgrade in two years. The trading platform can perform ten times faster for traders for the next bull run.


CZ added that, in theory, the platform could handle 100x their current volume. But when real volumes hit, he said that there would probably be some other peripheral systems that may temporarily cause a bottleneck. However, he is certain that they would be fixed quickly.
Although Bitcoin’s price dropped below $9,000 for the second time this week, traders seem bullish and are continuing to buy on each dip.

Categories
Cryptocurrencies

Introducing the Ardor Blockchain

Bitcoin showed everyone what blockchain was capable of. It brought something unprecedented – the ability for individuals to conduct decentralized, immutable, and uncensorable transactions. The tech’s enthusiasts soon discovered that it could be applied to so much more uses – giving birth to new kinds of applications known as decentralized applications (DApps) and smart contracts. 

But like any new tech, blockchain was far from perfect. Over the years, the blockchain community has witnessed the slow throughputs on blockchains such as Bitcoin and Ethereum. These shortcomings make the blockchain unfit for a lot of modern-day needs – not to mention the business world. 

Ardor is a blockchain that seeks to provide reliable blockchain solutions for all types of entities and a wide range of purposes. It comes with a unique parent-child chain architecture and other pieces of technology that enable it to solve the problems of the current blockchain setup, including blockchain bloat, the issue of single network tokens, and more. 

What’s Ardor? 

Ardor is a Blockchain as a Service platform that seeks to help businesses and institutions take advantage of blockchain tech without having to incur high customization costs. It does this by providing businesses with ready to use blockchain solutions via customizable child chains. 

Ardor was developed by the same company behind Next – another blockchain project. But this time, they want to solve some of the shortcomings with Nxt and indeed most of the first and second-generation blockchains. 

Understanding Nxt

In order to understand Ardor, we first need to take a look at Nxt. Nxt was made to derive more value from blockchain – beyond being just a transfer of value. Launched in 2013, it was one of the first-ever cryptocurrencies, and one of the first that built its own blockchain from scratch. It was also one of the first to implement a proof-of-stake consensus mechanism. 

On the Nxt blockchain, developers can create their own blockchain solutions using the API tools of the platform. Both entities and individuals can experiment on the platform – whether you want to tokenize a real-life asset, buy or sell goods on a decentralized marketplace, set up a voting system, communicate on an encrypted platform, and so on. The proof of stake mechanism also massively saves energy, as opposed to Bitcoin’s power-hungry proof of work algorithm. However, Nxt presents with its own challenges, which we’ll look at below. 

The Issues with Nxt

#1. Native Tokens 

Nxt uses a ‘forging’ proof of stake mechanism, which means all coins have already been created, and no new ones are released for each new block. 

Instead, forgers – the people who create new blocks, are rewarded with a fraction of transaction fees. This means that transaction fees need to be paid in NXT – the native token of Nxt. Doing so devalues your own currency.

#2. Blockchain Bloat

Blockchain bloat refers to the common issue on blockchains where the increase in size as more transactions are conducted on top of them. The more it happens, the more resources are needed to operate the network. It means that nodes have to dedicate even more storage space to participate in the network. This means downloading massive volumes of transaction data, which ends up creating a barrier to joining the network.

#3. Lack of Easy Customization Solutions

The current blockchain setup customization issues. For one to create a clone of a blockchain, they would need separate servers and continuously check on it to make sure it’s running smoothly. Also, the clone would remain behind as the main chain receives software and protocol updates. This would be extremely time and resource-intensive. 

How Ardor Works and its Solutions to These Problems

Ardor takes after Next in almost every feature but integrates an easily customizable solution for new blockchains. It accomplishes this via the use of child chains, with the main chain being solely responsible for speed and security. Let’s look at the child chains as well as other solutions advanced by Ardor. 

#1. Child Chains

Ardor implements ‘child chains’, which still hold all the functionalities of Nxt. However, the child chains work very closely with the parent Ardor chain. Transactions are verified and secured on the main chain. This facilitates cross-chain transactions. 

When entities/individuals want to create a new application on Ardor, they need to create a child chain. This architecture allows them to implement customized features in no time since the blockchain infrastructure is already there. And this, while the child chains enjoy the decentralization, speed, security, and any software upgrades of the parent chain. 

#2. Transaction Pruning

Ardor takes care of the blockchain block problem through what it calls transaction pruning. This is essentially removing transactional data related to the child chain from the main chain. This means that nodes don’t have to maintain the whole copy of the entire blockchain history, but just the most recent state. This allows it to remain lean without any negative effects related to the security of transactions. Also, full nodes can choose to become archival nodes – that is, hold the historical data of the child chains.

#3. Bundling System

To solve the native token problem, Ardor employs a bundling system that comprises nodes (bundlers) that accept transaction fees paid in the child chain coin. The bundlers can then pay the parent chain in native token ARDR, the native token of Ardor. This removes the limitation of having to use the native token, as in NXT for Next or Ether for Ethereum, and so on. 

Ignis: Ardor’s Eldest Child Chain

To showcase the capabilities of Ardor as a parent chain, the Ardor team launched a child chain – Ignis. The child chain has over 20 built-in features that complement the Next code base and to make it suitable for lots of use cases. The parent chain provides speed and security, while Ignis hosts all the action. 

Organizations and individuals alike can utilize the Ignis platform to launch their own blockchain project, crowdfund, launch an ICO, create a crypto exchange, set up a voting system, send encrypted messages, and so on. 

Who’s Behind Ardor?

Ardor is a brainchild of Jelurida, the same team behind Nxt. The team is made of experts with knowledge and experience cutting across coding, engineering, law, business development, and quality assurance. 

Tokenomics of Ardor 

ARDR, Ardor’s native token, trades at $0.052385 as of June 24, 2020. It occupies position #106 in the crypto market, with a market cap of $52, 332, 369, a 24-hour volume of $2, 888,108, a circulating, total, and maximum supply of 998, 999, 495. The coin has an all-time high of $2.55 (Jan 13, 2018) and an all-time low of $0.008368 (Oct 30, 2016). 

Where to Buy ARDR

You can buy ARDR from several crypto exchanges, including Binance, Upbit, Huobi, Bittrex, Poloniex, WazirX, OKEx. In most of the exchanges, you need to first purchase cryptos like Bitcoin, Ethereum, and USDT and exchange it for ARDR. However, some exchanges like Changelly allow you to purchase directly with Fiat. 

Ardor provides its own wallets for Web, iOS, and Android. The smallest can also store Ignis tokens and all child chain tokens. 

Final Words

Ardor introduces completely new thoughts on how blockchain architecture can look like. With the child chain solution, network users can customize their applications while still benefiting from the advantages of the parent chain. The issue of blockchain bloating is dealt with, thanks to the ingenious transaction pruning. And developers can engage with all sorts of activities on the network without being constrained by single network tokens. If Ardor holds its own in the coming years, it may prove to be one of the most useful solutions to emerge from the blockchain space. 

Categories
Forex Daily Topic Forex Price Action

Double Top or Double Bottom Often Offers More

In today’s lesson, we are going to demonstrate an example of a chart offering multiple entries upon producing the double bottom. We know the double bottom is one of the strongest bullish reversal patterns. When a chart produces a double bottom, price action traders keep their eyes on the chart to keep going long. Usually, a double top or a double bottom ends up offering multiple entries. Let us now have a look at today’s example of how it offers us multiple entries.

This is an H4 chart. The chart shows that the price heads towards the South with good bearish momentum. It makes a long bearish move too. However, look at the last candle in the chart. It comes out as a bullish inside bar, which is produced at double bottom support. The buyers are to wait for a breakout at the neckline and go long in the pair.

The chart shows that one of the candles breaches through the neckline level. The next candle comes out as a bullish candle. The buyers are to wait for the price to consolidate and produce a bullish reversal candle to go long in the pair.

Upon producing a bearish inside bar, the price produces a bearish candle. The last candle looks very bearish. However, the buyers must keep their eyes on the chart since it may produce a bullish reversal candle anytime as far as double bottom and neckline breakout are concerned.

The chart produces a bullish reversal candle followed by another bullish candle breaching through consolidation resistance. The buyers may trigger a long entry right after the last candle closes by setting stop loss below consolidation support and by setting take profit with 1R.

The price heads towards the North with good bullish momentum. It hits 1R within the next candle. The price consolidates and produces a bullish reversal candle closing above the last swing high. Do you notice anything here? Yes, this is another entry. The buyers may trigger a long entry right after the last candle closes. Let us have a look at the trade setup with two horizontal lines on the chart.

The price heads towards the North again and hits 1R within the next candle. It seems that the buyers are having a feast here. The way it has been going, they may wait for the price to consolidate again and produce another bullish reversal candle to offer them one more entry. In a word, this is a chart that is going to be closely monitored by the buyers until it produces a strong bearish reversal pattern such as a double top or a bearish engulfing candle on the daily chart (this is an H4 chart). Next time when you see a double top or bottom on a chart, keep eyeing on the chart to make full use of that.


Categories
Forex Basic Strategies

Forex Trading Strategy – Trading The 123 Continuation Pattern

Introduction

In the previous article, we discussed the 123 patterns as a confirmation sign for the end of a trend. However, while the 123 top and bottom are a great entry method for taking reversal trades, it is observed that most of the time market moves in a trend that requires us to get into the trend in the middle of it. We have heard that ‘the trend is your friend,’ so now we will learn a method to get into a trend using the 123 trend continuation pattern.

The safest trades are the ones that we take in the direction of the major trend. In simple words, if the trend is up, we should be ‘long’ in the market, and if the trend is down, we should be ‘short.’ In fact, it is advised for new traders to always be with the trend and not go for trend reversal trades.

Sometimes, one might miss out on the start of a new trend, for which we need a method to enter the confirmed trend during its progress. In today’s strategy, we will discuss one such method of entering a trending market using the 123 patterns for trend continuation, also called internal 123.

Time Frame

An interesting feature of this strategy is that it can be used on all time frames. One needs to comprehend the strategy very well before trying out this on extremely small time frames, such as 5 minutes or 1 minute.

Indicators

No indicators shall be used in this strategy. However, the Simple Moving Average (SMA) can be used to identify the major market trend.

Currency Pairs

Since the strategy is based on the same 123 reversal pattern that we discussed earlier, the strategy’s parameters will remain the same here as well. Hence, the strategy is suitable for trading in all currency pairs, including major, minor, and few exotic pairs. However, it is advised to trade in the major and minor currency pairs only.

Strategy Concept

The strategy’s basic concept is the continuous identification of 123 points in the direction of the new trend. The initial 123 points are identified in the same way as was identified in the previous section, and subsequently, the same pattern is identified as the trend advances. In this strategy, we will be attempting to catch the trend at the second or third appearance of the pattern. Since we are joining the trend after the move has started and it is in the middle, we cannot expect a large risk to reward ratio. This means the risk to reward of trades using this strategy varies anywhere between 1 to 1.5.

One should be careful while using this strategy for trend trading since most traders end up taking late entries that result in a loss. The strategy cannot be applied when the trend is very much evident on the chart and has reached the end of it. The trader can gauge this through experience and practice. Let us understand the step by step procedure of the strategy with the help of an example.

Trade Setup

In order to explain the strategy, we have considered the GBP/CAD currency pair where will be analyzing the chart on the 4-hour time frame. In this example, we will be looking for ‘short’ trades by identifying a suitable 123 pattern in the currency pair, with the downtrend being our major trend.

Step 1

The first step of this strategy is only a recap of the previous strategy. It involves identifying the reversal of a trend by marking the 3 points and confirming the reversal of the trend. As we can see in the below image, we have marked all the points on the chart and identified the formation of the 123 patterns at the end of an uptrend.

Step 2

This is the crucial step of the strategy, where we only need to repeat the steps that were followed earlier to plot points 1, 2, and 3. The previous lower high or higher low becomes our point 1, the new support or resistance level from where the market reacts becomes 2nd point, and finally, the price that is between new point 2 and 3 from where the market starts moving in the direction of the new trend is the 3rd point.

If we carefully observe, point 3 of the previous step is our new point 1, labeled as 1′ in the below image. The new point 2 is labeled as 2′, and 3′ is our 3rd new point. In the example, we will be entering for a ‘short’ somewhere in the middle of the downtrend and not too late or too early.

Step 3

In this step, we enter the market with appropriate position size and risk evaluation. The entry is the simplest part of the strategy, where we enter the market right at the break of the support or resistance level. This level is nothing but our 2nd point.

Step 4

In this, we determine our take-profit and stop-loss levels for the strategy. As mentioned in the earlier section of the article, the risk to reward ratio will be lower as we are entering the middle of a trend. The stop loss is placed at the 3rd (3′) point, and the take-profit should be at the recent support or demand area that is a hurdle for the down move.

Strategy Roundup

This strategy is only an extension of the previous strategy, where we apply the same rules and steps once again. The difference is that the risk to reward ratio is lower, but we make sure that we are trading with the trend, which puts us in a safer position. Do not apply the strategy again on the same trend.

Categories
Forex Course

139. How Professionals Trade The Different Market States?

Introduction

In this series of different states of the market, we understood the terminology and the concepts involved. However, in the forex market, if we do not go practical, there is the least use to the concept. In other words, one must understand how to trade in the market, knowing its state. In this final lesson of the series, we shall dive deep into the topic and understand how to apply them in the market.

Trading a Trend

Trading a trending market is the simplest and safest way to trade in the market. This is because, in a trend, it is evident on which party is dominating the market. For example, in an uptrend, it is clear that the buyers are more powerful than sellers. And hence, we look for buying opportunities rather than selling.

In a trend, the market makes higher highs and higher lows. In other words, the market moves in one direction with temporary pullbacks in the opposite direction. These pullbacks (retracements) typically turn around to the original trend direction at the support and resistance levels. So, to trade a trend, we wait for the market to make a higher high / lower low and retrace to the S&R level, before triggering the buy or sell.

Consider the below chart of USD/CAD. The market is in a clear downtrend. The market made a new lower low by breaking below the grey ray. It then retraced back to the S&R area (grey ray) and is currently moving sideways. And this sideways movement in the market has high significance.

After the sellers made a new low, the buyers began to show up. They made it until the S&R level. And the market is currently in a range. As per the definition of a range, we know that there is strength from both the parties. In other words, the buyer who was temporarily dominating the market is slowing down as they are unable to make a higher high. And this price action is happening in the S&R area of the sellers. Therefore, we can conclude that the sellers are here to continue their downtrend.

One can enter when the price is at the top of the range (resistance) or when it starts to fall from the resistance. Placing the stop-loss few pips above the S&R level, and a take profit at the Low, is the safest approach to trade a trend.

Trading a Range

In a range, the market moves between levels – Support and Resistance. In this type of market, there is power from both buyers and sellers. Typically, the market shoots up from the support and drops from the resistance. However, randomly buying at support and selling from resistance is not the right way to trade a range like a professional. To trade a range with high odds in your favor, you must be aware of the overall trend. And you place your bets on the direction of the overall trend.

Consider the below chart of NZD/CAD. We can clearly see that the market is in a range. But, looking from the left, the market is in a strong uptrend, and the price is holding above the S&R level (grey ray). In the current market, we see that the price dropped below the bottom of the range, touched the S&R level, and shot right back up into the range. Thus, confirming that the big buyer is preparing to do the buys.

Since the price strongly reacted off from the S&R level and held above the support of the range, we can prepare to go long on the market. Stop-loss from this trade would be below the S&R level, while the target point would be at the top of the range. In hindsight, the buyers were able to push the market above than the resistance.

This brings us to the end of this series. We hope you found this lesson and the previous chapters interesting and informative. Stay tuned until we release our new set of lessons.

[wp_quiz id=”79656″]
Categories
Forex Fundamental Analysis

Knowing The Significance Of ‘Gross National Product’ Macro Economic Indicator

Introduction

The two most important metrics of economic growth are the Gross Domestic Product (GDP) and Gross National Product (GNP). Up until 1991 the United States primarily measured its economic growth in terms of the Gross National Product and switched to Gross Domestic Product to make it easy for comparison with other countries, since many other countries were measured through the same.

But in practice, it is always necessary to assess a country’s growth in both the GDP and GNP terms to better understand the overall economic output. Hence, GNP also forms an excellent fundamental indicator of economic growth, almost as important as the GDP.

What is the Gross National Product?

Gross National Product, also called GNP, is the total monetary value of all goods and services produced by the country’s residents and businesses, irrespective of the production location. It means a business earning revenue in a foreign land is included in the domestic country’s GNP. 

Gross National Product defines the economic output based on citizenship, or that country’s native people. Hence, a citizen having an extra income source in any monetary form overseas is factored into the GNP. GNP is higher for countries that have many of their businesses established in a foreign land. Accordingly, any output generated by foreign residents within the country is excluded out from the GNP.

Gross Domestic Product (GDP) v/s Gross National Product (GNP)

It is essential to understand the difference between GDP and GNP during our analysis. GDP and GNP both measure economic output for a given period but differ in how they define the economy’s scope.

Gross Domestic Product is the total value of all goods and services produced by the nation. Here, GDP limits its assessment to the nation’s geographical borders and does not take into account the overseas economic activities of its nationals.

GNP does not restrict itself to the geography of the nation but limits itself in terms of citizenship. GDP does not reflect determinant in nationality. As long as the finished goods and services are within the country’s borders, it is included. On the other hand, GNP will not include any of the domestic borders’ revenue if it is from a foreigner.

The formula for GNP is given as:

GNP = Consumption + Investment + Government + Net Exports + Net Income

In the above equation,

  • Net Exports stands for the difference between the revenue generated from Exports and revenue going out for imports.
  • Net Income stands for the income of domestic residents from overseas or foreign investments minus net income of foreign residents from domestic investments.

The GNP is very indicative of the financial well-being of a country’s nationals and its country-based multinational corporations. From a relative perspective, it does not tell us much about the country’s health, as the GDP does. GNP is a more realistic measure of a country’s Income than its production.

To clarify the role of each metric better, consider the below examples:

Microsoft is the United States-based multinational company. It has a branch in India. The revenue generated from the Microsoft-India branch will be included in the GNP of the United States, but not in India’s GNP. On the other hand, Microsoft-India’s revenue is not included in the GDP of the United States but is included in India’s GDP.

How can the Gross National Product numbers be used for analysis?

It is essential to understand that GNP does not reflect the domestic (geographical basis) conditions well. If a natural disaster were to occur within the United States, then the GNP would not be as affected as the GDP, as the foreign revenue by its residents would not depend on the domestic situations. Hence, GDP is a more accurate measure of economic activity. On the other hand, its citizens’ financial well-being is more accurately measured through GNP than GDP.

GDP is a measure of economic health, while GNP is a measure of a nation’s Real Income. Both are different but related. A country like China, where many companies from other countries have their business has higher GDP than GNP, on the other hand, the United States, which has many of its firms’ production houses outside its land, has higher GNP than its GDP. Significant differences between the GDP and GNP values can be accounted to the openness of the countries to International Trade and Global Markets.

Impact on Currency

The Gross National Product is itself susceptible to the currency and exchange rate. When the currency falls, the Gross National Product increases due to the strengthening of other countries’ currencies where the domestic firms are doing business. The health of the economy is not gauged by the GNP accurately. Currency movements are not as driven by the GNP as they are by the GDP. Hence, it is more critical as a financial indicator than as an economic indicator in our analysis.

It is a lagging and proportional indicator, and hence the impact of the GNP is not as pronounced as the GDP, as all other countries use GDP as their primary measure of economic health. Investors, economists, policymakers, and traders all use GDP primarily over GNP to assess the economy’s current health and direction. Hence, it is a low impact indicator of our fundamental currency analysis.

Economic Reports

For the U.S., the Bureau of Economic Analysis releases quarterly reports of the Gross Domestic Product, which contains the GNP information. The St. Louis FRED consolidates the same data and maintains it on its website.

Sources of Gross National Product

The St. Louis FRED website holds the GNP data that is very easy to access and analyze, and the link is here.

GNP data for various countries can be obtained here

Impact of the “Gross National Product” news release on the Forex market

In the above section of the article, we defined the Gross National Product (GNP) and described the analysis method. We will extend our discussion and understand the impact of the Gross National Product news announcement on the value of a currency. The GNP gives an estimate of the total value of all the final products and services rolled out in a given period utilizing production owned by a country’s residents.

The GNP includes personal consumption expenditures, domestic investment, government expenditure, net exports, and Income from foreign investments. A small distinction between the GNP and GDP is that GDP measures the value of goods and services produced within the country’s borders. In contrast, GNP calculates the value of goods and services produced by the country’s citizens only both domestically and abroad. However, GNP is also one of the most commonly used indicators for measuring the country’s economy.    

In today’s example, we will analyze the impact of the United Kingdom’s GNP on the value of the Great British Pound. The below image shows the GNP in the U.K. during the fourth quarter, which was higher than the third quarter. Let us find out the impact.  

GBP/USD | Before the announcement:

We will begin our discussion with the GBP/USD currency pair to observe the change in volatility after the news announcement. The earlier image shows the state of the chart before the news announcement, where we understand the market is in a strong downtrend, and recently the price seems to be moving upwards. This could be a possible price retracement that could lead to the continuation of the trend and an opportunity. 

GBP/USD | After the announcement:

After the news announcement, the market gets very bullish, and we see a sharp rise in the price. The positive reaction from the market is a result of the upbeat GNP data, which was better than expectations. This brought cheer among the market participants who took the price higher by strengthening the British Pound. We should not take any ‘short’ position until we notice trend continuation patterns in the market.

GBP/CAD| Before the announcement:

GBP/CAD| After the announcement:

The above images represent the GBP/CAD currency pair, where in the first image, we see that the market appears to be moving within a ‘range’ with the price currently at the bottom of the ‘range.’ Before the news announcement, the currency pair is very volatile, suggesting that there is a lot of trading action in this pair. In such high volatile environment, we recommend waiting for the news release and then taking a suitable position in the pair.

After the news announcement, the price suddenly moves higher and volatility expands on the upside. The bullishness in the British Pound is a consequence of the optimistic GNP data, which showed a growth in the economy during the fourth quarter. Since the price is at the bottom of the ‘range,’ one can take ‘long’ in this currency pair with a target until the ‘resistance.’

EUR/GBP | Before the announcement:

EUR/GBP | After the announcement:

The above images are that of the EUR/GBP currency pair, where we see that the market is in a strong uptrend before the news announcement, signifying the enormous amount of strength in the British Pound, since the currency is on the left-hand side of the pair. Depending on the outcome of the news and change in volatility, we will analyze the currency pair accordingly.

After the news announcement, market crashes, so much that the price goes below the moving average. The ‘news candle’ closes, forming a reversal candlestick pattern that could lead to the beginning of a downtrend. The volatility increases to the downside as the GNP data was reasonably good.

We hope you understood what ‘Gross National Product’ is and its impact on the Forex price charts. Cheers!

Categories
Forex Videos

Forex Fundamental Analysis For Novices – The Chicago Fed National Activity Index


Fundamental Analysis For Novices – The Chicago Fed National Activity Index 


Thank you for joining our educational video four fundamental analysis for novices. In this video, we will be looking at the Chicago Fed national activity index.


If you are new to trading, one of the most important aspects of a daily trading routine is to analyse economic data releases from the government’s around the world, which reflect the health of that particular nation’s economy. This data can be found on an economic calendar such as this one. Most brokers provide an economic calendar, and you should refer to it every day in order to avoid trading around times of possible extra market volatility surrounding the release of high impact economic data.


The most important aspects of the economic calendar are the time and date of the event, the impact value, which is typically low, medium, and high, and where a high impact event is more likely to cause extra volatility upon its release. The actual data, which is updated in the calendar at the time of the release and is usually subject to an embargo. The consensus – where available – which is the anticipated actual release as put together by economists and analysts, and also the previous data which is usually released weekly, monthly, quarterly, or annually.


As we can see, the Chicago fed national activity index for May will be released at 1:30 BST on Monday, June 22nd, and the impact level is medium and where there is no consensus value, but the previous value for April was – 16.74.


Some brokers’ economic calendars will provide a brief description of the event, and here we can see that the Chicago Fed national activity index, also referred to as the CFNAI on some calendars, Is released by the Federal Reserve bank of Chicago. It is a monthly index design to gauge overall economic activity and related inflationary pressure.

In fact, the CFNAI is actually a combination of 85 indicators covering areas such as housing, personal consumption, employment, unemployment, hours worked, income, production, factory orders, and inventories.
The index measures various aspects of overall macroeconomic activity and was designed by Harvard University. The idea being that all the data can be brought together in one single point in order that policymakers can have a more focused aspect for being able to forecast inflation within the US economy.

The index has an average value of 0 and a standard deviation of 1. Traders will be looking for a positive reading which will be considered as bullish and showing that the economy is improving, but if the value is negative, it implies that the US economy is contracting or in recession and is therefore seen as bearish.


Here we can see that from as early as the 1970’s the index has been fairly tightly confined to its zero-axis. However, for the year 2020, we can see a huge spike lower to the current levels of – 16.74 for April. Of course, this can only be associated with the coronavirus pandemic, and the terrible impact it is having on the United States economy.


Traders already realise that the economy is in a bad state and that the figure is going to be well below the zero-axis. And so there will be no shocks or surprises that the figure is going to be bad. They will be looking for how greatly the number will be with regard to its divergence from the release for May.

Therefore, a lesser minus figure will show that the economy may be bouncing back and may have hit the bottom with regard to the impact from the coronavirus pandemic, and this will be seen as positive or bullish for the economy and where you would find potentially an improvement in the exchange rate for the United States dollar against its counterparts and also an uptick in us stocks and indices.
However, should the minus figure be even greater in value you and the previous release, this will show that the worst is not yet over for the US economy, and we might find that the US dollar loses value against its counterparts and stocks and indices may fall as a result.
The higher the divergence from the previous month’s figure in either direction, the greater the risk of market volatility.

Categories
Forex Chart Basics

How to Establish a Trading Strategy Using Trend Lines and Channels

Introduction

On financial markets, the price moves basically in three types of trends identified as bullish, bearish, and sideways. Both trend lines as channels allow the “trend following” investor to recognize if the market’s direction changed or if the price action accelerated.

In this educational article, we’ll review how trend lines and channels can help establish a trading strategy.

Trend Lines and Trend Channels

In a price chart, the trend can be described as a price variation across time in a specific and identifiable direction. A trend is said to be bullish when the price creates a succession of higher peaks and higher valleys. On the contrary, in a bear trend, the price action tends to create a sequence of lower peaks and lower valleys. If the market runs in a consolidation stage, developing an overlapped structure, the price moves in a sideways or lateral trend.

When the price action develops an uptrend, the chart analyst projects the trend line connecting the lower highs sequence. In a bearish trend, it is customary that the projection links the lower highs sequence. The following figure illustrates how to trace a trend line. 

In the above figure, the 1-2-3 sequence represents the movement developed by the price action in an uptrend (left) and downtrend (right). When price breaks below (or above) of the trend line, as shown in (4), the price action reveals the potential change in the primary trend. The confirmation of this change comes determined by the retracement that experiences the price, which here tests the trend line and continues in the new trend’s direction, making a higher high.

Trend channels could be considered as a dynamic price range that follows the rhythm of a trend; this technical formation could be bullish or bearish. To draw a trend channel, it’s necessary three points, in an uptrend, two lows and one peak. The channel baseline is the trend line that connects the origin of the movement with the second low. The upper line will be the projection of the baseline traced from the peak between two lows as exposes the following figure.

In an uptrend, the breakout after the second low completion (see figure 01) provides a confirmation signal of the bullish trend continuation. This entry setup for the third movement has its potential target located at the upper line of the channel, acting as a dynamic resistance.

Phi-Channels

Phi-channels is a different type of channel and varies from the trend channel. The main difference with trend channels is that on Phi-channels, the guideline connects the extremes from the origin of the movement with the top of the move identified as 3. Then, parallel lines are projected, creating the channel, using point 2 to trace the channel’s parallel line, as shown in the next figure. 

The resulting projection provides potential turning points, which could offer entry setups combined with other technical tools.

Conclusions

In this educational article, we have seen the use of trend lines and channels that can help establish a trading strategy based on tracking the trend.

In general, the use of trend lines and channels is aimed at seeking to take advantage of the continuity of the trend over the turn of the market’s direction. In this sense, it is convenient to recall the Dow Theory principle, which states that a trend will remain in effect until there is confirmation of its change.

In this context, the use of Phi-channels provides potential areas where the price could react to continue the course of the primary trend, although its use should be supported with other analysis tools.

In the next article, we will look at how to apply the analysis tools to create trading signals.

Suggested Readings

  • Fischer, R., Fischer J.; Candlesticks, Fibonacci, and Chart Patterns Trading Tools; John Wiley & Sons; 1st Edition (2003).
Categories
Cryptocurrencies

What’s Aion All About?

Blockchain is a distributed ledger technology that’s immutable, decentralized, and transparent. Immutability means records that go on the blockchain can never be deleted, reducing fraud. Decentralized means that no single entity can censor operations and transparency, injecting a new level of accountability. These qualities make the blockchain a revolutionary tech that can change how organizations and even society itself does things.

This would already be possible if the current blockchain setup wasn’t so fractured – as blockchains exist and act independently. In a decentralized economy, blockchains across various sectors would be interoperable, allowing for the seamless transfer of data and value. 

Aion is a blockchain framework that wants to make this possible.

What’s Aion? 

Aion is a third-generation blockchain system whose goal is to facilitate blockchain interoperability. On the platform, both public and private blockchains can achieve three functionalities: scale, spoke, and federate. Aion is able to connect various chains but still maintain its own independent blockchain. 

The scale, spoke, and federate functions are the core offerings of the network. Below, we’ll take a look at what each means, and its implications for Aion and connected blockchains. 

What does Federate, Spoke, and Scale Mean? 

Aion envisages being “a networked, federated blockchain to integrate these separate spokes.” With these, it hopes to empower organizations to: 

#1. Federate – Aion implements a bridging mechanism to allow blockchains to send data and value amongst each other.

#2. Spoke – Provide customized solutions for blockchains

#3. Scale – Aion utilizes a high-performance virtual machine to enhance scalability.

Why is AION a Third-generation Blockchain? 

First-generation blockchains comprise the Bitcoin blockchain and others that were inspired by it. The problem with the first generation blockchains is they only allow the transfer of digital value, without the ability to put any conditions on those transfers. Also, these blockchains struggle with scalability. 

The second generation of blockchain was brought along by Ethereum, and it introduced the concept of smart contracts and decentralized applications. Smart contracts are contracts that are self-verifying and self-executing. They allow individuals to exchange value in a fraud-free, conflict-free, and publicly available manner. Since smart contracts are self-verifying and self-executing, they eliminate the bloat caused by the presence of intermediaries. Decentralized applications are a new kind of application that is free of any regulatory control or censorship.

Second generation blockchains prove to everyone that production could be used for more than transferring money. However, this generation proved to have its own problems. As interesting cases of these capabilities sprung up – with more users flocking in, this generation proved to lack the ability to handle massive transaction volumes. 

AION is a third-generation blockchain, courtesy of being a blockchain that’s part of a future where blockchains will operate in a hub and spoke model that’s a lot like the internet. 

Why Does Interoperability Matter? 

The interoperability of blockchains is incredibly important. Let’s see why. The current blockchain environment consists of blockchains acting independently of each other. It’s hard for Bitcoin to communicate with Ethereum and vice-versa. As a result, it’s hard to swap their respective cryptocurrencies directly with each other. 

This problem is currently solved by crypto exchanges. And that right there is the problem. Most of these exchanges are powerful, centralized entities that are nothing like the original idea of cryptocurrency: decentralized finance. On top of that, thanks to being centralized, these exchanges have a single point of failure, which means they have a single point of attack and are thus insecure. The countless incidents of exchanges hacking illustrate this well enough. 

Also, the current lack of interoperability means that blockchains cannot interact with traditional systems like banks. This kind of puts a damper on the dream to achieve mainstream adoption for blockchain. 

If we’re to realize a decentralized future, we’ll need to realize blockchain-powered entities that can communicate with each other. For instance, a hospital that has its medical records of patients on the blockchain will need to be interoperable with an identity system blockchain so as to automatically verify the identity of the patient. 

Who are the Participating Networks? 

A participating network is one that meets the requirements needed to be on-boarded into the Aion ecosystem. Aion-compliant blockchains meet the following conditions:

  • Are decentralized in some way and support procedures like atomic broadcasts and transactions
  • Can recognize and distinguish interchain transactions from regular transactions
  • Are aware of a consensus protocol utilized by the connecting bridge and  can store transactions that have been deemed valid
  • Can implement locktime to freeze up tokens/coins on the network if and when needed

What’s the Aion Virtual Machine? 

The Aion Virtual Machine (AVM) is a customized version of the Java Virtual Machine. AVM is designed to achieve high performance, robustness, and enable determinism. The AVM is customized to be able to execute chain logic in distributed networks. It’s also cushioned to withstand instances that are likely to arise in such scenarios. AVM’s implementation has the following properties: 

  • Performance – is able to use machine-friendly instructions to achieve a high-level performance.
  • Stability – achieved by utilizing an isolated sandbox environment, in which new features are tested before moving to the production environment
  • Determinism – which is achieved through a full-featured blockchain development kit as opposed to a regular software development kit
  • Backward compatibility – allowing for chain logic to always be executable as the machine evolves

5 Types of Users on the Aion blockchain

During the North American Bitcoin conference 2018, Aion founder Matthew Spoke talked about five kinds of users that can utilize the Aion network: 

#1. The Startup 

Many startups want to incorporate blockchain, but they have a knowledge gap when it comes to blockchain. With Aion, they can plug in and connect to blockchain-based solutions. 

#2. The Enterprise – Aion wants to connect the legacy world to the blockchain world and has dedicated massive resources to understanding what has kept these two apart.

#3. The DApp developer – these are developers who have been at the game using blockchains such as Ethereum and EOS but have been constrained to only one protocol. Aion will make it possible for them to switch across various protocols. 

#4. The Validator – these are people who take care of consensus in the Aion network.

#5. The Bridge Builders – these are people who are in charge of interchain transactions.

Who’s on the Aion Team? 

Nuco, an enterprise software company, is behind Aion. The company is involved in building secure and scalable blockchain solutions for many types of markets. The team’s led by Nuco CEO Matthew Spoke, who also sits on the board of the Ethereum Enterprise Alliance and is a fintech advisor for the Ontario Securities Commission.

CTO Jin Tu has 15+ years of experience in Enterprise Engineering and more than four years of experience in blockchain. 

The Aion Token

The Aion token is the native token for the AION network and secures the network, facilitates the creation of new blockchains, as well as monetizing bridges that connect various blockchains. The token is tradable and runs on the Ethereum blockchain. Once Aion launches its own mainnet, token holders will be able to convert them to the official Aion tokens. 

Where to Buy and Store AION

AION can be purchased from any of several exchanges – including Binance, BitHumb, Bitvavo, KuCoin, DragonEx, LATOKEN, and Bitfinex. 

As an ERC20 token, AION can be stored in any wallet that supports Ethereum. Great choices include: Parity, ethaddress, Guarda, Trust Wallet, and popular hardware wallets Ledger Nano and Trezor. 

What’s the Market Look Like for AION?

As of June 25, 2020, Aion traded at $0.101558, while ranking at #119 in the market. The token has a market cap of $43, 637, 697, and a 24-hour volume of $2, 206, 565, and a circulating supply of 429, 683, 147. Aion has an all-time high of $10.00 (Jan 07, 2018) and an all-time low of $0.040638 (Mar 13, 2029).

Final Words

If the world’s future economy is going to be decentralized, then the ability for blockchains to communicate and interact is non-negotiable. Aion is one of the initiatives leading the way in this regard, and with a brilliant team, the project should be able to register important milestones. The entire blockchain space is watching to see how it goes. 

Categories
Forex Daily Topic Forex Fundamental Analysis

Understanding ‘Retail Sales MoM’ Fundamental Forex Driver

Introduction

The Month-over-Month Retail Sales figures are one of the closely watched statistics in the financial markets and have a lot of volatility in the markets around these figures. An increase in sales is one of the earliest signs of growth for businesses that can imply a multitude of things for the economy. It is a closely watched high impact leading indicator. Hence, an understanding and analysis of Retail Sales are paramount for our fundamental analysis.

What is Retail Sales Month-over-Month?

Retail Sales

In the purest sense, it is just the dollar amount of purchase of goods and services made by end-consumers for a given period. Here, the period is MoM, which stands for Month-over-Month. It is the sale of durable and non-durable goods at the retail outlets to consumers.

It can also be defined as the purchase of finished goods and services by consumers and businesses. The goods and services have reached the end of the supply chain. The chain generally starts with the manufacturer or provider and ens up at the retailer where the general population or other businesses consume it.

The Retail Sales figures are often presented in two ways: including and excluding auto and gas sales. As the Auto (vehicle purchase) figures and Oil prices fluctuate frequently, the exclusion helps to identify the trends better once the volatile components are removed. The excluded version is called the Core Retail Sales report.

Retail Sales statistic covers the in-store (retail) sales, catalog sales, and out-of-store sales of durable (goods that last more than three years) and non-durable goods (that have short-life span). The major categories include:

Retail Stores have the following categories:

How can the Retail Sales MoM numbers be used for analysis?

The Retail Sales figures provide us a reliable measure of CURRENT economic activity. It is essential to an objective assessment of the need for and impact of a broad range of policy decisions. Hence, the policymakers use this statistic to keep a pulse-check on the economy’s health.

The Retail Sales figures are significant statistics for many as the Consumer Spending makes up 66% of the United States Gross Domestic Product. The remainder is from Government Spending, Business Spending, and Net Exports. It is also essential as it represents the end of the supply chain figures. All the statistics that precede the Retail Sales figures like Inventory Changes or Manufacturing Production figures all lead up to the Retail Sales, which confirms and triggers the next wave in the trend change in the other indicators, in a feedback loop.

In other terms, once Retail Sales figures improve, businesses see an increase in their revenue and correspondingly demand their products, which leads to an increase in their Manufacturing Production figures, and that would later translate to Change in Inventory statistics. So, we see how the Retail-Sales figure operates amongst the economic indicators in a feedback loop cyclical pattern.

Once Retail Sales figures improve, businesses see profits that encourage expansionary plans, that would increase investment in their business, employment, or even wage growth. It is necessary to understand, Sales improve business, once business improves, wage growth or employment increase is a possibility. Hence, the Retail Sales figure is an essential leading macroeconomic indicator for our fundamental analysis.

The US Bureau of Economic Analysis releases quarterly GDP statistics. If the Month-over-Month Retail Sales figures have been influential, then there is a good chance that the GDP print will be higher. The only downside to the Retail Sales figures that we need to be careful of is that it does not account for inflation, and the increase in the Retail Sales figures could also be a by-product of inflation.

To be noted: The Retail Sales figures are seasonal. It generally tends to increase around the holiday season. Hence, care must be taken during analysis that the decline in stats is due to a business slowdown or seasonal effects. In this case, the Retail Sales figures Year-over-Year is also another parameter that we can use to compare the current conditions with the preceding year to understand the growth trend better, as the GDP is also compared with the last year.

Although data is available in the seasonally adjusted format, to account for the seasonal patterns but it does not adjust for inflation. Hence, it is essential for users of the data to check for the seasonally adjusted figures.

Impact on Currency

Retail Sales is a leading macroeconomic high impact indicator. An increase in Retail Sales is the first sign of growth for businesses in monetary terms. Due to a multitude of economic factors that are affected by the Retail Sales figures, the volatility around the release of these figures is generally high.

It is a proportional indicator, meaning that a consistent or significant increase in the Retail Sales figures translates to increased profits for the businesses, indicates reasonable Consumer Confidence and Consumer Spending, and in turn it will also translate to increased employment, and wage growth. It is a cyclical effect that further promotes spending, and business booms and the economy prospers. It translates to higher GDP prints, which is appreciating for the currency.

Low Retail Sales figures are indicative of a slowdown of business, bearish Consumer Sentiment, where consumers are saving more and spending less. It stagnates the businesses, in the worst case, could lead to lay-offs, and ultimately recession. It will translate to lower GDP prints, which is depreciating for the currency.

Economic Reports

In the United States, the Census Bureau publishes monthly reports of the Retail Sales figures on its official website under the section “Monthly Retail Trade.” The report is released at 8:30 AM about two weeks after the reference month (13-15th day of the month). The schedule for the year is already posted on the website for the user’s convenience. The report details the total sales, percentage changes, and also YoY (Year-over-Year) changes.

Sources of Retail Sales MoM

  • The Month-over-Month Retail Sales statistics can be found here
  • Both advance estimates and Retail Sales figures are available in aggregated format in St. Louis FRED website here
  • We can find Retail Sales monthly figures for various countries here

Impact of the ‘Retail Sales – MoM’ news release on the Forex market

In the previous section of the article, we understood the Retail Sales economic indicator and its consequences on the economy. We will take this discussion forward in identifying the impact of Retail Sales on the value of the currency. Retail Sales is an important economic indicator because consumer spending drives much of our country.

When consumers spend more, the economy tends to hum along, whereas if consumers are uncertain about their financial future, they hold off their purchases that lead to the slow down of the economy. The release of Retail Sales numbers is said to have a large impact on the currency, as shown in the below image.

In this section, let’s analyze the Retail Sales data of the Unites States that was gathered in the month of March. The below image shows that there was a big drop in the Retail Sales compared to the previous month indicating a major disruption in the economy. Let’s see how the market reacts to this data.

USD/JPY | Before the announcement

We will start with the USD/JPY currency pair to witness the impact of the news announcement. The above image shows the state of the chart before the news announcement, where we see that the overall trend of the market is up, and currently, the price is on the verge of continuation of the trend. Depending on the impact of the news, we will position ourselves in the currency pair.

USD/JPY |  After the announcement

After the news announcement, there is a surge in the price, and volatility jumps to the upside. Even though the Retail Sales were very poor in the month, the market reaction was opposite to what was expected. After the news release, traders bought US dollars and strengthened the currency much more. The bullish ‘news candle’ shows the impact of the news on the currency. Since the market reacted very positively to the data, we should take a ‘buy’ trade only after a price retracement.

EUR/USD | Before the announcement

EUR/USD | After the announcement

The above images represent the EUR/USD currency pair, where we see that the market is in a significant downtrend indicating the great amount of strength in the US dollar. The price is currently is at its lowest point, which means we need a pullback in the market to join the trend. If the news announcement results in a retracement of the price, this could be taken as an opportunity for taking a ‘short’ trade.

After the news announcement, the market moves lower, and volatility increases to the downside. Although the Retail Sales data was weak, it did not result in weakening of the currency, but rather the US dollar strengthened. This means the news data was not bad enough to turn the markets to the upside. We will still be looking to enter the market only after a price retracement to a key technical level.

USD/CAD | Before the announcement

USD/CAD | After the announcement

The above price charts are of the USD/CAD currency pair, where we see that the market is aggressively moving up with almost no price retracement. This indicates the US Dollar is very strong, or the Canadian dollar is weak. In any case, we will join the trend only if the price retraces to a ‘support’ or ‘demand’ area.

After the news announcement, volatility expands on the upside, and the price closes, forming a bullish ‘news candle.’ Here too, the Retail Sales data has an opposite impact on the currency as the market reacts positively to the data even though the Retail Sales were largely lower in this quarter. It is advised not to chase the market after the news release since it against the rules of risk management.

We hope you understood Retail Sales MoM fundamental Forex driver and the relative impact of its news announcement on the Forex price charts. Cheers!

Categories
Crypto Guides

Some Of The High Profile Crypto Exchange Hacks You Must Know!

Introduction

Even though cryptocurrencies are secure, crypto exchanges are where hackers target to loot millions of dollars. No matter how big a cryptocurrency is with the hacks we have seen so far, the exchanges will inevitably be subject to hacks at some point in time. Even though it is 2020, almost ten years since the advent of bitcoin, the hacks have never been slowed down. This is why it is always advisable for the crypto investors to hold their assets in their personal wallets instead of storing them with the crypto exchange itself.

Let us look at some of the high-profile cryptocurrency hacks so far:

The Mt.Gox

Mt.Gox, a Japan-based cryptocurrency stock exchange, was the biggest and busiest of exchanges, with 70% of bitcoin transactions from all over the world was going in the platform back then in 2013-14. With cryptocurrency or cryptocurrency exchanges, there were no regulations. There were many loopholes in the company’s management, like there was no VCS, Version Control Software. The VCS mainly stores all the information of all the features, coding set up of a particular version of the software product.

Without proper VCS, we will not know what changes were made when and it would be practically impossible to go back to a particular version of the software if necessary. All the code changes were to be approved by the CEO himself, which is the biggest bottleneck. There was no testing policy; the developers develop code and deploy it without any particular testing, which is a disaster. All these underlying issues led to a massive hack amounting to $473 million worth of bitcoin in 2014, which eventually led to the closure of the exchange permanently.

The DAO Hack

Before the 2019 Hack of Ethereum classic, DAO hack was the major one in the Ethereum platform. DAO, Decentralized Autonomous Organization, is a smart contract that was supposed to revolutionize the platform. The DAO acts as a decentralized venture capital fund for all the future DAPPS getting developed in the platform. Anyone can buy DAO for some ether and gain voting rights for any proposed app developed in the platform.

If one doesn’t wish to vote any further or doesn’t want to contribute to an app they are not interested in, they can opt-out of DAO. The opting-out part is where the hackers aimed and hacked 50 million dollars in 2016. The opting-out function has been made recursive by hackers. Hence instead of returning the funds once, the system kept returning the funds until it was noticed and stopped. Due to this issue, Ethereum was hard forked into Ethereum and Ethereum Classic.

The Bitfinex Hack

The Bitfinex exchange for increasing the security and ease the transactions for the users came up with multi-sig wallets with the collaboration of Bitgo. Multi-signature wallets are such wallets that have multiple keys. One key is owned and stored by the company.  While the owner of the wallet has two keys, he may give one key to his trustworthy friend/relative, so that even he loses his key, he has a backup. Generally, the multi-signature wallets need two keys to operate.

These wallets are hot, and this additional security feature ironically led to the hack. However, there are many theories on how and why the hack happened. Bitfinex rose to limelight and gained the credibility back. $72 million worth of bitcoin was hacked due to which 20% of the value of each bitcoin was eroded.

Later we saw many hacks in different exchanges like Bithumb where $30 million worth of cryptocurrency was stolen. Coinrail was hacked for $37.2 million, BitGrail for $195 million, and Coincheck for $534 million.

Conclusion

While cryptocurrencies are no doubt safe, but one has to do their homework on the exchanges, they are transacting. Always store your cryptocurrency in your own hot/cold wallets. Crypto exchanges will always be targeted if they are doing business for very high value. They should voluntarily show the security measures they are taking to avoid any potential hack. No matter which cryptocurrencies one is trading with, due diligence on the exchange is first and foremost.

Categories
Forex Videos

Forex Position Size! The most crucial factor in trading!

Position Size: The most crucial factor in trading


Bob is an average guy that has seen the Forex markets as a way to get rich quickly. He has seen lots of accounts on copy-trading sites jumping from $1,000 to $1 million in less than one year and dreams about doing the same with his, but he lost it all in less than a month. Indeed it might be possible to raise an account from $1,000 to $1,000,000 in 12 months, but the odds of achieving that feat are low because the risk of bankruptcy is too high. Most people think they are smart but are mostly focused on forecasting the market. It is now natural to have the skills for position sizing decisions.

Even high intelligence does not help. Ralph Vince directed an experiment on position sizing utilizing forty PhDs. They were initially given $10,000 in a computer game with 100 bets having a 60% chance of winning each bet. The rules were that they would win or lose the amount they bet. The game had a clear edge for the players, but only 2 PhDs end up making money. The other 38 PhDs ended with less than the initial $10,000. The main reason for this result was that almost all the Ph.D. players risked too much money on each bet. The other interesting fact is that even when the game was profitable, almost nobody made money.
This result is what is typically found in the Forex markets. People start with a tiny account and want to obtain even double their initial funds every month. As a consequence, people apply extremely large position sizes that get their account wiped out at the first market turn against them.


Let’s say you have $4,000 in your account and risk $1,000 on each trade. A losing streak of four trades will wipe your account. Losing streaks are common in trading, and four losing positions in a row is a very common event. Even 10 to 20 consecutive losses are possible in some trading systems, that are quite profitable using appropriate position sizing, but deadly when overtrading.

This experiment shows that position sizing is the component of a trading system that allows the trader to optimize the profits. That means, from zero to one, there is an optimal fraction of the trading capital, which, when risked on each trade, will optimize the results of a trading strategy.


Of course, that optimal fraction may result in a max drawdown much higher than psychologically accepted by the trader. Thus, a limitation on the trade size should be set by this parameter.
The best description of what a proper position sizing strategy should do was written by Curtis Faith in his book Way of the Turtle: “the art of keeping your risk of ruin at acceptable levels while maximizing your profit potential.” If we combine profits and drawdowns into the concept of “trading objectives,” then, Position Sizing is the art of achieving the trading objectives.
Finally, the key goal any trader should aim at is to find a system with a positive edge and then trade it using position sizing levels that allow him to achieve his trading objectives.
In the following videos, we will explore several position sizing methodologies that will help forex traders optimize this crucial part of their trading profession.

Categories
Forex Course

138. How to Identify Potential Market Reversals?

Introduction

In the previous lesson, we discussed the concept of retracement and reversal. We also understood how they are different from each other. However, just knowing if the terminology will not help in the forex market. Being able to predict if the price is retracing or reversing is the name of the game because this will significantly bring down your losing trades and increase the number of winning trades.

Retracement or Reversal?

In technical analysis, there are several ways to predict if the market is undergoing a retracement or a reversal. Here are some of the ways to differentiate between the two.

Fibonacci Retracement

Fibonacci retracements are very popular in technical analysis space. They are based on a sequence of key numbers identified by Leonardo Fibonacci, a mathematician.

In technical analysis (trading), Fibonacci retracement is drawn by taking two extreme points on a price chart, which results in different levels or ratios – 23.6%, 38.2%, 50%, 61.8%, and 100%. These Fibonacci ratios are used by traders to determine possible support and resistance levels in the market. Typically, these are the level where the price tends to hold and reverse from the current direction. Having that said, the price does not hold at every Fibonacci level. It holds perfectly only when it is combined with the price action on the charts.

Consider the below chart of EURCAD. In the recent chart, we see that the market is in an uptrend. The grey ray represents the support and resistance level. After making a higher high, the price has retraced to the S&R level.

Now the question arises if this retracement is a pullback to the uptrend or a potential reversal. To figure this out, we shall apply the Fibonacci retracement to the chart.

In the below chart, we have incorporated the Fibonacci retracement onto the price chart. If we look at the same S&R level, we see that the price is also holding at the 38% level. Hence, this gives us double confirmation that the market is preparing to head north. And in hindsight, the price does make a higher high.

Market Transition

Traders, especially Price Action traders, study the movement in the prices to determine if the market is preparing for a possible reversal. If a market is going for a reversal, the market gives simple yet effective hints and clues about it. The violation from the definition of a trend is the clue that the market is possibly going to turn around for a reversal.

Let us consider the example of a reversal to the upside. Initially, the market will be in a downtrend, making lower lows and lower highs. But, when it retraces and tries to make a new lower low, it leaves equal low. This becomes our first clue on a market reversal. From the point of the equal low, it rallies up but fails to make a lower high.

Instead, it makes an equal high. These two hints are an indication that the price is not moving according to the definition of a downtrend, and there could be a possible reversal. To confirm the same, we wait for the price to make a higher low. If it does make a higher low, instead of a lower low, we can predict that the market is preparing to head north.

Below is a self-explanatory illustration for the above explanation.

Take the below quiz to check if you have got the concepts correctly. Cheers!

[wp_quiz id=”79321″]
Categories
Forex Basic Strategies

Trading The CAD/JPY Pair Using ‘Commodity Correlation Strategy’

Introduction

Oil is one of the largest commodities in the world that is traded heavily. The reason for high liquidity is that it is a basic necessity. It is needed to run factories, machinery, ships, and cars. Canada is one of the largest exporters of Oil, and it forms a major part of the total volume of commodities exported. Due to these reasons, Canada is positioned in the world’s top ten oil-producing nations, and as a consequence, it’s economy is severely impacted when oil prices decline. Many traders today predict the movement of the Canadian dollar using the price of Oil.

When oil prices rise, the Canadian dollar tends to strengthen. Similarly, when oil prices are low, the Canadian dollar tends to weaken. Japan, in contrast, is considered as the net importer of Oil. So, when oil prices rise, Japanese yen weakens, and when oil prices drop, Japanese yen strengthens. Many traders are not very comfortable trading Oil due to the volatility it possesses.

An alternate and improvised way trading oil directly would be to utilize knowledge of oil prices to trade the CAD/JPY currency pair. As Canada is the net exporter and Japan is the net importer of oil, oil price becomes a major indicator for the movement of the CAD/JPY currency pair. That is why we have named this strategy a ‘Commodity Correlation Strategy.’ Let us dive into the strategy and explore the steps involved.

Time Frame

The commodity correlation strategy works well with the daily (D) and weekly (W) time frame charts. Swing trading is the most suitable trading style for this strategy as it has a long-term approach to the price. Therefore, the strategy cannot be used for day trading or on 4-hours’ time frame chart.

Indicators

We use just one technical indicator in this strategy, and that is the Average True Range (ATR) to set the stop loss for the trade. We don’t use any other indicator during the application of the strategy. If one is not familiar with the ATR indicator, it is recommended to refer our article on ATR before understanding the strategy.

Currency Pairs

This strategy can be used with CAD/JPY currency pair only, with the movement of oil prices as our leading indicator.

Strategy Concept

The price movement of crude Oil is used as a reference to catch a ‘trade’ in CAD/JPY currency pair. Key levels of support and resistance on the crude oil chart are used to spot long and short opportunities in CAD/JPY pair. If price closes above resistance on the oil chart, a long trade is activated on the CAD/JPY the following day. Similarly, if the price closes below support on the oil chart, a short trade is triggered on the CAD/JPY the following day. The risk to reward of trade taken based on this strategy is a minimum of 1:2, which is above normal. A bigger target can be achieved by allowing the trade to run.

Trade Setup

In order to explain the strategy, we focus on the price chart of crude Oil and CAD/JPY currency pair. We are not concerned with any other forex pair. The strategy can be easily understood by those who have basic knowledge of support and resistance.

Step 1

Firstly, we need to open the chart of crude Oil and then find key levels of support and resistance. After marking support and resistance levels, we wait for a breakout or breakdown of the range. After the breakout happens, make sure that the breakout is real and a faker. A close candle well above the resistance area gives us a confirmation of the breakout, and thus we can expect a continuation of the price in the direction of the breakout.

The below image shows how the breakout should be along with the confirmation candle.

Step 2

Now, we need to open the chart of CAD/JPY currency pair and locate the price on the day when the breakout took place on the oil chart. Since the breakout on the oil chart is above the resistance, we will ‘long’ in CAD/JPY currency pair after a suitable confirmation sign from the market. A bullish candle on the next day is the confirmation signal for going ‘long.’ In a case of a breakdown below the support, a bearish candle in the CAD/JPY pair on the next day of the breakdown is suitable for going ‘short’ in the pair.

In the above example, we see the formation of a bullish candle on the following day, which triggers a ‘buy’ trade. Let us see what happens further.

Step 3

In this step, we determine take-profit and stop-loss levels for our strategy. The stop loss for this strategy is calculated by multiplying the value of ATR by 2. The stop loss is placed by the number of pips obtained after performing the calculation. The take-profit is placed at the price where the risk to reward of the trade will be at least 1:2. However, in most cases, the trade has the potential to provide move higher.

In this example, the risk to reward of the trade was 1.5 as the major trend was down.

Strategy Roundup

Using the Commodity Correlation Strategy, traders can take advantage of the positive correlation between Crude oil prices and the CAD/JPY currency pair. This strategy is especially suitable for traders who want to trade in Oil but do not enjoy the volatility associated with it. This strategy is also suitable for traders who do not have the time to day trade and prefer long-term positions in the pair.

Crude Oil has the highest correlation with CAD and JPY Forex pairs. Hence we have considered these asset classes. You can use this strategy for different Forex pairs depending on which commodities they are correlated with. We hope you found this strategy informative. All the best.

Categories
Crypto Videos

LocalBitcoins Darknet Transactions Dropped 70% Since Enforcing KYC

LocalBitcoins Darknet Transactions Dropped by 70%

LocalBitcoins, one of the largest peer-to-peer cryptocurrency exchanges, has made significant improvements towards ensuring the safety of its users, which resulted in an over 70% decrease in darknet market transactions between September 2019 and May 2020.

Jukka Blomberg, CMO at LocalBitcoins, said that the drop comes because of the Anti-Money Laundering and Know Your Customer regulations that were adopted by the platform in September 2019.

The calculations regarding darknet transactions are based on blockchain analysis done by major crypto analytics firm Elliptic as well as in-house “clustering tools.”

A true 70% drop, or just a play on words?

Increase Your Customers or Business Process as Concept

A 70% drop in transactions associated with the darknet might sound better than they actually are, as LocalBitcoins experienced a massive decline in the sheer amount of traded Bitcoin in 2019. Their weekly Bitcoin trading volumes collapsed from nearly 14,000 BTC in January 2019 all the way down to about 4,000 BTC in January 2020.
However, LocalBitcoins saw only a 20% decline in BTC trading volumes between September 2019 and May 2020, making the 70% drop, as they say, still notable.
LocalBitcoins seeing healthy growth in the recent months
LocalBitcoins has reportedly seen an increase in popularity in the past 2-3 months, which may be a result of it being a safer environment to operate in.
LocalBitcoins said that the new customer registrations had surged over 50% just since the start of 2020 — counting from around 4,000 new daily sign-ups to now- over 6,000.

Some crypto analysts, however, maintain their view on LocalBitcoins as a place that facilitates a large number of illicit financial transactions.
CipherTrace published a report showing that LocalBitcoins received over 99% of the criminal funds among all Finnish exchanges in the first five months of 2020. As a Finnish company, LocalBitcoins works with Finnish authorities in regard to crypto regulations.

Categories
Forex Signals Forex Videos

Free Forex Signals App! – Forex Academy’s FA Signals App Now Available For Android & IOS

Welcome to our Forex Academy Signals app!


It is a pleasure to announce the FA signals app! Available in iOS and Android, the FA Signals app is a terrific complement to our Forex Academy Signals service, that started on March 20 and which has currently accumulated a total of 3,319 pips and 68.53% winning accuracy.

The FA Signals app will allow our users to get timely signal notifications for them to profit from our pro approach to trading. In this article, we will explain the symbols and working of the app so that you can benefit from it.

The app was devised as a notification tool; therefore, it is quite simple. But we wanted to pack as much information as possible in it, so we created specific icons to compress the information and make it available at a glance.

In the figure below, we can see the main layout of the FA Signals app. We can see a series of icons on the left column that explain the type and direction of the trades. The top of the app shows the legend:

Spot Buy: Buy at the current price
Spot Sell: Sell at the current price
Pending BL: Pending order, Buy Limit
Pending SL: Pending order, Sell Limit
Pending BS: Pending order, Buy Stop
Pending SS: Pending order, Sell Stop

We see also that the app has two tabs: Primary Info and More Info. In the primary Info tab, we have packed the needed information to make the trade:

Assets: The Forex Pair that is the subject of the trade
Entry: Entry price. This value can be the spot price at which the entry has been taken, or, in Pending orders, the limit or stop level at which the order should be placed.
Stop: The stop-loss level
Target: The Take-profit level
Pips: the current pip count of the live and closed trades. In a green rectangle, the pips are gains, in a red one, losses.

The More info tab shows the following information:
Assets: The Forex Pair that is the subject of the trade
Exit Price: The price at which the trade was closed or blank in the case of live signals
Exit Date: The date and time of the close
Method: This is a link to our article explaining the trade setup. We recommend our traders to look at the articles because not only is it a practical lesson on trading, but we also give detailed information on the risk and reward figures of every trade. Position size is critical to succeeding in the Forex markets; thus, it is an integral part of our trade reports.

R/R: The reward/risk ratio of the trade.

Finally, at the top of the page, we present our current total stats: Pips:3,319.99, the pip balance of our trades since the beginning. Gainers: 69.53% the percent gainers since the beginning.

How does this work?

You will receive notifications on new signals, modifications of a live signal, and the close of the signal. The closing will occur by reaching the target, by manual closing, or if the price hits the stop loss. If you follow the instructions, you would have set the stop and target levels at the beginning of the trade; thus, you need only to take care of the modifications and manual closing of a signal.
When you receive a notification and click on it, the app will open and show the referred signal highlighted, so it is more easily identified. By touching the highlighted signal, you acknowledge the notification and will be de-highlighted. Therefore, we recommend that you do that after doing your mods.

We wish you successful trading, helped by our integral signal service. But, please take this as an opportunity to learn and be self-sufficient. Our philosophy is not to give signals, but to help you achieve your own by learning through practical examples, which are supported by our vast educational resources.

Categories
Forex Basic Strategies Forex Daily Topic

Stop Hunting – The Strategy That Is Used By Most Of The Investment Banks

Introduction

Currently, there is a strategy that is followed by most investment banks around the world, and that is known as Stop Hunting. It attempts to force some market participants out of their positions by driving an asset’s price to a level where many retail traders set their stop-loss orders. The triggering of many stop losses at once generally leads to high volatility, and this can present opportunities to some smart traders who seek to trade in such an environment.

The fact that the price of a currency pair can experience sharp moves when many stop losses are triggered is exactly why many traders engage in stop hunting. Traders who are aware of this fact and have observed this phenomenon of the market try to make of this opportunity by being patient and conservative. The strategy we will be discussing today takes advantage of this sudden rise in volatility due to what is known as ‘stop-hunting.’

Timeframe

The beauty of this strategy is that it can be employed on all timeframes. However, it is not recommended in extremely small timeframes as there is a lot of noise in those timeframes, which may lead to confusion and misunderstanding. Hence, if one wants to profit greatly from this strategy, he/she should trade in 15 minutes or a higher time frame.

Indicators

We will be using just one technical indicator, and that is ‘Simple Moving Average (SMA)’ with 5 or 10 as it’s period. No other indicators are used in this strategy.

Currency Pairs

The strategy is suitable for trading in all currency pairs, including major, minor, and some exotic pairs. However, illiquid currency pairs should be avoided as the price action patterns are not reliable in these pairs.

Strategy Concept

In this strategy, we will be using the concept of previous highs and lows instead of support and resistance to act as our reference points. This is easy to understand and easier to spot in a chart. We will then anticipate these highs and lows as our support and resistance areas, which could break out of. Lows on a price chart are points where the price found support and started to go up.

In other words, this is a price point where there were ready sellers. When price revisits that area, sell orders get triggered, and the price starts to fall. However, during a breakout scenario, the momentum of the price is so much that it breaks the previous high and continues moving south. The Opposite is true for the breakdown of previous lows.

At times it is seen that even when the previous high or low is broken, the price doesn’t always continue in the direction of the breakout or breakdown. The price immediately retreats and bounces off the high or low. We will call these scenarios as fake-out or ‘stop-loss hunt.’ When price retraces back immediately, there is a high chance that it will continue in the same direction, at least until the latest hurdle. Let us explore the steps of the strategy.

Trade Setup

To explain this strategy, we will consider the EUR/USD currency pair and find a trade that fulfills all the criteria of the strategy. In this example, we will be analyzing the 1-hour time frame chart and look for appropriate price action patterns in the pair.

Step 1

The first step of the strategy is to look for highs and lows from where the market has traveled a fair amount of distance. Spotting for such areas in the direction of the major trend is preferred as the risk is lower in such trade setups. For instance, look for buying opportunities at lows of an uptrend and selling opportunities at the highs of a downtrend. This step is very important from a risk aversion point of view. Thus, one should give a lot of importance to this step of the strategy.

Step 2

The next step is to look for a fake-out price action pattern at the low, marked in the previous step. This is the first confirmation that buyers or sellers have come back into the market, and the banks have cleared out all the strategies that were placed below the low and above the high.

The below image shows how the price goes slightly below the previous low clearing all the stops of retail traders, and the last candle closes with a great amount of bullishness.

Step 3

In this step, we see where we take an entry in the market. We take an entry right after the price starts moving higher or lower and closes above or below the simple moving average (SMA), respectively. Conservative traders can wait for the price to retrace to the SMA and then take an entry while aggressive traders can enter right at the close of the candle.

The arrow mark in the below image shows that the entry is made at the close of the second bullish candle after the fake-out.

Step 4

We have one take-profit and one stop-loss point for this strategy where we take profit at the high or low as we had marked in the first step of the strategy while stop loss is placed below or above the low and high, respectively. If one is trading in the direction of the major trend, he/she can take profits at new highs or lows. However, one needs to be conservative while taking counter-trend trades.

Strategy Roundup

Stop-loss hunts are becoming as common as breakouts. By including this strategy in our trading arsenal, we will have something that we could use when we notice such patterns in the market where other traders are looking for breakouts. In this strategy, we have put a significant amount of stress on price action, which makes this strategy very reliable and consistent. One can use trailing stop-loss to protect their profit even when the target isn’t reached. All the best!

Categories
Forex Course

137. Differentiating between a Retracement and a Reversal

Introduction

Broadly speaking, there are three states in the market – trend, range, and channel. If we were to go a little more in detail, a market has components like retracement and reversal. Identifying and differentiating between a retracement and reversal is a skill in itself. In this lesson, let’s go and understand what these terms mean and how to differentiate them.

What is Retracement?

Retracement is the terminology usually associated in a trending market. We know that in a trending market, the price moves in one specific direction. For instance, an uptrend is defined as a sequence of higher highs and higher lows. As per the definition of an uptrend, the prices do not keep moving higher and higher continuously.

After trending up to a certain point, the price temporarily moves in the opposite direction. This movement against the original trend is referred to as retracement. Technically, the price action from a higher high to the higher low is called a retracement.

Uptrend Example

Downtrend Example

What is a Reversal?

A reversal can be defined as the overall change in the direction of the market. A market can reverse from an uptrend to a downtrend, or from a downtrend to an uptrend.

Reversal to the Upside

In this type of reversal, initially, the market trends in a downtrend making lower lows and lower highs. Later, the market goes into a transition state where the price typically ranges for a while. In other words, the price stops making lower lows and lows highs. Instead, it makes equal lows or higher lows. Finally, the market starts to trend north by making higher highs and lower lows.

Reversal to the Downside

This reversal happens when the market transits from an uptrend to a downtrend. In an uptrend, the price makes higher highs and higher lows. But, when the trend begins to diminish, the higher highs turn into equal highs, and higher lows start to become equal lows. Finally, when the seller’s pressure comes in, the price begins to make lower lows and lower highs, forming a downtrend. Thus, the complete scenario is referred to as a reversal.

Predicting a possible reversal or retracement in the market is pretty challenging. If you’re stuck in a position and unsure if it is a retracement or a reversal, you may try the following options to manage the trade:

  • Hold onto your positions by keeping the stop loss as it is. If it is a retracement, you can ride the trade, else get stopped if it is a reversal. This is the simplest approach.
  • If you are more inclined towards a reversal than a retracement, then you may close your positions. Based on where the market breaks through, you can look for re-entry. But, you might have to compromise on the risk: reward.
  • You could close the entire position and stay away from the pair and look for other opportunities. This is the safest option possible, especially for conservative traders.
[wp_quiz id=”79176″]
Categories
Forex Assets

Asset Analysis – Trading The Natural Gas Commodity Asset

Introduction

Natural gas is a soft commodity that is extensively traded in the market, like Crude Oil. The price changes every moment, as it is publicly traded on an exchange. The price of natural gas is determined by supply and demand in the physical market, as well as the demand and supply from the traders in the online market.

Understanding Natural Gas

Trading natural gas in the online market is speculating the short-term price fluctuations. Buying natural gas is only an electronic transaction and does not mean the physical purchase of the commodity.

There are several ways to trade natural gas in the online market. One of the heavily traded ways is through futures contracts. A futures contract is a contract (agreement) to buy or sell an asset at a future price.

Chicago Mercantile Exchange (CME Group) is the route through which nature gas futures is traded. There are many types of natural gas and its contracts that can be traded. However, the most traded contract is the Henry Hub Natural Gas Futures (NG).

Each contract of NG represents 10,000 million British thermal units (mmBtu). In the futures exchange market, NG fluctuates with a minimum of $0.001. In other words, a $0.001 price movement in NG represents one pip (tick). Like pip value in forex, the tick value of NG is $10. For every tick in price, a trader will see a $10 change in P/L.

Natural Gas Specification

Fees Associated with Natural Gas Futures Trading

There are different types of fees involved while trading natural gas futures. Typically, there are four basic fees that a brokerage charges for every futures contract traded:

  • Exchange/Clearing fees
  • National Futures Association (NFA) fee
  • Data fees
  • Brokerage commissions

The types of the fee listed above are either charged “per side” or “round turn” basis. Also, it varies from broker to broker.

Trading Range in Natural Gas

A trading range represents the price fluctuations in natural gas in different time frames. Similar to pips in currency pairs, the price movement in natural gas is represented in ticks, where each tick is an increment of $0.001.

Procedure to assess Pip Ranges

  1. Add the ATR indicator to your chart
  2. Set the period to 1
  3. Add a 200-period SMA to this indicator
  4. Shrink the chart so you can assess a significant period
  5. Select your desired timeframe
  6. Measure the floor level and set this value as the min
  7. Measure the level of the 200-period SMA and set this as the average
  8. Measure the peak levels and set this as Max.

Cost as a Percent of the Trading Range

Cost a percent of the trading range is the depicts the variation in fees on the trade-in different time frames for varying volatility. It is simply the ratio of the total fee and the tick values.

Total fee (per contract) = $50 (5 ticks) [approx. fee]  

Trading the Natural Gas

Natural gas is heavily traded in the futures market. It is a soft commodity like Crude Oil and is quite popular in the commodity space. Traders speculate on natural gas using both fundamental and technical analysis. The fundamentals of NG vary from that of other commodities, while the technical analysis works perfectly the same as any other asset. The fee structure, too, is pretty different from that of currency pairs, as it is mostly traded in the futures market. However, the total fee is more or less the same.

Understanding the fee variation

The fee is something that varies relatively with the change in time frame and volatility traded. In essence, a trader trading the 1H time frame will have to pay relatively more fee than a trader speculating on the 4H. Due to this, the percentage values are higher on the 1H time frame than the 4H time frame.

Likewise, the relative fee is higher when the market volatility is at the minimum values, even though the time frame remains the same. So, to efficiently manage the fee, one must trade during the times when the market volatility is at or above the average values.

Categories
Forex Fundamental Analysis

The Impact Of ‘GDP Constant Prices’ News Announcement On The Forex Market

Introduction

GDP Constant Prices is the primary indicator used by Government Agencies, Economists, Investors, Traders for year-to-year analysis of economic progress. GDP Constant Prices is the real scorecard for a country’s progress. 

It is a national level indicator and is closely watched by the market. The most important fundamental indicator Real GDP Growth Rate is derived from GDP Constant Prices. Hence, overall it is very critical for us to understand GDP Constant Prices and its nuances for correct interpretation.

What is GDP Constant Prices Indicator?

Gross Domestic Product (GDP) 

GDP is the measure of a country’s total economic output. It is the total monetary value of all the goods and services produced within the country regardless of citizenship (resident or foreign national).

Nominal GDP is also called Current Dollar GDP. It is the market value of all the finished goods and services within a nation’s geographical borders for a given period. The period is generally a quarter (3 months) or a year.

The commonly used term “size of the economy” refers to this economic indicator. USA has the world’s biggest economy, which means it has the highest nominal GDP or highest economic output.

GDP Constant Prices

It is the inflation-adjusted GDP value. It is the total monetary value of all goods and services produced, excluding the effects of inflation in prices. It is also called Real GDP, Constant Dollar GDP, Inflation-Corrected GDP, or only Constant Prices. The raw value of the economic output is called the Nominal GDP, whereas Real GDP accounts for inflation effects and is a more accurate measure of growth.

GDP Constant Prices or Real GDP is obtained by dividing the Nominal GDP with a GDP deflator. The GDP deflator is an inflation measurement from a fixed base year. Real GDP is inflation-adjusted to compare on an as-if basis with the base year GDP. It means GDPs are compared as if the prices remained the same as the base year and see if the GDP has improved due to increased economic activity.

Calculating GDP Deflator is a bit tedious process, that is best left to the experts like the Bureau of Economic Analysis. The Real GDP is made up of the following components and is affected by them:

A) Consumer Spending: It represents spending associated with the end-consumers or the general population. It makes up about 69% of the total GDP in the United States.

B) Business Investment: Economic Output of the Business Sector makes up 18% of the total GDP in the United States. 

C) Government Spending: It involves all the expenditures incurred by the Government to maintain and stimulate economic growth and run its operations. It accounts for 17% of the total economic output for the United States.

D) Net Exports: It is the difference between the total exports and imports. The United States has a -5% Net Exports of the total GDP, meaning it is a net importer.

How can the GDP Constant Prices numbers be used for analysis?

Inflation is the underlying fire that drives capitalist economies. In general, a low inflation rate of 2-3 % a year is good for the economy. A stable inflation rate of 2-3% will stimulate economic growth to achieve a 3-5% annual GDP growth for developed economies.

As prices increase year-over-year, the economic output will also seem inflated even though it is the same as the previous year. Hence, Real GDP is a more accurate measure of scoring the economic output of a country.

Nominal GDP is useful when comparing economic output within a year among different quarters, while it is more sensible to use Real GDP for year-over-year comparison. Policymakers use both Nominal and Constant Prices GDP for economic assessment and implementing policy reforms as deemed necessary.

When inflation is positive (which is the cast most of the time), the GDP Constant Prices will be lesser than Nominal GDP. When there is deflation in the economy (during slowdowns or recessions), the GDP Constant Prices may be higher than the nominal GDP value.

GDP Constant Prices is better for assessing long-term growth, or knowing whether the economy has grown over the previous year or not. With Nominal GDP, it is difficult to tell whether an increase in the figures is due to an expanding economy or just a factor of inflating prices of goods and services.

Impact on Currency

GDP data is essential for almost everyone. Economists use for macroeconomic analysis and Central Bank planning. Policymakers are committed to maintaining a steady Real GDP Growth. Hence, Central Authorities also watch it tightly.

Investors make decisions based on GDP data. Businesses hold their expansion plans based on economic stability and market stability, as indicated by GDP. Traders heavily trade once GDP estimates and actual figures are published.

Hence, overall it is a high impact indicator. It is a proportional macroeconomic indicator, meaning higher GDP Constant Prices are suitable for the overall economy and currency. The opposite also holds. 

Lower Real GDP prints indicate weakening economy, businesses hold hiring or investment plans, spending is reduced, and in extreme cases, it can lead to a recession. All of this leads to currency depreciation.

Economic Reports

In the United States, the Bureau of Economic Analysis publishes quarterly and annual Nominal and Real GDP reports on its official website. It is released almost 30 days after a quarter ends. The schedule of release is available on the website. The headline number is the GDP Constant Prices figure, GDP Growth Rate figure.

Major international organizations like the World Bank, International Monetary Fund, OECD, etc. actively maintain track of most countries’ GDP figures on their official website.

Sources of GDP Constant Prices

For the United States, the BEA reports are available here 

The St. Louis FRED keeps track of all the GDP and its related components in one place on its official website here:

GDP & GNP – FRED

Real GDP – FRED

The World Bank GDP Constant Prices with base year as 2010 in US Dollar terms are available here:

GDP Constant Prices (2010 US$) – World Bank

OECD – GDP Constant Prices and other variants

We can find a consolidated list of most countries’ GDP Constant Prices here.

Impact of the ”GDP Constant Prices” news release on the Forex market

GDP Constant Prices, also known as real GDP, is a measure of GDP that has been adjusted for the price level. Current prices measure the GDP using the actual prices we notice in the economy. Current prices make no adjustments for inflation. However, constant prices adjust to the effects of inflation. Using persistent prices enables us to measure the actual change in the outcome and not just rise due to inflation’s effects. The real GDP is calculated by dividing nominal GDP over a GDP deflator. When nominal is higher than real, inflation is occurring, and when real is higher than nominal, deflation is occurring. Fundamentally speaking, nominal GDP matters to investors when taking a position in currency or the stock market.      
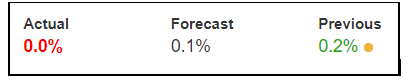
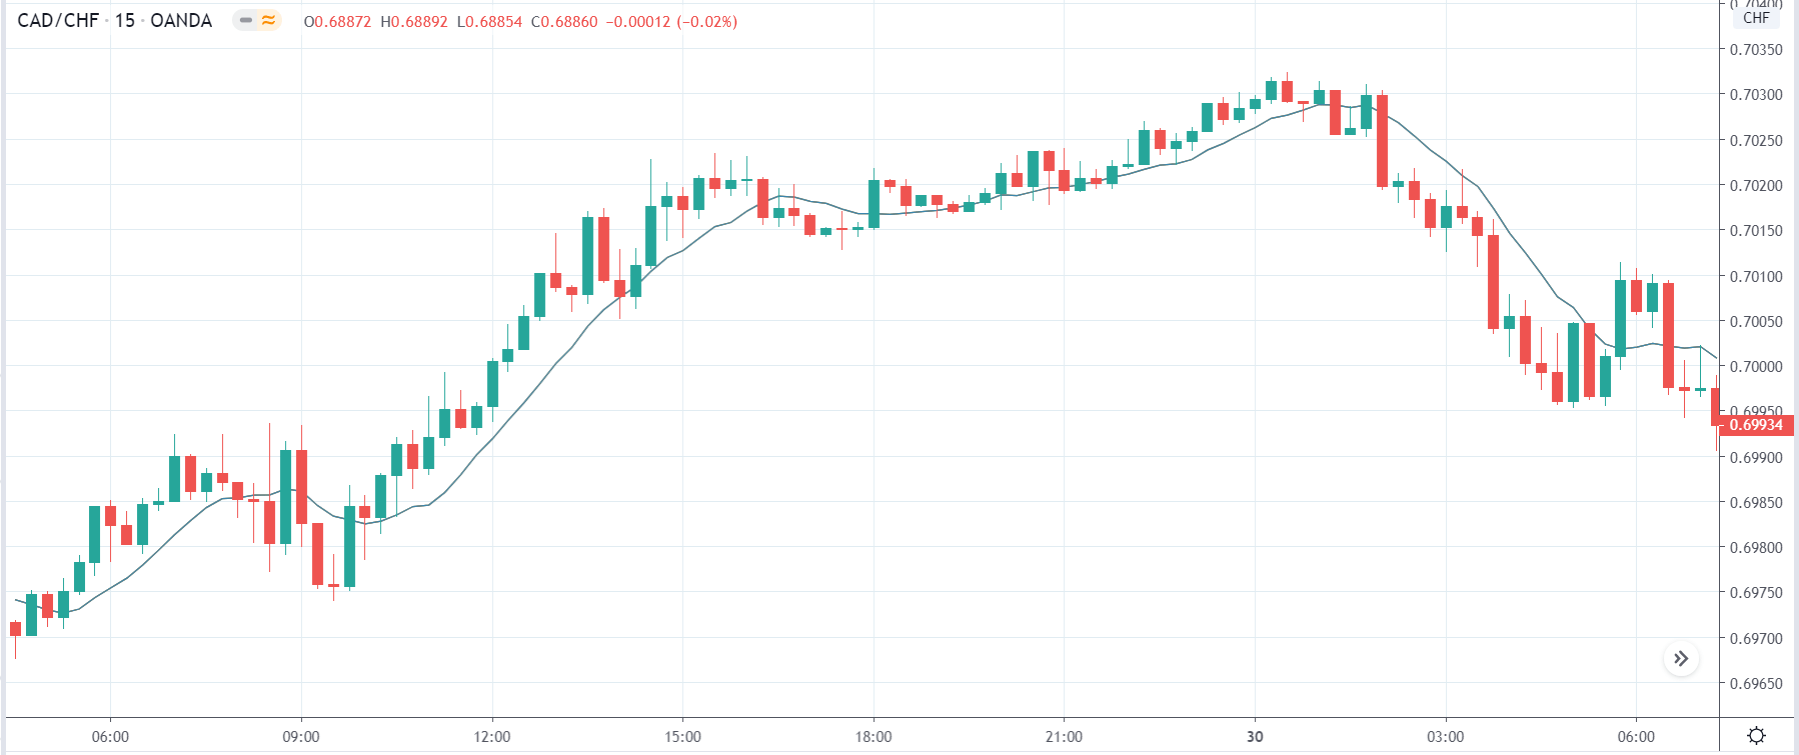
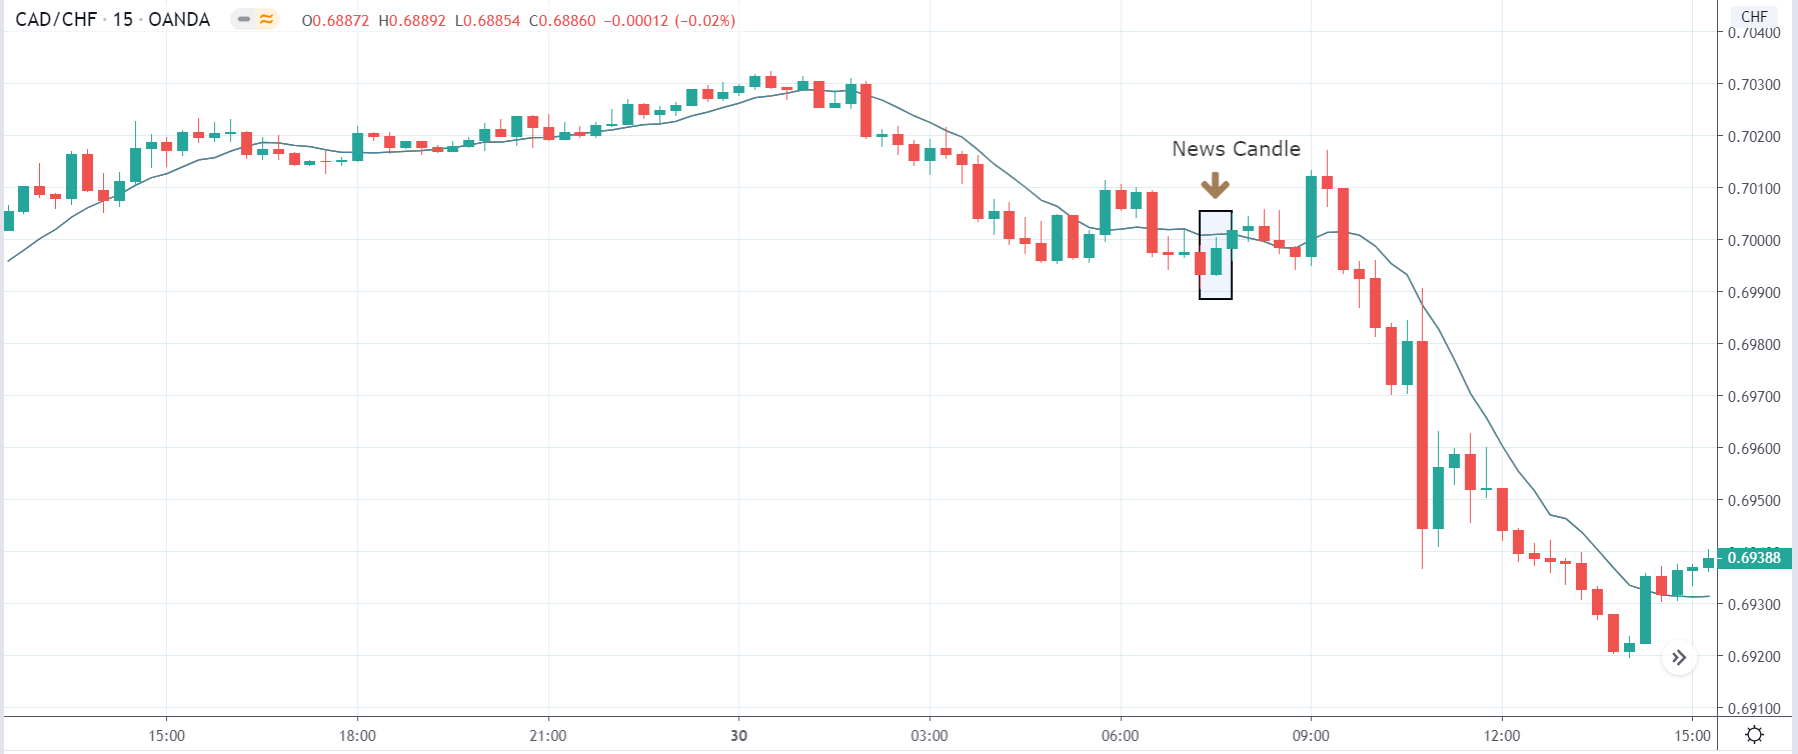
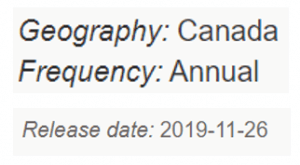
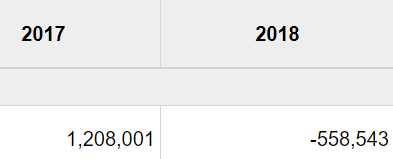
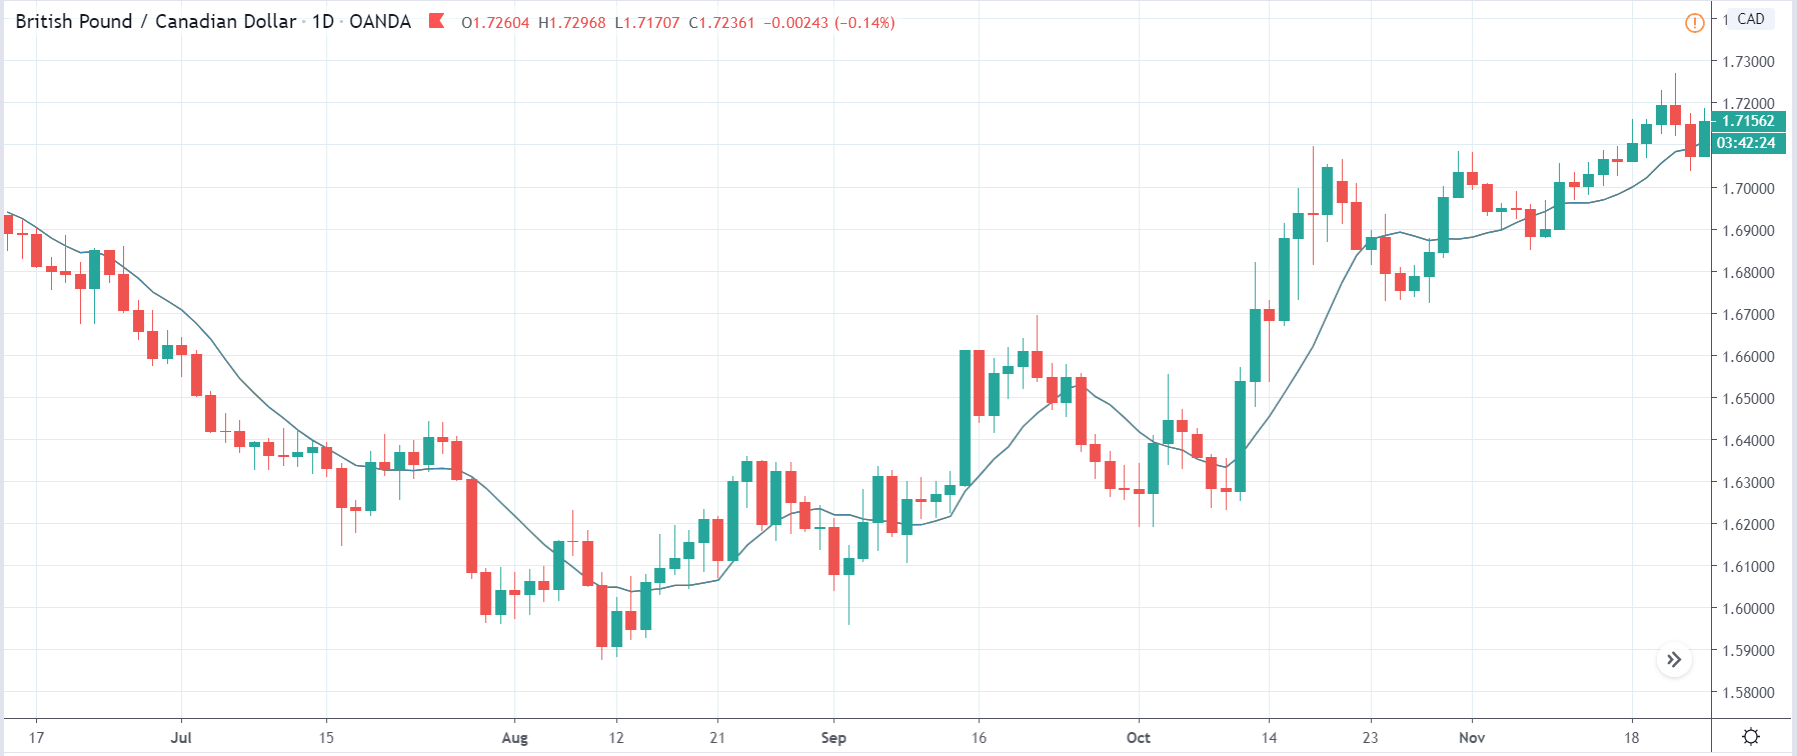
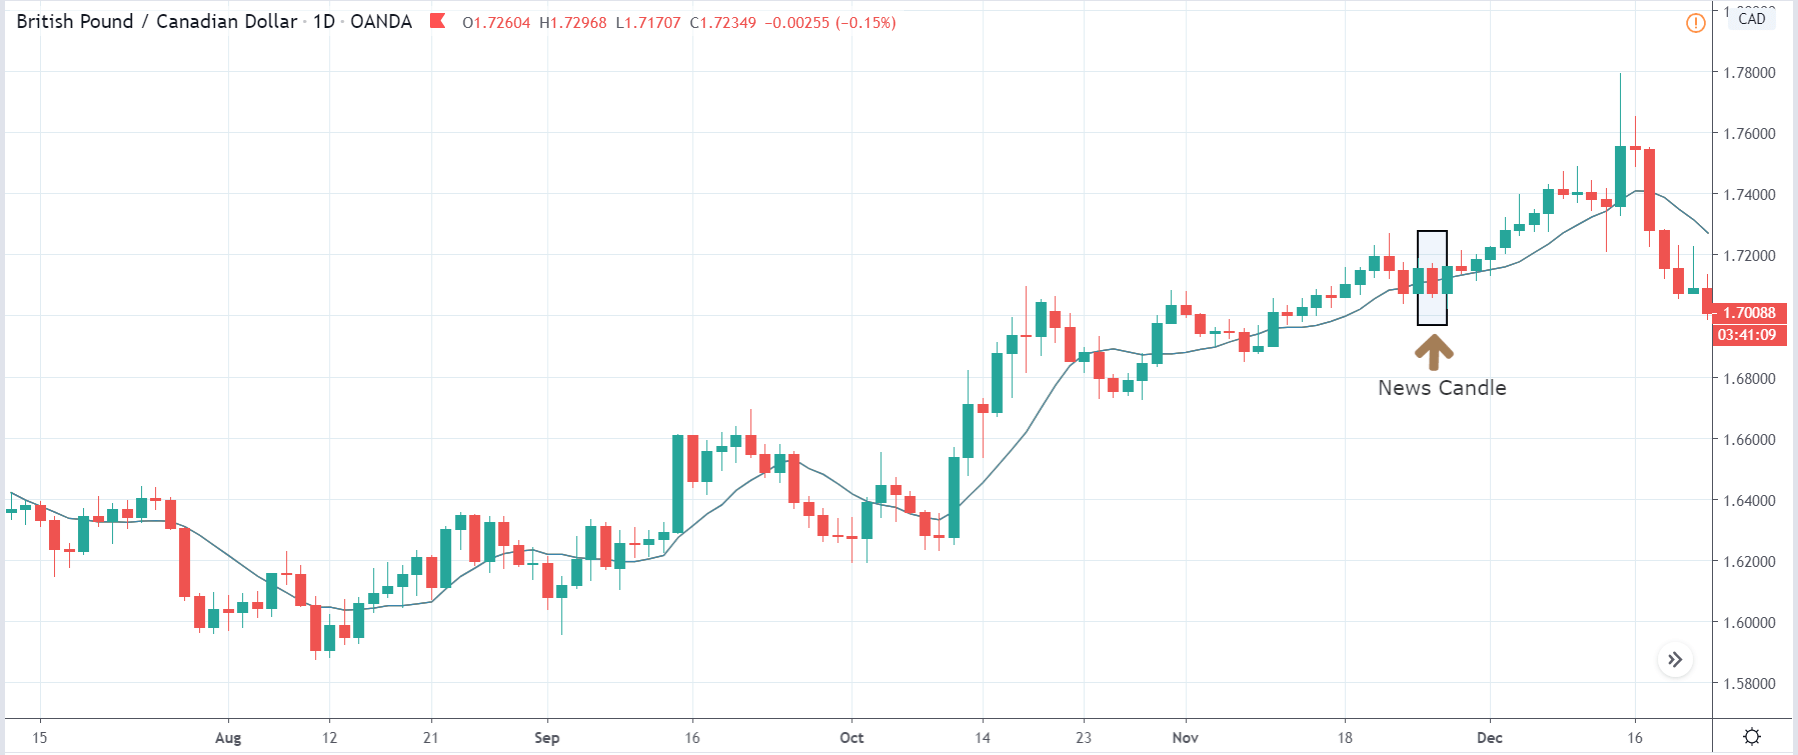
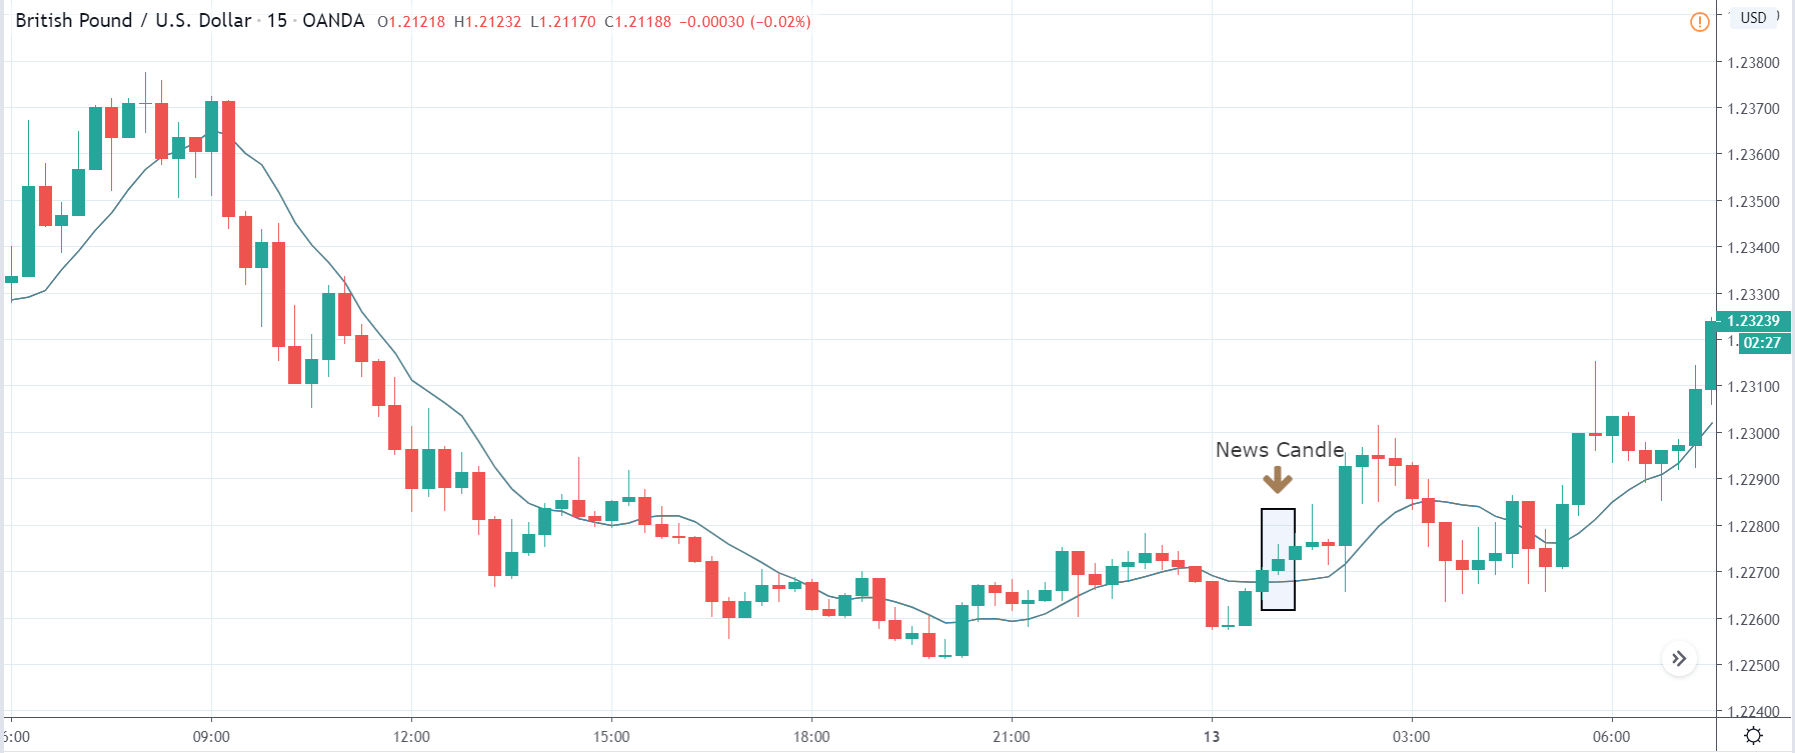
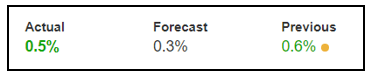
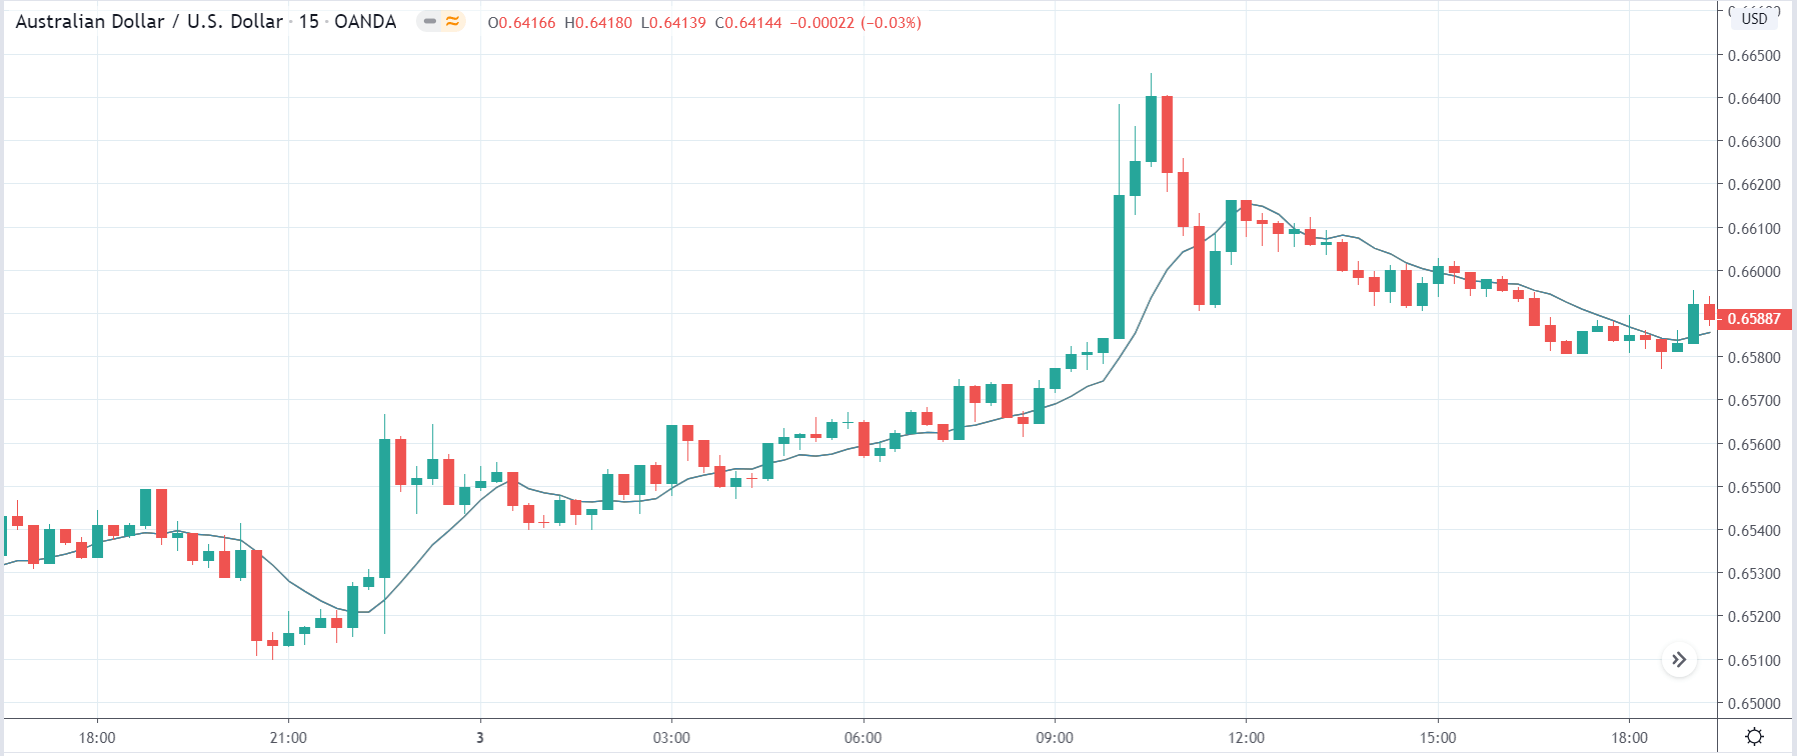
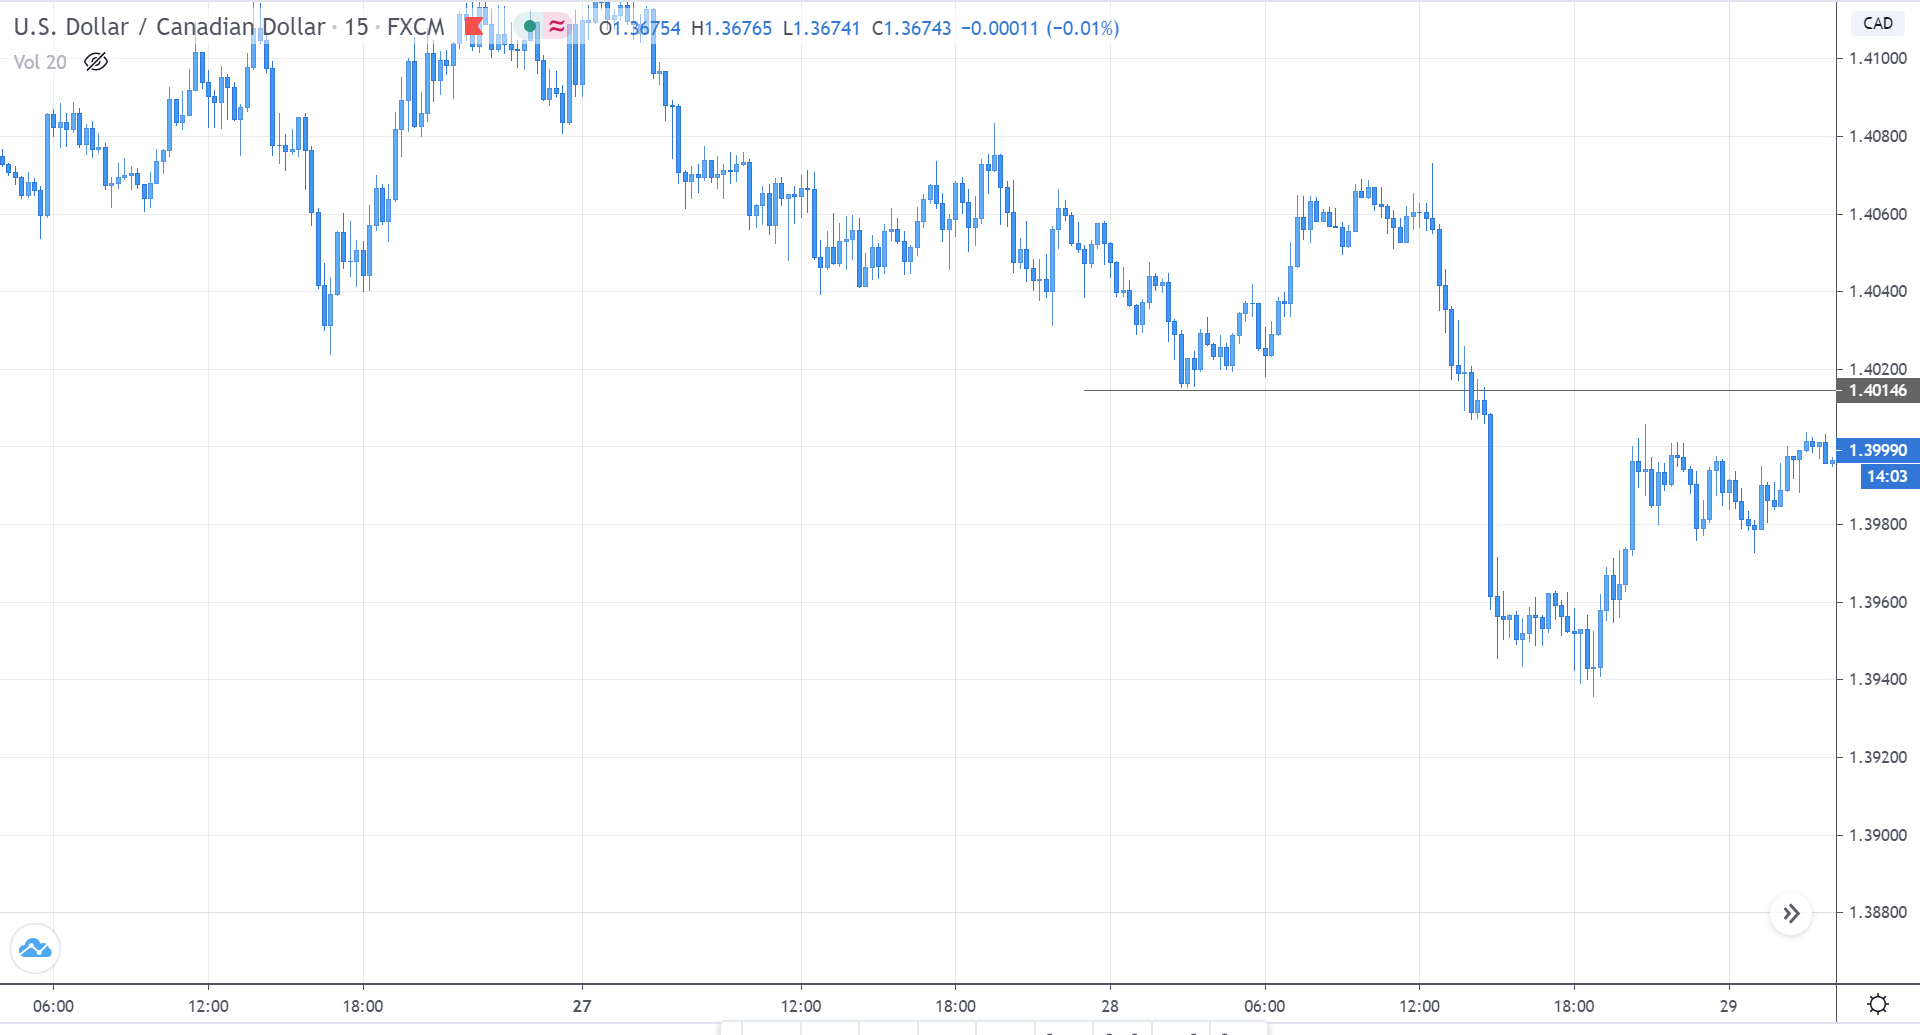
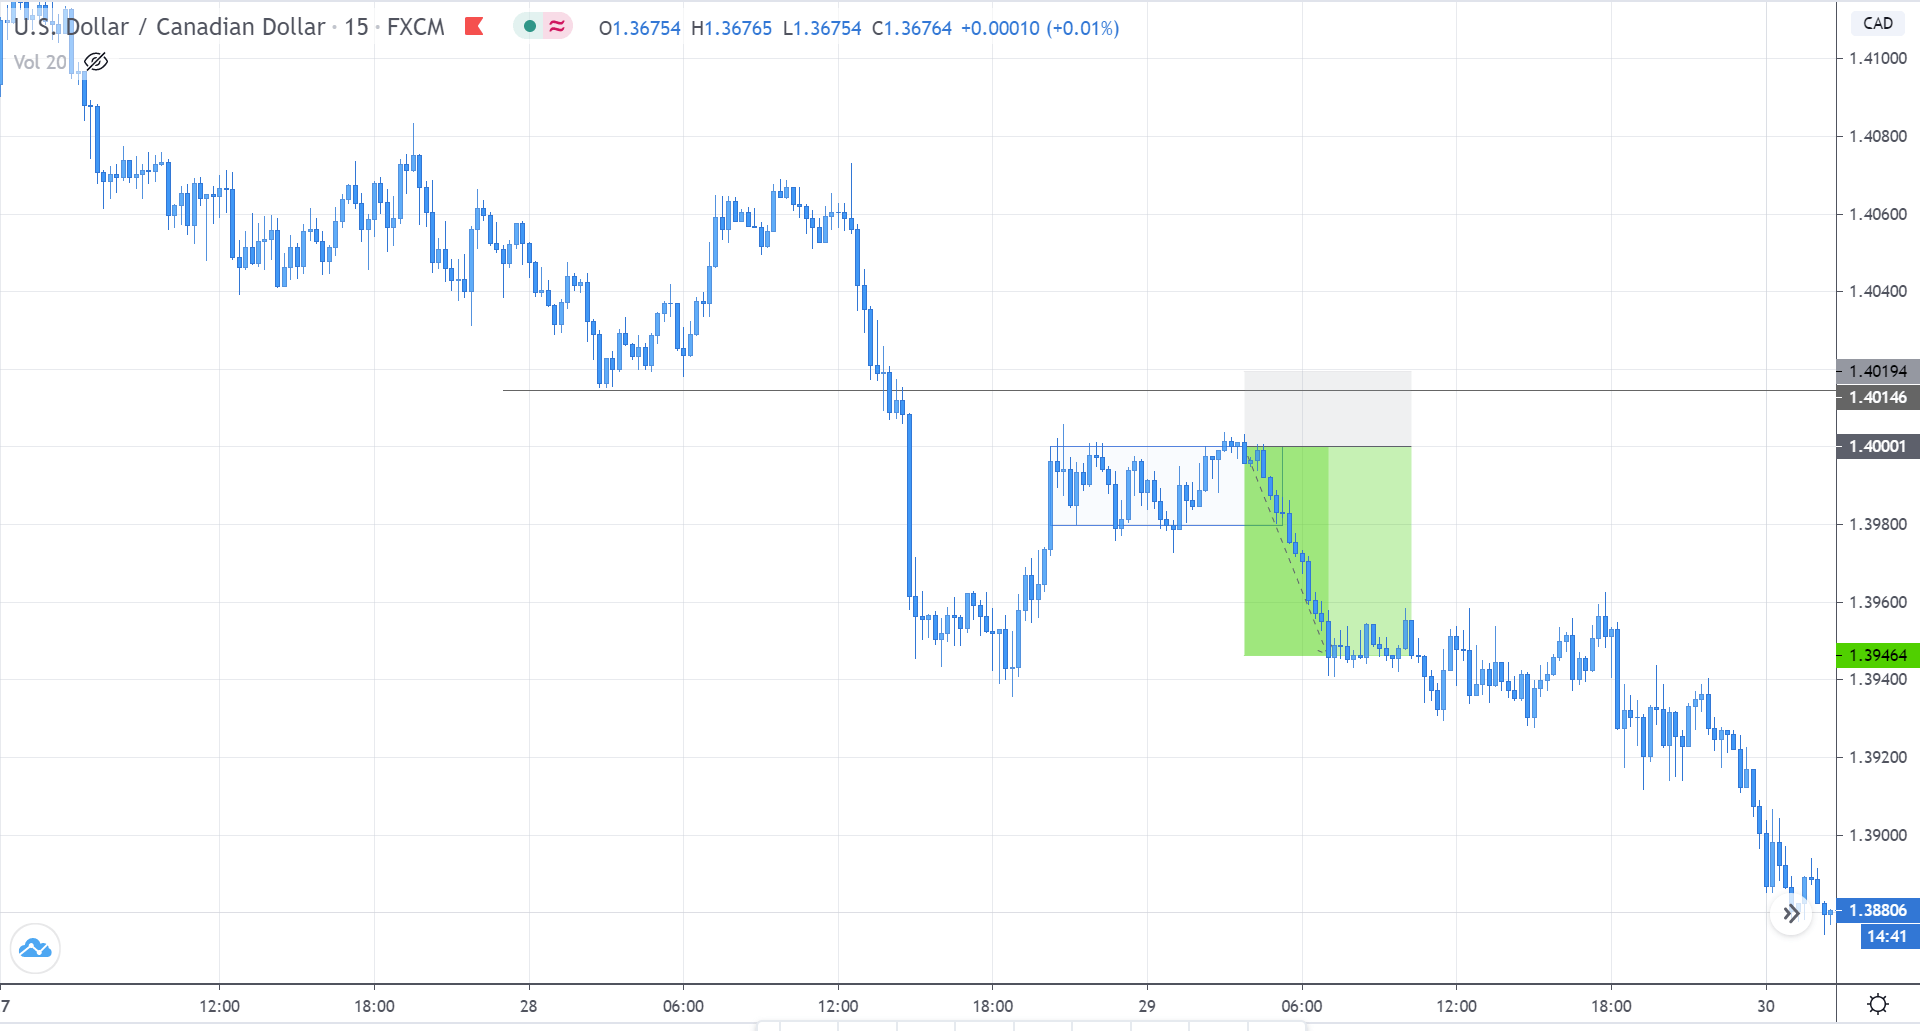
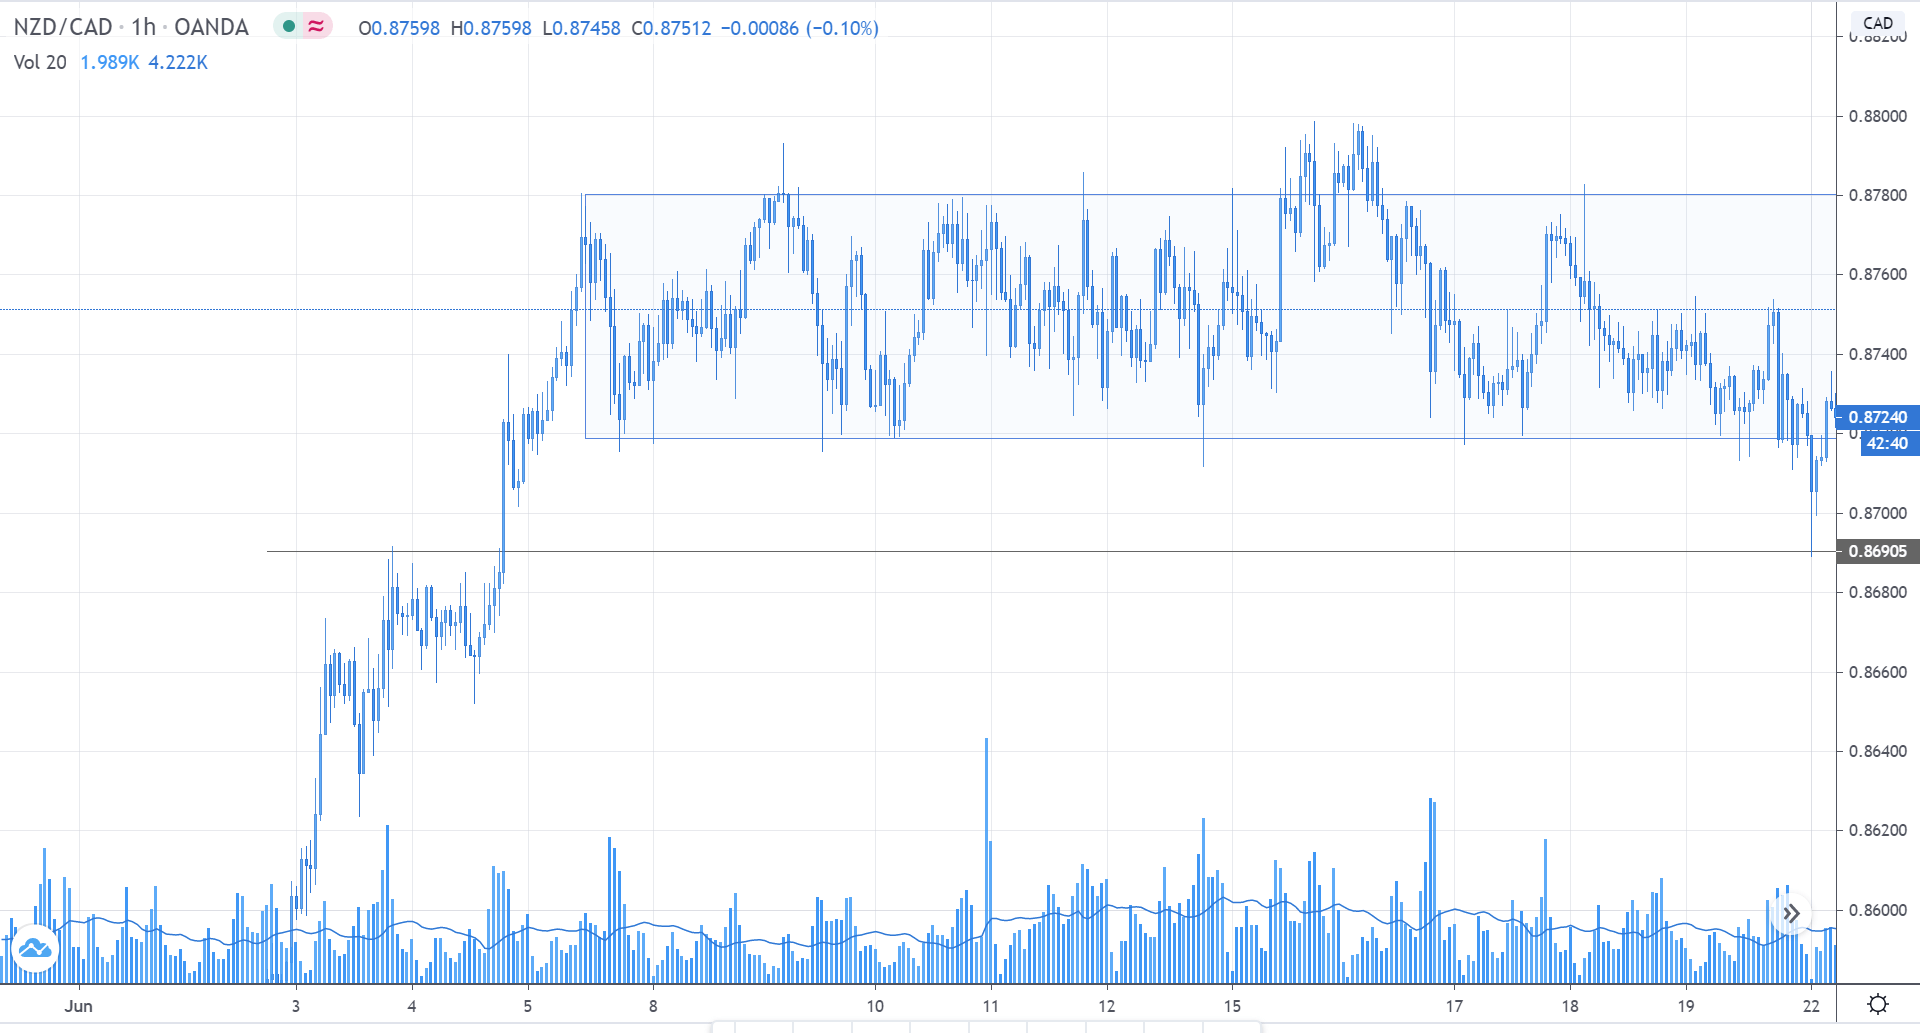
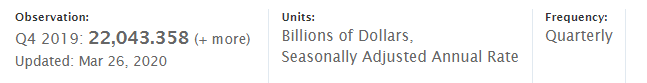
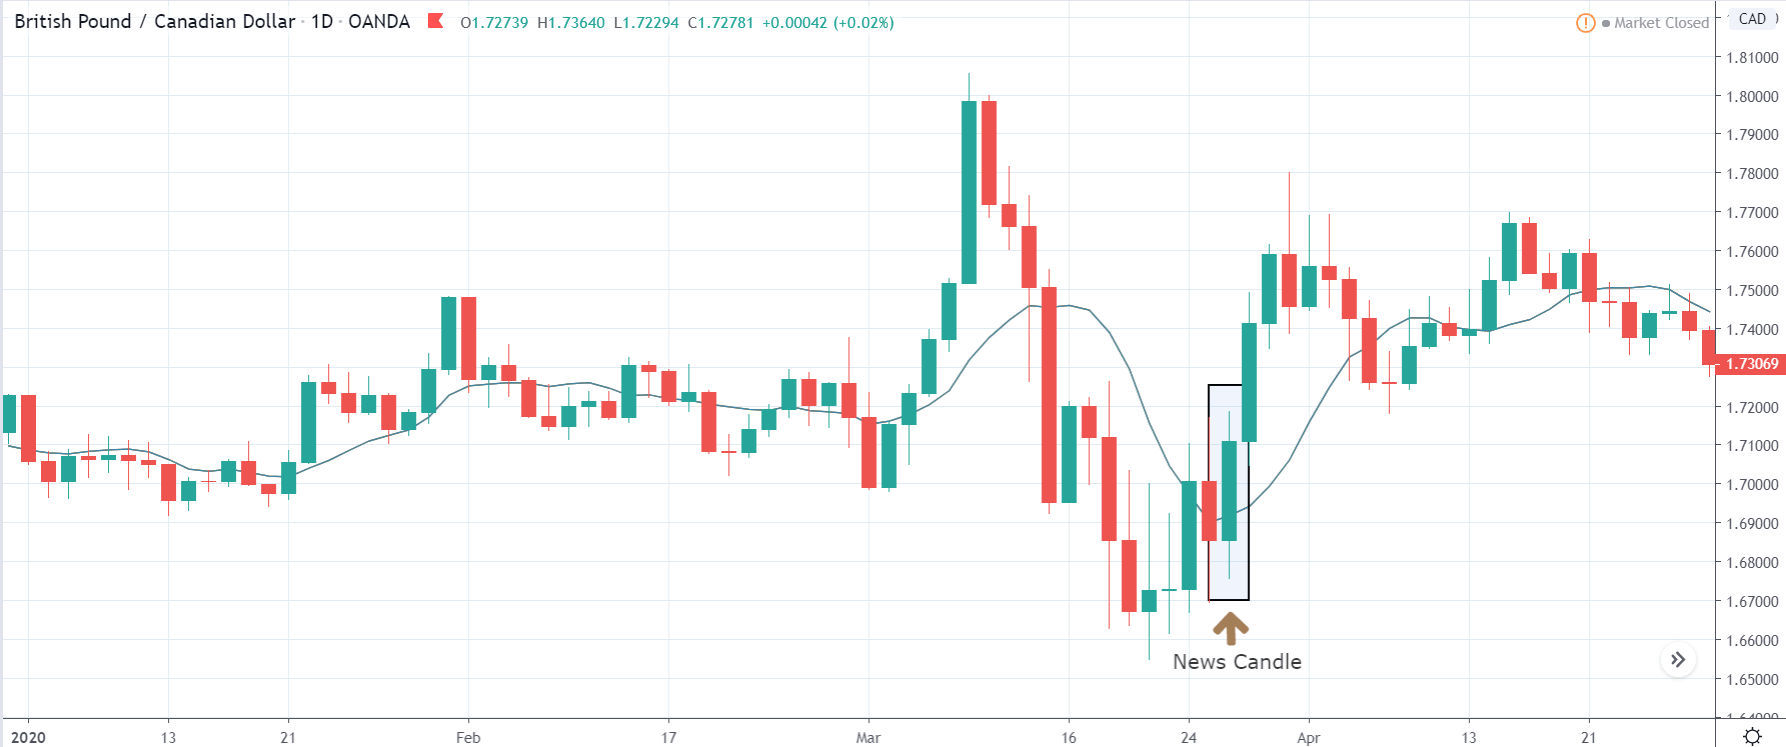
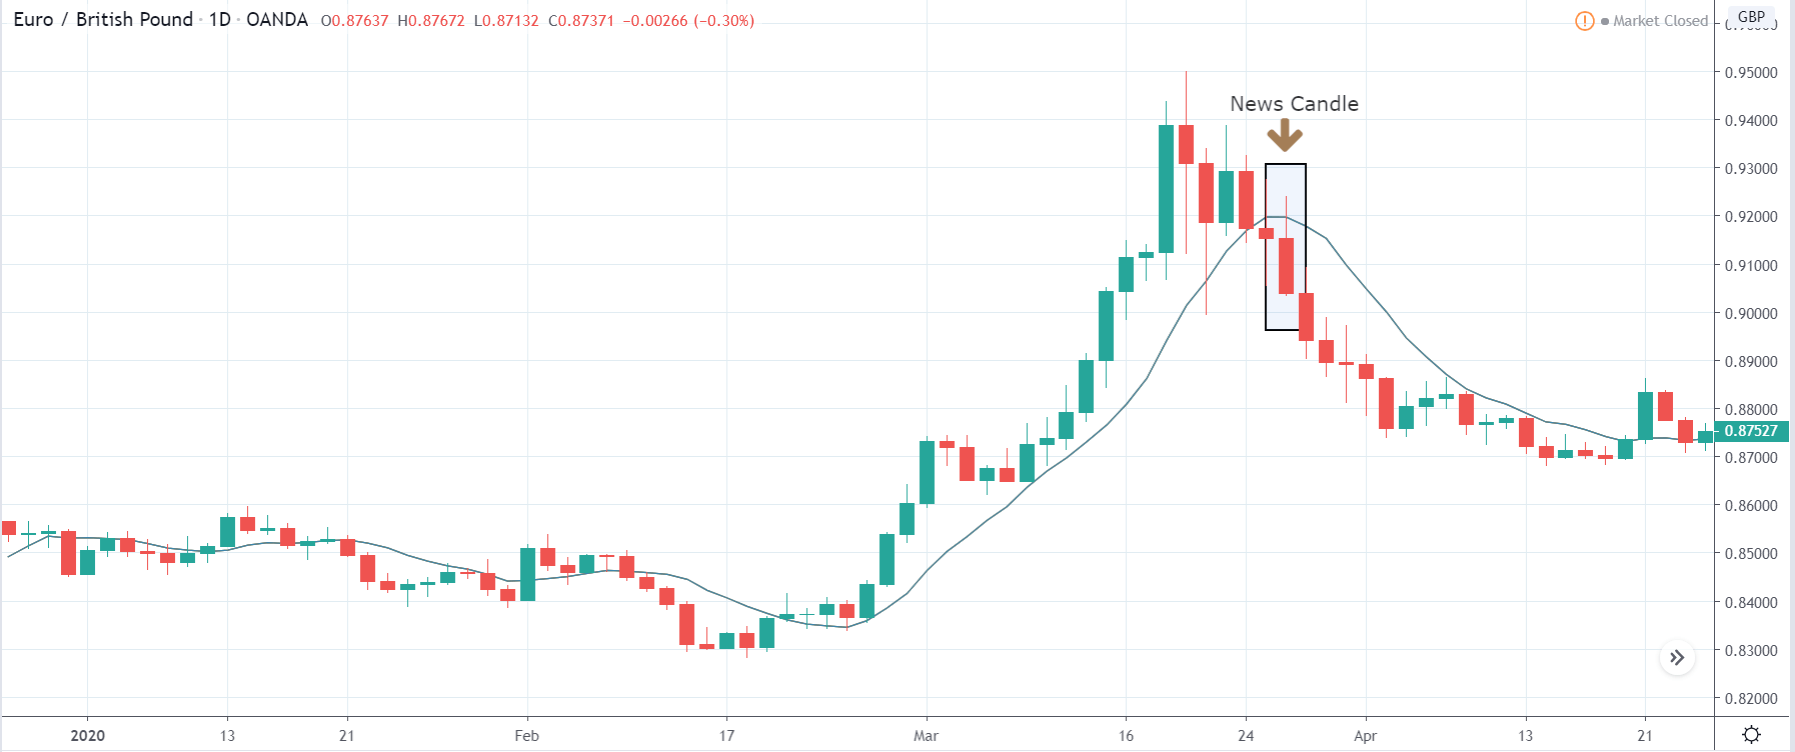
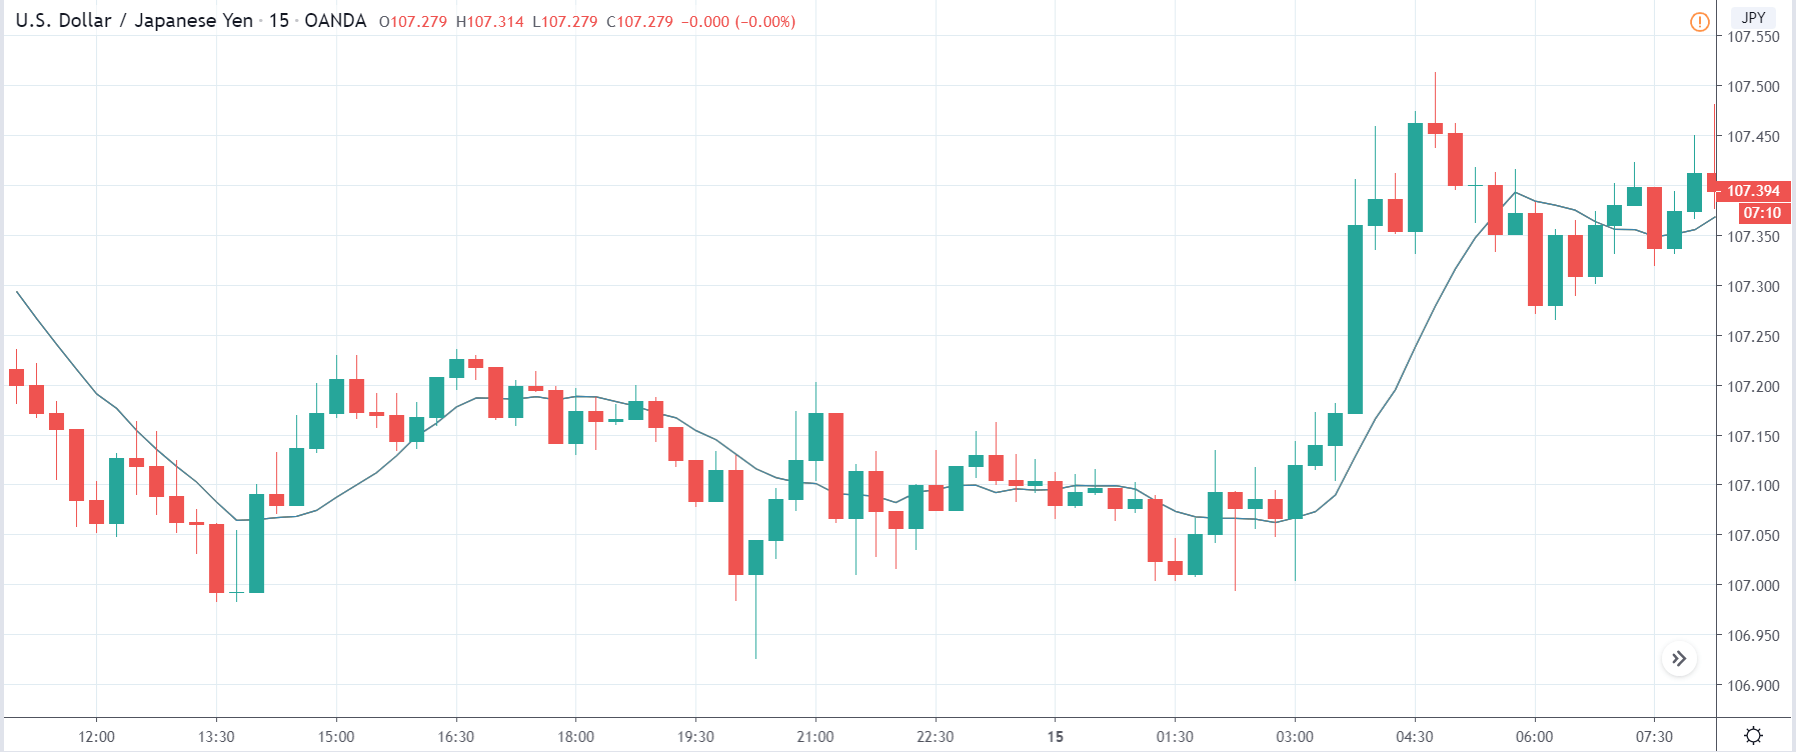
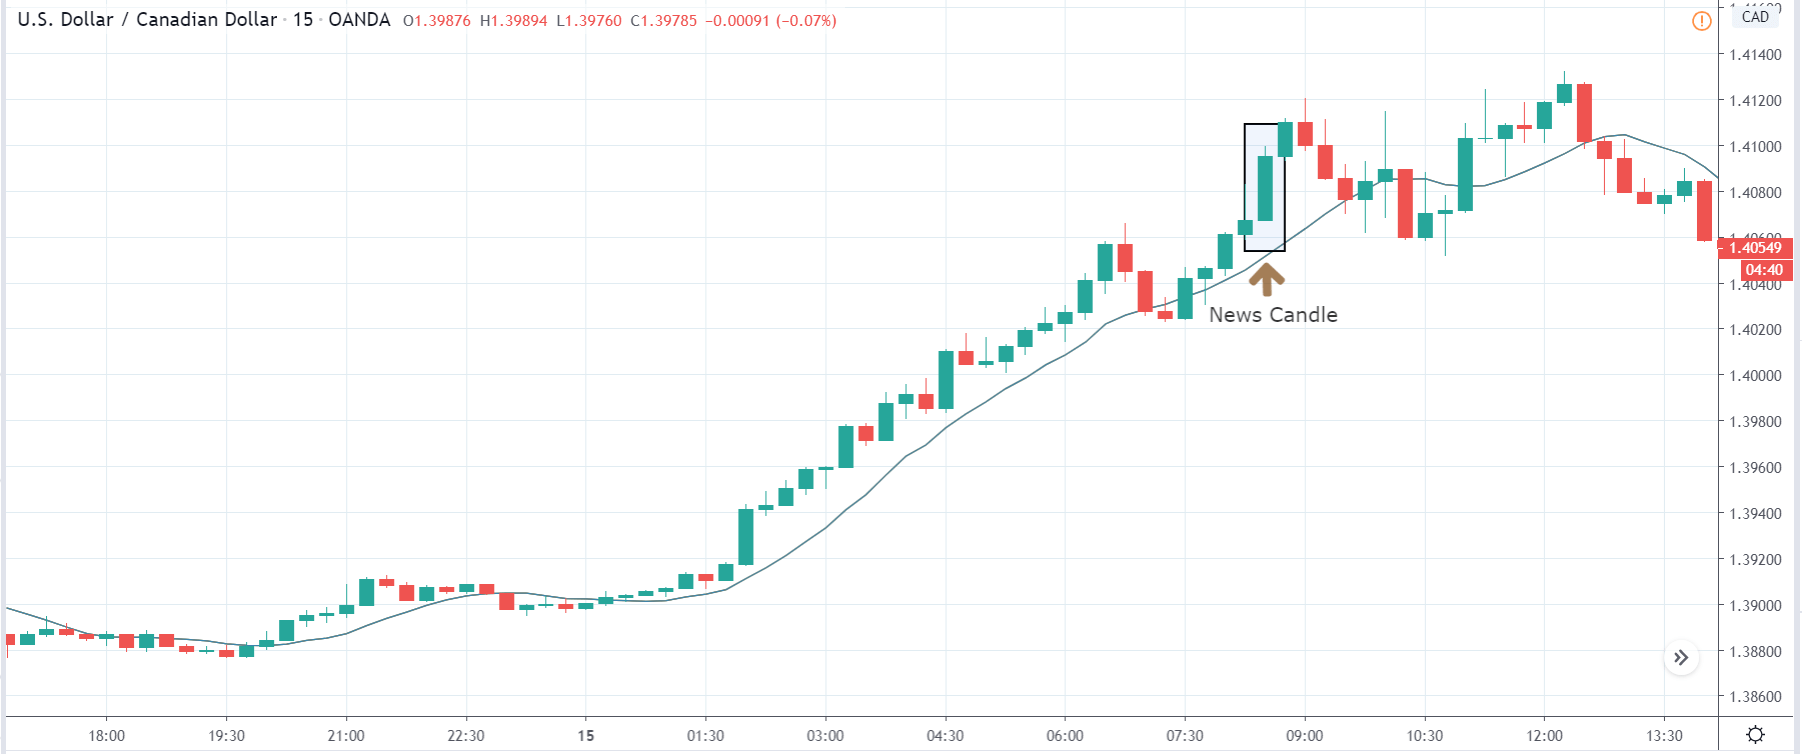
In today’s lesson, we will analyze the impact of GDP on various currency pairs by observing the change in volatility before and after the news announcement. For that purpose, we have collected the GDP data of Canada, where the below image shows the month-on-month GDP data released recently. Let us find out the market’s reaction to this data.

USD/CAD | Before the announcement:

We will start with the USD/CAD currency pair to observe the impact of GDP on the Canadian dollar. The above image shows the state of the chart before the news announcement, where we see that the market is in a downtrend, and recently the price has reversed to the upside. Either could result in a reversal of the trend or a continuation of the current trend. The impact of GDP will decide the direction of the market and so our position. 

USD/CAD | After the announcement

After the news announcement, the price drops below the moving average, and the market falls considerably owing to the positive GDP data. Even though there was a decrease in the GDP, it was only a tad bit lower and much around the market expectations. Hence, it proved to be bullish for the Canadian dollar, and the market goes lower. One should confirm the continuation of the trend using technical indicators before taking a ‘short’ trade.

GBP/CAD | Before the announcement:

GBP/CAD | After the announcement:

The above images represent the GBP/CAD currency pair, where we see in the first image that the market has broken out from a downward ‘channel’ and is moving higher and higher from then on. It very likely that the up move will continue further, which makes us wait for a price retracement to take a buy trade. Based on the volatility caused by the news release, we will have a clear idea about the direction of the market.

After the news announcement, volatility slightly increases to the downside, and the market falls by a few pips. The bearish ‘news candle’ is a consequence of the positive GDP data, mostly on expected lines. We need to note that the news release did not change the overall trend of the market, where the uptrend is still intact.    

CAD/CHF | Before the announcement:

CAD/CHF | After the announcement:

The above images are that of CAD/CHF currency pair, where we see that before the news announcement, the market has reversed from an uptrend to a downtrend and is currently on the verge of continuing the downward move. Since the GDP has a high impact on the currency (indicated by the red box), it is advised not to take any position before the news release.

After the news announcement, the price moves higher by a small amount and manages to close on a bullish mark. The GDP data was close to what was expected, it leads to bullishness within a currency, and hence the Canadian dollar gains strength for a short while.

We hope you understood the concept of ‘GDP Constant Prices’ and how the Forex price charts get affected after its news release. All the best. Cheers!

Categories
Forex Videos

Forex Fundamental Analysis For Novices – Policymaker Speeches!

Fundamental Analysis For Novices – Policymaker Speeches


Thank you for joining our educational video section for fundamental analysis for novices. In this video, we are going to be looking at policymaker speeches.

Most brokers provide an Economic Calendar. And traders use them to keep them advised of various types of economic data releases because these can significantly affect market volatility depending on the level of impact they will have upon their release. If you are not already using one, we strongly recommend that you start doing so. You can plan your trading day around them And try to avoid opening trades close to the release of such data until you are a seasoned trader who understands just how such information can affect price action.


Most economic calendars are similar. However, the types of information which are key to traders are the release time, the type of events – in this case, we are looking at speeches -, the day and date, the likely impact that any speech might have on the market. In terms of general economic data releases, you will find that the actual data is released at the time signified on the calendar and where typically you might find a consensus by economic specialists as to what that data might be, and also the previous data release and where this can be compared to the actual data release, and the traders will gauge what effect that might have on an economy and of course thereafter the related currency exchange rates and stock market indices.


On the economic calendar for Monday the 22nd of June, we have highlighted four speeches by various policymakers. Typically these are announced ahead of time, and you will find them listed in an Economic Calendar. Some policymakers comment on the market unexpectedly, and a good example of that would be President Trump, who often tweets potentially market-moving comments pertaining to economic relevance, mostly in the United States.
So let’s look at some examples.


AT midnight BST, Philip Lowe, who replaced Glenn Stephen as governor of Australia Central Bank, will be making a speech regarding the health of the Australian economy, and this has a high impact value attached to its importance.
Therefore, Traders will be paying particular notice to his comments because he has the power to influence interest rates and also monetary stimulus within the Australian economy, which is particularly significant at the moment due to the impact of the coronavirus pandemic.
Negative sentiments from Mr. Lowe will be seen as bearish for the Australian economy. This could affect their stock market and also lower the value of the Australian dollar against other counterparts in the forex market.

It would be advisable not to trade the Australian dollar during this event.


3:15 BST again on Monday the 22nd of June, the vice president of the European Central Bank, Luis de Guindos, a Spanish politician, will be making a speech regarding the eurozone economy.
The impact level of the speech is set as medium, and any unexpected comments, especially negative ones, could cause market volatility, especially with the euro, including the EURO USD and cross currency pairs.
During a recent speech from Madrid during May this year, Mr de Guindos Stated that the eurozone had left the worst of the pandemic behind in terms of economic impact from the coronavirus pandemic, although he mentioned that it was likely that the eurozone would take two years to recover. This type of comment is both dovish and hawkish. Hawkish because he says the worst is over, and dovish because he says there are still two years of recovery ahead of the eurozone economy. He finished his speech by saying that the eurozone economy is facing a deep recession due to the coronavirus pandemic, and therefore analysts and Traders will be looking at this forthcoming speech to ascertain if he is Leaning more one way than the other.
Dovish comments would be seen as bearish for the euro currency and might cause a lowering of the euro exchange rates against its counterparts.
It is highly unlikely that his comments will be hawkish and therefore have a bullish effect on the market after such recent comments, as mentioned above.


At 4 p.m. BST, again on Monday the 22nd of June, the Bank of Canada governor Tiff Macklem, will be making a speech about economic policy in Canada and where this has been given an impact value of high.

The Canadian dollar is highly sensitive to policymaker speeches and where the currency can be particularly volatile during economic data releases and speeches. Again traders and analysts and economists will be looking for policymaker decisions from the governor that offer strong potential of keeping the country’s recovery on track from the fall out of the pandemic.

They will also be looking for hints from the governor regarding future interest rate decisions and stimulus packages to keep Canada from going further into recession.
As mentioned previously, the Canadian dollar is highly susceptible to volatility during these types of economic events and is strongly recommended that you do not trade during such times of release. Wait until trends are developing post data release, and try and get on those rather than trying to second guess which direction the currency will go at the actual time of economic release.

Categories
Crypto Videos

US Firm Buys 17,000 Bitcoin Mining Rigs! Largest Ever Purchase!


US Firm Buys 17,000 Bitcoin Mining Rigs From Bitmain

Core Scientific, a US-based blockchain hosting provider, signed a deal to buy the next-generation Bitcoin mining machines from Bitmain. The company will purchase over 17,000 S19 Antminers from the Chinese magnate Bitmain on behalf of its clients as well as for its own use. This purchase will be the largest number of S19 machines purchased by a single entity, according to Core Scientific.

Kevin Turner, former COO of Microsoft and current president and CEO of Core Scientific, said, “Core Scientific has received, and started testing the first of Bitmain’s newest S19 ASIC miners, and has seen material success in increasing existing hash rate to achieve a 110 TH/s (terahashes per second) ± 3%.”
All this is happening because the state of Texas started attracting a number of mining facilities with its pricing and incentives. Just last October, Bitmain opened a facility for Bitcoin mining in Rockdale, Texas.


Bitcoin interest growing in North America

Russell Cann, Core Scientific’s Chief Customer Service Officer, acknowledged the increased interest in the growing hash rate via North American mining operations. He said that he views the increase in interest can be attributed to the growing acceptance of cryptocurrencies as an asset class, as well as a testament to North America having much better investing characteristics than before. On top of that, when it comes to mining, North America has, in his opinion, stable geopolitical and regulatory environment, suitable climatic conditions as well as multiple energy sources available.
Cann noted that the most important thing for mining facilities is that they don’t have to worry about regulators changing their opinion on mining every other day, which is one of the main reasons they chose Texas. On top of that, the recent collapse of energy pricing just makes the whole North American region more attractive.

Categories
Cryptocurrencies

What is Mona Coin? Here’s All

Cryptocurrency is a radical idea. From the decentralization and autonomy beliefs that underpin it, to its revolutionary technology that enables permanent, transparent, and employs ultra-modern cryptography to safeguard transactions. It makes sense, therefore, that thousands of cryptocurrencies have been created to actualize these beliefs in countless industries.

Even countries are now adopting national cryptocurrencies in order to derive the massive value they have to offer. 

MonaCoin, which calls itself “The first Japanese Cryptocurrency,” is one such cryptocurrency. And though it’s not exactly an official national cryptocurrency, i.e., it’s not government-sponsored or affiliated in any way, it’s one that has been created with the notion in mind. 

The cryptocurrency is quite popular there, being featured on Tokyo TV. Someone even famously bought land with it back in 2014. 

So, what’s Mona Coin all about? Read on to discover more about this interesting project. 

Understanding MonaCoin

Launched in 2013, MonaCoin is a cryptocurrency predominantly used in Japan. The name is inspired by “Mona” or “Monā,” a popular internet meme based on a cat-like character created with ASCII characters. The existence and work on the currency were announced on 2channel, an anonymous and the most popular online community in Japan. It was created by “Mr.Watanabe” – whose real identity has remained a mystery just like Bitcoin’s Satoshi Nakamoto. 

MonaCoin was created as a peer-to-peer electronic cash system, just like Bitcoin, and it’s targeted to Japanese citizens. The coin has found a degree of acceptance in the country, being accepted for payment in several stores. The coin is approved by Japan’s Financial Services Agency and is traded in several exchanges. 

MonaCoin: An History

MonaCoin’s development began in 2013, officially being born on January 1, 2014. The coin was not pre-mined.

At block height 937440, the MonaCoin blockchain executed a soft fork to implement Segwit, a technology meant to improve scalability on blockchains. The team also has the Lightning Network, another scalability solution for payment-focused cryptocurrencies. 

It’s theorized that MonaCoin’s creation reflects a Japanese culture to have a native version of popular things from around the globe. It’s a desire for the Japanese to have their own version of popular products and services that they can take pride in both as being homemade and also one that’s expressed in the Japanese language. 

Who’s on the MonaCoin Team?

This is not an easy question to answer, given the founder of the project has remained pseudonymous, perhaps in homage to Satoshi Nakamoto. The creator only identifies by “Mr. Watanabe,” and the rest of the team is also anonymous. However, many people speculate that the creators are Japanese.

Additionally, the project doesn’t have a publicly available roadmap. However, its implementation of technologies such as Segwit and the Lightning Network reveals that the team clearly likes to stay on top of things. Follow MonaCoin’s development here

MonaCoin Economics

Here’s a breakdown of MonaCoin as of June 15, 2020. The coin was trading at $1.67, with a #62 market rank. It has a market cap of $110, 072, 984, as well as a 24-hour volume of $7,736,469 and a circulating and total supply of 65,729,675. MonaCoin’s all-time high was $20.23 (Dec 06, 2017) , and its all-time low was $.0.019599 (Jan 14,2015). 

Buying and Storing MonaCoin 

As you would expect, Japan-based exchanges, like Bitbank and Zaif, are the ones with the majority of MonaCoin’s trading volume. However, you can also find the coin in exchanges like Upbit and Bittrex. 

MonaCoin has its own wallets that are available for Windows, Mac, and Linux. It also supports its own Electrum Wallet as a Coinomi wallet for Android. 

Final Words

MonaCoin is a cryptocurrency made by the Japanese for Japan. It’s popular in the country and is enjoying quite a bit of acceptance there. And while the project’s creators remain tight-lipped about their identities, the important thing is that they have delivered, and continue to deliver, a cryptocurrency that the Japanese and the entire blockchain and crypto community can be proud about. 

Categories
Forex Course

136. Learning To Trade The Ranging Market?

Introduction

A Range is a state of the market where the prices move back and forth between the upper bound and the lower bound. A ranging market is also referred to as a choppy, sideways, or a flat market. Unlike a trend, the prices do not move in one specific direction for a long time. A range on a time frame, when looked on a smaller time frame, the price trends in one direction for a while, reverses its direction, and trends in the opposite direction.

Understanding Support and Resistance

Knowing support and resistance is an essential concept to understand a range. These two terms form the basis of a range.

Support

In simple words, support is the level in the market where the prices tend to go up. It is the region where the buyers are interested to aggressively buy the security, causing the prices to shoot up. In other words, it is an area where there is a high demand for the currency pair. A level can be regarded as support when the price reacts multiple times (with power) from that area.

Resistance

Resistance is a level in the market where the prices tend to drop. It is the price where sellers are willing to sell or short sell the asset. They prevent the market from going higher from a specific level. Resistance is no different from that of supply.

Resistance can be understood in terms of buyers. It is an area in the market where the buyers are not interested in buying at that price as they find it expensive. Since there is no demand from the buyers, the prices drop. And when it drops to the support area, the buyers show up again. Thus, due to a higher demand than supply at the support region, the prices rise.

The combination of both support and resistance makes a range. For instance, let’s say the market drops to the $5 mark every time it touches the $10 price. Visually, the market is moving sideways, and such a market is referred to as a range. Here, the $5 price is the support level, and the $10 price is the resistance. A similar example of the same is illustrated below.

ADX indicator for ranging markets

The Average Directional Index indicator can be applied to determine if the market is trending or ranging. A value above 25 indicates that the market is in a strong trending state, while a value of less than 25 signifies that the market is in a consolidation (range) state.

Below is the live chart of AUD/CAD on the 4H time frame. Looking at the chart from a bird’s eye perspective, the market started as an uptrend, held for a while, continued with the same trend, and is currently ranging again. In this sequence, we can observe that the ADX was below the 25-mark line when the market was consolidating, and greater than 25 when it was trending upwards.

We hope you found this lesson on ranging markets interesting and informative. In the next lessons, we shall get into more detail and understand concepts like retracements and reversal. Happy learning!

[wp_quiz id=”78971″]
Categories
Forex Fundamental Analysis

Everything About ‘Changes in Inventories’ Macro Economic Indicator

Introduction

Changes in Inventories are one of the primary business leading economic indicators that can give us insight into economic prospects for the coming months. Understanding of Inventory Changes and Sales can help us forecast economic growth, which is our primary objective through Fundamental Analysis.

What are Changes in Inventories?

Inventory: It is the stock of goods that retailers, wholesalers, and manufacturers hold with them. Inventory is measured in their appropriate dollar values. Businesses often keep stock of their finished goods when they predict an increase in sales in the coming months so that they are ready to meet the increased demand and can lock in profits.

The Monthly Retail Trade Survey, the Manufacturer’s Shipments, Inventories, and Orders Survey, and the Monthly Wholesale Trade Survey are the primary sources from which Business Inventory is compiled.

At the level of Retail Merchandise, Inventories are measured at cost level at the retailers as per the FIFO (first-in, first-out) method of valuation. At the Wholesalers who distribute goods to retailers, the inventories’ values are added to the business inventories every month. At the manufacturer level, the inventories, whether in raw material, work-in-process or finished, are valued at cost, primarily by the FIFO method of valuation.

How can the Changes in Inventories numbers be used for analysis?

Business owners and retailers have a certain kind of acquaintance with market trends, and due to their years of experience running their business, they know the subtle trends of increase in sales, demand, etc. Hence, Businesses stocking up on inventories is not a joke, as it costs them real money for producing as well as holding the stocks. If they did not forecast an increase, they would not have increased inventories in the first place.

Seasonally Adjusted Inventory Changes can thus act as a leading indicator for the increase in consumer consumption, which is good for business, and the economy. On the other hand, increased inventory figures could also indicate that the sales have fallen, and thus creating an inventory stockpile, which indicates decreased consumer spending, which signals terrible times for the economy are ahead.

Hence, it is often essential to combine Inventory figures with Retail Sales figures to correctly gauge the economic trend. Retail Sales figures indicate actual consumption of goods by consumers and hence is the more accurate figure when compared to Changes in Inventories.

An increase in Manufacturing Production is followed by an increase in Inventory. It is then followed by an increase in Retail Sales. The first two stages, i.e., increase in Manufacturing Production and Inventory Changes, are still forecast, i.e., the rolled dice can turn either way. But Retail Sales is a guaranteed economic indicator, as money comes back into the pockets of retailers and manufacturers.

Hence, the more commonly watched statistic out of the business inventories figures is the Inventory-to Sales Ratio. It is the ratio of Inventory value to Retail Sales figures. It gives us an indication, by how many times the inventories outpace the Retail Sales. The lesser the number, the better.

For example, an Inventory-to-Sales Ratio of 2.5 indicates that there is enough inventory stock to supply 2.5 months of Retail Sales. When the ratio increases, it is an indication that the inventories are increasing in contrast to the sales, which indicates the economy is slowing down. The upcoming Production activity would be reduced until the current Inventory stock starts to deplete off. On the other hand, when the ratio is falling, it is indicative of manufacturers to increase production activity to the oncoming increase in demand.

Inventories are primarily concerned with the Manufacturing Sector, which accounts for 20% of GDP in the United States. It drives a significant portion nonetheless.  An increase in manufacturing activity as a consequence of decreasing ratio figures can add to employment, or even wage growth, which is good for the economy. Increased employment further stimulates Consumer Spending as more people have the cash to spend, which cyclically boosts the economy.

Impact on Currency

Changes in Inventory figures can be leading indicators. If correctly put, way too leading. It means that the changes in inventories are figures at the start of the manufacturing process-consumer purchase lifecycle. The indicator has two-way conclusions to be drawn, as discussed above. Hence, the traders who are not well versed with the industry should use this indicator with caution, as an increase in Inventory can mean slowdown or expected growth both.

Only investors or traders who have a historical perspective of the figures can use this indicator effectively to predict growth months ahead of the market. In general, the market follows Retail Sales and Ratio as reliable metrics, and hence there are significant moves in the market around these figures. Hence, although a leading indicator of economic growth, it is advised to combine it with Retail Sales figures to affirm your assessment of economic activity.

Economic Reports

In the United States, the Bureau of Economic Analysis releases quarterly reports of the GDP, wherein the section of “Key Sources and Assumptions” contains the details of “Changes in Private Inventories.” The BEA publishes quarterly reports on its official website after every quarter. The release dates are also posted on its official website.

The United States Census Bureau maintains the Manufacturing & Trade Inventories on its official website.

Sources of Changes in Inventories

BEA – Gross Domestic Product

The St. Louis FRED website makes the search and analysis of Inventories data from BEA a lot easier. The links are given below

Change in Private Real Inventories – FRED

Change in Private Inventories – FRED

Census Bureau – Inventory

Census Bureau – Shipment, Inventory, and Orders

Inventory data for various countries are available in statistical and list format here.

Impact of the ‘Change in Inventory’ news release on the Forex market

The Change in Inventory measures the value of change in producer-owned inventories between the beginning and the end of the calendar year. For businesses, the build-up of inventories can be a threat. The problem is that these inventories will probably be cut in the future, depressing demand for goods and leading to production cutbacks. In hard times, managers work hard to cut back on inventories. All companies need to be prepared for business cycles, which is driven by inventory swings. Companies must try to reduce their inventories by reevaluating their practices.

In today’s lesson, we will analyze the change in inventory levels of many agricultural commodities, particularly grains, that are produced in a given year and stored or held until they are marketed. The annual value of inventory change represents the gross value of agricultural production. The below image shows the net Change in Inventory from 2017 to 2018 in the agricultural sector of Canada. This value has been estimated for durum wheat, oats, rye, corn, soybean, potatoes, tobacco, and many other commodities. Let us find out how the market responds to this data.

USD/CAD | Before the announcement:

Let us start with the USD/CAD currency pair in order to observe the impact of the Change Inventory on the Canadian dollar. In the above image, we see that the market is in moving within a ‘range,’ and currently, the price is at the top of the ‘range.’ Since the impact of this news event is less on a currency, aggressive traders can take ‘short’ positions with a large stop loss.

USD/CAD | After the announcement:

After the news announcement, the market moves lower, and the price reaches to the moving average. The bearish ‘news candle’ indicates that the Change in Inventory data was positive for the Canadian economy, which resulted in the strengthening of the currency. The close of ‘news candle’ is a confirmation sign of a down move. Thus, one could take a risk-free ‘short’ position soon after the news release.

CAD/JPY | Before the announcement:

CAD/JPY | After the announcement:

The above images represent the CAD/JPY currency pair, where we see that before the news announcement, the market seems to be moving in a ‘channel’ with the price presently is at the bottom of the ‘channel.’ Since the Canadian dollar is on the left-hand side of the currency pair, an upward channel signifies strength in the currency. Therefore, traders who trade channel can buy the currency pair with a stop loss below an appropriate technical level.

After the news announcement, the price moves higher, and volatility expands on the upside. The ‘news candle’ closes with a fair amount of bullishness as a result of better than expected Change in Inventory data. At this point, once could confidently take a ‘long’ position with a target up to the higher end of the ‘channel.’

GBP/CAD | Before the announcement:

GBP/CAD | After the announcement:

The above images are that of GBP/CAD currency pair, where we can see in the first image that the market is in a strong uptrend, which signifies the great amount of weakness in the Canadian dollar. Technically, we should be looking to buy the currency pair after a price retracement to a ‘support’ or ‘demand’ area. Until then, we will be monitoring the impact of the news release.

After the news announcement, volatility slightly increases to the downside, and we witness a fall in the price. However, the Change in Inventory does not have a major on the currency pair where the Canadian dollar strengthens only momentarily. One needs to still wait for a pullback in order to join the uptrend.

That’s about the ‘Change in Inventory’ and the relative impact of its news announcement on the Forex price charts. Let us know if you have doubts regarding the article in the comments below. Cheers!

Categories
Cryptocurrencies

What’s Waves All About?

Blockchain empowers people, organizations, and other entities to realize faster, more transparent, and trustless processes. But this is not just what the tech can accomplish. In fact, the tech was brought to life so it could support cryptocurrencies, which, in a nutshell, is internet-based, cryptographically-secured, and decentralized money. Thousands of blockchain-based currencies exist today. 

But away from ‘mainstream,’ full-blown cryptocurrencies such as Bitcoin, the blockchain can support tokens for more humble purposes such as loyalty tokens for businesses, small-scale ICOs, and even crowdfunding. 

Waves is a platform that’s harnessing the power of blockchain to do just this. And it’s already successful in this niche, with a few high-profile applications. One of these is Burger King, Russia. The fast-food chain has created a loyalty token known as Whoopercoin based on Waves. Another is American politician Larry Sharpe who created a WAVES token – Sharpecoin for his 2018 campaign. 

What’s Waves? This guide tackles that question and more. 

Understanding Waves

Waves is a blockchain-based platform that allows anyone anywhere to create their own token. Whether you want a community-centered token, loyalty program, an in-game currency, there are no limits on the type of tokens you can create on Waves. 

Waves was created in 2016 by Sasha Ivanov with the goal of bringing blockchain-powered tokens closer to the people’s reach. The platform is equipped with token-building kits that are highly functional and easy-to-use. With the platform, Ivanov envisioned a world where anyone, individuals and organizations alike, can access and interact with the blockchain.

How Does Waves Work? 

Waves operates based on three core pieces of software:

  • Custom application tokens 
  • A decentralized exchange
  • Smart contracts 
#1.Custom Application Tokens (CATs)

The Waves platform exists mainly to facilitate the creation of tokens. CATs allow you to do this. You can create a token on the web or through a mobile app available for both iOS and Android.

You can buy, sell, trade, exchange, and transact with Waves-based tokens. Tokens created via the platform may not have as much applicability as tokens created on a more ‘sophisticated’ platform such as Ethereum, but they are infinitely easier to create, and besides, you don’t have to have any developing knowledge. This simple to use quality of  Waves makes it ideal for purposes such as in-app tokens, simple Initial Coin Offerings, and loyalty reward schemes.  

#2. Decentralized Exchange (DEX)

Decentralized exchanges are ones that are not overseen or controlled by any particular authority, with transactions being peer-to-peer. DEXs thus eliminate most of the shortcomings associated with centralized exchanges. 

Not only are DEXs more secure, but they are also more private as you’re not required to provide any personally-identifying information – as it is with centralized exchanges. Also, the exchange cannot arbitrarily freeze your funds or limit how many trades or withdrawals you can make.

Waves’ DEX utilizes an automated mechanism to pair buy and sell requests, streamlining the process for everyone involved. In February 2020, Waves announced the launch of a Fiat gateway that will enable users to purchase crypto with debit and credit cards.

#3. Smart Contracts

The Waves platform added a smart contract functionality to the platform in September 2018. The functionality enables users to create multisig addresses, freeze tokens, carry out atomic swaps, and create customized voting mechanisms. The smart contracts use a proprietary coding language known as RIDE. Unlike the Ethereum platform that requires gas for smart contract transactions, Waves charges a minimal fee -which is more upfront. 

Waves’ Two-tier Architecture

Unlike, say, on Bitcoin, nodes maintaining the Waves network do not need to download the whole blockchain. Instead, full nodes update the rest of the nodes (also known as lightweight nodes) on transaction verifications. 

To ensure trust between the two types of nodes, Waves utilizes the Scorex platform, a modular blockchain framework through which lightweight nodes use the current network state achieved by full nodes. 

A Leased Proof-of-Stake (LPoS)

LPoS is a modified version of the traditional proof-of-stake consensus mechanism. In LPoS, token holders lease their balance to full nodes, who create new blocks and receive rewards. They can then share these rewards with leasing nodes, who are rewarded according to their amount of stake – which is the total amount of tokens they leased. 

Leasing costs 0.002 waves. To run a full node, you need at least 1,000 WAVES. This requirement is a downward adjustment from the former minimum requirement of at least 10,000 WAVES. If you wish to become a full node but do not have 1000 WAVES, you can lease coins from other participants in the network. 

Miner Reward Token (MRT)

As a block creation full node, you earn miner reward tokens (MRTs) along with your WAVES rewards. For the first 70 blocks that you create in a day, you earn 60 MRT, and 30 MRT for every block you produce after that. MRT is a token created for the Waves platform. You can also exchange it for other tokens in the in-house exchange.

What’s the Market Look Like for WAVES?

As of June 14, 2020, WAVES is going for $1.20, and it ranks at #59. It has a market cap of $122, 385, 397, a 24-hour volume of $35, 098, 740, a circulating and total supply of 102, 199, 780. The token had an all-time high of $18.07 (Dec 19, 2017), and an all-time low of $0.122684. 

Buying and Storing WAVES

You have two ways to acquire WAVES. One is by purchasing it from exchanges such as Binance, Bittrex, YoBit, BitMart, LATOKEN, P2PB2B, BitHumb, Huobi, Kraken, IndoEx, Paribu, and YoBit. While you can do so using Fiat in some of the exchanges, others require you to first purchase a proxy token and swap it for WAVES. The other way is to use the in-house DEX to exchange any of the supported tokens for WAVES. 

For storage, you can use the WAVES’  lite wallet supported on the web, iOS, and Android. It is strongly recommended not to store your funds in an exchange since not only are they in the danger of being hacked, but also you do not have full control over your funds, as it should be. Other options include Trust Wallet, Atomic Wallet, Guarda, and Ledger. 

Final Words

Waves brings the power of the blockchain to the people, providing infinitely easy ways to create your own tokens. Whether you’re looking to create a crowdfund, a simple voting mechanism to decide where to go for a holiday, or a loyalty token for your customers, anything goes. 

Its addition of a smart contract functionality puts it right up with the likes of Ethereum, NEO, and other popular platforms. Individuals can also exchange crypto on Waves in a safer and uncensorable way, all while maintaining their anonymity. If Waves continues adding more value to users this way, the platform will continue to grow in popularity. 

Categories
Crypto Videos

Bank of Thailand Launches A Digital Currency Pilot!


Bank of Thailand Launches a Digital Currency Pilot

The Bank of Thailand announced its plans to develop a prototype to test real-life business use-cases of its central bank digital currency.
The bank made an official statement saying that, before it launches a CBDC payment system for all businesses, it has plans to test it with large-scale enterprises.

They have entered a partnership with the largest cement and building material provider in Thailand, called Siam Cement Group (SCG), as well as Thailand-based fintech firm called Digital Ventures Company Limited, with the intention of testing the new payment prototype system.

Bank of Thailand CBDC pilot

The pilot project test is scheduled to start in July of this year and end by the end of the year. With the aforementioned CBDC payments, the Bank of Thailand aims for a more efficient payment system that would have increased flexibility for various fund transfers as well as faster payment settlement between suppliers.
Other countries reviewing the potential of CBDCs
Thailand is not the only country that is interested in having their own CBDC. China has remained a frontrunner in regard to experimenting with this technology, while other countries are not that far behind.

The Bank of Canada seemingly entered the game by posting a job opening titled “Project Manager, CBDC,” which clearly signifies that Canada is interested in this technology. Banque de France also successfully tested a digital euro last month.

Categories
Crypto Videos

Are Baby Boomers Now Actually Investing in Bitcoin?


Are Baby Boomers Actually Investing in Bitcoin?


San Franciscan Bitcoin Broken River Financial posted a statistic showing that their trading volume increase happened because of baby boomers. They said that baby boomers are responsible for as much as 77% of their volume growth.

Paul Tudor Jones effect

While most surveys so far concluded that younger generations are more susceptible to investing in Bitcoin, the data provided by River Financial says otherwise. Alex Leishman, the company’s co-founder, and CEO, told Bloomberg that Bitcoin is, as the time passes, becoming more mainstream and that many investors are following in the footsteps of the famous Paul Tudor Jones.

All the money comes from older generations

Many analysts have noticed that the institutional interest in Bitcoin in 2020 is on the rise, with Grayscale leading the “heard” and buying as much as the new supply, if not more.

Although millennials accepted the premise of cryptocurrencies in the first place, it is extremely important that the crypto market gets accepted by the older generations. Households in the older group possess 10 to 30 times more wealth as the millennial demographic on average. If the info posted by River Financials indicates more baby boomers coming into the crypto market, investors could expect a great year in terms of returns.

Categories
Crypto Daily Topic

Why Tokenization is The Future of Real Estate

The real estate market is one of the oldest markets characterized by slow, paper-dependent processes causing significant delays in the change of property ownership. The transactional friction can be blamed on the complex architecture of the market that involves multiple stakeholders, large amounts of money, and numerous regulations that are dependent on jurisdiction. On top of it all, each transaction has to go through myriad middlemen, from the listing agent to banks and everything in between – resulting in unprecedented transaction costs. 

Although the structure of the real estate market alone isn’t much of a big deal as every stakeholder has a vital role to play, the resultant dysfunctions it creates needs to be solved as the market keeps on growing. As blockchain technology finds use in almost every industry, the real estate market can also make use of this technology to solve the derailing dysfunctions. This can be done through asset tokenization. 

What is real estate tokenization? 

Tokenization is the conversion of a physical asset into its digital form, which in turn derives/acquires its value from the underlying asset. Once the assets are tokenized, they can easily be divided into smaller pieces and made accessible to a wider pool of investors as a way of raising capital. As such, depending on their investment amount, an investor gets a share of the larger token to act as a representation of ownership. Also, investors can trade their token shares freely on a secondary market based on the current value of the property. 

The issuing, management, and exchange of these tokens is done on a blockchain network, thereby promoting immutable documentation processes, transparency, and traceability. Most importantly, the token investors will have undisputed control over the asset since they own the private keys of the tokens – much in the same way virtual currencies allow users to take control over their finances. 

Benefits of real estate tokenization 

Like in most industries where blockchain has found use, the real estate market is also set to benefit immensely from this technology once realtors warm up to the idea of tokenizing property. Let’s explore some of these benefits: 

I) Improved liquidity

Despite being a safe investment, the real estate market is highly illiquid majorly due to the large amounts of money transacted between the buyer and sellers, as well as the third-parties such as lawyers and banks involved in the transaction. Moreover, due to the large initial investment amount required, potential property buyers are locked out from investing in real estate. 

Property tokenization injects liquidity into the real estate market by allowing assets to be divided into smaller units representing fractional ownership. For instance, a condo going for $1 million can be divided into tokens worth $200 or less, lowering the minimum investment for investors. The tokens can be traded at secondary markets at any time of the day, allowing investors to readily change their assets to cash when they need to. Higher liquidity can also positively influence the value of the asset by removing intermediaries such as the listing agent, bringing an asset’s price closer to its true value. 

The newfound liquidity has the potential to inspire monetization of other aspects of real estate, such as leasing, spurring further development of the entire market. 

II) Automated Processing 

To facilitate the buying and selling of tokenized property, smart contracts can be introduced in the transactions for a seamless and efficient exchange of property ownership. This means less paperwork and almost no intermediaries, which in turn lowers the additional transactional costs. This also speeds up settlements as the tokens contain built-in terms of the contract. 

Smart contracts can also be used to ensure compliance with the laws is maintained. This is especially true for the Know Your Customer (KYC) and anti-money laundering (AML) policies that must be observed in every transaction. Smart contracts will reduce the paperwork involved in these procedures, saving realtors time and money. 

III) Improved market security and transparency 

Property tokens transacted on the blockchain networks are cryptographically secured on the ledger system. Access to these tokens is only limited to the investors who are entrusted with the private keys. This goes a long way into ensuring that property is held only by the rightful owner, minimizing fraud. 

In a similar vein, the distributed ledger system maintains records of all transactions in an immutable and transparent manner, further eliminating the possibility of fraudulent activities. As such, before buying tokens, an investor can review all the past transactions to ascertain the true owner of the property token, whether or not the asking price is realistic or not. This way, there won’t be instances of double-selling nor room for under/overpaying. 

Also, smart contracts further enhance the transparency and traceability of token transactions. In addition to eliminating fraud, the increased transparency brought by smart contracts opens an opportunity for overseas investors to invest in the property market. This translates to more money being channeled into the market, boosting its liquidity. 

IV) Fractional Ownership

In addition to improving liquidity, fractional ownership of property introduces a new investment vehicle through which risk-averse investors can earn passive income. Similar to equities in a security market, tokens can represent multiple owners of a rental property who earn a portion of the rent as passive income. The smart investors can diversify their token portfolio to include land and commercial properties, reducing the overall risk while maximizing returns. 

In theory, tokenization of property offers a myriad of benefits to real estate investors while scaling up the entire market with respect to exponential growth. On the downside, however, tokenization won’t be as easy as many would wish – mainly due to the regulatory hurdles facing blockchain. For starters, many governments across the globe don’t have clear laws governing the issuance of blockchain tokens. Even for those that have already set up laws regulating digital assets view tokens as a type of security or a traditional investment vehicle. This brings in the complex aspect of digital asset taxation, which may scare away investors. 

The issuers of these tokens will also have to invest a substantial amount of time and money in maintaining regulatory compliance with the stringent policies governing digital assets. Even in jurisdictions where the regulations are lenient, marketing property tokens in another jurisdiction where there are different policies will be an uphill task requiring close scrutiny. 

Conclusion

The real estate market has a history of being slow to adapt to emerging technologies. But if the market is determined to do away with long paper processes and slow turnaround time, it has to invest in blockchain technology for the tokenization of property. This will not only solve its long-time problems but also give the market a driver’s seat in the face of modernity and dynamic technological advances.