Categories
Forex Fundamental Analysis

The Impact Of ‘GDP From Agriculture’ News Announcement On The Forex Price Charts

Introduction

Economic output from the Agriculture Sector is non-negotiable for the economy. The increasing population must be fed and meet the demands of consumption at all times. Hence, the Central Government is committed to making positive growth in the Agriculture Sector. Agriculture Sector is the primary sector where Government Spending goes.

Since food is an essential commodity, it is an ever-green industry that will never run out of demand. Hence, understanding this sector can help us understand dependent industries’ performance and expenses associated with personal consumption.

What is GDP from Agriculture?

Gross Domestic Product 

GDP is the measure of a country’s total economic output. It is the total monetary value of all the goods and services produced within the country regardless of citizenship (resident or foreign national).

It is the market value of all the finished goods and services within a nation’s geographical borders for a given period. The period is generally a quarter (3 months) or a year.

Agriculture Sector

Also, it accounts for all the activities associated with crop production called the Primary Sector of an economy. From the point of cultivation to end-marketing of the food products all are accounted under the Agriculture Sector. It primarily includes farming, fishing, and forestry.

The quick increase in the world population has put pressure on the Agriculture sector to bring innovations through science and technology to increase crop yield. Agriculture Sector is the primary source of food for a country’s population.

The Agriculture Sector goes beyond farm business and includes farm-related industries like Food Service and Food Manufacturing (Packaged Foods, Processed Foods).

How can the GDP from Agriculture numbers be used for analysis?

The agriculture sector contributes about 6.4% of the World GDP. The most significant contributor to this being China, followed by India. China accounts for 19.49%, and India accounts for 7.39% of total agricultural output. The United States is in third place. 

It is necessary to understand the economic output of Agriculture is a function of population, as China, India, and the USA are ranked in population terms in the same order.

The three sectors of the economy, namely, primary Sector, secondary (Industry) Sector, and tertiary (Service) sector, contribute to the overall GDP. It is common for developed nations to have a high contribution to GDP from the Service Sector. Developing economies like China, Japan would have higher contributions from the Industry Sector. The underdeveloped economies would have Agriculture or Primary Sector as a leading contributor to GDP.

In the United States, the entire Agriculture Sector contributes about 5.4% of the GDP. The farms have only contributed 1% of GDP, and the rest is contributed to by the dependent industries that rely on agricultural input to produce goods. The Food Service, Textiles, Beverages, Processed Foods, Tobacco products, etc. contribute the remaining 4% to the GDP.

11% of the total U.S. employment is accounted for by the Agriculture Sector, which is about 22 million jobs in 2018. Food accounts for 13% expenditure of an average American Household. 

It is essential to understand that food is an essential requirement for conducting our livelihood. Hence, Government Spending first prioritizes the Agriculture Sector and releases benefit programs to assist the sector and maintain and grow its economic output. The society and Government will quickly collapse if the Agriculture Sector slows down, and that is why it is called the “Primary Sector.”

The Government Outlays on Food Programs and Nutrition Assistance exceeds that of any other federal program. Improper management and assistance to the Agriculture Sector can lead to price hikes in the food industry. It would trigger a negative response from the public that could cost them in the next elections. Hence, the Government is committed to assisting the Agriculture Sector at all times, good or bad.

Impact on Currency

GDP from Agriculture in itself is not a high impact indicator, as the broader measures like Real GDP and GDP Growth Rates are more important for the Currency Markets. 

GDP from Agriculture does not paint the full picture of the economy, but can be an essential tool for the Central Authorities to keep track of Agriculture Sector performance. Businesses dependent on Agriculture input may use this data to understand potential business opportunities amongst different countries. Still, for the International Currency Markets, it does not serve as a useful indicator.

It is a proportional and lagging indicator. Higher GDP from Agriculture is good for the economy and its currency, and vice-versa.

Economic Reports

For the United States, the Bureau of Economic Analysis releases quarterly GDP figures on its official website every quarter. The release schedule is already mentioned on the website and is generally released one month after the quarter ends.

In the full report, we can extract the GDP from Agriculture figures. We can also go through GDP by Industry to get the Construction Industry performance in the report. Major international organizations like the World Bank, CIA World Factbook, etc. actively maintain GDP by Sector figures of most countries on their official website.

Sources of GDP from Agriculture

For the United States, the BEA reports are available in the sources mentioned below. 

GDP -BEAGDP by Industry – BEAFARM – GDP

The St. Louis FRED keeps track of all the GDP and its related components in one place on its official website hereWorld Bank also maintains the Agriculture Sector as a percentage of GDP on its official websiteWe can find GDP sector composition for different countries here. We can find the consolidated list of Agriculture – GDP figures for most countries here.

Impact of the “GDP from Agriculture” news release on the Forex market

The agricultural sector plays an essential role in the process of economic development of a country. It contributes to the economic prosperity of advanced countries, and its role in the economic development of underdeveloped countries is of vital importance. In other words, countries where per capita real income is low, the emphasis is laid on agricultural and other primary industries.

History tells us that agricultural prosperity contributed considerably to the national income and the GDP. When we are talking about the impact of this contribution on the currency, we will have to say that it is least and not of much importance to investors. They look at broader data, which is the GDP, and make decisions based on the reading. 

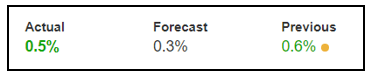
In today’s example, we will examine the impact of GDP on different currency pairs and observe the volatility due to the news announcement. The below image shows the latest quarter GDP data of Australia, where it was more or less the same as in the quarter. Let us find out the reaction of the market to this news release.

AUD/USD | Before the announcement:

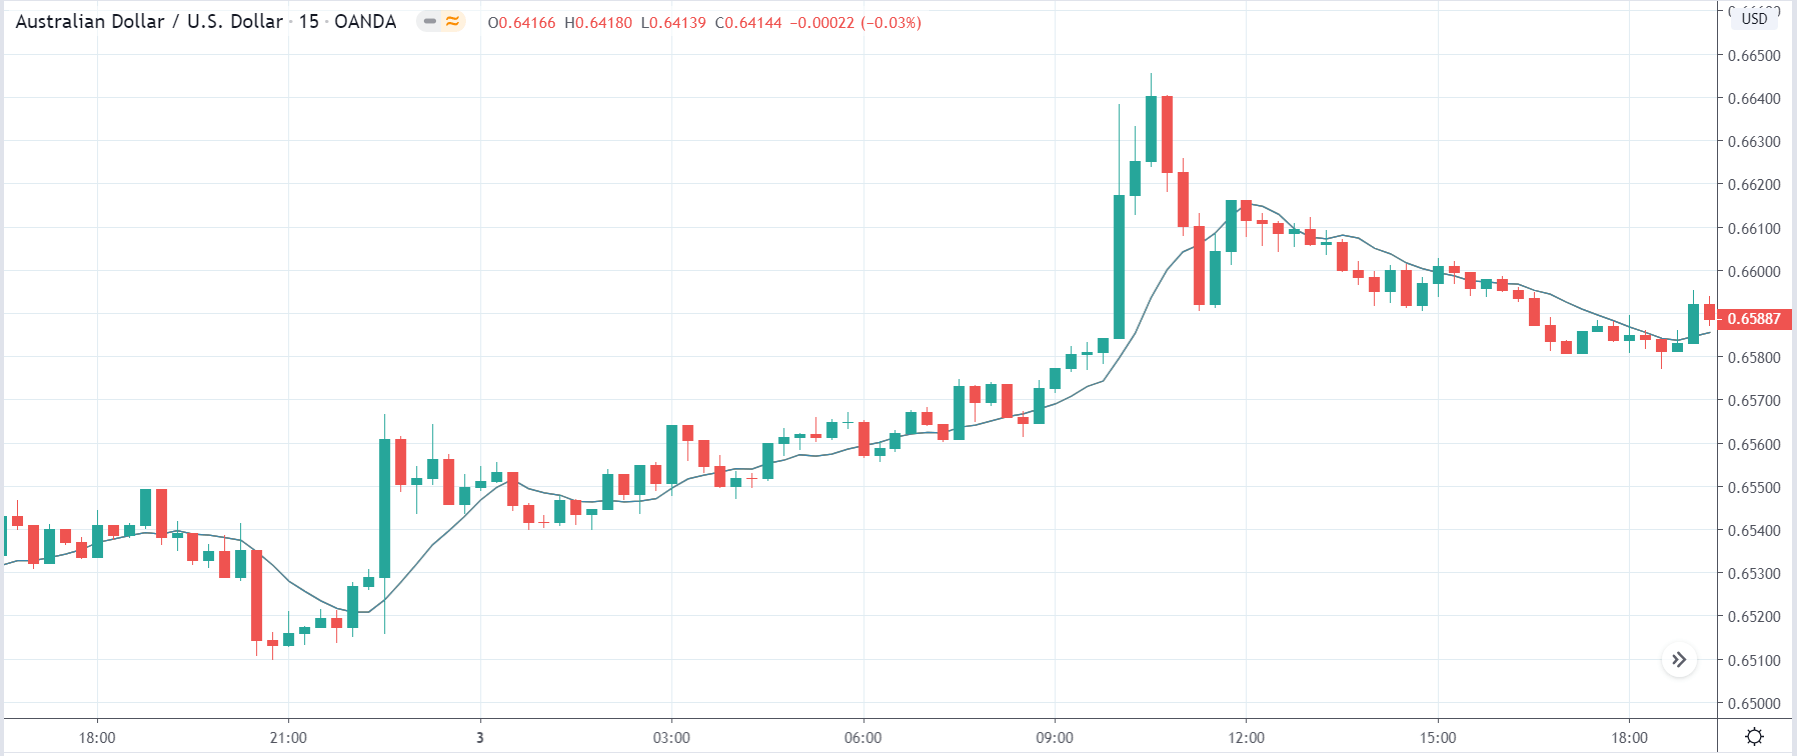
We will first look at the AUD/USD currency pair to observe the impact of GDP on the Australian dollar. In the above image, we see that the market is in an uptrend, and recently the price seems to have retraced the up move. This is an ideal chart pattern for joining the trend, but since a significant news announcement is due, we need to wait to understand the impact it creates on the chart.

AUD/USD | After the announcement:


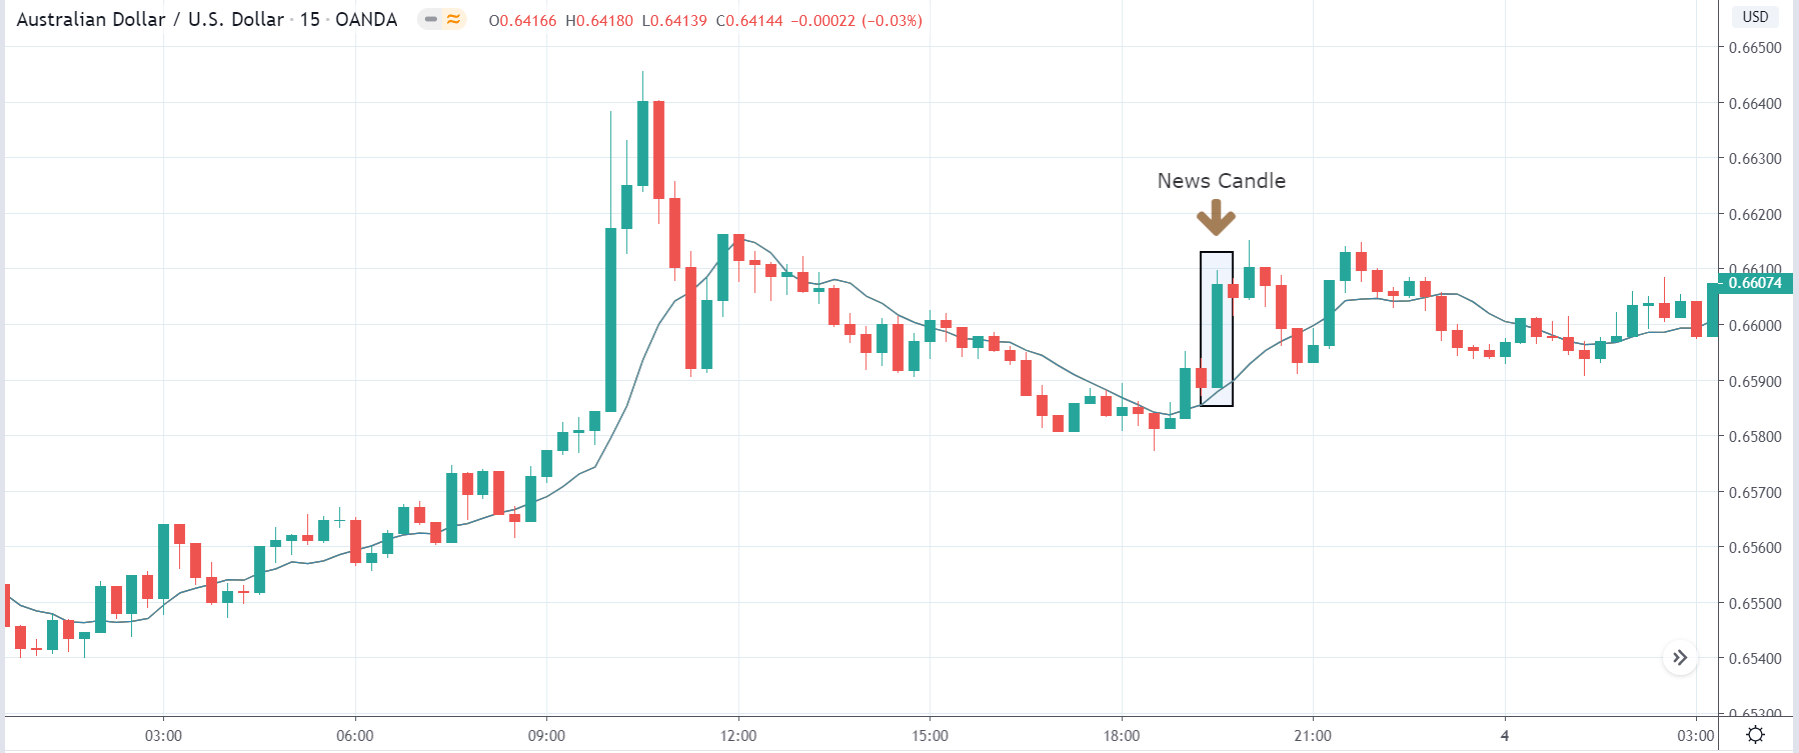
After the news announcement, the market moves higher, where the price rises sharply above the moving average. The bullish ‘news candle’ is a consequence of better than expected GDP data, which was higher by 0.2%. Although it was marginally less than the previous quarter, it turned out to be positive for the currency. This is a confirmation sign of trend continuation where one can expect a new ‘higher high.’      

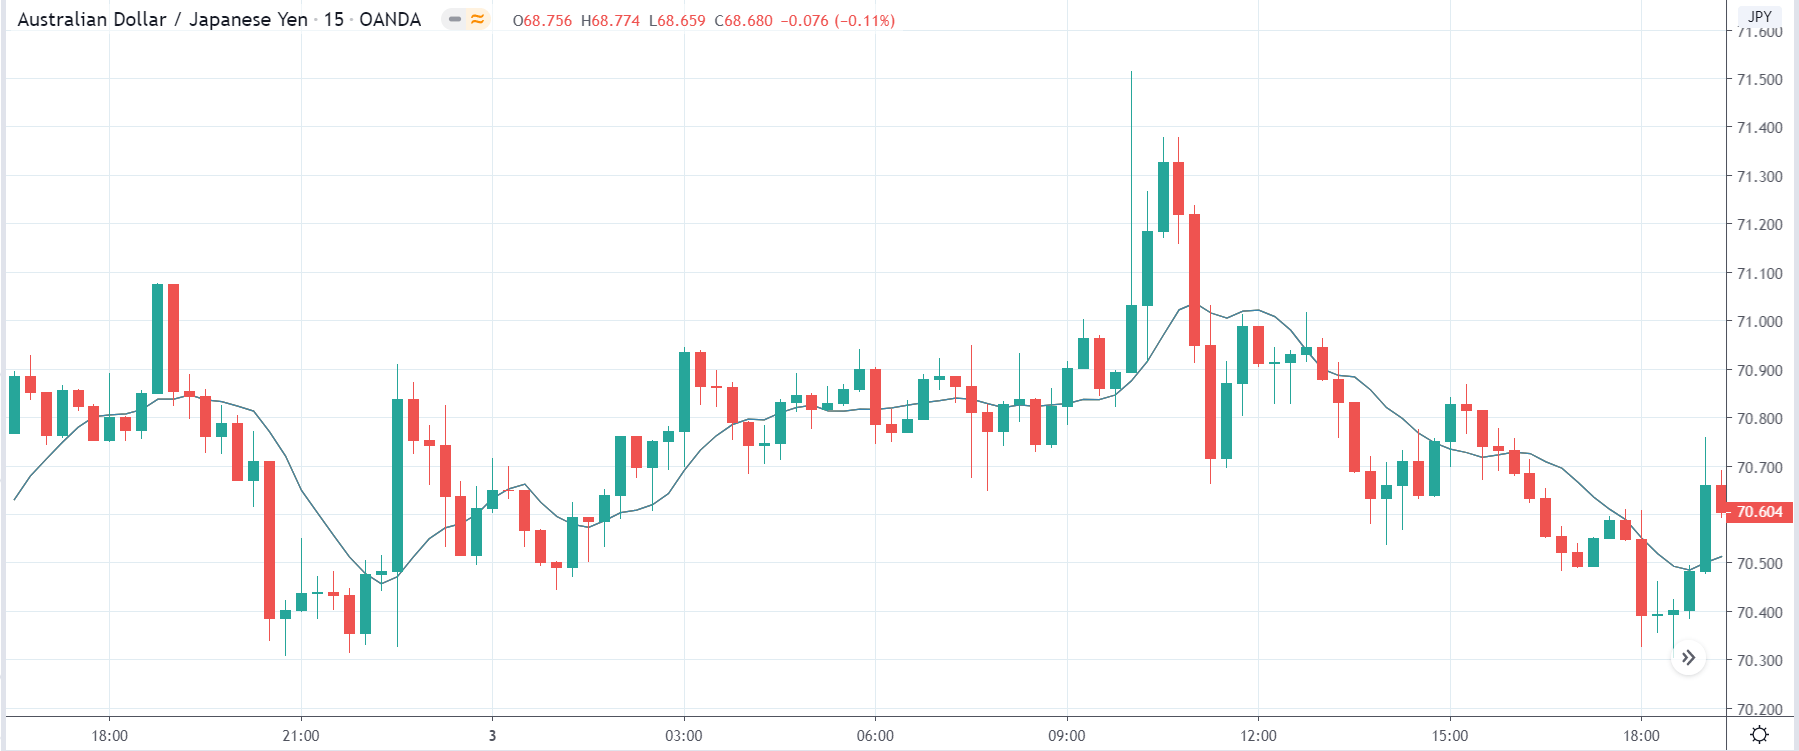
AUD/JPY | Before the announcement:

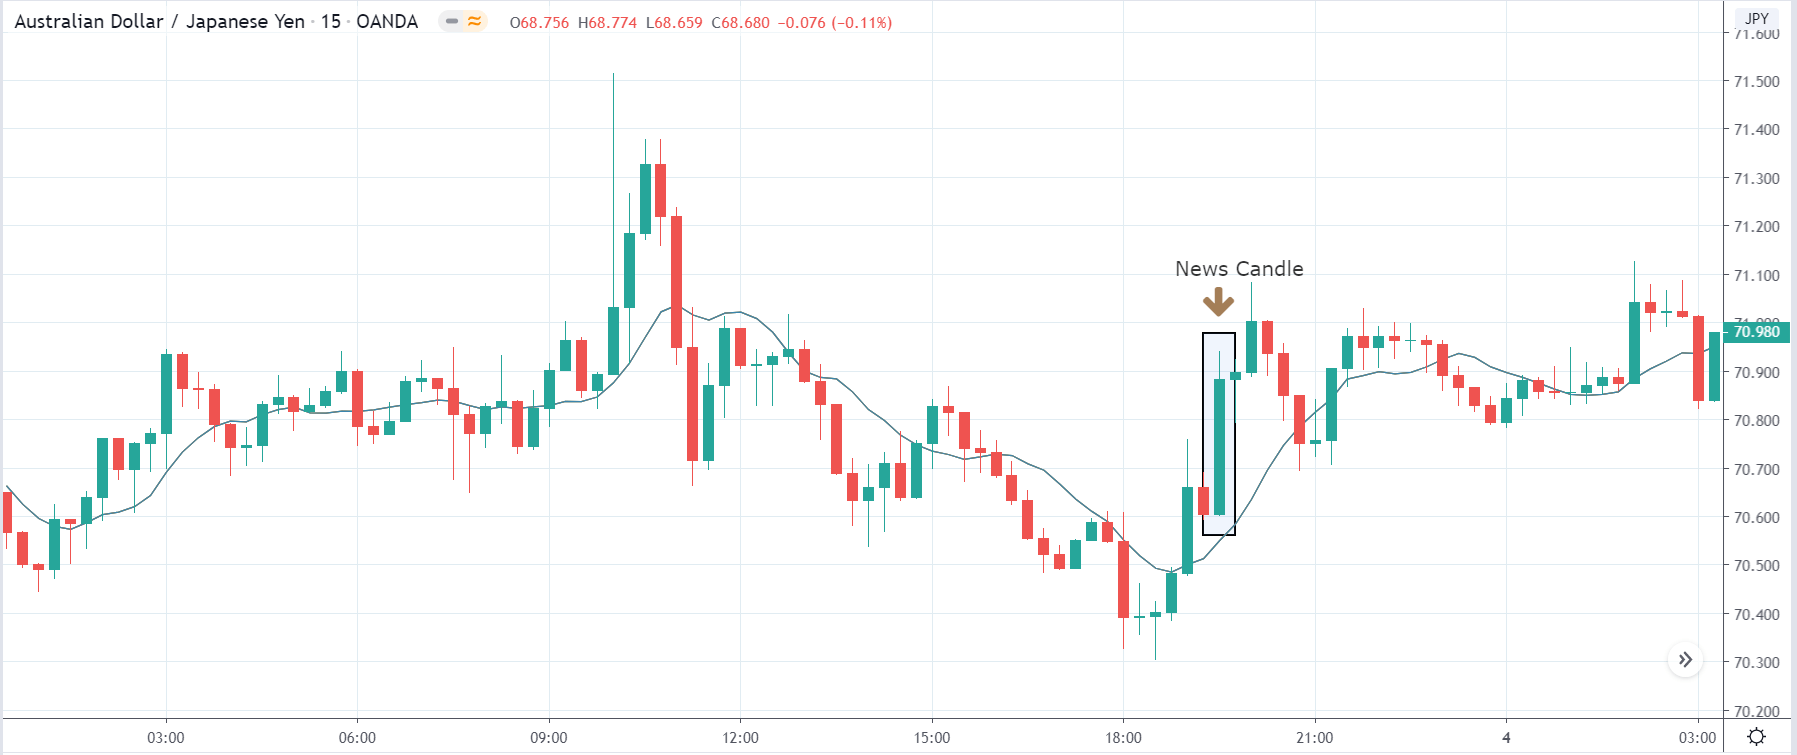
AUD/JPY | After the announcement:

The above images represent the AUD/JPY currency pair, where the market moves within a ‘range’ before the news announcement. We also notice an initial reaction from the ‘support’ where the price has moved higher from the ‘low.’ Since economists have forecasted a lower GDP estimate in the fourth quarter, it is not recommended to take a ‘long’ position before the news release.

After the news announcement, we see that the price quickly moves up, and market surges to the upside. As the GDP data was beyond expectations, traders bought Australian dollars and strengthened the currency. Therefore, the news release has a hugely positive impact on the currency pair. In this pair, once needs to be cautious before taking buy trade as the price is at the top of the ‘range.’ 

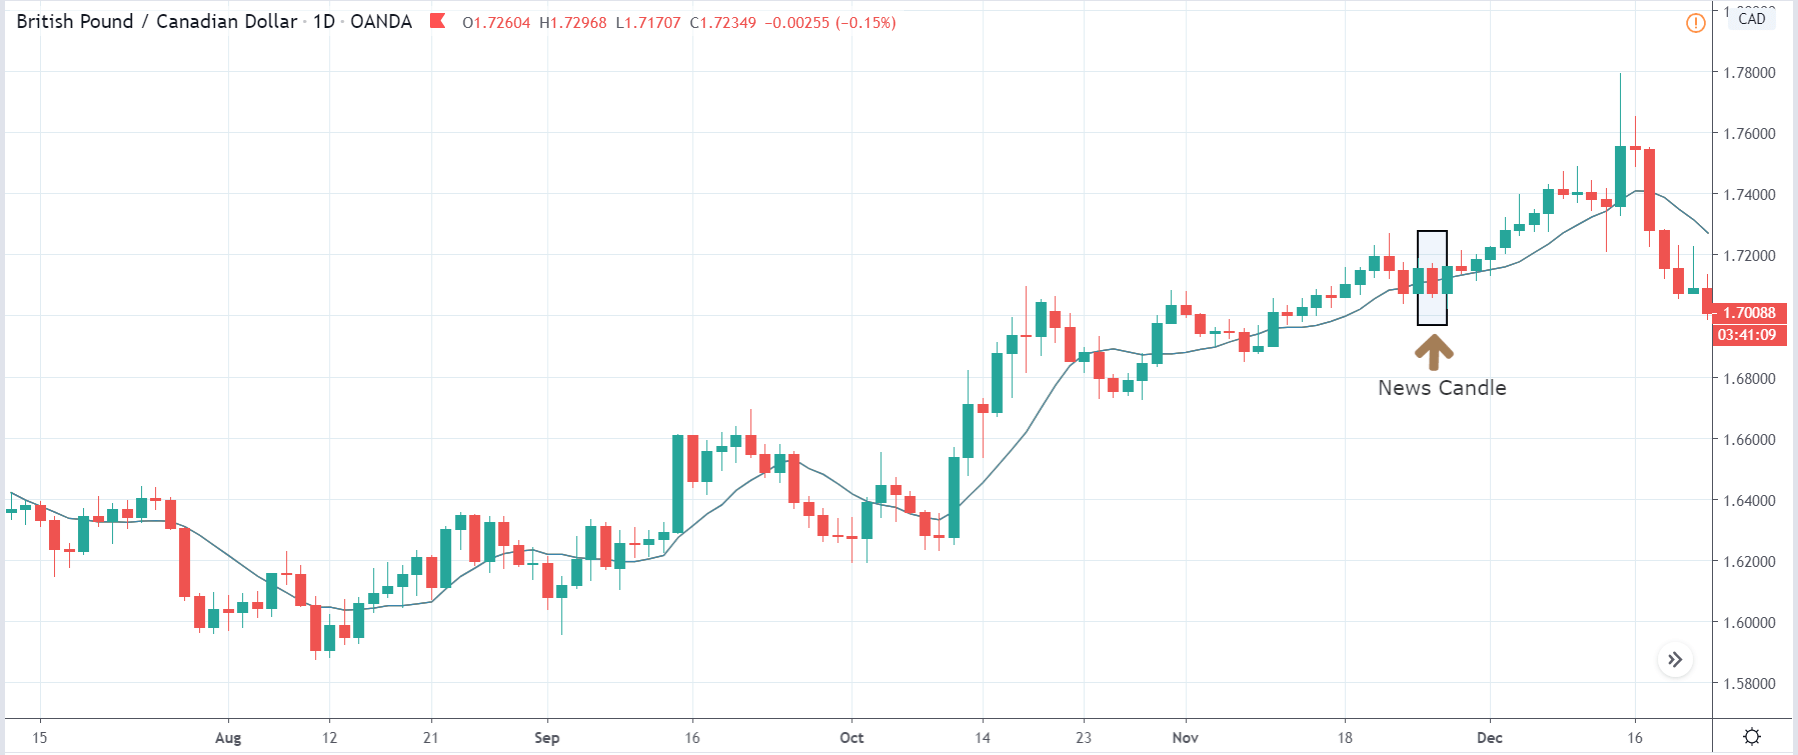
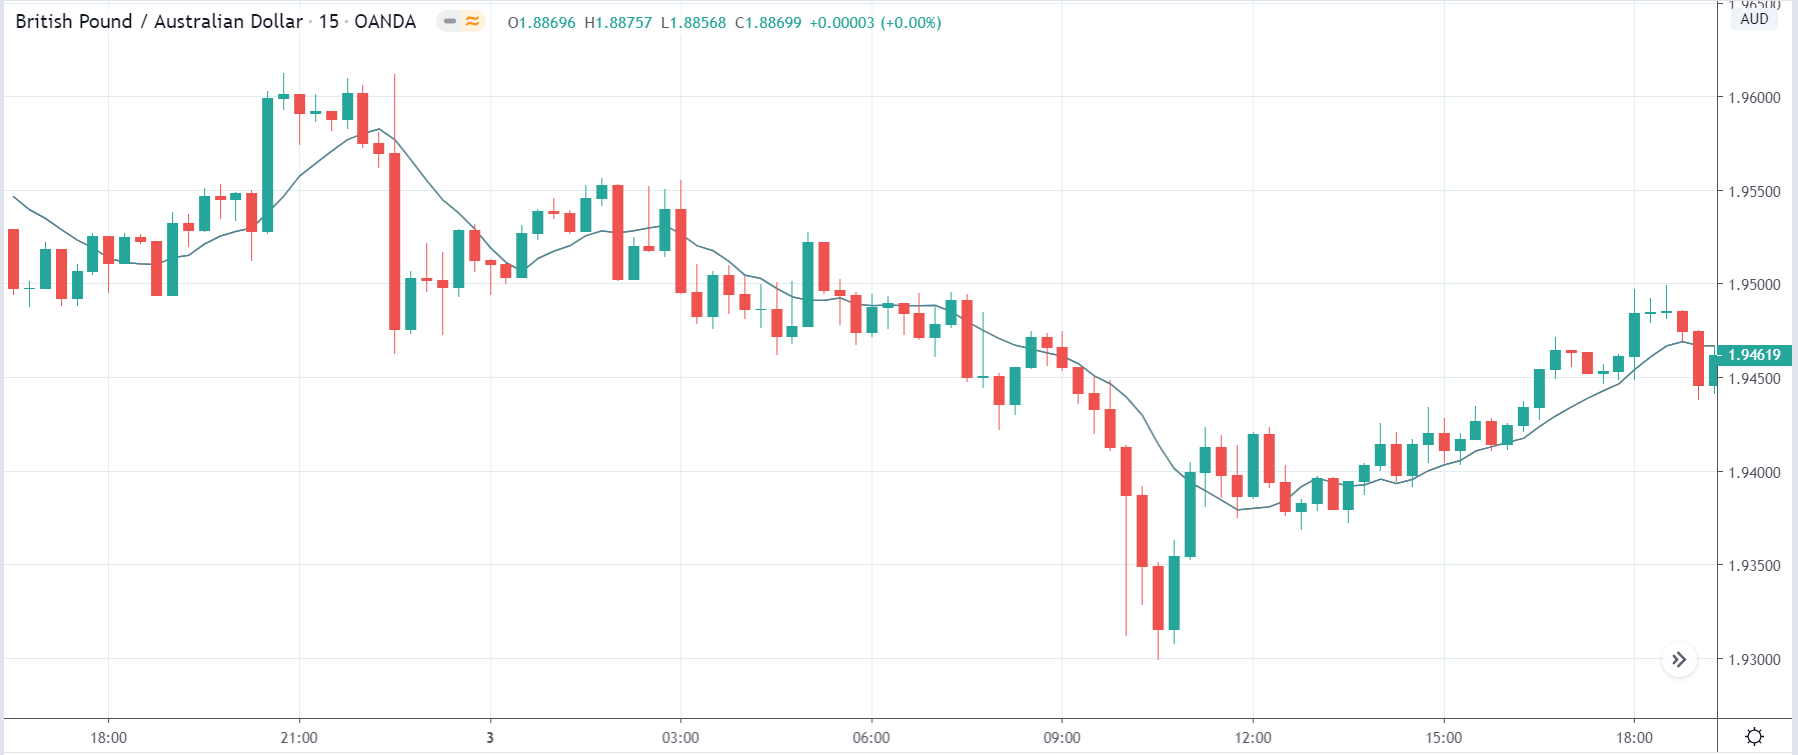
GBP/AUD | Before the announcement:

GBP/AUD | After the announcement:

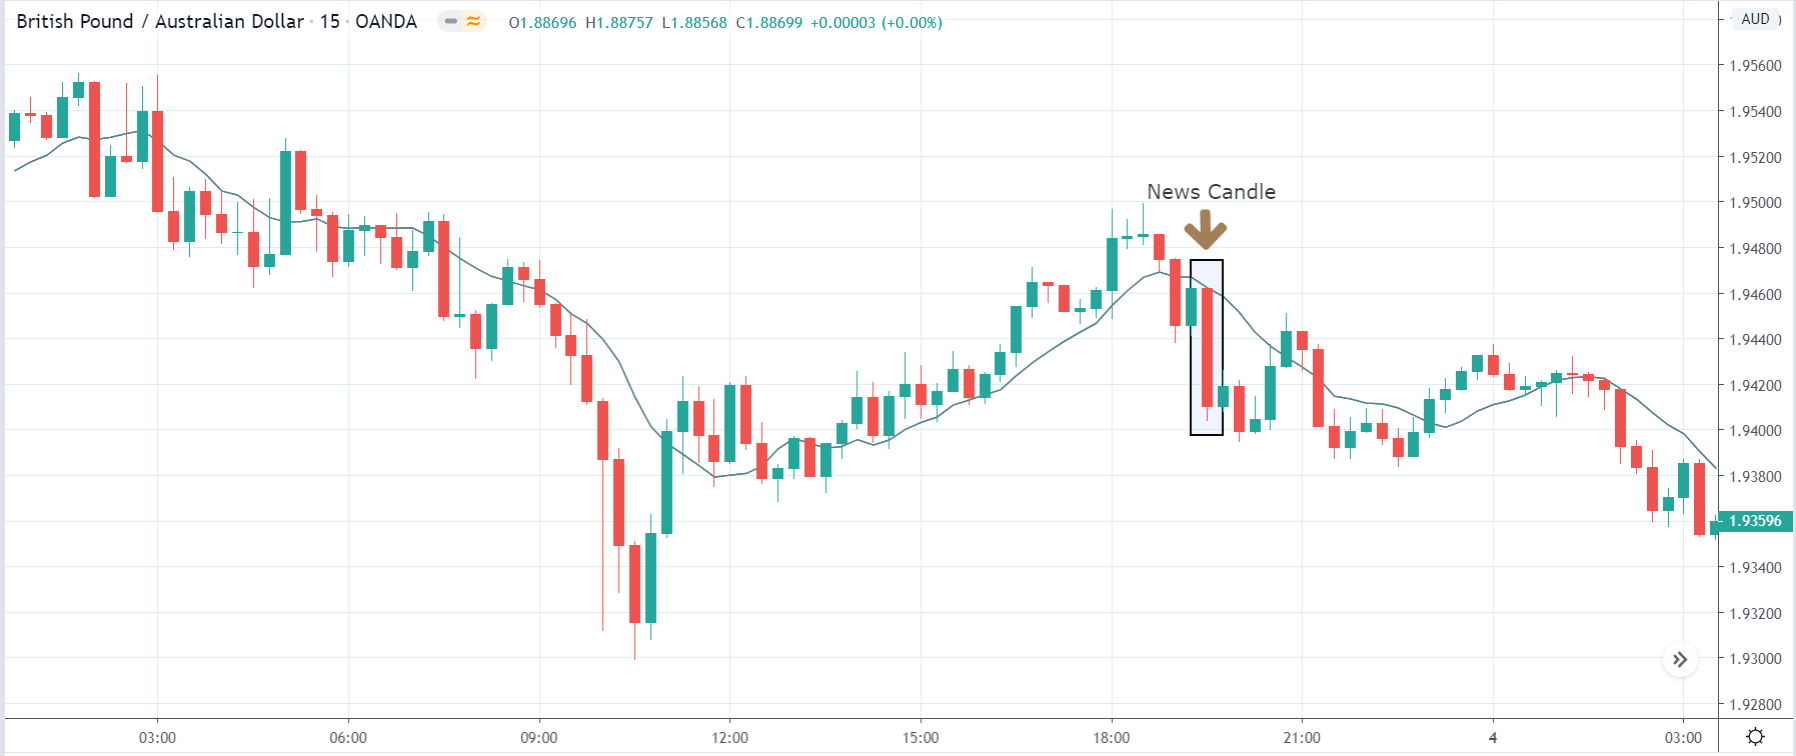
The above images are that of GBP/AUD currency pair, where we see that before the news announcement, the market has retraced the downtrend by more than half, indicating that the Australian dollar has gained strength newly. After the occurrence of trend continuation candlestick patterns, it could result in a flawless sell trade. However, there is also a probability that the news release could change the dynamics of the chart.

After the news announcement, market crashes and the price significantly moves lower. As the GDP data was positive for the economy, it leads to bullishness in the Australian dollar resulting in the price fall. One could take a risk-free ‘short’ position at this point, expecting the market to move much lower.

That’s about ‘GDP from Agriculture’ and its impact on the Forex market after its news release. If you have any questions, please let us know in the comments below. Good luck!

Categories
Forex Fundamental Analysis

The Impact Of ‘GDP Constant Prices’ News Announcement On The Forex Market

Introduction

GDP Constant Prices is the primary indicator used by Government Agencies, Economists, Investors, Traders for year-to-year analysis of economic progress. GDP Constant Prices is the real scorecard for a country’s progress. 

It is a national level indicator and is closely watched by the market. The most important fundamental indicator Real GDP Growth Rate is derived from GDP Constant Prices. Hence, overall it is very critical for us to understand GDP Constant Prices and its nuances for correct interpretation.

What is GDP Constant Prices Indicator?

Gross Domestic Product (GDP) 

GDP is the measure of a country’s total economic output. It is the total monetary value of all the goods and services produced within the country regardless of citizenship (resident or foreign national).

Nominal GDP is also called Current Dollar GDP. It is the market value of all the finished goods and services within a nation’s geographical borders for a given period. The period is generally a quarter (3 months) or a year.

The commonly used term “size of the economy” refers to this economic indicator. USA has the world’s biggest economy, which means it has the highest nominal GDP or highest economic output.

GDP Constant Prices

It is the inflation-adjusted GDP value. It is the total monetary value of all goods and services produced, excluding the effects of inflation in prices. It is also called Real GDP, Constant Dollar GDP, Inflation-Corrected GDP, or only Constant Prices. The raw value of the economic output is called the Nominal GDP, whereas Real GDP accounts for inflation effects and is a more accurate measure of growth.

GDP Constant Prices or Real GDP is obtained by dividing the Nominal GDP with a GDP deflator. The GDP deflator is an inflation measurement from a fixed base year. Real GDP is inflation-adjusted to compare on an as-if basis with the base year GDP. It means GDPs are compared as if the prices remained the same as the base year and see if the GDP has improved due to increased economic activity.

Calculating GDP Deflator is a bit tedious process, that is best left to the experts like the Bureau of Economic Analysis. The Real GDP is made up of the following components and is affected by them:

A) Consumer Spending: It represents spending associated with the end-consumers or the general population. It makes up about 69% of the total GDP in the United States.

B) Business Investment: Economic Output of the Business Sector makes up 18% of the total GDP in the United States. 

C) Government Spending: It involves all the expenditures incurred by the Government to maintain and stimulate economic growth and run its operations. It accounts for 17% of the total economic output for the United States.

D) Net Exports: It is the difference between the total exports and imports. The United States has a -5% Net Exports of the total GDP, meaning it is a net importer.

How can the GDP Constant Prices numbers be used for analysis?

Inflation is the underlying fire that drives capitalist economies. In general, a low inflation rate of 2-3 % a year is good for the economy. A stable inflation rate of 2-3% will stimulate economic growth to achieve a 3-5% annual GDP growth for developed economies.

As prices increase year-over-year, the economic output will also seem inflated even though it is the same as the previous year. Hence, Real GDP is a more accurate measure of scoring the economic output of a country.

Nominal GDP is useful when comparing economic output within a year among different quarters, while it is more sensible to use Real GDP for year-over-year comparison. Policymakers use both Nominal and Constant Prices GDP for economic assessment and implementing policy reforms as deemed necessary.

When inflation is positive (which is the cast most of the time), the GDP Constant Prices will be lesser than Nominal GDP. When there is deflation in the economy (during slowdowns or recessions), the GDP Constant Prices may be higher than the nominal GDP value.

GDP Constant Prices is better for assessing long-term growth, or knowing whether the economy has grown over the previous year or not. With Nominal GDP, it is difficult to tell whether an increase in the figures is due to an expanding economy or just a factor of inflating prices of goods and services.

Impact on Currency

GDP data is essential for almost everyone. Economists use for macroeconomic analysis and Central Bank planning. Policymakers are committed to maintaining a steady Real GDP Growth. Hence, Central Authorities also watch it tightly.

Investors make decisions based on GDP data. Businesses hold their expansion plans based on economic stability and market stability, as indicated by GDP. Traders heavily trade once GDP estimates and actual figures are published.

Hence, overall it is a high impact indicator. It is a proportional macroeconomic indicator, meaning higher GDP Constant Prices are suitable for the overall economy and currency. The opposite also holds. 

Lower Real GDP prints indicate weakening economy, businesses hold hiring or investment plans, spending is reduced, and in extreme cases, it can lead to a recession. All of this leads to currency depreciation.

Economic Reports

In the United States, the Bureau of Economic Analysis publishes quarterly and annual Nominal and Real GDP reports on its official website. It is released almost 30 days after a quarter ends. The schedule of release is available on the website. The headline number is the GDP Constant Prices figure, GDP Growth Rate figure.

Major international organizations like the World Bank, International Monetary Fund, OECD, etc. actively maintain track of most countries’ GDP figures on their official website.

Sources of GDP Constant Prices

For the United States, the BEA reports are available here 

The St. Louis FRED keeps track of all the GDP and its related components in one place on its official website here:

GDP & GNP – FRED

Real GDP – FRED

The World Bank GDP Constant Prices with base year as 2010 in US Dollar terms are available here:

GDP Constant Prices (2010 US$) – World Bank

OECD – GDP Constant Prices and other variants

We can find a consolidated list of most countries’ GDP Constant Prices here.

Impact of the ”GDP Constant Prices” news release on the Forex market

GDP Constant Prices, also known as real GDP, is a measure of GDP that has been adjusted for the price level. Current prices measure the GDP using the actual prices we notice in the economy. Current prices make no adjustments for inflation. However, constant prices adjust to the effects of inflation. Using persistent prices enables us to measure the actual change in the outcome and not just rise due to inflation’s effects. The real GDP is calculated by dividing nominal GDP over a GDP deflator. When nominal is higher than real, inflation is occurring, and when real is higher than nominal, deflation is occurring. Fundamentally speaking, nominal GDP matters to investors when taking a position in currency or the stock market.      
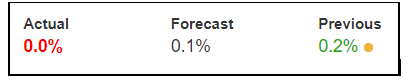
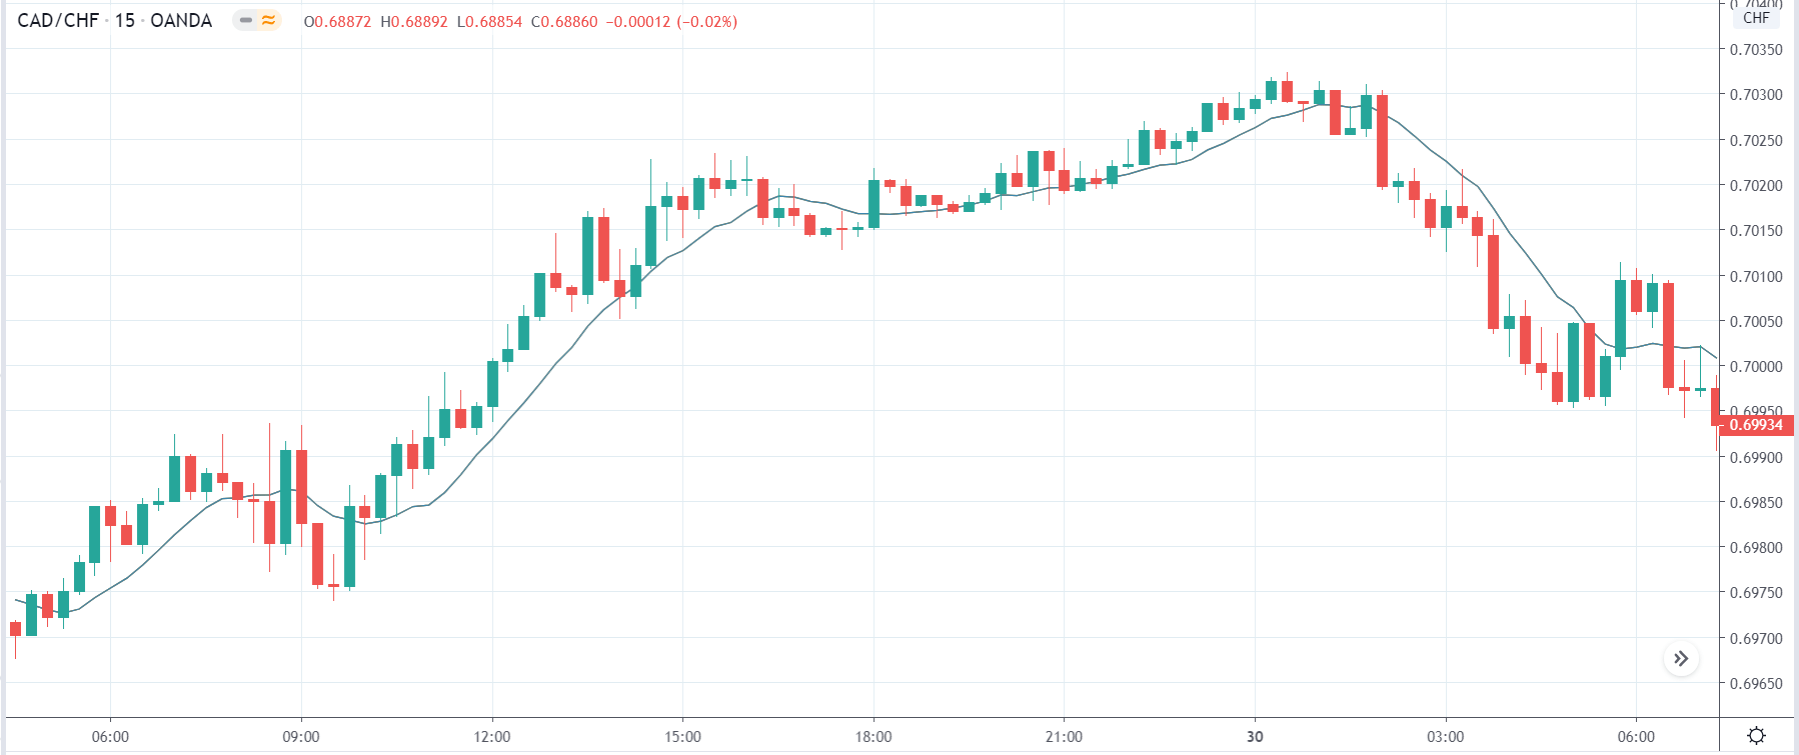
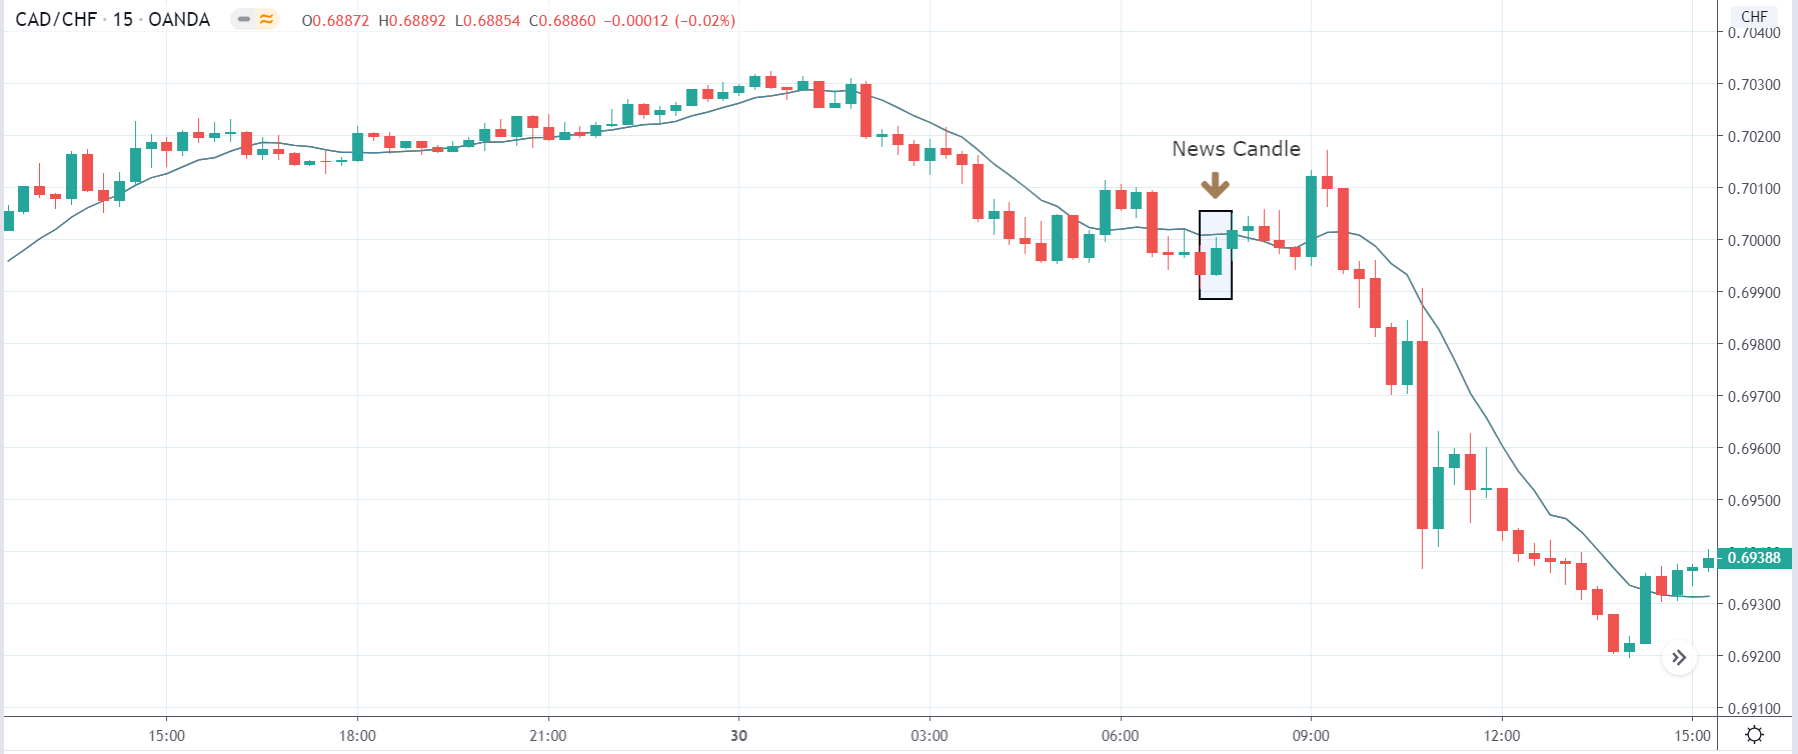
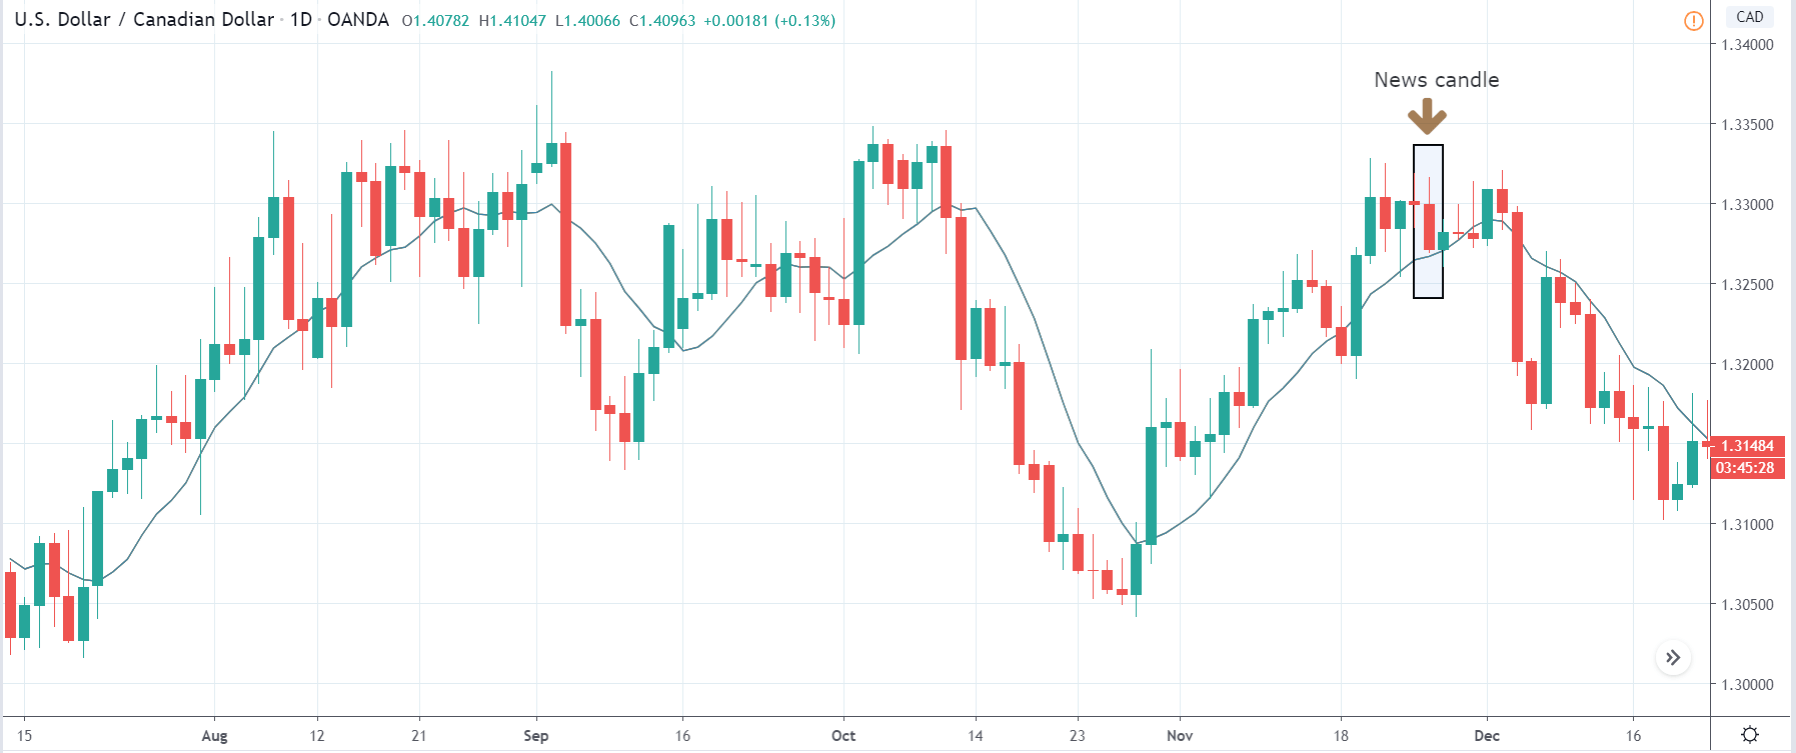
In today’s lesson, we will analyze the impact of GDP on various currency pairs by observing the change in volatility before and after the news announcement. For that purpose, we have collected the GDP data of Canada, where the below image shows the month-on-month GDP data released recently. Let us find out the market’s reaction to this data.

USD/CAD | Before the announcement:

We will start with the USD/CAD currency pair to observe the impact of GDP on the Canadian dollar. The above image shows the state of the chart before the news announcement, where we see that the market is in a downtrend, and recently the price has reversed to the upside. Either could result in a reversal of the trend or a continuation of the current trend. The impact of GDP will decide the direction of the market and so our position. 

USD/CAD | After the announcement

After the news announcement, the price drops below the moving average, and the market falls considerably owing to the positive GDP data. Even though there was a decrease in the GDP, it was only a tad bit lower and much around the market expectations. Hence, it proved to be bullish for the Canadian dollar, and the market goes lower. One should confirm the continuation of the trend using technical indicators before taking a ‘short’ trade.

GBP/CAD | Before the announcement:

GBP/CAD | After the announcement:

The above images represent the GBP/CAD currency pair, where we see in the first image that the market has broken out from a downward ‘channel’ and is moving higher and higher from then on. It very likely that the up move will continue further, which makes us wait for a price retracement to take a buy trade. Based on the volatility caused by the news release, we will have a clear idea about the direction of the market.

After the news announcement, volatility slightly increases to the downside, and the market falls by a few pips. The bearish ‘news candle’ is a consequence of the positive GDP data, mostly on expected lines. We need to note that the news release did not change the overall trend of the market, where the uptrend is still intact.    

CAD/CHF | Before the announcement:

CAD/CHF | After the announcement:

The above images are that of CAD/CHF currency pair, where we see that before the news announcement, the market has reversed from an uptrend to a downtrend and is currently on the verge of continuing the downward move. Since the GDP has a high impact on the currency (indicated by the red box), it is advised not to take any position before the news release.

After the news announcement, the price moves higher by a small amount and manages to close on a bullish mark. The GDP data was close to what was expected, it leads to bullishness within a currency, and hence the Canadian dollar gains strength for a short while.

We hope you understood the concept of ‘GDP Constant Prices’ and how the Forex price charts get affected after its news release. All the best. Cheers!

Categories
Forex Fundamental Analysis

Everything About ‘Changes in Inventories’ Macro Economic Indicator

Introduction

Changes in Inventories are one of the primary business leading economic indicators that can give us insight into economic prospects for the coming months. Understanding of Inventory Changes and Sales can help us forecast economic growth, which is our primary objective through Fundamental Analysis.

What are Changes in Inventories?

Inventory: It is the stock of goods that retailers, wholesalers, and manufacturers hold with them. Inventory is measured in their appropriate dollar values. Businesses often keep stock of their finished goods when they predict an increase in sales in the coming months so that they are ready to meet the increased demand and can lock in profits.

The Monthly Retail Trade Survey, the Manufacturer’s Shipments, Inventories, and Orders Survey, and the Monthly Wholesale Trade Survey are the primary sources from which Business Inventory is compiled.

At the level of Retail Merchandise, Inventories are measured at cost level at the retailers as per the FIFO (first-in, first-out) method of valuation. At the Wholesalers who distribute goods to retailers, the inventories’ values are added to the business inventories every month. At the manufacturer level, the inventories, whether in raw material, work-in-process or finished, are valued at cost, primarily by the FIFO method of valuation.

How can the Changes in Inventories numbers be used for analysis?

Business owners and retailers have a certain kind of acquaintance with market trends, and due to their years of experience running their business, they know the subtle trends of increase in sales, demand, etc. Hence, Businesses stocking up on inventories is not a joke, as it costs them real money for producing as well as holding the stocks. If they did not forecast an increase, they would not have increased inventories in the first place.

Seasonally Adjusted Inventory Changes can thus act as a leading indicator for the increase in consumer consumption, which is good for business, and the economy. On the other hand, increased inventory figures could also indicate that the sales have fallen, and thus creating an inventory stockpile, which indicates decreased consumer spending, which signals terrible times for the economy are ahead.

Hence, it is often essential to combine Inventory figures with Retail Sales figures to correctly gauge the economic trend. Retail Sales figures indicate actual consumption of goods by consumers and hence is the more accurate figure when compared to Changes in Inventories.

An increase in Manufacturing Production is followed by an increase in Inventory. It is then followed by an increase in Retail Sales. The first two stages, i.e., increase in Manufacturing Production and Inventory Changes, are still forecast, i.e., the rolled dice can turn either way. But Retail Sales is a guaranteed economic indicator, as money comes back into the pockets of retailers and manufacturers.

Hence, the more commonly watched statistic out of the business inventories figures is the Inventory-to Sales Ratio. It is the ratio of Inventory value to Retail Sales figures. It gives us an indication, by how many times the inventories outpace the Retail Sales. The lesser the number, the better.

For example, an Inventory-to-Sales Ratio of 2.5 indicates that there is enough inventory stock to supply 2.5 months of Retail Sales. When the ratio increases, it is an indication that the inventories are increasing in contrast to the sales, which indicates the economy is slowing down. The upcoming Production activity would be reduced until the current Inventory stock starts to deplete off. On the other hand, when the ratio is falling, it is indicative of manufacturers to increase production activity to the oncoming increase in demand.

Inventories are primarily concerned with the Manufacturing Sector, which accounts for 20% of GDP in the United States. It drives a significant portion nonetheless.  An increase in manufacturing activity as a consequence of decreasing ratio figures can add to employment, or even wage growth, which is good for the economy. Increased employment further stimulates Consumer Spending as more people have the cash to spend, which cyclically boosts the economy.

Impact on Currency

Changes in Inventory figures can be leading indicators. If correctly put, way too leading. It means that the changes in inventories are figures at the start of the manufacturing process-consumer purchase lifecycle. The indicator has two-way conclusions to be drawn, as discussed above. Hence, the traders who are not well versed with the industry should use this indicator with caution, as an increase in Inventory can mean slowdown or expected growth both.

Only investors or traders who have a historical perspective of the figures can use this indicator effectively to predict growth months ahead of the market. In general, the market follows Retail Sales and Ratio as reliable metrics, and hence there are significant moves in the market around these figures. Hence, although a leading indicator of economic growth, it is advised to combine it with Retail Sales figures to affirm your assessment of economic activity.

Economic Reports

In the United States, the Bureau of Economic Analysis releases quarterly reports of the GDP, wherein the section of “Key Sources and Assumptions” contains the details of “Changes in Private Inventories.” The BEA publishes quarterly reports on its official website after every quarter. The release dates are also posted on its official website.

The United States Census Bureau maintains the Manufacturing & Trade Inventories on its official website.

Sources of Changes in Inventories

BEA – Gross Domestic Product

The St. Louis FRED website makes the search and analysis of Inventories data from BEA a lot easier. The links are given below

Change in Private Real Inventories – FRED

Change in Private Inventories – FRED

Census Bureau – Inventory

Census Bureau – Shipment, Inventory, and Orders

Inventory data for various countries are available in statistical and list format here.

Impact of the ‘Change in Inventory’ news release on the Forex market

The Change in Inventory measures the value of change in producer-owned inventories between the beginning and the end of the calendar year. For businesses, the build-up of inventories can be a threat. The problem is that these inventories will probably be cut in the future, depressing demand for goods and leading to production cutbacks. In hard times, managers work hard to cut back on inventories. All companies need to be prepared for business cycles, which is driven by inventory swings. Companies must try to reduce their inventories by reevaluating their practices.

In today’s lesson, we will analyze the change in inventory levels of many agricultural commodities, particularly grains, that are produced in a given year and stored or held until they are marketed. The annual value of inventory change represents the gross value of agricultural production. The below image shows the net Change in Inventory from 2017 to 2018 in the agricultural sector of Canada. This value has been estimated for durum wheat, oats, rye, corn, soybean, potatoes, tobacco, and many other commodities. Let us find out how the market responds to this data.

USD/CAD | Before the announcement:

Let us start with the USD/CAD currency pair in order to observe the impact of the Change Inventory on the Canadian dollar. In the above image, we see that the market is in moving within a ‘range,’ and currently, the price is at the top of the ‘range.’ Since the impact of this news event is less on a currency, aggressive traders can take ‘short’ positions with a large stop loss.

USD/CAD | After the announcement:

After the news announcement, the market moves lower, and the price reaches to the moving average. The bearish ‘news candle’ indicates that the Change in Inventory data was positive for the Canadian economy, which resulted in the strengthening of the currency. The close of ‘news candle’ is a confirmation sign of a down move. Thus, one could take a risk-free ‘short’ position soon after the news release.

CAD/JPY | Before the announcement:

CAD/JPY | After the announcement:

The above images represent the CAD/JPY currency pair, where we see that before the news announcement, the market seems to be moving in a ‘channel’ with the price presently is at the bottom of the ‘channel.’ Since the Canadian dollar is on the left-hand side of the currency pair, an upward channel signifies strength in the currency. Therefore, traders who trade channel can buy the currency pair with a stop loss below an appropriate technical level.

After the news announcement, the price moves higher, and volatility expands on the upside. The ‘news candle’ closes with a fair amount of bullishness as a result of better than expected Change in Inventory data. At this point, once could confidently take a ‘long’ position with a target up to the higher end of the ‘channel.’

GBP/CAD | Before the announcement:

GBP/CAD | After the announcement:

The above images are that of GBP/CAD currency pair, where we can see in the first image that the market is in a strong uptrend, which signifies the great amount of weakness in the Canadian dollar. Technically, we should be looking to buy the currency pair after a price retracement to a ‘support’ or ‘demand’ area. Until then, we will be monitoring the impact of the news release.

After the news announcement, volatility slightly increases to the downside, and we witness a fall in the price. However, the Change in Inventory does not have a major on the currency pair where the Canadian dollar strengthens only momentarily. One needs to still wait for a pullback in order to join the uptrend.

That’s about the ‘Change in Inventory’ and the relative impact of its news announcement on the Forex price charts. Let us know if you have doubts regarding the article in the comments below. Cheers!