Introduction
Inflation plays an undeniable role in influencing the fiscal and monetary policies implemented within an economy. These policies’ role is to either mop up money from the economy or inject more money into the economy. Primarily, the rate of inflation tends to fluctuate depending on the amount of money in circulation. When the money in circulation is high, so is the rate of inflation, and when it’s low, the rate of inflation lowers. For this reason, the money supply statistics are vital and can be used as a leading indicator of inflation.
Understanding Money Supply
The money supply is the totality of the cash in circulation within an economy, bank deposits, and other liquid assets that can quickly be converted to cash. Note that the money supply is measured over a specific period, and it excludes any form of a physical asset that must be sold to convert to cash, lines of credit, and credit cards.
There are three commonly used measures of the money supply in an economy. They are M1, M2, and M3.
M1 Money Supply
This measure of money involves the entirety of the cash in circulation, i.e., the amount of money held by the public. This measure includes travelers’ checks, checkable deposits, and demand deposits with commercial banks. The money held by central banks and depository vaults is excluded from this measure. The M1 money supply is also known as the narrow measure of the money supply and can be referred to as the M0 money supply in other countries.
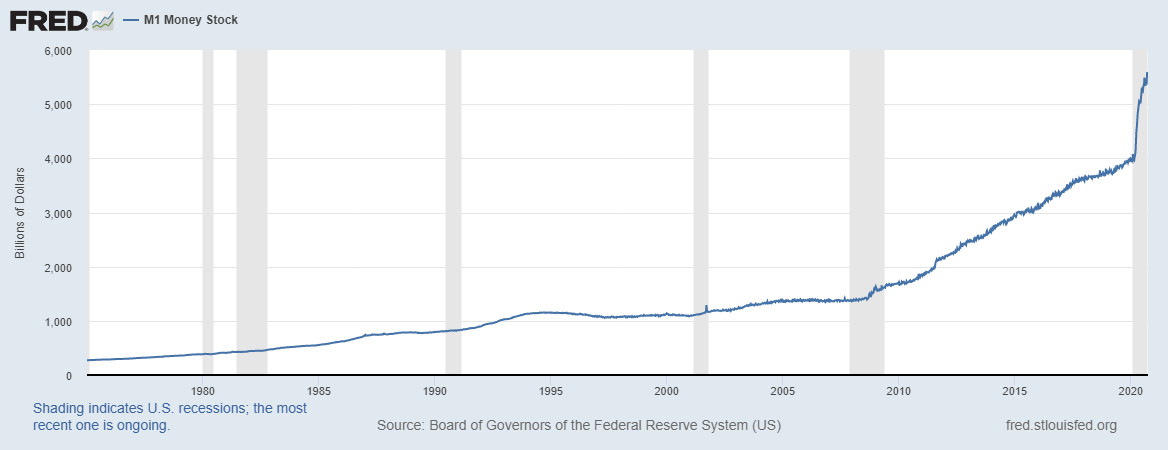
Source: St. Louis FRED
M2 Money Supply
This measure of the money supply is the intermediate measure. It includes the M1 money supply as well as time deposits in commercial banks, savings deposits, and the balance in the retail money market funds.

Source: St. Louis FRED
M3 Money Supply
This measure of the money supply is broad. It includes the M2 money supply as well as larger time deposits depending on the country, shorter-term repurchase agreements, institutional money market funds’ balance, and larger liquid assets. Note that this measure of money mainly focuses on the money within an economy used as a store of value.
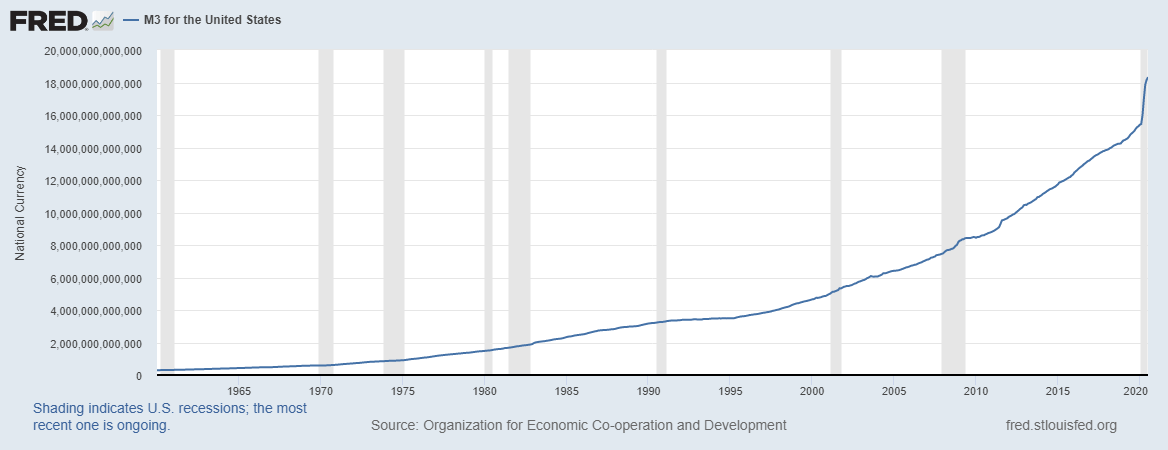
Source: St. Louis FRED
Monetary Base
As a measure of money supply, the monetary base measures the entirety of the money in circulation and those held by the central banks as deposits by the commercial banks.
How to use Money Supply in Analysis
As we noted earlier, both fiscal and monetary policies are influenced by the economy’s money supply. For companies and households, the analysis of money supply not only helps predict the interest rates but also to determine business cycles, expected changes in the price levels and inflation.
Money supply in an economy can be used to analyze and identify seasonal business cycles. When the economy is going through a period of recovery and expansion to the peak, the economy’s money supply will increase steadily. During recovery, there is an increase in aggregate demand, unemployment levels reduce, and households’ welfare improves. At this point, the money supply in the economy begins to increase. The supply rapidly increases during the expansion cycle than during recovery. At the peak, the money supply in the economy stagnates, and the increase is lower than the previous two stages.
Similarly, the money supply begins to drop when the economy is going through a recession to depression. These periods are characterized by a decrease in the GDP levels signaling a shrinking economy, accompanied by higher unemployment levels and diminished aggregate demand in the economy.
Furthermore, an increase in money supply in an economy leads to lower interest rates, which means that businesses and households can invest more in the economy. More so, increased money supply stimulates increased demand by consumers, which leads to increased production and demand for labor. The rise in aggregate demand is followed by increased aggregate supply, which leads to economic expansion and growth of consumer discretionary industries.
Impact on Currency
The most notable impact of the money supply is inflation. Inflation is the increase in the prices of goods and services over time.
When the money supply is increasing, it shows that households have more money to spend, which increases the aggregate demand. Since the supply doesn’t change at the same pace as demand, the resulting scenario is an increase in the prices of goods and services. In most countries, the central banks have a target rate of inflation.
Therefore, when inflation is increasing, the central banks will employ deflationary monetary policies, such as increasing interest rates. The deflationary policies are designed to increase the cost of money and discourage consumption. Therefore, in the forex market, an increase in money supply can be seen as a signal of a future hike in the interest rates, which makes the local currency appreciate relative to others.
Conversely, a decrease in the money supply signals an economic recession, loss of jobs, and a shrinking economy. For governments, preventing economic recessions is paramount. Thus, a constant decrease in the money supply will trigger the implementation of expansionary fiscal policies. The fiscal policies can be accompanied by expansionary monetary policies by the central banks. These policies aim to spur economic growth and are negative for the currency. Therefore, a decrease in the money supply implies a possible interest rate cut in the future, which makes the local currency depreciate relative to others.
Sources of Data
In the US, the Federal Reserve publishes the money supply data and releases it monthly in the Money Stock Measures – H.6 Release. An in-depth review of the US’s total money supply can be accessed at St. Louis FRED, along with the historical data on M1 money supply, M2 money supply, and M3 money supply. Trading Economics publishes data on global M1 money supply, global M2 money supply, and global M3 money supply. In the EU, the data on the money supply can be accessed from the European Central Bank.
How the Money Supply Data Release Affects Forex Price Charts
The most recent release of the EU’s money supply data was on September 25, 2020, at 8.00 AM GMT and can be accessed at Investing.com.
The screengrab below is of the monthly M3 money supply from Investing.com. To the right is a clear legend that indicates the impact level of the FI has on the EUR.

As can be seen, this low volatility is expected upon the release of the M3 money supply data.
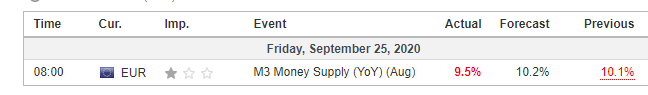
In August 2020, the M3 money supply in Europe grew by 9.5% compared to the 10.1% increase in July. The August increase was lower than analysts’ expectations of 10.2%.
Now, let’s see how this release made an impact on the Forex price charts.
EUR/USD: Before the M3 Money Supply Data Release on September 25, 2020,
Just Before 8.00 AM GMT
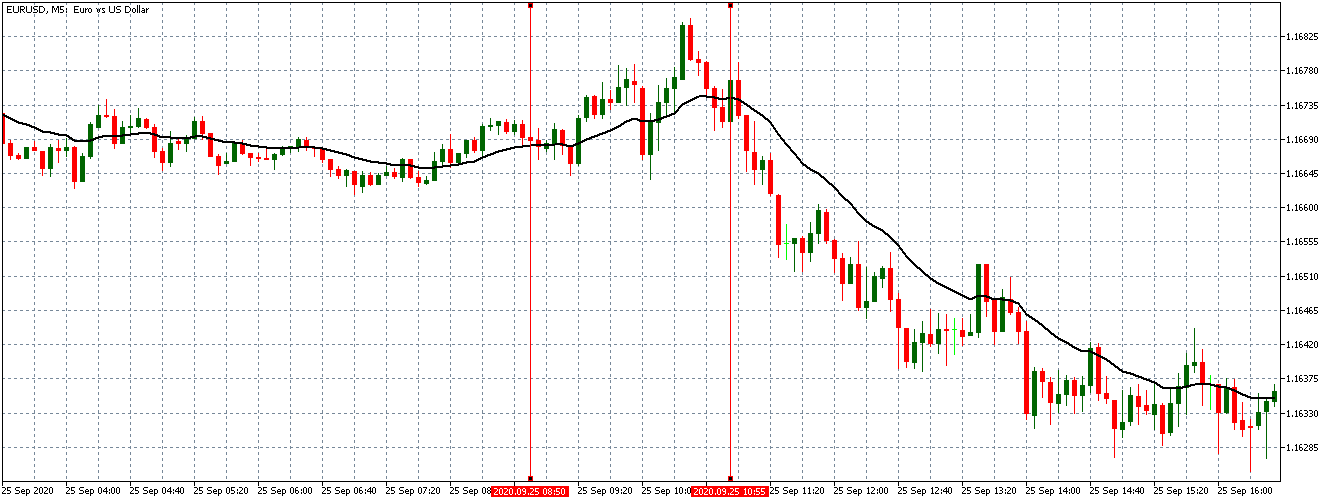
Before the publication of the M3 money supply, the EUR/USD pair was trading in a subdued uptrend. Candles were forming just above a slightly rising 20-period MA.
EUR/USD: After the M3 Money Supply Data Release on September 25, 2020,
at 8.00 AM GMT
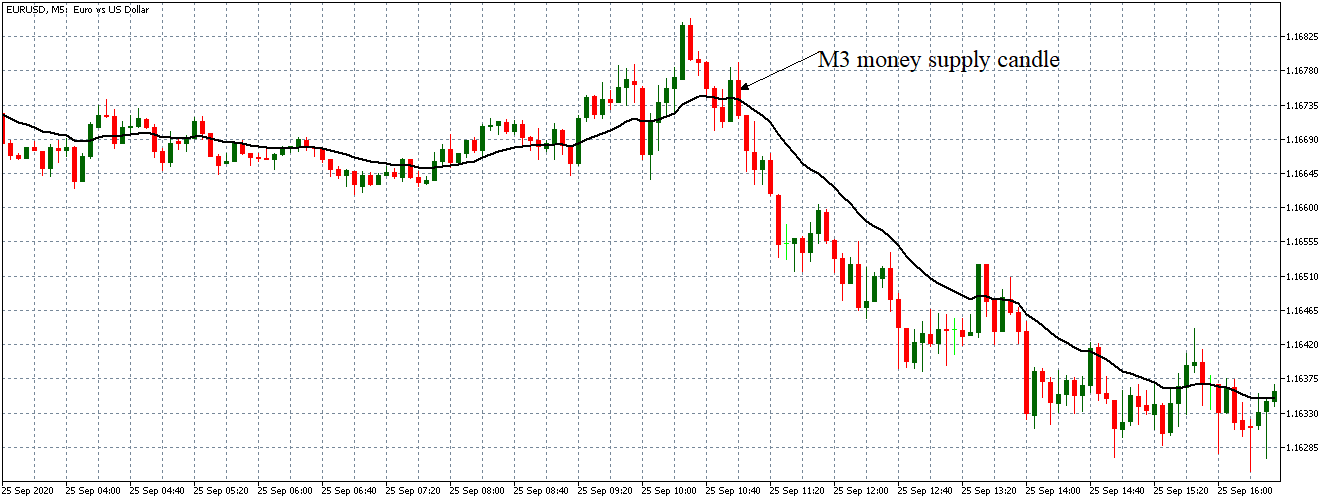
The pair formed a 5-minute bearish candle after the release of the data. Subsequently, the pair adopted a strong downtrend as the 20-period MA fell steeply with candles forming further below it.
Bottom Line
The money supply data is generally expected to a mild impact on the forex price action. For this release, however, the worse than expected data was more pronounced in the markets. This effect could be attributed to the fact that the markets expected that the ECB’s pandemic stimulus program would have a visible impact on the money supply.