Introduction
In the previous lessons, we have discussed many candlestick patterns out of which some were single, some were multi-candlestick patterns (Dual & Triple). But there are many more patterns that one needs to be aware of. Since it is not possible to cover each and every one of them, we have picked some of the most profitable and important patterns everyone should be aware of. So, this article basically acts as a cheat sheet for any reference. By referring to this guide, one can get the basic price-action structure of all these important patterns that are mentioned below.
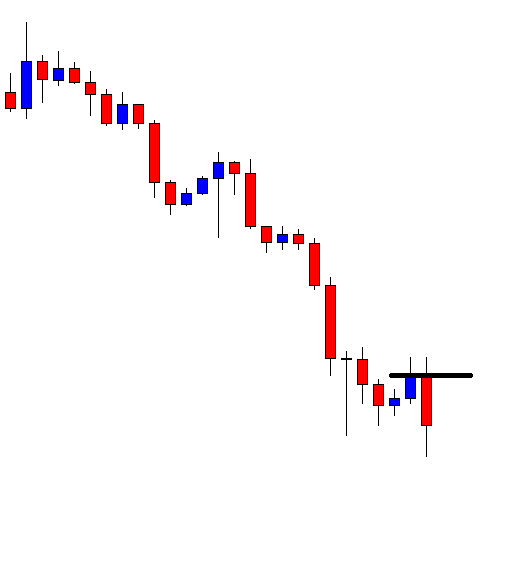
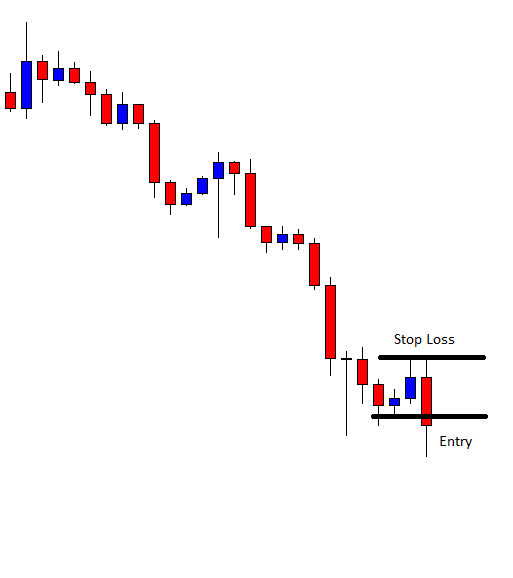
Hammer Candlestick Pattern
It is a single candlestick pattern signaling a possible reversal to the upside. The Hammer is mostly seen after a prolonged downtrend. On the day this pattern is formed, the market will be inclined towards the sell-side. As the candle comes to a close, the market recovers and closes near the unchanged mark or maybe a bit higher.
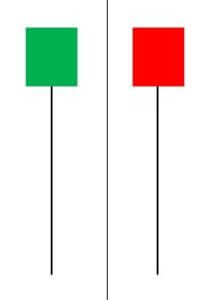
That is a clear indication of the market reversal. We must take trades only after the appearance of a confirmation candle and not before. So we see a bullish candle on the charts immediately after the Hammer pattern, consider buying the currency pair.
Doji Candlestick Pattern
This pattern is formed from a single candle and is considered a neutral pattern. A Doji represents the equilibrium between demand and supply. The appearance of this pattern indicates a tug of war in which neither the bulls nor the bears are winning.
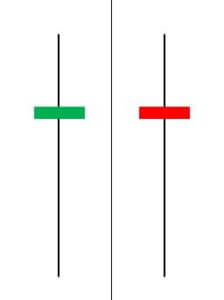
In the case of an uptrend, the bulls will be winning the battle, and the price goes higher, but after the appearance of Doji, the strength of the bulls is in doubt. The opposite is true in case of a downtrend. If we come across this pattern, we must wait for extra confirmation to take any action.
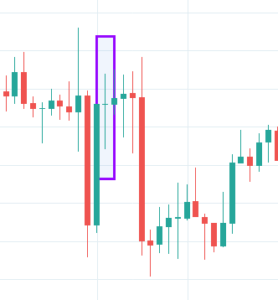
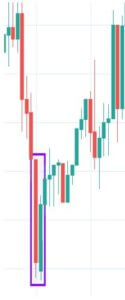
Piercing Candlestick Pattern
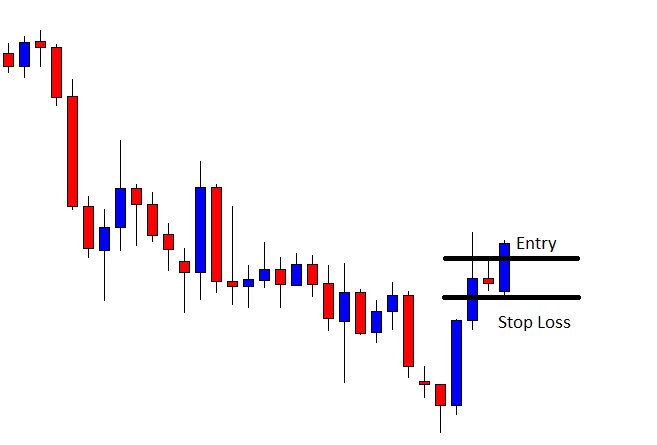
The Piercing Pattern is a two candle reversal pattern that implies a possible reversal from downtrend to an uptrend. This pattern is typically seen at the end of a downtrend. The second candle in the pattern must be bullish and should open below the low of the previous day and closing more than halfway into the previous day’s bearish candle.
We generally will have two options after noticing this pattern. Either we can buy the forex pair to benefit from the uptrend that is about to begin, or we can look at buying ‘options’ to reduce risk.
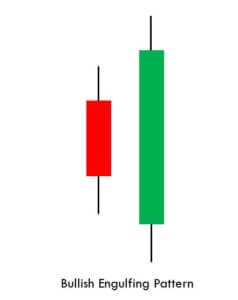
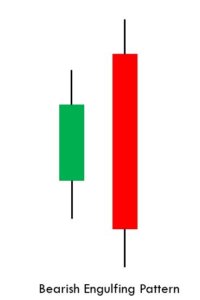
Engulfing Candlestick Pattern
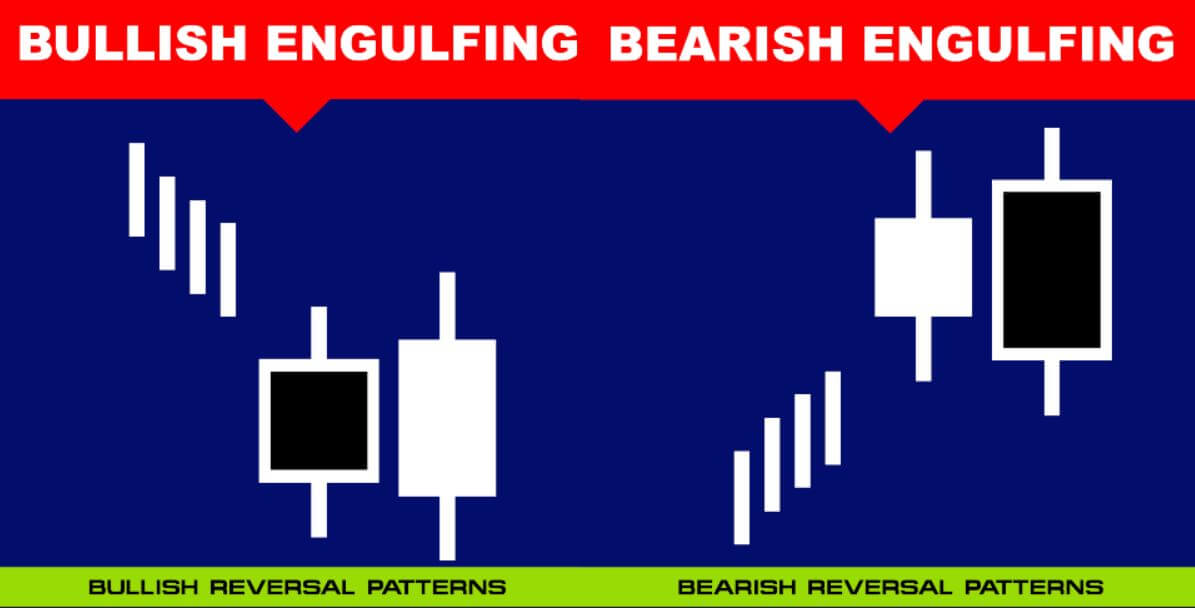
It is two candle reversal pattern that is formed at the end of a downtrend or an uptrend. Bullish Engulfing Pattern is formed when a small ‘Red’ candlestick is followed by a large ‘Green’ candlestick that completely engulfs the previous day’s candle. For a Bearish Engulfing Pattern, the situation is vice-versa.
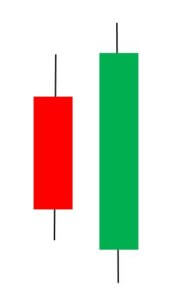
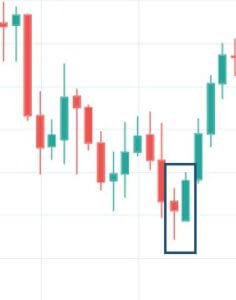
The shadows of the small candle should be preferably short, and the body of the large candle should overpower the entire previous day’s candle. When we come across a Bearish candlestick pattern, we must activate our sell trades and vice-versa.
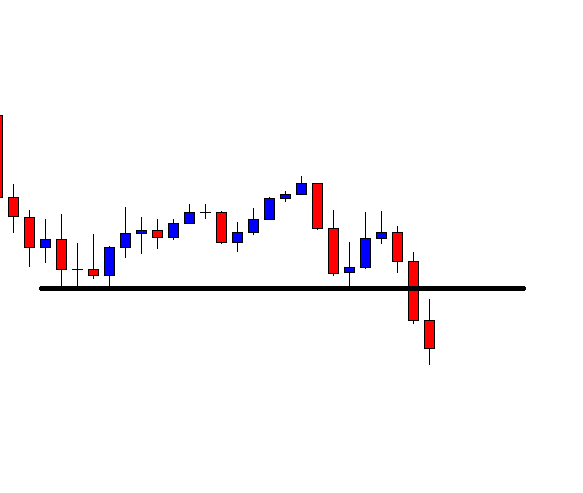
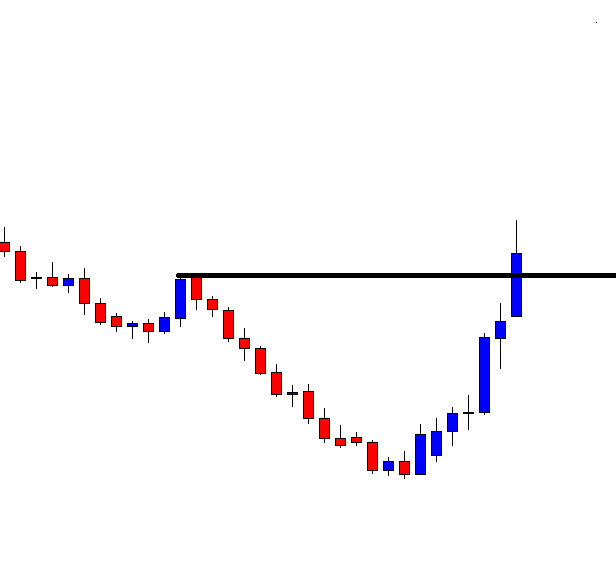
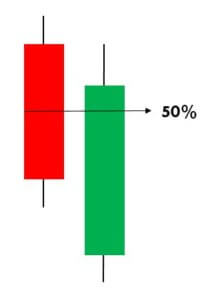
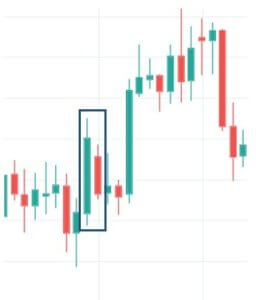
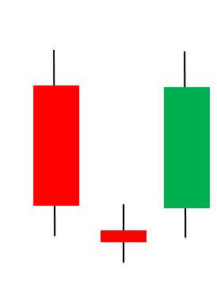
Meeting Line Candlestick Pattern
This pattern is a two candle reversal pattern that occurs in a downtrend. The first candle must be a bearish candle followed by a second long bullish candle that gaps down and closes higher. It has the close at the same level as the close of the first candle.
This pattern only signals partial bullishness and buying strength, but not completely. Traders must look for other signs of reversal than just relying on the pattern stand-alone because just the Meeting Line pattern is not a clear confirmation for a complete reversal of the trend.
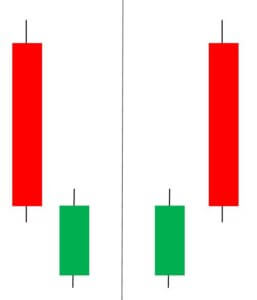
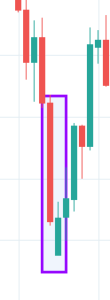
Harami Candlestick Pattern
It is a dual candlestick reversal pattern indicating the reversal of a bullish or bearish trend. In Bullish Harami pattern, the first candle is usually a Red candle with a large real body, and the second one is a small Green Candle. It’s opposite in the case of a bearish Harami pattern. 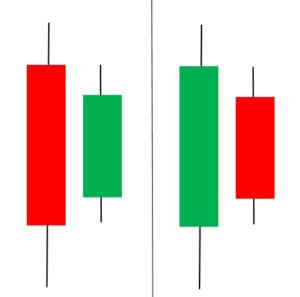
Traders must look at the appearance of a bullish Harami pattern as a good sign of taking long positions in the market. Likewise, we must be shorting once we confirm the appearance of the bearish Harami Pattern.
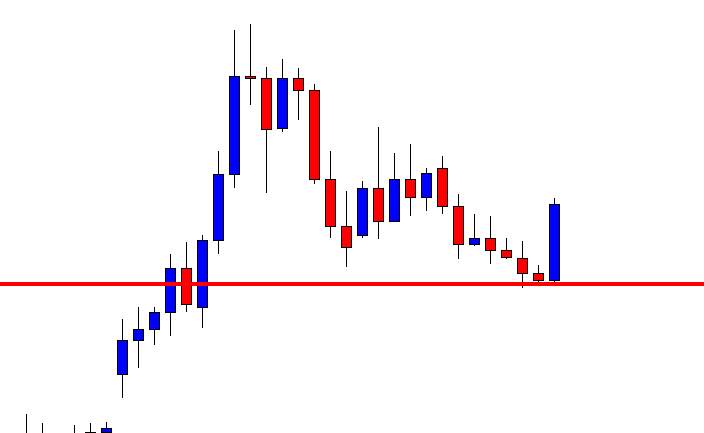
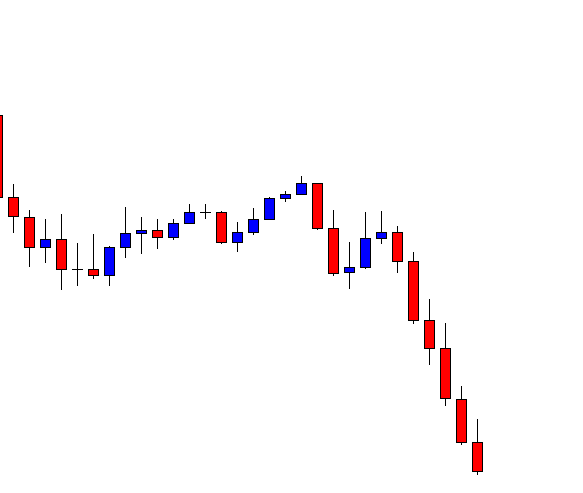
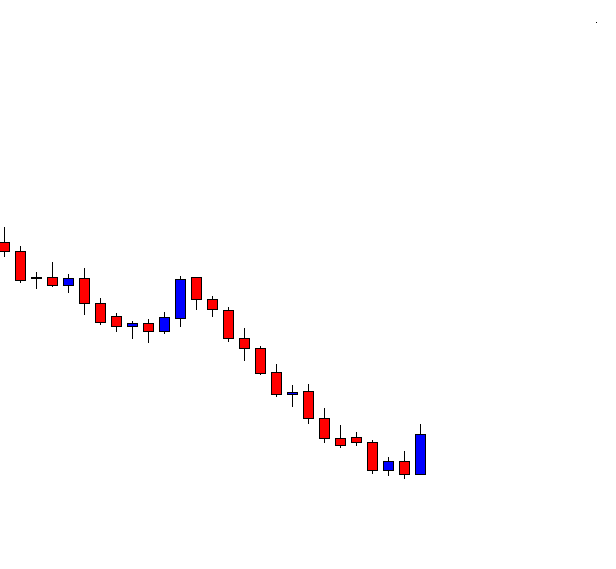
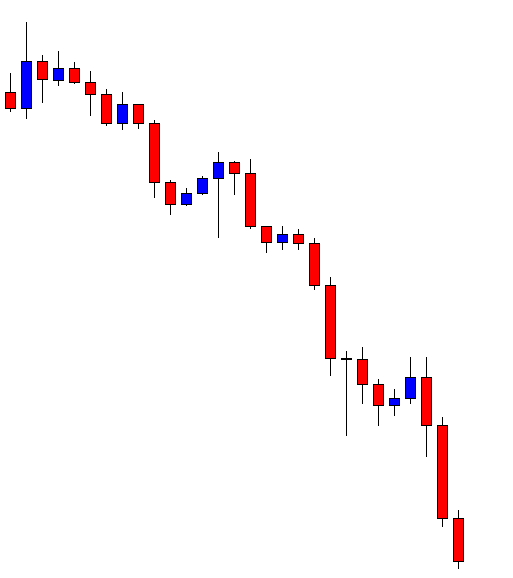
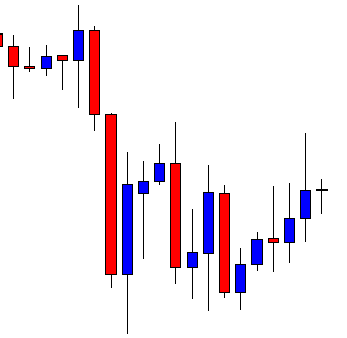
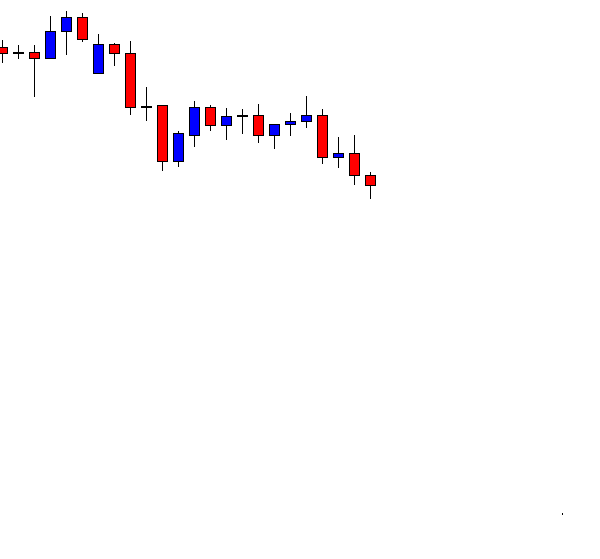
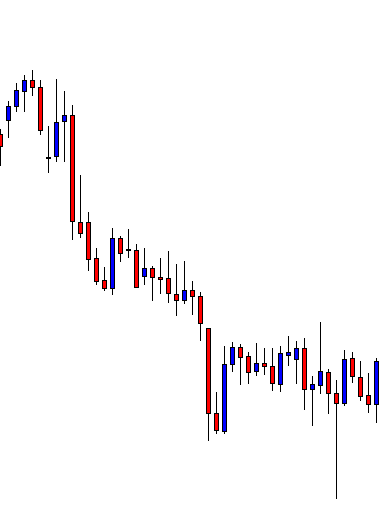
Three Black Crows Candlestick Pattern
This pattern consists of three Red candles and predicts the reversal of an uptrend. It does not occur very frequently, but when it occurs, we can be sure that the market is going to reverse.
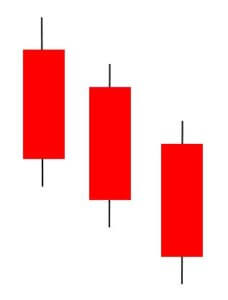
The first candle in this pattern is a long bearish candle that appears in a prevailing uptrend. The second and third are also approximately the same size and color, indicating that bears are firmly in control. This pattern is most useful for long-term traders, who take short positions and hold them for several weeks.
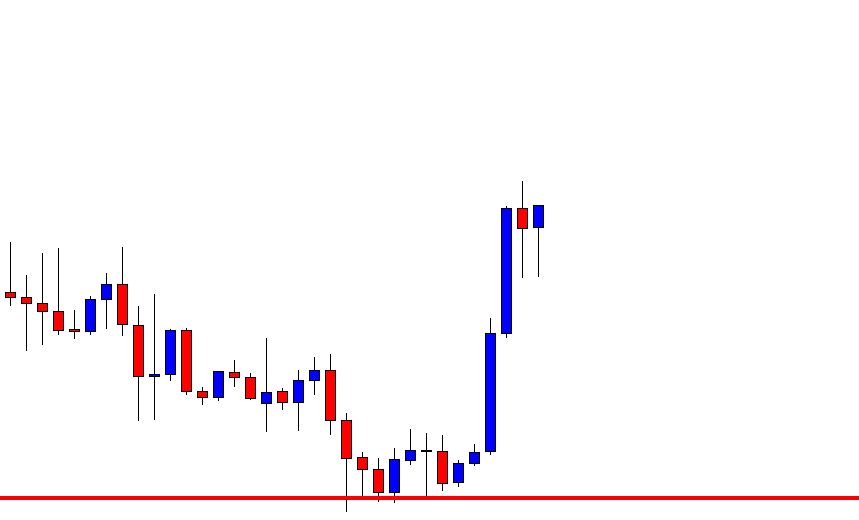
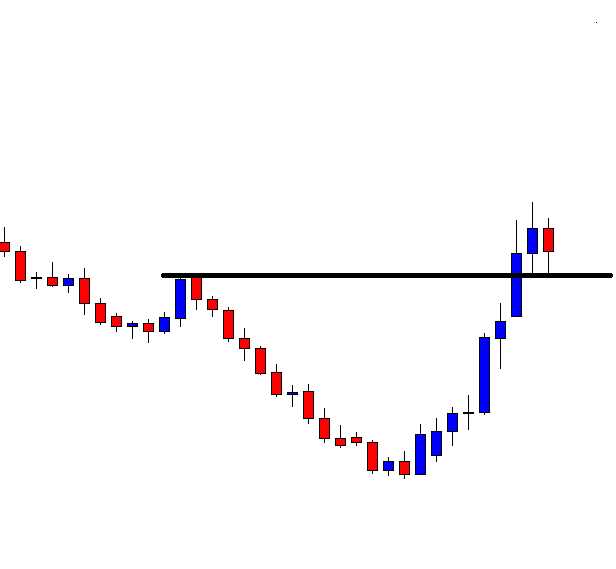
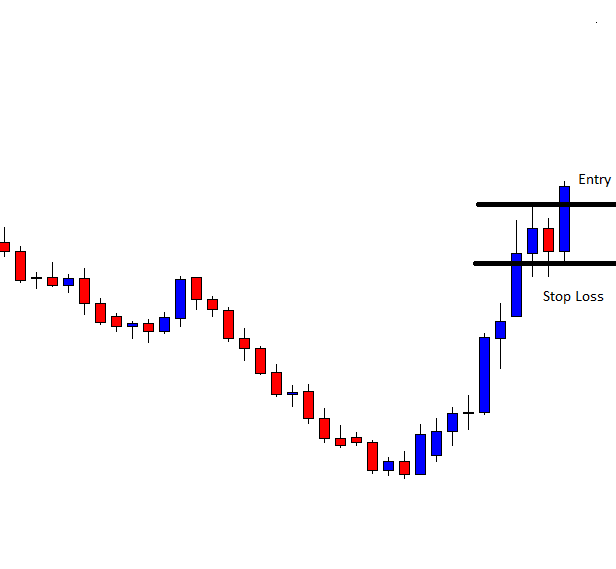
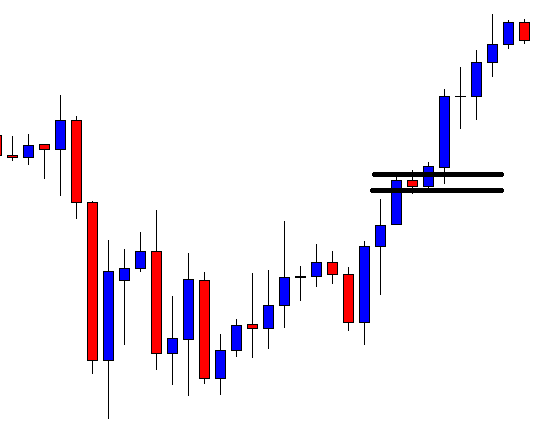
Abandoned Baby Candlestick Pattern
It is a three candle reversal pattern that occurs during a downtrend. The first candle in this pattern is a bearish one. The second candle is a Doji, which gaps down from the previous candle. The third candle is a long bullish candle and opens above the second candle.
We must take long positions only if the price breaks above the third bar in this pattern. Also, make sure to use a stop-limit order for additional risk management.
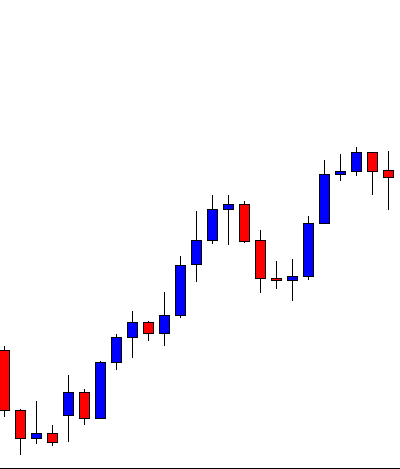
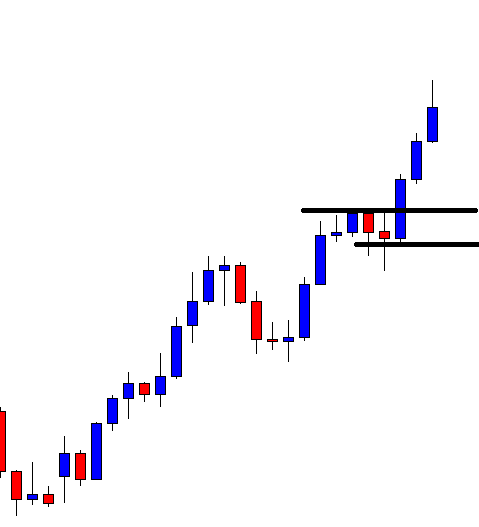
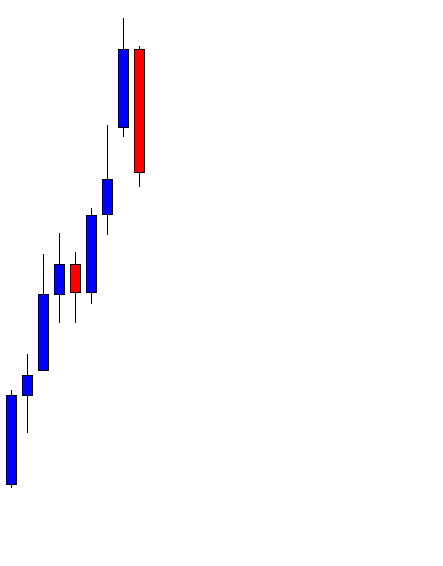
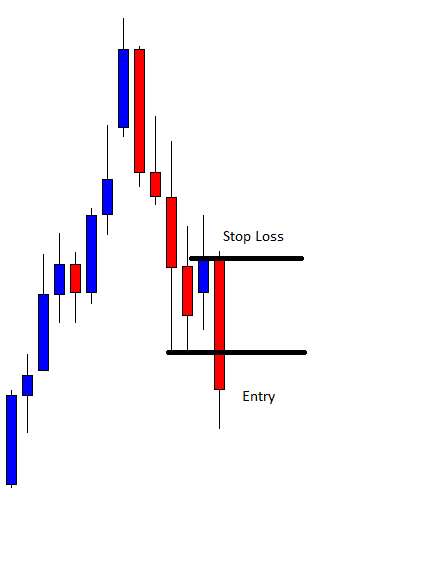
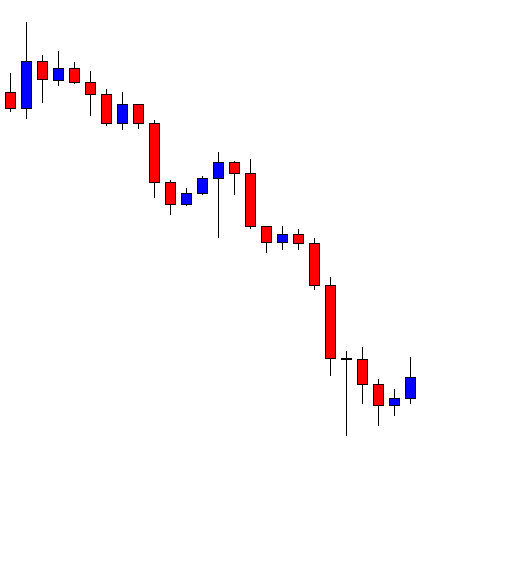
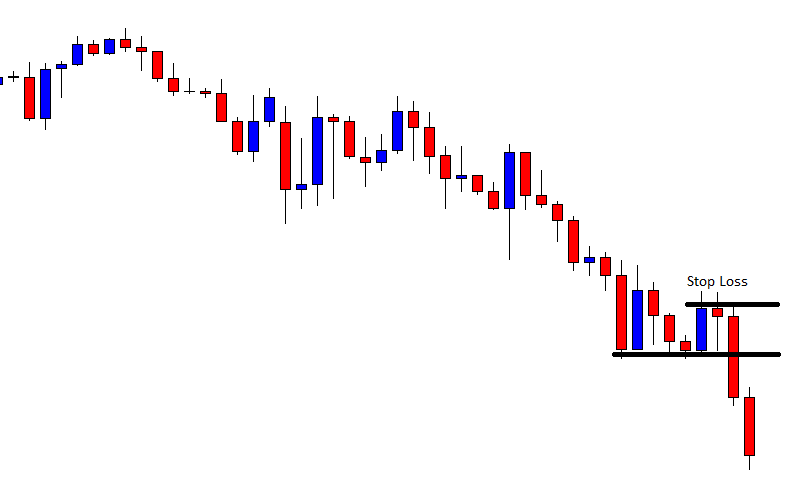
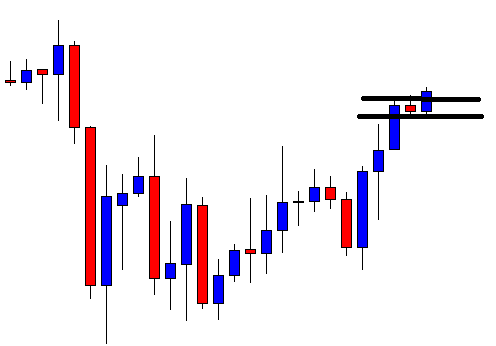
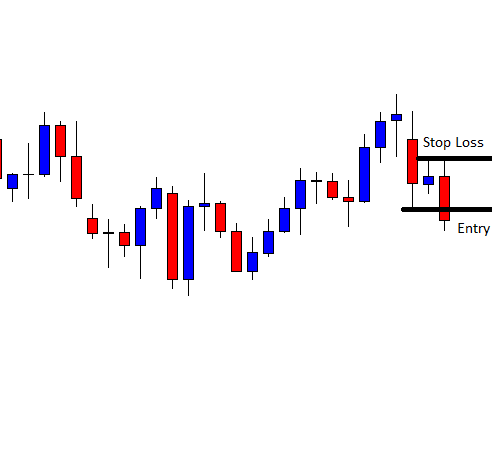
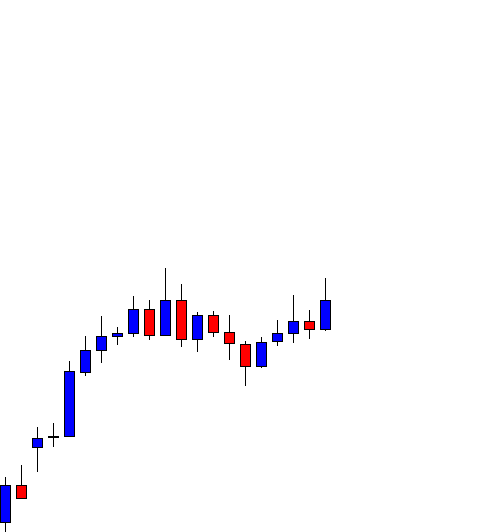
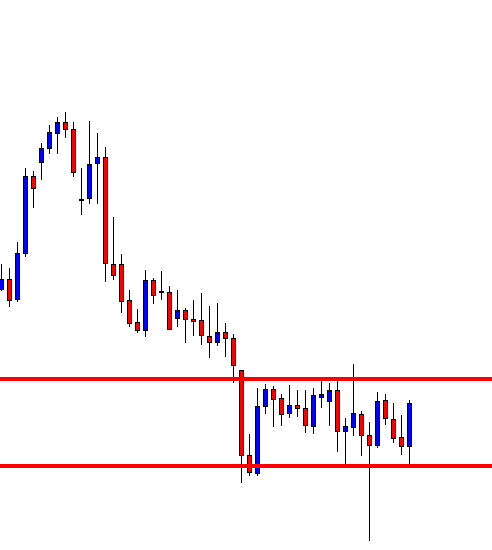
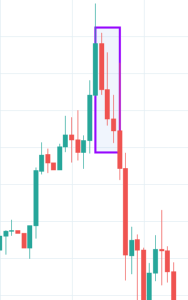
Deliberation Candlestick Pattern
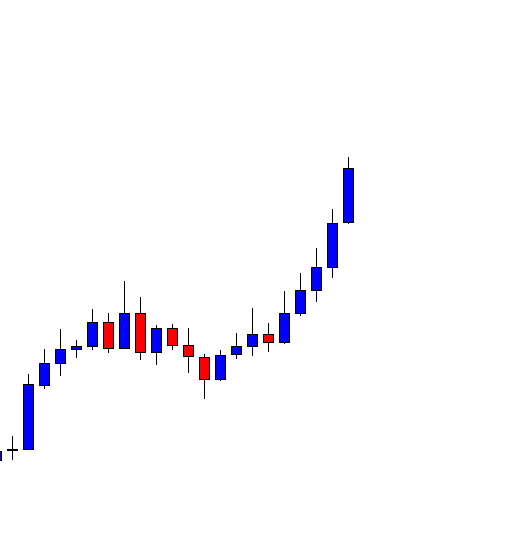
The Deliberation is a three-line bearish reversal candlestick pattern that occurs during an uptrend. This pattern is comprised of three bullish candles. The first and second candles have significantly large bodies than the third one.
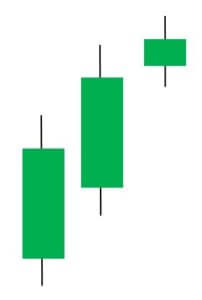
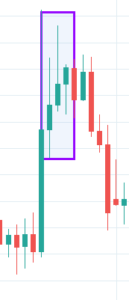
This pattern signals a bearish reversal of the current uptrend. The confirmation is usually a Red candle that overcomes the midpoint of the second candle’s body. We can take aggressive short positions in the currency pair right after we notice the confirmatory candle. This pattern is rarely seen on the price charts, but it does appear, it is highly rewarding.
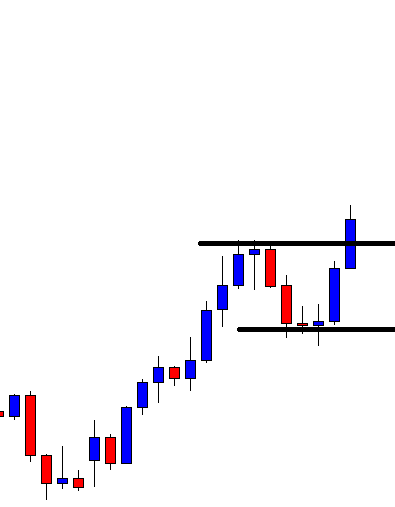
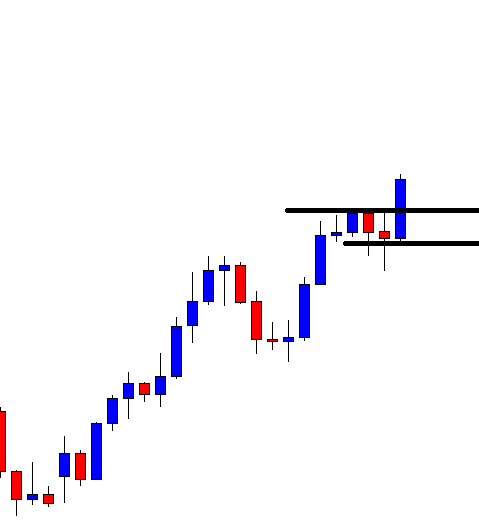
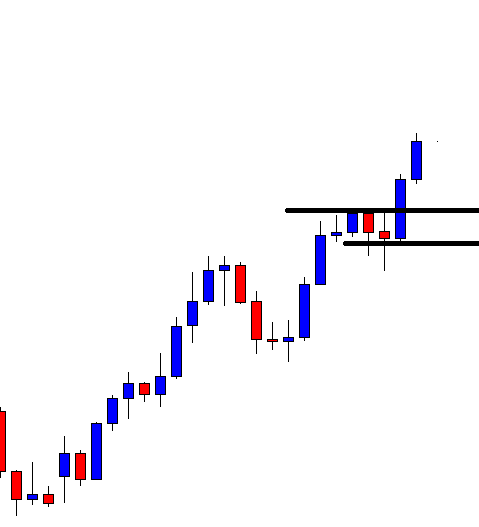
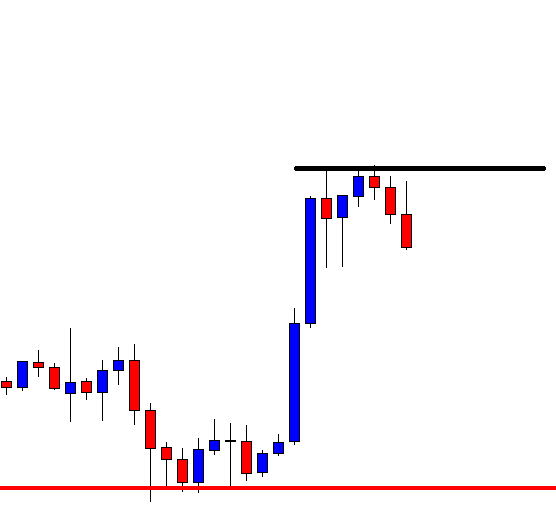
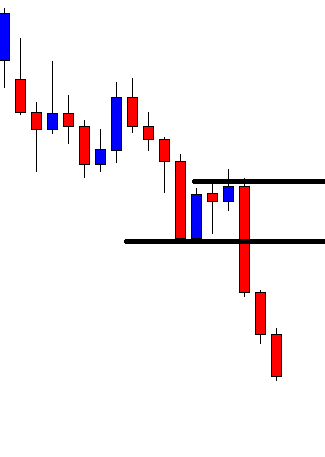
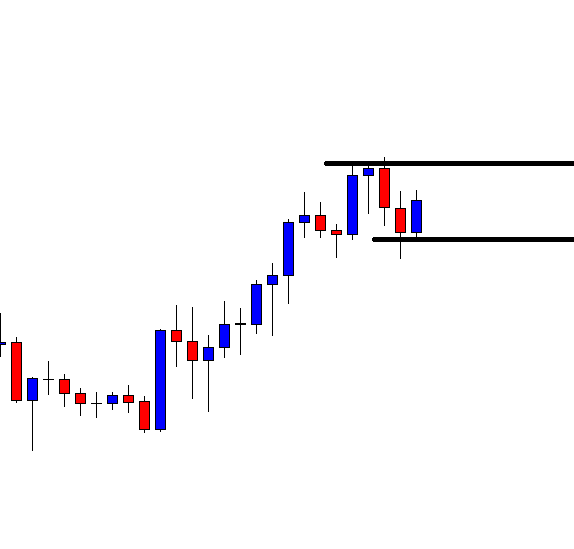
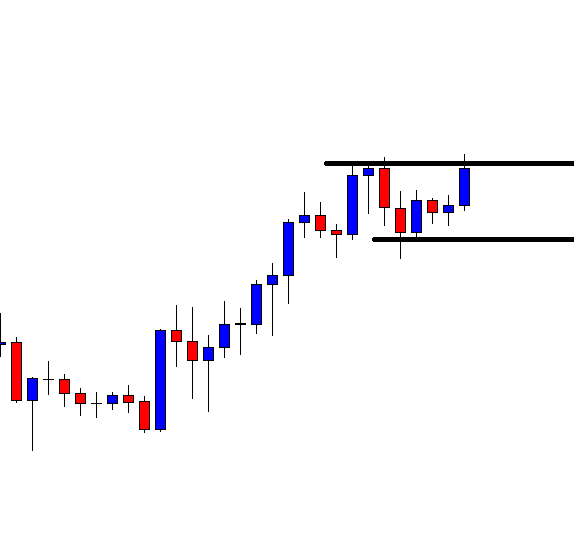
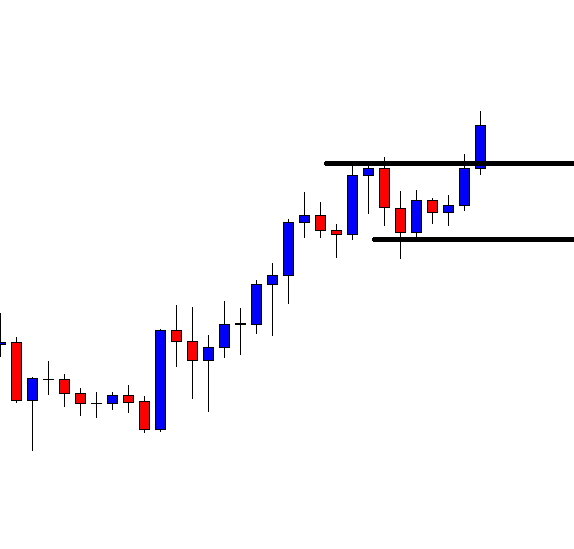
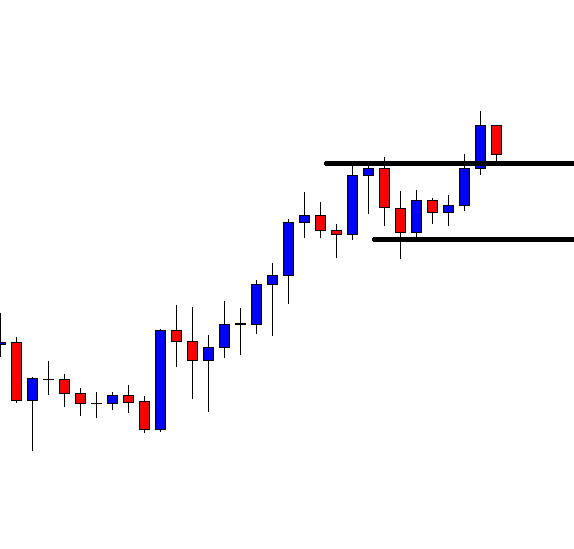
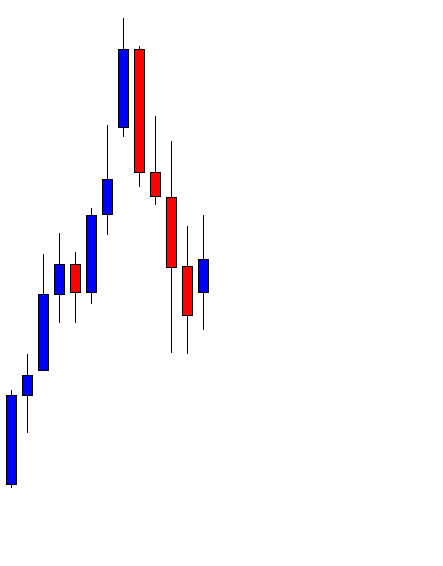
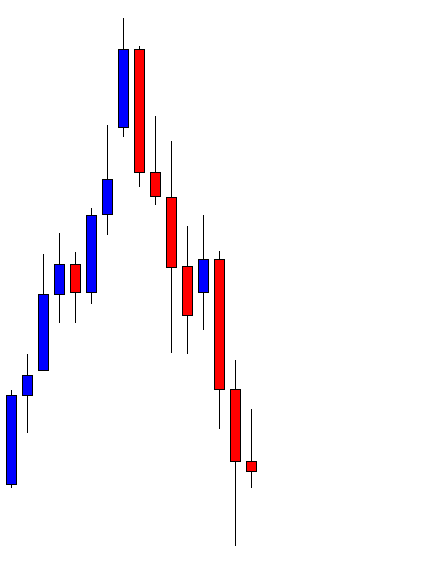
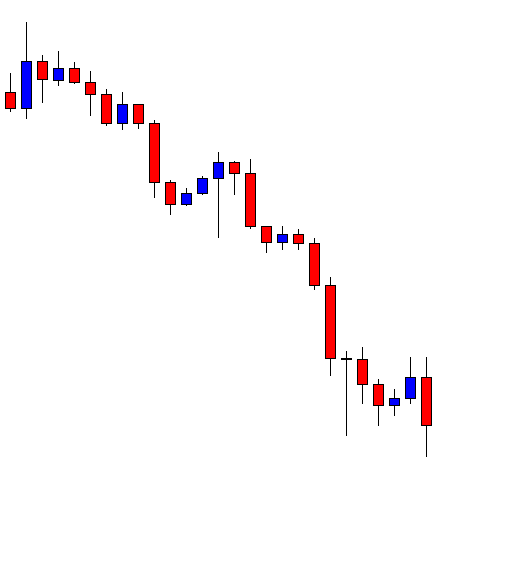
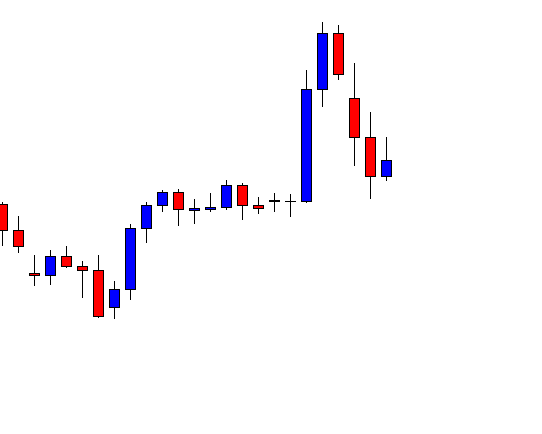
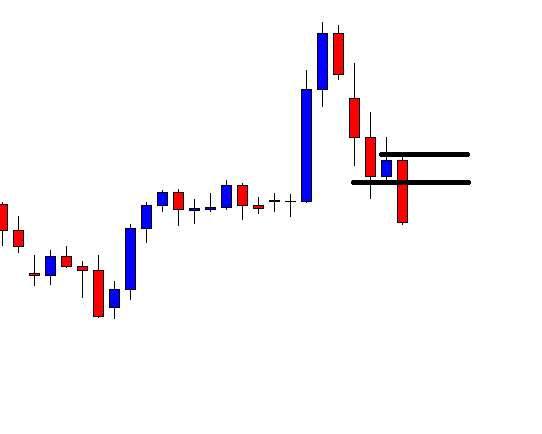
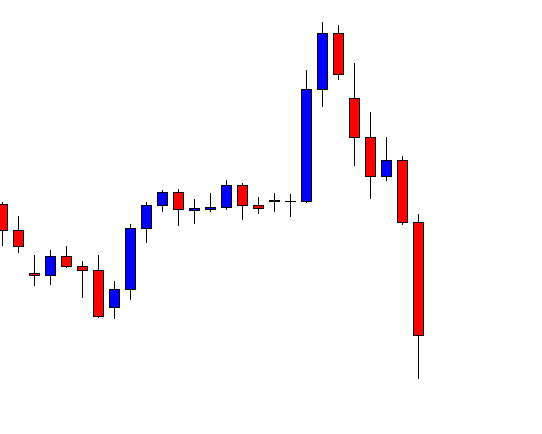
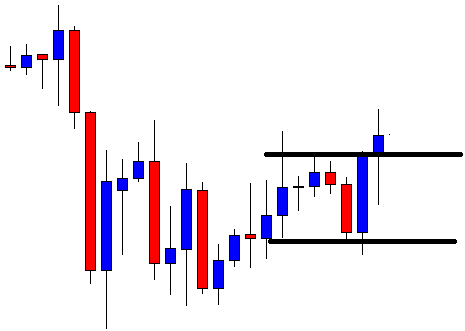
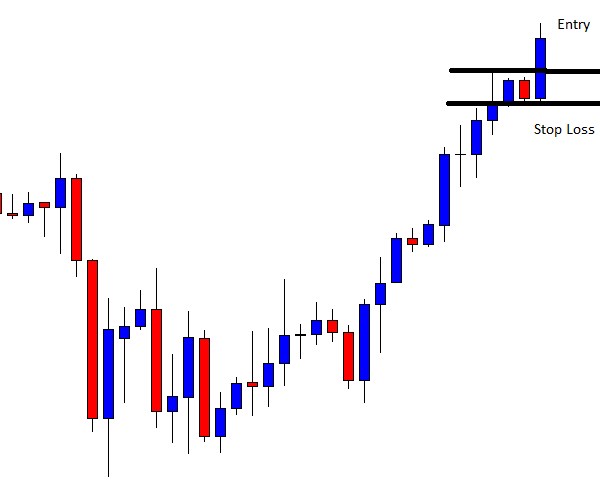
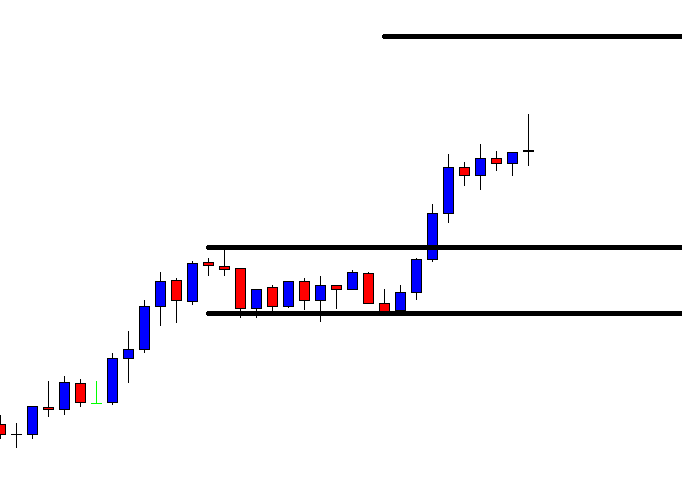
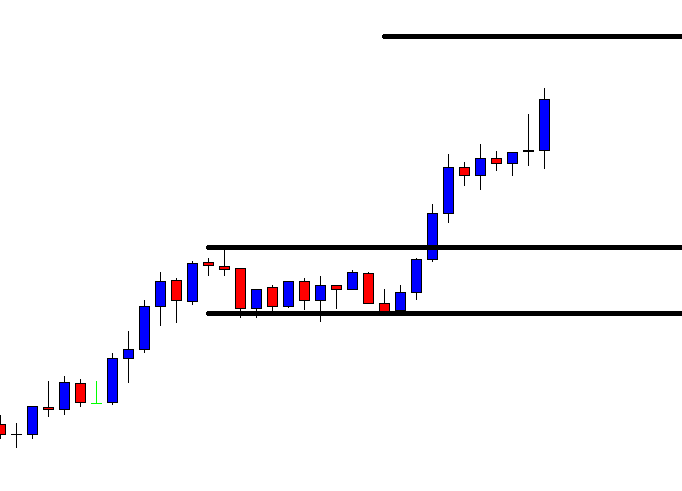
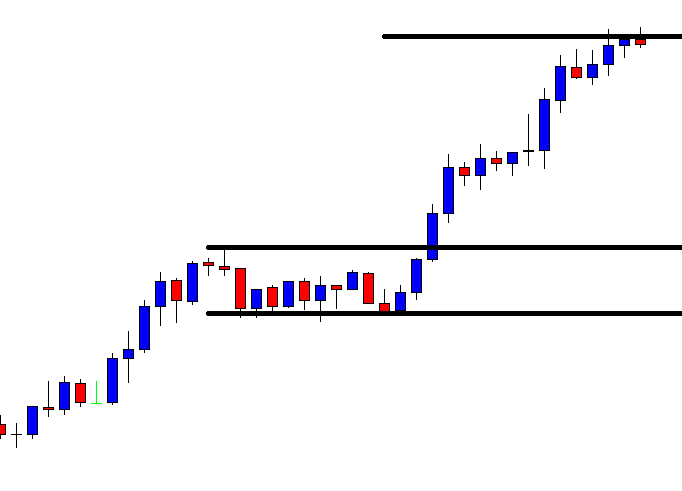
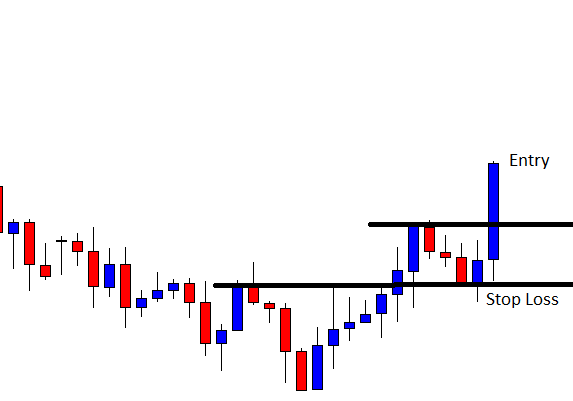
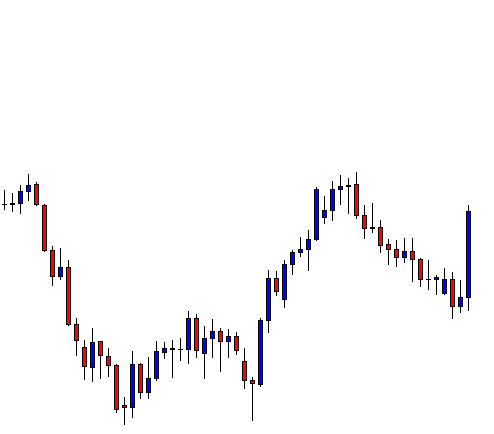
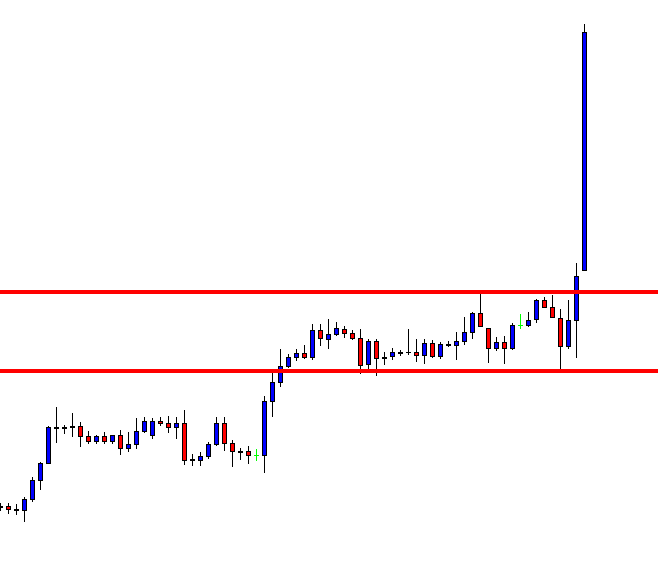
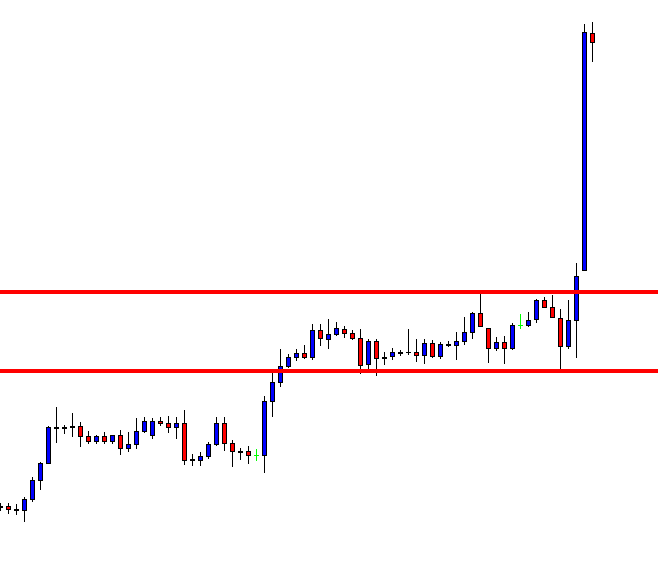
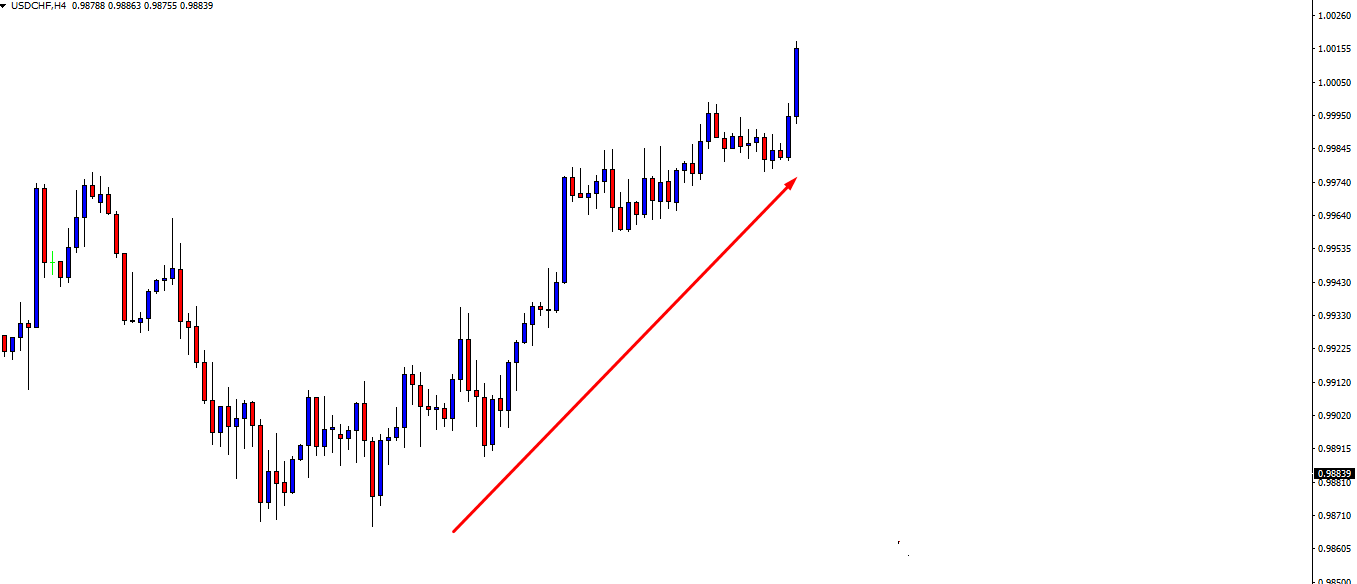
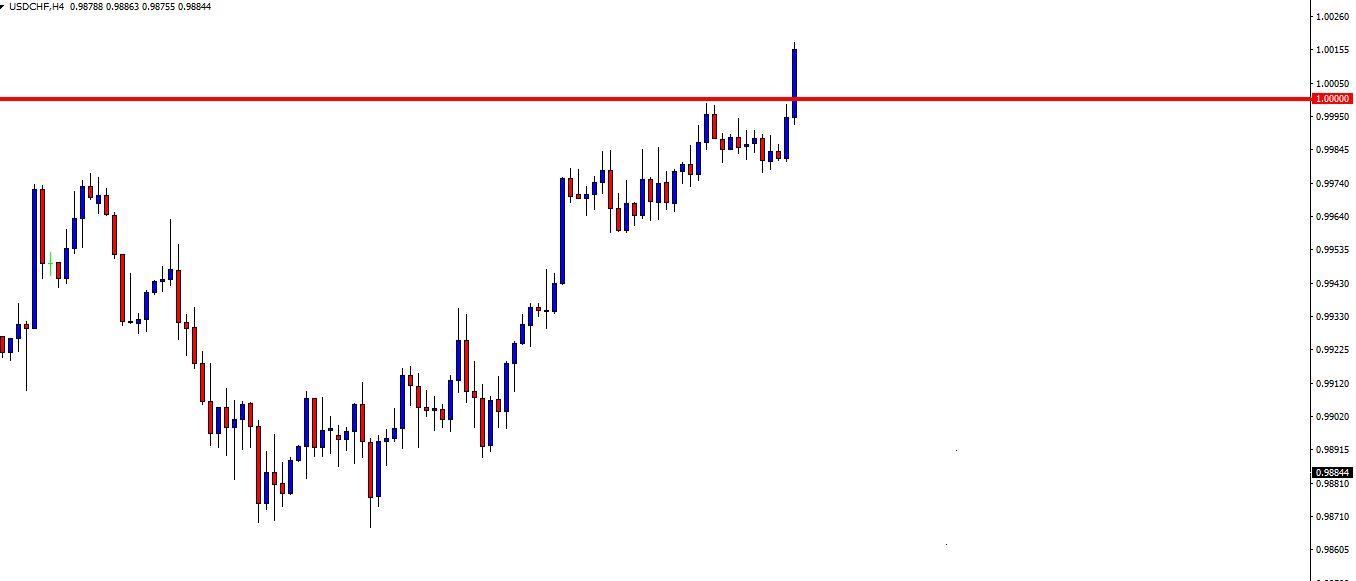
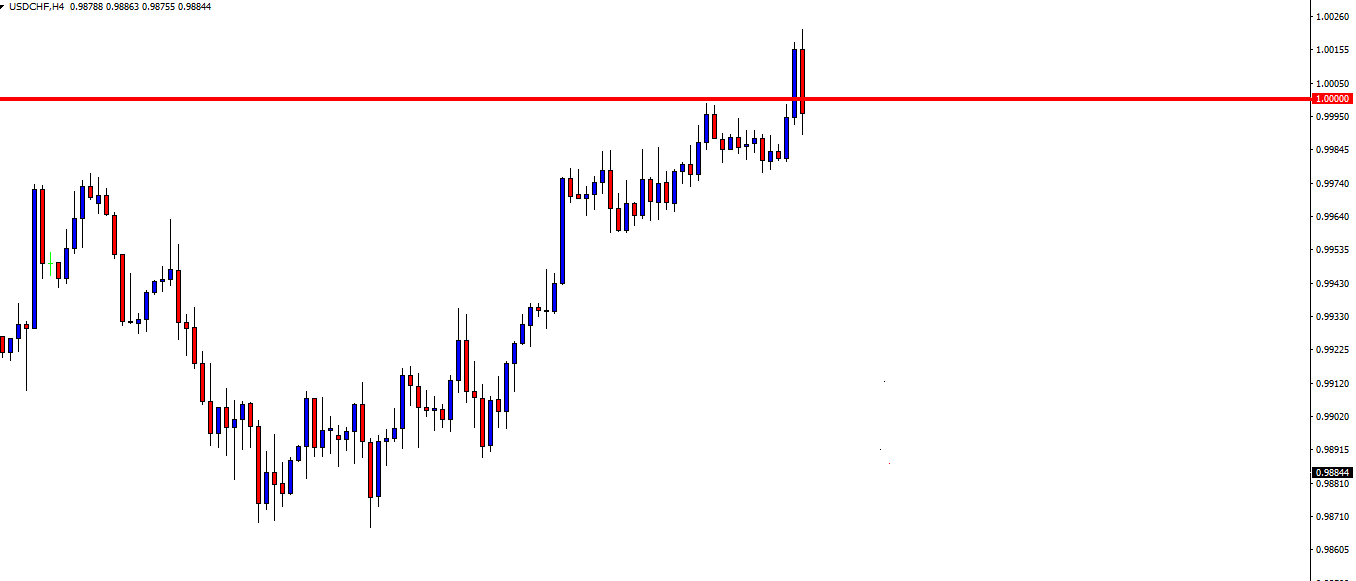
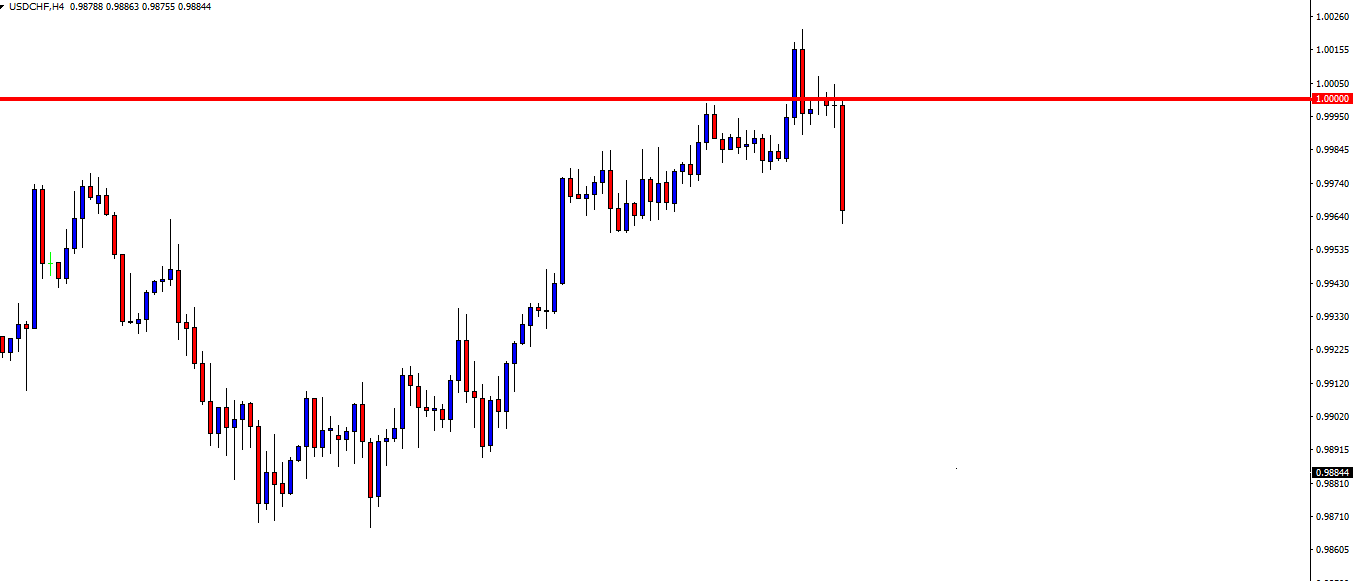
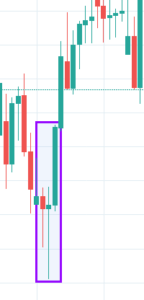
Three Line Strike Candlestick Pattern
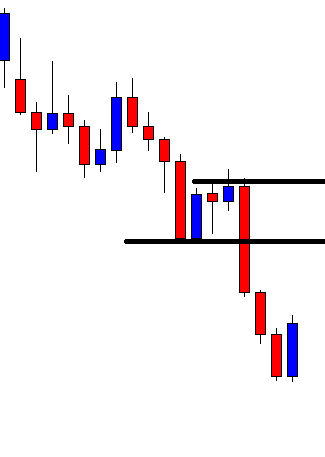
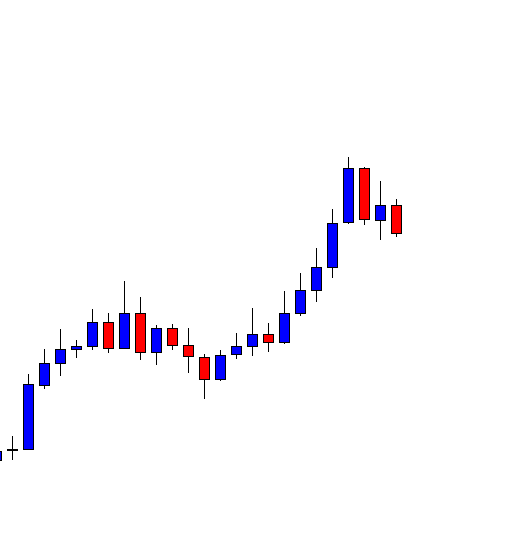
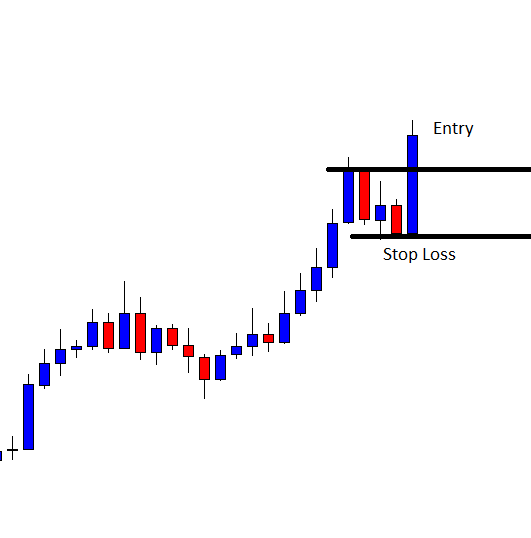
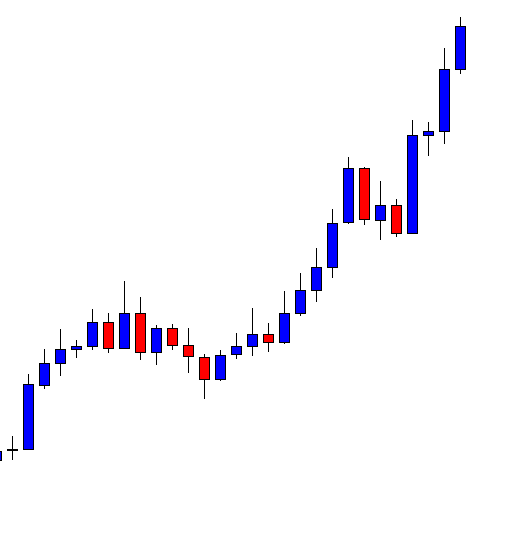
We have discussed single, dual, and triple candlestick patterns till now. Three Line Strike is the first four candlestick pattern, which signals the continuation of the current trend. This pattern can be found in both bullish and bearish markets, depending on the trend.
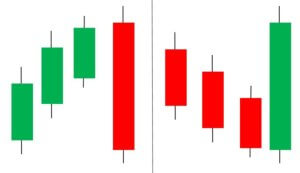
In an uptrend, the first, second, and third are bullish, and each candle needs to close above the previous candle. The fourth candle is bearish and closes below the open of the first candle. We can take long positions only after the trend is confirmed by technical indicators like RSI & MACD
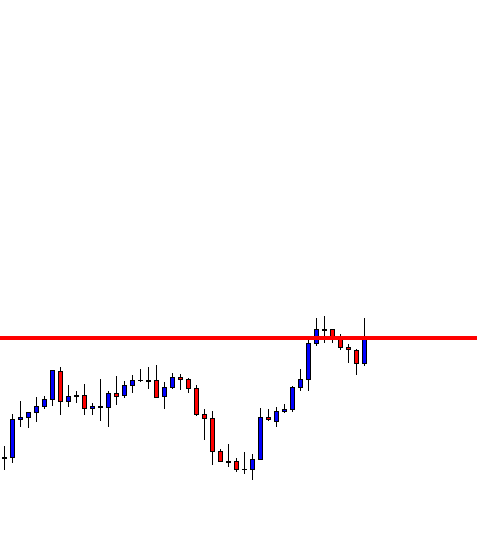
Learning to recognize and interpret candlestick patterns is important for anyone who aspires to be a professional technical trader. Perfecting this skill will take time and practice. But once you master these patterns, you can trade with enough confidence as you will know how to read the market better.
That’s about candlestick patterns and how to trade them. In the upcoming lesson, we will see how to trade candlesticks using support and resistance levels. We hope you practice these patterns better and become a better trade. Kindly let us know if you have any questions in the comments below. Cheers.
[wp_quiz id=”61830″]