Categories
Forex Elliott Wave Forex Market Analysis

AUDNZD Continues Under Bearish Pressure

Overview

The AUDNZD cross remains moving mostly bearish in the bullish sentiment zone. It alters the price surpassing the 1.10 psychological barrier and begins a corrective sequence that remains in progress; however, this downward movement could end soon.

Market Sentiment

The AUDNZD moves mostly downward in the bullish sentiment zone, piercing July’s low area at 1.056. The Oceanic Cross advances over 1.5% (YTD).

The following figure exposes the AUDNZD cross in its daily timeframe. The chart reveals the long-term market participants’ sentiment bounded by its 52-week high and low range. The price action began a downward sequence; after that, the cross surpassed its last 52-week high of June 02nd, located on 1.08807 in a rally that elapsed six sessions in a row.


Moreover, the 60-day weighted moving average confirms the downward short-term bearish bias that favors the price action. Nevertheless, considering that the cross moves in the bullish sentiment zone, the AUDNZD cross’s decline could be a correction of the upward cycle that began last mid-March.

Technical Overview

The AUDNZD cross under the Dow Theory perspective reveals that the price has started to develop a bullish primary trend that began on March 18th when the price found fresh buyers at 0.99906.

The following chart illustrates AUDNZD in its daily timeframe. The figure exposes the demand incorporation below the parity, which carried up the price until 1.10438, from where the price started to decline in a secondary trend.

The retracement developed by the Oceanic cross beyond the 33% leads us to confirm that the latest decline in progress corresponds to the rally’s corrective movement that began on March 18th.

The mid-term Elliott wave view of the AUDNZD cross illustrates in its 12-hour chart the downward move in a complex corrective structure that looks like an incomplete double-three pattern (3-3-3).

The previous chart reveals the price action is moving in its wave (c) of Minuette degree labeled in blue, which belongs to wave ((y)) of Minute degree in black. Likewise, this entire move corresponds to wave 2 or B, which retraces the upward five-wave sequence that began on March 18th at 0.99906.

Technical Outlook

Once the AUDNZD found sellers at 1.07565, the Oceanic cross began its wave (c) of Minuette degree labeled in green that remains in progress.

As illustrated in the following 8-hour chart, the price could extend its declines to the area between 1.05186 and 1.04870, where the price could find support. Likewise, if the price extends its drops below 1.03511, the next movement’s strength could be limited to a re-test of the August 18th high located on 1.103.

On the other hand, if the price action breaks and closes above the supply zone between 1.06456 and 1.06718, there exists the possibility of a new rally. This new bullish leg could surpass the 1.103 mark.

Finally, the invalidation level for the short-term bearish scenario is located at 1.07565.

Categories
Forex Elliott Wave Forex Market Analysis

Is USDCAD Ready for a Short-Term Rally?

The USDCAD pair reveals a strong bearish movement that seems have found a short-term bottom. In this regard, the price could start a rally that could boost the price toward October’s highs zone.

Market Sentiment

The USDCAD pair continues moving in its extreme bearish sentiment zone, erasing the gains reached during the first quarter of the year when the price advanced over 13%. Currently, the Loonie gains a modest 0.67% YTD.

The next figure illustrates the USDCAD pair in its daily timeframe. The chart exposes the long-term market participants sentiment bounded by the 52-week high and low range. 

The chart reveals the price action continues developing fresh lower lows, which leads us to observe that market participants continue holding bearish positions on the pair. Furthermore, the 60-day weighted moving average continues above the price, which confirms the bearish bias that advances the price.

On the other hand, as long as the USDCAD price remains below 1.33631, the Loonie will stay under bearish pressure.

Technical Overview

The USDCAD pair exposes a bearish reversal formation that erased the progress developed during the first quarter of the year. The following weekly chart reveals a powerful bearish long-tailed candle in terms of a yearly candlestick, suggesting that the price would continue developing more declines in the long-term.


On the other hand, the big picture exposes a long-term sideways formation that persists since mid-2015. Likewise, the last downward movement that began at 1.46674 appears to have found a bottom on 1.29238 the current trading week. 

In this regard, if the price starts to develop a corrective rally, according to the Dow Theory, the USDCAD pair should advance to 1.35022 and up to 1.40761; this upward sequence would correspond to a valid correction of the same degree that the last bearish move developed by the pair since last mid-March.

The mid-term Elliott wave view of USDCAD illustrated in the next 12-hour chart reveals an incomplete corrective sequence that looks like a double three pattern (3-3-3) of Minor degree labeled, in green, which began on March 18th at 1.46674.

Currently, the USDCAD develops its wave ((b)) of Minute degree identified in black, which belongs to wave Y in green. In this context, the wave ((b)) looks like an incomplete flat pattern (3-3-5), which subdivides into a 3-3-5 sequence. Moreover, the actual structural series suggests that the Loonie started to develop its wave (c) of the Minuette degree labeled in blue. 

Short-term Technical Outlook

The short-term Elliott wave view of the USDCAD unfolded in the following 8-hour chart, anticipates its progress in an incomplete flat pattern, which could be starting to advance on its wave (c) of Minuette degree labeled in blue.

If the Loonie find fresh buyers in a retracement to the demand zone between 1.30433 and 1.30086, and the price breaks and closes above 1.31473, then the price could confirm the potential rally that corresponds to wave (c) of Minute degree with a potential target in the supply zone between 1.33970 and 1.34592.

Lastly, the invalidation level for the intraday bullish scenario locates at 1.29283

Categories
Forex Market Analysis

NZDUSD Bullish ahead of the RBNZ Meeting

Overview

The NZDUSD cross advances in the extreme bullish sentiment zone before the RBNZ monetary policy decision, to be held during the overnight trading session. The intraday Elliott Wave view reveals its progress in an incomplete five-wave sequence, which could boost the price toward a new high.

Market Sentiment

The NZDUSD cross waits for the Reserve Bank of New Zealand (RBNZ) interest rate decision, as it moves on the extreme bullish sentiment zone. Although the kiwi’s high volatility during this year made it drop over 18.7% in the first quarter of the year, the NZDUSD is still up by 1.44% (YTD).

The next chart illustrates the NZDUSD in its 8-hour timeframe. The figure unveils the price action developing a short-term rally that pushed it from the extreme bearish till the extreme bullish sentiment zone.

Moreover, the consecutive intraday higher high could make the market participants expect further upsides during the interest rate decision, which will take place in the overnight trading session.

In this context, the analysts’ consensus foresees that the RBNZ official cash rate (OCR) will remain unchanged at 0.25%. However, considering that during the latest Reserve Bank of Australia (RBA) broad meeting, the policymakers decided to cut the interest rate to 0.10%, it is possible that the RBNZ would follow the same direction.

In consequence, although the NZDUSD moves in the extreme bullish zone, a drop below 0.67635 could be a signal the pair might start developing a downward corrective movement during the following trading sessions.

Technical Overview

The big picture of the NZDUSD cross exposed in the 2-day log-scale chart reveals its advancement in an incomplete impulsive sequence, which looks moving on its fifth wave of Minute degree labeled in black. 

According to the Elliott Wave theory, considering that the price action developed a third extended wave, the fifth wave should have a limited upside. Thus, the extension of the current upward movement could end soon.

On the other hand, the bearish divergence observed in the MACD oscillator confirms that the cross’s current 5th-wave upward sequence is in an exhaustion stage. 

Likewise, the long-term descending trendline suggests that the price action currently tests a dynamic resistance, which could be surpassed backed by increasing volatility. Nevertheless, this potential breakout could end being a fake-out

Short-term technical Outlook

The intraday outlook for NZDUSD under the Elliott wave view and illustrated in its 4-hour chart exposes its progress in the third wave of Minuette degree labeled in blue, which could retrace to the area between 0.6785 and 0.67562.

If the price confirms the bounce from the demand zone between 0.67562 and 0.67850, the kiwi could advance toward the long-term supply zone, which corresponds to a potential target area between 0.69311 and 0.69780.

Once the fifth wave of Minuette degree, which belongs to the fifth wave of Minute degree, completes, the cross could start developing a corrective sequence with length and time proportional to the structural series of Minute degree.

Lastly, the invalidation of this intraday upward scenario is a drop below 0.67242.

Categories
Forex Elliott Wave Forex Market Analysis

Euphoric Market’s Sentiment Pushes GBPCHF Up

Overview

The GBPCHF cross began the current trading week, advancing over 1.30%, boosted by the U.S. post-election rally and Pfizer’s Covid vaccine upbeat results. However, the Elliott Wave view anticipates that the euphoric rally could soon end, and the cross could reverse its course toward new lows.

Market Sentiment

The week started with a risk-on U.S. Presidential post-election stock market rally, driving the risk-off currencies to drop. In this context, the GBPCHF cross advances over 1.30% to its highest level since late September.

The following 8-hour chart displays the intraday market sentiment. Although the sideways movement predominates since late September, the strong bullish move developed in the Monday trading session takes the GBPCHF cross to the extreme bullish sentiment zone.

Likewise, we can see the price action developing above the 60-period weighted moving average, which confirms the intraday upward bias that could hold during the following trading sessions.

On the other hand, the euphoric sentiment bolstered by news media’s coverage of the U.S. elections and the continuation of the stock market rally added to the news of the promising vaccine results developed by Pfizer and BioNTech leads us to expect a limited upside in the risk-on currencies.

Technical Overview

The big picture of the GBPCHF under the Elliott wave perspective reveals its progress in a descending broadening formation. Its latest downward sequence began on December 13th, 2019, when the price found fresh sellers at 1.33113. We can see, as well, that this leg still remains in progress.

The following daily chart unveils the advance in the fifth wave of Minute degree labeled in black, which started on 1.22224, where the price action declined in a bearish impulsive movement reaching a new lower low. This decline that ended on 1.15989 completed the first wave of Minuette degree labeled in blue.

Currently, the GBPCHF cross moves in its second wave (in blue). Nevertheless, the psychological barrier of 1.20 could represent a significative intraday resistance.

Technical Outlook

The intraday outlook of the GBPCHF cross reveals the bullish continuation of the current upward momentum. The next 2-hour chart exposes the supply and demand zones according to the potential next move that the cross could develop in the coming trading sessions.

On the one hand, the price advances in its wave c of Subminuette degree identified in green, developing the third internal wave. Likewise, the retracement that should correspond to its fourth internal wave could retrace to the area between 1.19292 and 1.19694. This zone could back the possibility of a new rally that would boost the price toward 1.21012 and 1.21306. 

On the other hand, our first scenario considers the bearish continuation. In this case, if the price action penetrates and closes below 1.1803, the cross could see further declines toward the zone of 1.1650.

Finally, our second scenario considers that if the GBPCHF cross continues its advance beyond 1.22224, the cross could extend its gains toward the descending upper- trendline shown in the daily chart.

Categories
Forex Elliott Wave Forex Market Analysis

AUDJPY Could Develop a Limited Upside

Overview 

The AUDJPY cross advances in an incomplete upward sequence that belongs to a corrective structural series backed by Monday’s trading session’s euphoric sentiment. The Elliott Wave view unveils the likelihood of a limited upside before resuming its declines.

Market Sentiment

The AUDJPY cross retraces on the overnight Tuesday trading session after the surprising weekly kick-off, which jumped the price over 2.2%, climbing until 77.037, its highest level since September 18th.

The AUDJPY 8-hour chart illustrates the 30-day high and low range, which exposes the participants’ intraday market sentiment. The figure distinguishes the price action consolidating in the extreme bullish sentiment zone, backed by the stock market’s euphoric rally on Monday’s trading session.

The breakout of the last 30-day high of 76.274 during Monday’s trading session raised the participants’ extreme bullish sentiment, expecting further upsides on the cross. Moreover, we see that the price action remains above its 60-period linear weighted moving average, which confirms the bullish bias on the AUDJPY.

Nevertheless, the AUDJPY found resistance below mid-September’s consolidation zone. This market context expects a significative retracement or a consolidation movement before continuing the rally experienced in Monday’s session. Finally, a retracement below the 75.087 level would turn the market sentiment from bullish to bearish.

Technical Overview

The AUDJPY cross advances in an incomplete upward bullish sequence of a lower degree, which belongs to a descending structure that began on August 31st when the price topped on 78.462.

The below 8-hour chart exposes the price action running in an upward wave ((b)) of Minute degree labeled in black, which currently advances its fourth wave of Minuette degree identified in blue. Likewise, according to the Dow Theory, considering that the AUDJPY cross advanced over 66% of the bearish decline, the price should develop a bearish connector corresponding to wave ((b)).

In this context, following the Elliott Wave theory and considering the third internal segment of the intraday rally, the price could produce a limited upside toward the supply zone bounded between 77.295 and 77.497. Finally, the bearish divergence on the MACD oscillator may mean a confirmation of the upward movement’s exhaustion corresponding to wave ((b)).

Short-Term Technical Outlook 

The incomplete bullish sequence of the AUDJPY cross unfolded in its 4-hour chart exposes the progress in its fourth wave of Subminuette degree labeled in green. Likewise, considering that the third wave is the extended wave of wave (c), the fifth wave in green should not be extended.

On the other hand, considering that the second wave in green is a simple correction, the fourth wave should elapse more time than the second wave. Additionally, the fifth wave in green could extend itself between 77.140 and 77.654. The price could find fresh sellers expecting to open their shorts on the bearish side of wave ((c)) of Minute degree labeled in black. The invalidation level of the bearish scenario locates at 78.462. 


Categories
Forex Elliott Wave Forex Market Analysis

GBPCAD Advances in a Double-Three Pattern

Overview

The GBPCAD cross advances in a sideways sequence corresponding to an incomplete double-three pattern. The mid-term Elliott Wave view foresees a potential rally that could boost the cross toward last March’s highs.

Market Sentiment

The mid-term market sentiment overview of the GBPCAD cross unfolded by the 90-day high and low range and illustrated in its daily chart, reveals the price action moving in the bearish sentiment zone (SZ).

The previous chart reveals the sideways movement bounded between the extreme bullish SZ located at 1.76759 and the extreme bearish SZ at 1.69214. Likewise, the 60-Day moving average looks flat, suggesting the balance between supply and demand, or bull and bear traders, which in turn, is indicative of sideways action.

On the other hand, considering the year’s opening price at 1.71923, we distinguish that the yearly candlestick pattern corresponds to a narrow body candle identified as a doji, revealing the next direction’s market participants’ indecision that the price will take.

In consequence, while the GBPCAD cross remains moving mostly sideways, the primary bias will continue neutral.

Elliott Wave Overview

The long-term Elliott Wave landscape of the GBPCAD cross reveals the price action is developing an incomplete three-wave sequence of Intermediate degree labeled in blue, which currently advances its wave (B). The internal structure unfolds in a double-three pattern as it exposes the next weekly chart on a log scale.

The previous chart reveals that the double-three pattern in progress looks incomplete. According to the Elliott wave theory, this complex formation follows an internal structural series subdivided as 3-3-3. In this context, the GBPCAD cross advances in its last “three” or the third component of the double-three pattern identified as wave Y of Minor degree labeled in green.

The internal structure of wave Y subdivided into another “three” sequence, which advances in its wave ((b)) of Minute degree labeled in black. Likewise, the wave ((b)) follows the arrangement of a triangle pattern. Thus, the GBPCAD cross should develop an upward movement subdivided into five-waves, corresponding to its wave ((c)) of Minute degree identified in black.

Elliott Wave Outlook

Considering the progress of the GBPCAD cross into a triangle pattern, the following 12-hour chart unveils that the price completed its wave ((b)) with the failure of reaching a new lower low at 1.69014, where the cross began to advance in an upward sequence that corresponds to its wave ((c)) of Minute degree identified in black.

The previous chart illustrates the end of the wave (e) of Minuette degree identified in blue and the upward sequence of a potential leading diagonal pattern, which could follow a 5-3-3-3-3 internal sequence. Simultaneously, the price seems to be advancing in its fifth wave of Subminuette degree labeled in blue, which belongs to the first wave of Minuette degree in blue. 

The first impulsive wave of Minuette degree could find resistance in the supply zone between 1.73665 and 1.74341, from where the cross could start to retrace until the demand zone is located between 1.71151 and 1.70262. Once GBPCAD completes its second wave, the third wave could become the upward cycle’s extended wave. This upward movement could drive the pair toward 1.77356 and continue until 1.79911.

The bullish scenario’s invalidation level locates at 1.69014, which coincides with the wave’s origin ((c)) that remains in progress.

Categories
Forex Elliott Wave Forex Market Analysis

Can EURUSD Re-Test the Level 1.20?

The EURUSD pair advances in an unfinished impulsive formation that raised the common currency from 1.06359 till 1.20114. The price action started to develop a corrective sequence, still progressing, corresponding to its fourth wave of Minor degree. Explore with us what should be the target of the fifth impulsive wave.

Market Sentiment

The long-term market sentiment of the EURUSD pair based on the 52-week high and low range unveils the price moving in the extreme bullish zone. 

The following daily chart illustrates the common currency moving above the 60-day linear weighted moving average, confirming the extreme short-term upward bias prevalent in the current price action.

Likewise, the consolidation formation bounded between 1.16121 and 1.18566, appearing after the rally from mid-May to early September, leads us to anticipate the take-profit activity of big market participants. In other words, the price could begin a new movement toward the 52-week high zone, creating a euphoric sentiment for the euro before developing a corrective move.

Elliott Wave Overview

 EURUSD pair’s long-term outlook under the Elliott Wave perspective reveals the upward advancement of the common currency in an unfinished impulsive wave, which currently progresses in its fourth wave of Minor degree, suggesting further highs.

The following daily chart exposes de uptrend developed by the EURUSD since the March 23rd low located at 1.06359, where the price found fresh buyers, who remain in control of the long-term uptrend.

The Elliott Wave point of view illustrates the EURUSD pair developed and completed a third extended wave of Minor degree labeled in green when the price reached 1.20114 on past September 01st. Once the common currency found resistance at 1.20114, the EURUSD started to develop its fourth wave of Minor degree identified in green.

Considering that the second corrective wave was simple in terms of price and time, by the alternation principle of the Elliott Wave theory, the fourth wave should be a complex correction. In this regard, the complexity could be in terms of price, time, or both.

If the correction were complex in price, the formation could be a flat pattern like an irregular flat. If the complexity were in terms of time, the corrective pattern could be a triangle formation. Finally, if the correction develops a combination of price and time complexity, the structural series could be a double three or a triple three pattern.

Short-term Elliott Wave Outlook

Once the fourth wave ends, the common currency should advance in its fifth wave, shown in green in the following chart. Considering that the third wave is the extended wave, two potential scenarios exist for the fifth wave target.

The first scenario considers the advance slightly higher than the top of the third wave, which could reach the area between 1.2065 and 1.2257.

The second scenario may arise if the fifth wave’s bullish pressure fails and finds resistance in the supply zone, which is located between 1.19361 and 1.20114.

To conclude, the invalidation level corresponding to this bullish scenario is a close below 1.11639.

Categories
Forex Signals

EURAUD Bounces in a Demand Zone

Description

The EURAUD price reacted, developing an upward wide range candle during the overnight trading session when the price tested the bullish cycle’s demand zone. The cross began on September 16th when the price found fresh buyers at 1.61240 finished on October 20th when the cross found resistance at 1.68273.

Once the price found resistance, the cross started a bearish sequence as a corrective structure subdivided into a three-wave structural series, which looks in an exhaustion stage.

On the other hand, we recognize a consolidation formation between 1.61934 and 1.62494, corresponding to mid-September, where the cross found support during the Friday 06th overnight trading session.

In summary, the EURAUD cross could find fresh buyers in the zone between 1.62494 and 1.61934 from where the price could test the previous swing high located between 1.63533 and 1.63853.

Chart

Trading Plan Summary

Check out the latest trading signals on the Forex Academy App for your mobile phone from the Android and iOS App Store.

Categories
Forex Market Analysis

Profiting from GBPNZD Weakness

Overview

The GBPNZD cross extends its losses. The pair’s sentiment is currently controlled by the bears. The Elliott Wave sequence suggests the possibility of a new decline, which could accelerate its price toward the long-term ascending trendline.

Market Sentiment

The GBPNZD cross declined 0.47% in the Wednesday trading session, propelled by the US presidential election’s tight results. In this context, the 12-hour chart illustrates the market sentiment, displaying the 90-day high and low range.

We observe in the previous chart that GBPNZD moves mostly sideways and consolidating in the bearish sentiment zone. Simultaneously, the price action moving below the 200 moving average is a confirmation that the short-term bias is to the downside Furthermore, the current session’s range and long body candle reveal the bearish pressure dominating the market sentiment. Finally, the following chart’s lower graph shows the retail traders’ activity positioning, which moves to 74% on the long side. This contrarian indicator confirms the bearish bias of big market participants.

In summary, as long as the GBPNZD price doesn’t unveil bullish reversal signals or surpasses the 1.96371 level, the market sentiment will remain on the bearish side.

Technical Big Picture

The long-term outlook of the GBPNZD cross under the Elliott Wave perspective unveils its advance in a corrective structure, which began in late August 2015 when the price topped at 2.53193 and declined in a three-wave internal sequence. This downward sequence ended in early November 2016, when the price found support at 1.67055.

Once the cross found fresh buyers, the price started to advance in an ascending corrective sequence identified as wave (B) of Intermediate degree, which ended in the first part of March 2020 when the GBPNZD climbed until 2.17598.

In terms of the Elliott wave theory, considering that the structural series in progress completed two segments subdivided into three internal waves, the sequence could correspond to a flat pattern, a triangle, or a double three formation.

Nevertheless, although the three potential structures have different implications, the pressure remains on the bearish side.

Short-term Technical Analysis Outlook

The GBPNZD cross in its 4-hour chart unveils the incomplete downward structure that began on August 20th at 2.02711. This bearish short-term sequence of Minuette degree identified in blue could correspond to a wave (iii) or (c).

In both cases, an upward retracement toward the psychological 1.94 barrier could serve as an entry to the bearish side. Likewise, the third segment, in development, could extend its drops to the area between 1.91117 and 1.89719, which coincides with the long-term ascending channel.

In this regard, long-term traders could wait for this decline where the price could re-test the long-term trendline to add to their long positions.

Finally, the invalidation level for this bearish scenario stays at 1.98053, which coincides with the end of wave (ii) or (b) identified in blue.


Categories
Forex Forex Elliott Wave Forex Market Analysis

Is CADJPY Ready for a New Rally?

Overview

The CADJPY cross advances mostly sideways in an incomplete triangle pattern. The corrective structure that remains in progress suggests the possibility of further upsides in the coming trading sessions.

Market Sentiment

The market sentiment on the CADJPY cross looks neutral, although during the overnight trading session, although the US presidential election is driving up volatility.

The following daily chart shows the long-term market participants’ sentiment unfolded between the 52-week high and low range. The figure reveals the price action currently moving on the neutral zone, which moves near the level of 79.274. 

In this context, the neutral sentiment is confirmed by the sideways channel, which began in early June, and the price action moving below the 60-day moving average Nevertheless, the bullish wide range candle of November 02nd leads to expect further upsides in the following weeks.

Technical Big Picture

The CADJPY cross moves in a sideways upward structure that belongs to an incomplete upward sequence that began last March 17th when the price found fresh buyers at 73.803.

The 2-day chart shown below illustrates the big picture of CADJPY under the Elliott Wave analysis perspective. The figure reveals the pair’s action advancing in an incomplete third wave of Minute degree labeled in black.

The consolidation structure of the CADJPY cross, in progress, suggests the possibility of a bullish continuation. Likewise, in terms of the Elliott Wave theory, if the current upward sequence corresponds to an incomplete impulsive sequence, the price could develop an extended wave. Nevertheless, a signal of confirmation of the potential new rally will occur if the price breaks and closes above the pivot level located at 79.823.

The short-term supports and resistance levels are as follows:

  • Resistance 1: 80.542
  • Resistance 2: 81.448
  • Resistance 3: 82.634

Pivot Level: 79.823

  • Support 1: 78.502
  • Support 2: 77.573
  • Support 3: 76.526

Short-term Technical Analysis Outlook

The CADJPY cross in its 4-hour chart unveils the course in a corrective structure that resembles a triangle pattern (subdivided into 3-3-3-3-3). This potential triangle pattern remains unfinished and could be developing its wave (d) of Minuette degree labeled in blue.


From the previous chart, both the breakout and close above the descending trendline connect the top of wave (b) of Minuette degree with the end of wave b identified in green as the close above the level 79.872 could confirm the turning bias from neutral to bullish.

The advance in its wave (d) identified in blue could find resistance between 81.448 and 81.909. Once the potential triangle pattern completes, the price could advance toward 84.739 and even extend its gains until 86.677.

Finally, the upward scenario’s invalidation level is located below the end of wave (a) of the Minuette degree labeled in blue.

Categories
Forex Forex Market Analysis

EURAUD: Can we Profit from the Bear Side?

Overview

The EURAUD cross moves mostly bearish in a downward sequence that began in early October. The price action suggests that the cross could develop a new low before complete the bearish sequence still in progress.

Technical Big Picture

The EURAUD cross penetrated the sideways trading zone developing the second bearish leg of its three-wave movement that looks incomplete. Likewise, once the current bearish wave ended, the cross could start a new rally subdivided into a five-wave sequence.

The following chart represents the EURAUD cross in its 12-hour range, in which the sideways trading range goes between 1.60332 and 1.65744. This consolidation formation found its bottom on June 02nd, and its top corresponds to a pivot level that turned into a long-term key level.

Consequently, as long as the price keeps moving below this level, the short-term bias will continue being bearish. However, the May 29th breakout of the 1.67728 level, when the cross rallied topped at 1.68273, suggests the possibility of a new upward sequence.

Concerning its Elliott wave analysis, the current bearish sequence corresponds to an incomplete wave ((b)) of Minute degree labeled in black, which began when the price found fresh sellers at 1.68273.

Currently, the EURAUD cross advances in its internal wave (c) of Minuette degree identified in blue. Its completion could suggest a new rally that could drive the price toward the October high zone.

The short-term key supports and resistance levels are as follows:
• Resistance 1: 1.66856
• Resistance 2: 1.67824
• Resistance 3: 1.68724
Pivot Level: 1.65744
• Support 1: 1.64608
• Support 2: 1.63565
• Support 3: 1.62565

Technical Analysis Outlook

The short-term outlook for the EURAUD cross and under the Elliott Wave perspective exposes the bearish advance in the third wave of Subminuette degree identified in green, which belongs to the wave (c) of Minuette degree labeled in blue.

The following 3-hour chart shows the intraday consolidation activity that suggests the equilibrium between bull and bear traders. In terms of the wave theory, the consolidation structure should correspond to wave iv of Subminuette degree.

The Elliott wave structure suggests the possibility of a limited upside until 1.6460 and 1.6494, where the price could find fresh sellers expecting to join their limited positions with a potential target in the area between 1.63198 and 1.62201. This decline should complete the fifth wave that belongs to wave (c) identified in blue.

Finally, the invalidation level of the bearish scenario locates at 1.6573.

Categories
Forex Elliott Wave Forex Market Analysis

EURJPY: Can we Profit Short-Term?

Overview

The EURJPY cross advances in a corrective sequence that began on September 01st; this corrective movement looks incomplete. The short-term Elliott wave outlook foresees a limited recovery prior to its a coming decline corresponding to its fifth wave.

Technical Big Picture

The EURJPY cross, in its 12-hour chart, illustrates an incomplete downward sequence that began on September 01st when the price found fresh sellers at level 127.075. 

The previous figure exposes an upwards structural series subdivided into three-wave identified in Minute degree and labeled in black, which began on the May 06th low located at 114.397 and ended on the September 01st high when the price topped 127.075. 

Once the price found fresh sellers at 127.075, the cross started to retrace, developing a three-wave sequence identified in the Minuette degree labeled in blue. Until now, wave (c) doesn’t show bullish reversal signals, which lead us to expect further declines.

The short-term key supports and resistance levels are as follows:

  • Resistance 1: 123.160
  • Resistance 2: 124.233
  • Resistance 3: 124.999
  • Pivot Level: 122.377
  • Support 1: 121.144
  • Support 2: 120.271
  • Support 3: 119.311

Technical Outlook

The short-term outlook for EURJPY illustrated in its 3-hour chart reveals the intraday consolidation, which coincides with the progress of its fourth wave of Subminuette degree labeled in green.

In this regard, the market participants could mostly drive the price toward the supply zone between 122.550 and 122.890, from where the EURJPY cross could start developing the next decline corresponding to its fifth wave identified in green.

The potential target zone of the next decline locates between 121.038 and 120.051, which coincides with the base-line of the descending channel that extends from the September 01st high to date. 

Finally, the invalidation level of the downward scenario locates at 123.402.

Categories
Forex Education Forex System Design

How to Optimize a Trading Strategy

Introduction

Once the developer successfully ends both the multi-market and multiperiod test of a trading strategy, he can move to the optimization process. However, there are some risks associated with its execution that the developer should recognize.

In this educational article, we’ll present the different stages of a trading strategy’s optimization process.

Preparing for the Optimization

After passing the multimarket and multiperiod test, the developer has verified that the trading strategy works. Therefore, he could move toward the next stage that corresponds to the trading strategy optimization.

Optimization is used to determine the optimal parameters for the best result of a specific process. In terms of trading strategy, the optimization corresponds to selecting the most robust parameter set of a strategy that would provide the peak performance in real-time markets. 

Nevertheless, selecting the highest performance that provides the most robust set of parameters can result in challenging work. This situation occurs because each set of parameters will correspond to a specific historical data range used in each simulation.

In this regard, the developer’s top parameter selection must be part of a set of evaluation criteria defined before executing the optimization process.

Risks in Optimization

The optimization has pitfalls that the developer must consider at the time of its execution; these traps can lead to increased risks when applying the trading strategy.

The first risk is overconfidence that the results obtained during optimization will produce the same market results in real-time. The developer must understand the strategy and each effect of the results obtained in each part of the optimization stage.

The second risk involves excessive overfitting of the strategy’s parameters. This risk is due to the execution of the optimization without considering the guidelines and appropriate statistical procedures.

Finally, using a wide range of parameters can lead to obtaining extremely positive backtested results. However, such positive returns generated during the optimization stage do not guarantee that they will happen in real-time markets.

Optimizing a Trading Strategy in MT4

In a previous educational article, we presented the development process of a trading strategy based on the crossings of two moving averages, which corresponds to a linear weighted moving average (LWMA) of 5 periods and a simple moving average (SMA) of 55 periods. 

This example considers the execution of an optimization corresponding to both moving averages, and the optimization’s objective will be to find the highest profit.

Before executing the optimization, the developer must select the Strategy Tester located in the toolbar, as illustrated in the next figure.

Once picked the trading strategy to optimize, it must select “Expert Properties,” where the developer will identify and define the parameters to optimize.

The next figure illustrates the “Expert Properties” box. In the first tab, the developer will select the Testing properties, where the “Custom” option will provide a broad range of outputs for each scenario obtained during the simulation stage. 

After the Testing selection criteria, the developer can select the parameters to optimize during the historical simulation. In the example, the parameters to optimize will be the fast (LWMA(5)) and the slow (SMA(55)) moving averages. The developer must consider that as long as it increases the parameters to optimize simultaneously, the simulation will increase its length of time.

Once the “Start” button is pressed, the Strategy Tester in the “Optimization Results” tab will reveal each parameter variation’s output. In the case illustrated in the following figure, the results are listed from the most to less profitable. 

The results also expose the Total Trades, Profit Factor Expected Payoff, Drawdown ($), and Drawdown (%), and the inputs for each historical simulation.

In conclusion, the trading strategy based on the cross between LWMA(6) and SMA(192) in the historical simulation returned $1,818 of profits with a Drawdown equivalent to 5.77% or $688.17. Likewise, these parameters are valid only for a 4-hour chart

Nevertheless, analyzing the criteria described by Robert Pardo, which considers that a trading strategy should provide three times the drawdown, the strategy should generate three times the dropdown, in this case, the parameters applied into the model returned 2.64 times more profits over the drawdown. 

Next Tasks After the First Optimization

Once the first optimization was performed, the developer should analyze the trading strategy behavior with non-correlated assets and its performance in other timeframes. 

If the strategy passes this stage, the developer could make a walk-forward analysis. Among other questions, the strategist should answer whether the strategy will make money in real-time trading.  He also should evaluate the strategy’s robustness, where he would determine if the strategy is sufficiently robust and ready to trade in real-time.

Finally, once these stages are successfully passed, the trading strategy should be tested with paper money before its implementation in the real market.

Conclusions

In this educational article, we presented the steps for executing a simple optimization corresponding to a trading strategy based on the cross between two moving averages.

Before starting to optimize a trading strategy, the developer must weigh both the risks involved by the optimization process and the optimization analysis’s objective as the results that the study will generate.

Finally, although the optimization process reveals that the trading strategy is robust, the developer must continue evaluating if it can generate real-time trading profits.

Suggested Readings

  • Jaekle, U., Tomasini, E.; Trading Systems: A New Approach to System Development and Portfolio Optimisation; Harriman House Ltd.; 1st Edition (2009).
  • Pardo, R.; The Evaluation and Optimization of Trading Strategies; John Wiley & Sons; 2nd Edition (2008).
Categories
Forex Market Analysis

Australian Dollar Prepares for Interest Rate Decision and Retail Sales Data Ahead

Overview

The Australian Dollar will face two high volatility events; the first one corresponds to the interest rate decision, for which the analysts’ consensus foresees a rate cut to 0.1% from the current 0.25%. The second one corresponds to September’s Retail Sales figures, where the consensus expects a recovery. Nevertheless, the price action suggests a new decline before reversing.

Market Sentiment

From a fundamental perspective, the Australian Dollar will have two high volatility events that will drive the next week’s oceanic currency movements.

The first event corresponds to the Interest Rate Decision, which will occur on Monday the 2nd during the overnight session. The analysts’ consensus foresees a reduction from the current rate of 0.25% to 0.10%. 

The last interest rate cut by the Reserve Bank of Australia’s broad members occurred in March 2020, where policymakers decided to cut the reference rate from 0.5% to 0.25%.

The second high impact will occur in the overnight trading session of Tuesday 03rd, where the Australian Bureau of Statistics will release the Retail Sales (MoM) data corresponding to September. The analysts’ consensus foresees a decline to 1.5%. 

Although the analysts’ polled foresee a contraction for September, they expect an improvement in the retail sector after falling 4% in August.

On the market sentiment side, the GBPAUD cross in its daily chart exposes the 90-day high and low range, which reveals the short-term participants’ sentiment. 

The previous chart illustrates the price action moving in an upward sequence that began on September 11th that pushed the cross from the extreme bearish sentiment zone toward the extreme bullish sentiment zone. 

In fact, the 60-day moving average movement below the price confirms the bullish bias that carries the cross. The next supports locates at 1.82688, which corresponds to the extreme bullish sentiment zone support, and 1.81227 corresponds to the 60-day moving average that acts as a dynamic support.

In summary, considering the pessimistic forecasts by the Australian data analysts and the extreme bullish sentiment unveiled in the GBPAUD cross, there exist the possibility of further weakness in the oceanic currency.

Technical Analysis Outlook

The big picture of the GBPAUD cross under the Dow Theory exposed in its 2-week log-scale chart reveals the price is moving mostly sideways since early March 2013, when the price touched its bottom of 1.43811. Once the cross found buyers, the price raised until 2.23722 reached in mid-August 2015. 

Once the March 2015 high was reached, the pair started to correct the Primary trend finding support at 1.57896 in late October 2016. This correction accomplishes the Dow Theory rule that says that the Secondary trend retraces between 33% to 66% of the Primary trend. 

The same situation occurs with the ascending sequence that advances from 1.57896 toward 2.08522 reached in mid-March 2020, which retraces beyond 66% of the previous decline. 

Likewise, the GBPAUD cross started to develop a downward sequence, which found a bottom at 66% of the previous rally. Nevertheless, considering the price and time relationship between the last decline and the previous two movements, we conclude that this decline corresponds to the Minor trend of the Secondary upward trend, which looks incomplete. 

The GBPAUD outlook under the Elliott Wave Theory exposes the progress in a downward five-wave sequence, which advances in its incomplete wave 4 of Minor degree labeled in green. This corrective structural series currently moves in its wave ((a)) of Minute degree identified in black.

Considering the elliott Wave theory, the current wave in progress should develop three internal segments and advance until the zone between 1.86783 to 1.90442, where the cross could find resistance and start its wave ((b)) in black.

Likewise, considering that the third wave of Minor degree is the extended wave, the fifth wave should fail to reach a lower low than the end of the third wave of Minor degree located at 1.74935. Finally, the invalidation level of the bearish scenario is located above 1.95100.

Categories
Forex Market Analysis

US Dollar Index Advances Boosted by Surprising Economic Growth

Overview

The US Dollar Index accelerated its gains on Thursday’s trading session boosted by the surprising economic recovery in Q3 2020 that advanced 33.1%, beating analysts’ expectations. Nevertheless, although Greenback’s intraday recovers, the price could see a new decline in the coming trading sessions.

Market Sentiment 

The US Dollar Index (DXY) raises on Thursday trading session by 0.54%, boosted by Q3’s GDP growth rate, which beat the analysts’ expectations.

The US economy expanded in the third quarter by 33.1% in Q3 2020, beating the analysts’ consensus of a 31% raise. This reading is the biggest expansion in the economy following the previous  Q2 period, which unveiled a record 31.4% plunge triggered by the coronavirus lockdown.

The following chart exposes the US Dollar Index in its daily timeframe. The figure unveils the 90-day high and low range, the price action moving mostly sideways in the bearish sentiment zone. 

Likewise, the intraday activity develops a strong bullish movement during its Thursday’s trading session, which looks accelerating, supported, as already said, by the surprising Q3 GDP growth, whose figure was released on Thursday before the US session’s opening bell. 

In summary, the US Dollar Index context shows that the big picture of the market is on the bearish side. However, the intraday activity reveals an upward thrust representing an upward correction of the Greenback’s primary bearish trend.

Technical Analysis Outlook

On the technical side, the US Dollar Index unveils its price movements in an incomplete corrective formation, which still could visit fresh lows.

The next weekly chart and in log scale reveals the DXY under the perspective of the Dow Theory, which exposes to its primary trend developing an incomplete correction of the rally that the Greenback began in early May 2011 and found resistance at 103.82 in late December 2016.

Once the Dollar Index found fresh buyers, the public activity raised, driving the price towards the level of 103.82, where DXY began to develop a corrective move, which remains in progress. The first decline fell to 50% of the previous rally, finding support at 88.25, where the price reacted, developing an upward sequence.

Actually, the price action develops a consolidation structure following a sideways formation, which is in progress since early January 2018. The third segment, which looks in place, accumulates a retracement of around 66% of the corrective formation’s second internal leg. This reading leads us to observe that the current decline could be in an exhaustion stage.

The long-term Elliott Wave perspective for DXY marks its advancement in an incomplete flat pattern (3-3-5), which currently advances in its wave C of Minor degree labeled in green. This current leg could see further declines in the coming trading sessions.

As illustrated in the next 2-day chart, DXY advances its wave ((iv)) of Minute degree identified in black. According to the alternation principle, the internal segment should take more time than wave 2. In this regard, the level of complexity of this corrective formation should be higher than on the second wave. In other words, the fourth wave could be a triangle formation or a double or triple correction.

Finally, the wave C’s potential bearish target can be located below the mid-February 2018 low; it is near the 87.5 level, where the Greenback could start to develop a new bullish cycle of upper degree. The invalidation level of the current bearish scenario is placed at 98.50.

Categories
Forex System Design

Starting the Testing Process of a Trading Strategy

Introduction

The development of a trading strategy requires steps to evaluate its reliability during its execution in real markets. To achieve this, the developer must develop a testing process to determine its robustness and viability as a previous step before its optimization.
In this educational article, we’ll introduce the steps of a trading strategy’s testing process.

Getting Started with Testing the Trading Strategy

Once the developer completed the programming of a  candidate trading strategy, it’s time to confirm if the strategy works as the conceptual model assumes. In this regard, the strategist should follow the following steps:

  1. Verify the preliminary profitability of the trading strategy.
  2. Assessing the robustness delivered by the strategy.

The robustness concept relates to the ability to continue generating substantial profits despite adverse market conditions, such as trend changes or extremely volatile conditions. An alternative method for verifying the strategy’s robustness is by assessing if it continues being profitable under a wide basket of markets.

Another critical part of the testing process is to verify the trading rules. As the strategy’s complexity increases, rules also increase in complexity. In this context, the developer must validate that the execution of the buy and sell signals happens at the levels triggered by the strategy’s rules. The verification of entry and exit signals will allow the developer to identify any programming error.

Analyzing Profitability

Once the programming stage is verified, the developer should estimate the trading strategy’s profitability considering a reasonably lengthy historical price series. 

As a guide, a short-term strategy may be tested using two years of price data, a mid-term would need up to four years, and a long-term up to eight years of historical data. Nevertheless, the window size may vary depending on the strategy type or the market conditions.

With this information, the strategist will have a panoramic overview of the trading strategy’s profitability and risk. In this regard, if the strategy’s performance is deemed acceptable, the developer could advance to the next stage of the testing process.

Nevertheless, if the strategy has a poor performance, the developer should judge if it could be redesigned or discard it.  

Finally, for a proper evaluation, the strategy must be run using a standard one unit trading size. This way, the profits would result in multiples of the risk.

The Multimarket and Multiperiod Test

The multimarket and multiperiod test corresponds to the last stage of the testing strategy’s performance. During this historical simulation, the developer must study a set of parameters of the strategy considering a small basket of diversified markets over a broad range of historical periods. In other words, the developer must develop a historical simulation taking a group of different assets using different timeframes.

The developer must select a small portfolio of non-correlated assets; in other words, markets that don’t relate to each other. An example of a non-correlated portfolio is a mix of a commodity, a bond, and a stock index.

Concerning the length of the test period, Robert Pardo suggests that to obtain solid results, the developer should use ten years of historical data for each market. However, it could start from five years of historical prices. Pardo’s figures are related to long-term stock trades using daily timeframes. Intra-day trading systems, as already stated, would require smaller data ranges.

The results obtained from the historical simulation will provide an objective overview of the trading strategy’s profit and risk.  Depending on the results obtained, the developer may terminate if the strategy is robust and produces reasonable returns or if it performs poorly and should be rejected. Likewise, the strategist may observe that the strategy presents mixed results, so it should not be rejected entirely.

Conclusions

During the testing process of a trading strategy, the developer must evaluate a broad range of aspects that ensure the correct work during its evaluation.

For example, the developer must verify if the opening and closing trades’ programming rules execute as the strategy requires. After this step, the robustness degree will drive the strategist to conclude if it is viable in real markets, needs improvements, or should be rejected.

Finally, on a multimarket and multiperiod test, the developer must evaluate the strategy’s performance in a small non-correlated portfolio using different timeframes. Once this historical simulation is made, the strategist would be able to confirm if the strategy is robust and viable or reject it before continuing with the optimization stage.

Suggested Readings

  • Jaekle, U., Tomasini, E.; Trading Systems: A New Approach to System Development and Portfolio Optimisation; Harriman House Ltd.; 1st Edition (2009).
  • Pardo, R.; The Evaluation and Optimization of Trading Strategies; John Wiley & Sons; 2nd Edition (2008).
Categories
Forex Market Analysis

Dow Jones Turns Bearish As the US Presidential Election Approaches

Overview

The Dow Jones Industrial Average holds its bearish bias expecting the US presidential election scheduled next November 03rd. Throughout this year, the Industrial Average has declined over 6% (YTD). Although the latest decline looks like a short-term top, the US leading benchmark could resume its advances.

Market Sentiment Overview

The Dow Jones Industrial Average (DJIA) accelerated its declines on Wednesday’s trading session, backed by the market participants’ expectations before the US presidential election scheduled next November 03rd.

The following daily chart exposes the short-term market movements of the Industrial Average. The figure shows the penetration below the psychological level of 27,035.1 pts, which indicates the Dow Jones penetrating the bearish sentiment zone.

Simultaneously, the price action reveals its consolidation below the 60-day weighted moving average, which confirms the bearish bias. On the other hand, the re-test of the previous low located at 26,541 pts increases the likelihood of further declines.

The next daily chart unveils the 90-day high-low range of the Dow Jones Volatility Index (VXD). The figure shows the advance of VXD in the bullish sentiment zone, which confirms the bearish sentiment observed in the Industrial Average, as an increasing (bullish) volatility is mostly associated with declining prices.

Therefore, considering both the Industrial Average as the Dow Jones Volatility Index, the short-term market sentiment bias for the DJ-30 remains on the bearish side. The likelihood of extended declines would drive the DJIA toward the extreme bearish sentiment zone.

Technical Analysis Outlook

The big picture of the Industrial Average reveals that the retracement experienced during the last two weeks belongs to the bullish sequence that began on March 23rd when the Dow started its recovery, following the massive mid-February sell-off.

The DJIA’s technical outlook under the Elliott Wave Theory is unveiled in the following log-scale daily chart. We can see that the primary bullish trend that began with March 23rd’s low located at 18,213.5 pts, which is currently in progress.

In the figure, we see DJIA’s price consolidating in a sideways formation. This stage began once the Industrial Average topped at 29,193.6 pts on September 03rd.

On the other hand, we should consider that the sideways formation moves above the 25,570.2 level, or 33% of the bullish sequence of the primary trend. Therefore, the upward trend remains intact right now, and the current correction represents a pause and not a deeper correction for the US benchmark.

The below 4-hour chart shows the Industrial Average under the Elliott Wave perspective, developing an incomplete flat pattern (3-3-5) of Minute degree labeled in black that looks incomplete.

Currently, Dow Jones completed its wave (iii) of Minuette degree labeled in blue, which belongs to wave ((c)) of Minute degree. This structural series that remains in progress moves inside the wave B or 4 of Minor degree labeled in green.

Considering that the flat pattern looks incomplete, the Industrial Average should see a new lower low, which would reveal a bullish divergence on the MACD oscillator confirming the progress on the fifth wave of Minuette degree. After this move, the Dow Jones should develop a wave C or 5 of Minor degree with an internal five-wave sequence.

Therefore, short-term, we may expect a limited decline, likely toward the 26,050 pts, from where Dow Jones could start to develop a new rally in five waves.

Categories
Forex Signals

EURNZD Moves in an Expanding Triangle

Description

The EURNZD cross in its 2-hour range illustrates the advance in a broadening triangle pattern, from where the price action looks testing the baseline of the expanding formation. This test suggests the probability of a new upward movement, which should develop in the coming trading sessions.

From the chart, we distinguish the baseline test by the third time. Furthermore, the baseline’s piercing suggests that the current bearish move could be in an exhaustion stage. This price action context indicates the potential bullish reversal in the EURNZD cross.

The current zone’s long-side positioning could drive the price toward the level 1.76 level as the next potential intraday profit target. The invalidation level of our bullish scenario locates below 1.74895.

An alternative scenario considers the bullish reversal’s extension toward the last significative swing of the current bearish leg that locates at 1.77702, where the price could find the next resistance.

Chart

Trading Plan Summary

  • Entry Level: 1.75295
  • Protective Stop: 1.74895
  • Profit Target: 1.75895
  • Risk/Reward Ratio: 1.50
  • Position Size: 0.01 lot per $1,000 in trading account.


Check out the latest trading signals on the Forex Academy App for your mobile phone from the Android and iOS App Store.


Categories
Forex Elliott Wave Forex Market Analysis

Hang Seng Moves in an Incomplete Flat Pattern

Overview

The Hang Seng Index continues advancing mostly sideways in an incomplete bearish sequence, corresponding to a flat pattern sequence, still in progress. Once the current corrective formation ends, the Chinese benchmark will likely start developing a new long-term bullish cycle.

Market Sentiment Overview

The Chinese benchmark Hang Seng Index (HSI) shows a drop of over 12% (YTD). However, even when it has recovered 16 percent from the lows reached after the massive sell-off occurred during the first quarter of the year, the market sentiment of the Chinese benchmark index continues dominated by the bearish side. 

In the following Hang Seng’s daily chart, we can spot its 90-day high-low range. The figure exposes the index developing in a sideways movement happening since the second quarter of the year. On the other hand, the rejection of the 24,953.4 points suggests that the mid-term market sentiment is slightly bearish. 

Besides, considering that the Hang Seng Index moves on the 60-day weighted moving average, a short-term upward pressure is observed.

In conclusion, the Chinese benchmark’s market sentiment seems neutral, waiting for the price action to unveil the next trend’s direction.

Elliott Wave Outlook

Under an Elliott Wave perspective, Hang Seng’s big picture reveals the incomplete corrective movement from the end of a bullish cycle the Hang Seng Index initiated in mid-February 2016 from 18,278.8 pts. This bullish sequence ended its five-wave structural series when the Chinese benchmark reached its all-time high of 33,484.1 pts in late January 2018.

The next figure illustrates the HSI log chart on a 2-day timeframe. The price pattern reveals the Chinese benchmark moving mostly bearish on its wave (C) of intermediate degree labeled in blue, which seems incomplete. In this context, although HSI reached the minimum requirement for this movement: 100% of equal waves between waves A and C, the internal structure of its C wave is unfinished.

The following 4-hour chart exposes the internal structure of wave 4. We distinguish that the corrective structure has created two Minute degree segments, labeled in black on the figure. Considering that each leg follows an internal sequence subdivided into three waves, the Elliott Wave Theory leads us to expect its progression on a regular flat pattern.

On the other hand, short-term, the Hang Seng Index could develop a new upward movement subdivided into a five-wave sequence, which should complete the ((c)) wave of Minute degree labeled in black. Once this move ends, the Chinese benchmark could develop a new decline corresponding to a wave 5 of Minor degree, which should complete the (C) wave of Intermediate degree.

Finally, considering that the third wave of Minor degree labeled in green was the extended move, and considering the amplitude of wave 4, the fifth wave of Minor degree should not penetrate below the low of wave 3 located at 21,139.3 pts. In other words, the wave (C) of Intermediate degree identified in blue is likely not to end below 21,139.3 pts.

Categories
Forex Signals

EURGBP Could Start a New Rally

Description

The EURGBP cross, in its 4-hour chart, exposes an incomplete corrective structure that completed its wave B. The completion of the wave B of Minor degree suggests a new rally corresponding to the advance of wave C of Minor degree labeled in green.

From the EURGBP chart, we distinguish that the upper degree’s corrective formation subdivided into a three-wave sequence and labeled in a Minor degree and marked in green is incomplete. It could develop its third segment corresponding to wave C, which follows a five-wave internal structure.

On the other hand, the wave B internal structure unveils the double-three corrective pattern. According to the Elliott wave theory, the double-three formation follows a 3-3-3 internal sequence and looks labeled as ((w))-((x)-((y)) of Minute degree identified in black.

In summary, the completion of the double-three pattern of Minute degree that belongs to wave B of Minor degree labeled should give way to the upward advance of wave C identified in green. This wave structure could strike at least to level 0.92. However, the price action could lead the price toward the end of wave A at 0.92916.

The short-term bullish scenario suggests the positioning on the long-side looking for a potential target from the current zone, or better, with a potential profit target at 0.9191. The invalidation level locates below level 0.9041.

Chart

Trading Plan Summary

  • Entry Level:0.91012
  • Protective Stop:0.90412
  • Profit Target: 0.91912
  • Risk/Reward Ratio: 1.50
  • Position Size: 0.01 lot per $1,000 in trading account.


Check out the latest trading signals on the Forex Academy App for your mobile phone from the Android and iOS App Store.

Categories
Forex Education Forex System Design

How to Determine the Size on a Historical Simulation

The simulation of a trading strategy requires a historical data series to assess the stability of the strategy’s results over time. Likewise, the strategist must consider the strategy before determining the window’s size before starting the historical simulation.

This educational article presents the concepts that will allow developers to estimate the data requirements to assess a trading strategy’s stability through a historical simulation process.

Setting the Requirements of Historical Data

As said, the strategy’s simulation process requires historical price data. Of this data, the developer must select a test window to perform the evaluation.

In this regard, in deciding the size of the historical data window, the strategy developer should consider both the statistical robustness and the relevance of the data for the trading system and the market.

However, these requirements will not accurately determine the test window’s size, either in hours, days, or even months. Instead, they provide a guideline for selecting a range of data suitable for developing the historical simulation process.

Suffice to say that the data window selection will have a significant influence on the results of a historical simulation.

Statistical Requirements

In statistical terms, the data window’s length must be large enough for the trading strategy to develop a sufficiently large number of trades to allow the strategy developer to reach meaningful conclusions about its performance. 

On the other hand, the data window should be large enough to allow sufficient degrees of freedom for the number of variables used in the trading strategy.

The standard error is a measure used in statistical analysis. The strategist can use this value as a measurement of the sample size impact in the historical simulation.

A high standard error suggests that each trade’s result is far from the strategy’s average profit. On the contrary, a low reading would indicate that the variation in an individual trade result will be closer to the average of the strategy’s benefits.

In other words, the standard error provides the strategy developer with a measure of the reliability of the average win based on the number of winning trades.

Quantifying the Required Amount of Trades 

According to the statistical theory, the larger the sample size is, the more reliable the trading strategy’s historical simulation results will be. However, several technical factors, such as data availability, avoids getting as many trades as the developer would like. 

The number of required trades increases in long-term systems, which tend to trade less frequently. In this case, the best option is to search for a sufficient amount of trades; another option is to make the data window wider.

In this regard, the statistical theory asks for a minimum sample size of 30 observations to be statistically acceptable. However, the strategy developer must aim for a much larger number of trades because the minimum of 30 samples requires the phenomenon under observation to follow a gaussian distribution, with is unlikely the financial markets would do.

Stability and Frequency of trades

The stability of a trading strategy corresponds to its results’ overall consistency during the strategy’s execution. In this way, as the strategy becomes more stable, it will tend to be more reliable over time.

The developer can distinguish the trading strategy’s stability by verifying whether the trades are distributed uniformly within the test window. Likewise, the strategist can confirm that the strategy is more stable as the standard deviation of the size and duration of the profits/losses shortens.

The frequency of trades will influence the length of the trading window. Thus, the higher the trading frequency, the shorter the historical data needed for historical simulation. 

In other words, a fast trading strategy running in markets with high volatility will require a small data window, which could reach up to three years. By contrast, a slower trading strategy, such as daily trend following, will require a larger data window, exceeding five years. 

One rule of thumb is: The strategist should make sure the trading system be tested under all market conditions, Bull, bear, sideways markets – under high, medium, and low volatility.

Conclusions

The execution of a trading strategy’s historical simulation requires a data size enough for the developer to evaluate its profitability and stability.

A high-frequency trading strategy will require less data than a long-term strategy, which will require a significant quantity of data, which could exceed three years of data.

The standard error can be used to evaluate the simulation’s results and determine the historical data window’s validity.

The strategist should ensure the trading system is tested under all market conditions: Bull, Bear, Sideways, and under all volatility types in which it is supposed will be used live.

Suggested Readings

  • Jaekle, U., Tomasini, E.; Trading Systems: A New Approach to System Development and Portfolio Optimisation; Harriman House Ltd.; 1st Edition (2009).
  • Pardo, R.; The Evaluation and Optimization of Trading Strategies; John Wiley & Sons; 2nd Edition (2008).
Categories
Forex Elliott Wave Forex Market Analysis

NZDUSD Short-Term Wave Analysis

Overview

The NZDUSD pair advances in a sideways corrective formation suggesting the progress in an incomplete short-term flat pattern. The completion of its move could give way to a new bearish movement of the upper degree; however, this incomplete correction could be temporary.

Market Sentiment Overview

The New Zealand Dollar moves slightly bullish this Thursday, 22nd advancing 0.13%, expecting the inflation data released by New Zealand’s Statistics, Stats NZ, in the upcoming overnight session. The data corresponds to the third quarter of 2020, and surveyed analysts expect an increase that could rise to 1.7% (YoY), being 0.2% more than the previous reading published in July.

The New Zealand Dollar futures market sentiment, presented in the following daily chart, unveils the price moving in the extreme bullish sentiment zone. In the chart, we can distinguish  0.6463 as support the level and 0.6797 as the resistance level. A level that corresponds to the 52-week high. 

On the other hand, the chart highlights the price action is moving mainly sideways, consolidating around the weighted moving average of 60 days. This context of price action suggests we can expect a corrective move before continuing its bullish trend.

Concerning the evolution of the Commitment of Traders Report, the previous chart exposes the institutional positioning on the bullish side. In consequence, although the current consolidation calls for a corrective move, the primary trend is bullish.

The next figure unveils that 73% of retail traders currently hold their positions on the bearish side, confirming a contrarian long-term upward bias to this pair.


Elliott Wave Outlook

The NZDUSD short-term outlook under the Elliott Wave perspective unveiled in its 3-hour chart exposes the kiwi’s sideways advance since the oceanic currency topped at 0.67978 on September 18th, where the pair started to develop a corrective structure that remains in progress.

Considering that a corrective structure is subdivided into a three-wave sequence, we can notice in the previous figure that the NZDUAD action progresses in its second wave, identified as wave B of Minor degree, and labeled in green. This segment corresponds to a flat pattern (3-3-5), which currently develops its wave ((c)) of Minute degree identified in black.

At the same time, the internal structure of the wave ((c)) reveals that the price action could be advancing in its wave (v) of the Minuette degree labeled in blue. This market context suggests the possibility of a limited upside before start developing a downward sequence, corresponding to wave C of Minor degree. 

In summary, the short-term outlook for the NZDUSD pair, under the Elliott Wave perspective, foresees a downward move, which corresponds to a wave C of Minor degree. This potential next move may subdivide into a five-wave sequence. Once this corrective formation completes, the Kiwi should begin to develop a new upward impulsive sequence of upper degree coinciding with the long-term institutional bias.

Categories
Forex Daily Topic Forex System Design

Understanding Slippage Effect in a Trading Strategy

Introduction

Slippage is one of the hidden costs any trading strategy is exposed to. Usually, this type of cost tends to be overlooked from studies of historical simulation. However, a strategies’ developer must understand its nature and assess its impact on its performance.

Increasing Reality in the Historical Simulation

To properly create a historical simulation of a trading system, it needs to consider certain assumptions that, although they may seem insignificant, they are not inconsequential. Their omission could lead to the accuracy of the results obtained. The most critical assumptions that the strategy developer should consider are related to the trading strategy’s deviations.

Slippage in Price and Trade

Each executed trade has a cost that occurs when it is filled. This cost is made of two parts, one fixed and another one variable. The fixed cost is known as the commission, which corresponds to a broker’s fee when it places the order into the market.

The variable element corresponds to the slippage. Slippage can have a significant impact on the profitability of the strategy. The slippage’s origin and size depend on various factors, such as the order type, size, and market liquidity.

There exist three types of orders that the strategist can place into the market; these are as follows:

  • Market Order: this is an order to buy or sell an asset at a price quoted in the current market. This order is guaranteed, but not the level at which it is finally filled. Thus, slippage may be high.
  • Stop Order:  A Stop buy Order is placed above the current price, whereas a Stop Sell order is located below the market’s price. Stop orders can be employed to enter and exit the market. The problem with Stop orders is that they usually fill at a worse price than set by the stop level. This situation occurs because when the price touches the stop level, the order changes to a market order and is executed at the first available price.
  • Limit Order: A Limit Buy order is placed below the current price, whereas a Limit Sell order should be above the current price. Unlike stop orders, Limit orders are placed to get better fills than the current market’s price. But its execution is not guaranteed. However, when they are filled, they will at the same or better price than initially established.
  • Market If Touched (MIT) Order: this type of order is a combination of the limit with a stop order. In the case of a buy trade, an MIT order is placed at a price below the current level. In the case of a sell position, an MIT order is set above the current price. The MIT order seeks a desirable price by buying at declines and selling at rallies. In turn, MIT orders seek to ensure the order is filled at a price close to where the strategy identifies a desirable entry level. However, although MIT orders combine the best of both types, they are also subject to price slippage.

Opening Gap Slippage

Markets tend to have price gaps. Usually, a price gap happens from the current close to the next day’s opening. In most cases, this gap is not large enough to significantly impact the outcome of the strategy. However, there may be larger gaps caused by significant political or economic events, while markets are closed.

These high volatility situations can lead to large slippages, particularly on pending orders. Consequently, the strategist must consider the impact of this type of slippage on historical simulation results.

Slippage by Order Size

The size of the position has a proportional impact on the slippage. In other words, as the order size increases, the possibility of a higher slippage grows, since the order gets progressively filled at worse prices. In this case, the strategy developer should design a methodology to scale in and out trades to execute the desired total size with minimal slippage.

Conclusions

The slippage is a variable cost that cannot be avoided in the real market. It may not be significant in some cases, as on long-term strategies with fewer entry and exit orders.

However, it becomes more significant in high-frequency systems, characterized by being short-term and active. In this context, the developer must consider the effect of slippage and reflect it in the historical simulation process.

Finally, the strategist should not neglect the slippage impact since its presence can considerably reduce the profits a trading strategy can generate.

Suggested Readings

  • Jaekle, U., Tomasini, E.; Trading Systems: A New Approach to System Development and Portfolio Optimisation; Harriman House Ltd.; 1st Edition (2009).
  • Pardo, R.; The Evaluation and Optimization of Trading Strategies; John Wiley & Sons; 2nd Edition (2008).
Categories
Forex Signals

NZDUSD Develops a Three Descending Peaks Pattern

Description

The NZDUSD prices develop an incomplete corrective formation that suggests a new decline, which could complete a three-wave movement in the following trading sessions.

In its 4-hour chart, the kiwi illustrates a bearish move that the price started when topped at 0.67978, starting a corrective structure that remains in progress. The figure highlights the completion of waves A and B labeled in green. According to the Elliott wave theory, the NZDUSD pair should start to develop a downward wave C subdivided into five waves from its corrective sequence. In this context, the price could drop at least at 0.65165, which corresponds to the September 24th low.

On the other hand, from the chartist perspective, the last decline looks like a three descending peaks pattern, which suggests the continuation of the primary bearish move supporting the scenario of further falls.

The bearish scenario’s invalidation level locates above 0.6670, which coincides with the surpassing of the short-term bearish trendline identified in brown.

Chart

Trading Plan Summary


Check out the latest trading signals on the Forex Academy App for your mobile phone from the Android and iOS App Store.

Categories
Forex Education Forex System Design

Seeking Accuracy in the Historical Simulation

Introduction

A historical simulation may seem like a simple process to perform; however, it goes beyond creating trading rules and introducing them into the simulation software. Within the software itself, some limitations can diminish the accuracy of the results and, in this way, overestimate or underestimate the possible results that the strategy would achieve in the real market.

This educational article explores the importance of precision in the simulation process and some simulation software problems.

Importance of the Accuracy 

The developing process of a trading strategy that systematically creates trades can be tested on a historical simulation procedure with relative confidence and accuracy. However, like all software, it can be affected by precision and lead to errors, which can increase, especially when looking for a historical simulation.

In this regard, the developer should not rule out a possible error in the simulation software, nor can it leave to chance the computer simulation’s lack of precision, as this may drag unpleasant results to the investor. In consequence, the developer should address the software errors in the best possible way.

The developer must seek to make the simulation as realistic as possible to address the accuracy problem. To achieve the desired accuracy, the historical data exchange must be as close as possible to real-time executions.

Thus, according to Robert Pardo (2008), achieving greater accuracy in the historical simulation will require two things: understanding software limitations and using conservative assumptions about costs and slippage in their various forms.

Software Limitations

Ignorance of historical simulation software limitations can lead the developer to a false confidence sentiment or be overly pessimistic about the historical simulation results. The most common constraints are:

Rounding of Data

The absence of the actual market price for the use of data rounding may have a cumulative effect on market entry and exit orders, which could lead to a cumulative effect, both positive and negative, on the trading strategy’s performance.

The problem of rounding in the historical simulation may lead to recording orders that, on a real market, would not have been executed or orders that would have been executed in real-time but not recorded by the simulation. A second error is a recurring understatement or overstatement in the strategy’s profits due to rounding.

The developer must determine if the historical simulation results are consistent with its real market results.

Finally, rounding errors will significantly impact a strategy that seeks small profits per trade. On the contrary, the impact will be less on those strategies that are slower or longer-term.

Price on Limit Orders

This error is a recurring problem in simulation software, and, in particular, it is presented in counter-trending strategies, which use pending orders to enter the market. In other words, the countertrend strategy places a buy limit when the market is falling and a sell limit when it is developing a rally. Contrary to a stop order, the execution of the limit order is not guaranteed.

The problem arises when the developer performs the historical simulation, and the software assumes that all limit orders will be executed during the simulation. However, according to Perry Kaufman (1995), up to 30% of all limit orders are not filled.

Faced with this problem, the strategy developer must define a security level to ensure that the order will be filled, increasing the probability of execution in the real market. This additional rule might consider that the price penetrates an additional distance to consider the order as executed.

Finally, this rule will not necessarily ensure that all limit orders will be executed; however, it will produce a more realistic approach to the simulation process.

Conclusions

The historical simulation process may present some problems generated by the code that the developer should be aware of. These inaccuracies can create false confidence by overestimating the results or drive it to be too pessimistic due to underperformance. These problems are mainly price rounding and limit-order executions.

In the first case, price rounding may induce the simulation software to execute input or output orders at levels other than those filled in the real market. To overcome this limitation, the developer must verify whether the strategy’s results are the same as the strategy would obtain in the real market.

The second error arises from counter-trend systems making use of limit orders. In this case, the developer must consider that not all limit orders are filled in the real market. Thus, the simulation could lead to overestimating the strategy’s results, creating a false optimism of the obtained performance. To mitigate this problem, the developer could introduce an additional requirement of an extra distance that the price should penetrate for the limit order to be executed.

Finally, in view that historical simulation software has limitations, the strategy developer should verify whether the simulation results are similar to those obtained in the real market.

Suggested Readings

  • Pardo, R.; The Evaluation and Optimization of Trading Strategies; John Wiley & Sons; 2nd Edition (2008).
  • Kaufman, P.J.; Smarter Trading – Improving Performance in Changing Markets; McGraw Hill; 1st Edition (1995).
Categories
Forex Signals

EURGBP Unveils an Engulfing Candle Pattern

Description

The EURGBP cross, in its 4-hour chart, illustrates a downward corrective sequence that seems to be ending. The engulfing candle pattern in the first trading session of the week unveils the possibility of a new rally.

The big picture reveals an impulsive movement developed since early September at 0.88685; this move ended on September 11th, when the price topped at 0.92212. Once the price found resistance, the cross started to develop a retrace as a descending wedge pattern. This chartist formation calls for the continuation of the previous upward impulsive move.

The engulfing candle formation suggests the possibility of a bullish side positioning at 0.90634 (or better) with a potential profit target at 0.9148, which corresponds to the nearest resistance zone from where the price could start to consolidate.

A second option is to maintain the trade looking for the AB=CD pattern completion, with a potential profit target located at 0.94329.

The invalidation level locates below the intraday low at 0.90224.

Chart

Trading Plan Summary

Check out the latest trading signals on the Forex Academy App for your mobile phone from the Android and iOS App Store.

Categories
Forex Elliott Wave Forex Market Analysis

Silver Unveils an Incomplete Corrective Structure

Overview

Silver price advances in an incomplete corrective structure that remains in progress, after the precious metal topped at its highest level since March 2013. The market sentiment continues dominated by the bullish side. Nevertheless, the incomplete Elliott wave structure suggests that the precious metal could see a new low.

Market Sentiment Overview

The Silver price continues fading from the yearly highs that carried the price toward annual highs at $29.85 per ounce in early August. However, the precious metal eases over 19% from the yearly high, Silver advances 35.2% (YTD).

The following daily chart displays the Silver’s 52-week high and low range. The figure highlights the consolidation of Silver below $25.30 per ounce and the price action running below the 60-day weighted moving average. This market context suggests that the precious metal traders downgraded their market sentiment from extremely bullish to bullish.

On the other hand, according to the Commitment of Traders report, it is observed that the big participants’ speculative net positions remain on the bullish side. In this context, the descents developed by precious metal suggest that market participants are involved in a take-profit activity and do not represent a change in the current upward trend.

Therefore, in the long-term overview, the market sentiment remains bullish. Nevertheless, in the short-term, the declines observed represent a taking profit activity. Finally, as long as there is no confirmation of new signs of a new rally, our bias remains on the neutral side.

Elliott Wave Outlook

The next chart illustrates Silver in its log-scale 8-hour timeframe, which reveals the price action is developing the last move of a cycle, which began on March 18th when the precious metal found fresh buyers at $11.61 per ounce. The incorporation of new buyers drove the precious metal to a bullish impulsive structure development completed on August 06th when Silver reached $29.86 per ounce.

Once Silver prices found resistance at $29.86, it completed a five-wave sequence of Minute degree identified in black. Simultaneously, according to the price fractality principle, Silver finished the first wave of Minor degree labeled in green.

According to the Elliott Wave Theory, once completed the five-wave impulsive sequence, the price reacts in the opposite direction developing a three-wave movement. From the previous chart, Silver reveals that its corrective structure is incomplete.

In particular, the precious metal advances in its wave ((c)) of Minute degree identified in black. In turn, the internal structure of the wave ((c)) has pending the bearish movement of the wave (v) of the Minuette degree identified in blue. The last move will likely re-test the descending channel’s base, dropping between $21.35 and $19.44 per ounce.

Once Silver completes the bearish five-wave sequence of wave ((c)), traders may start looking for positioning alternatives on the bullish side. Finally, considering that wave 1 of Minor degree presents an extended wave’s characteristics, wave 3 of the same degree should not be the largest wave of the impulsive sequence of Minor degree.

In short, Silver’s market sentiment remains on the bullish side; however, the price moves in an incomplete corrective structure that could lead to new price lows. Once the short-term bearish sequence is completed, Silver could start producing entry signals on the bullish side, corresponding to the primary trend.

Categories
Forex Market Analysis

US Dollar Index Consolidates Expecting Further Declines

Overview

The U.S. Dollar Index (DXY) develops a mid-term sideways formation inside a long-term bearish trend that looks incomplete. During this year, the Greenback sheds -4.31% (YTD). Although the positive inflation data expanded the price in Tuesday’s trading session, it was not enough to boost the price toward fresh highs.

Market Sentiment Overview

The U.S. Dollar Index (DXY) retreats 0.23% in Wednesday’s trading session by erasing the advance that the Greenback made on Tuesday, driven by inflation data, which exceeded surveyed analysts’ expectations reaching 1.4% (YoY).

Although the data released by the U.S. Bureau of Labor Statistics this Tuesday exceeded the expectations of market participants and Federal Reserve policymakers boosting the price to climb 0.53%, the reading observed would not have a greater impact on the rate decision of the next FOMC broad meeting. Still, it would be more focused on the evolution of the labor market.

The following chart illustrates the U.S. Dollar Index in its 12-hour timeframe. The figure exposes the 90-days high and low range, reflecting that the market participants’ sentiment remains on the extreme bearish side. The price action remains below the 200-period weighted moving average, confirming the bearish sentiment.

On the other hand, the last Commitment of Traders Report unveils institutional traders’ bearish bias, confirming the bearish sentiment exhibited by the U.S. Dollar Index.

Therefore, according to the Federal Reserve policymakers’ expectations, the labor market’s evolution could be a factor contributing to the U.S. Dollar Index volatility increase. On the other hand, as long as the price remains below 94.02 pts and below the 200-period average, the Greenback bias will remain on the extreme bearish side.

Technical Analysis Outlook

The U.S. Dollar Index, in its 4-hour chart, illustrates a sideways movement from a long-term bearish sequence, which seems to be incomplete. The mid-term sideways structure is limited by September 01st low of 91.75 pts, with a top of the sideways range at the level reached on September 25th, located at 94.74 pts.

The above figure shows that the mid-term trading range moves between 91.75 pts and 94.82 pts. This market context suggests that the currencies included in the U.S. Dollar Index basket might continue developing sideways movements in the coming trading sessions.

On the other hand, the Elliott Wave perspective overview reveals that the price developed a three-wave bullish movement from the September 01st low of 91.75 pts, which ended on 94.74 pts.

Currently, the DXY index develops a pause formation in a bearish sequence that could evolve in three waves. This consolidation structure identified as wave ((b)) in black is still in progress.

Accordingly, the U.S. Dollar Index should complete the consolidation movement identified by the short-term sideways channel before continuing with its mid-term bearish trend.

Categories
Forex Market Analysis

Russell 2000’s advance Boosted by Stimulus Talks

Overview

The Russell 2000 index, grouping the 2,000 U.S. small-cap companies, began this trading week, maintaining its previous week’s gains driven by the economic stimulus talks. The price action continues supporting fresh highs that could lead Russell 2000 to erase its yearly losses.

Market Sentiment Overview

The US benchmark that groups the 2000 small-cap companies continues its recovery, reaching new highs, soaring to 1,649.05 pts in the first trading session of the week. 

After President Trump’s return to the White House activities, the investor sentiment is driven by negotiations about a new economic stimulus. In this context, market participants seem to be buying the rumor of further stimulus for the economy before the presidential elections that will take place on November 03rd.

The chart below shows the 52-week high and low range of Russell 2000, in which the price action unveils the advance in the extreme bullish sentiment zone. In turn, Russell 2000 continues developing its action above the 60-day short-term moving average, following the direction and the dominant bullish sentiment in the American stock market. 

In the previous chart,  we observe that the bullish momentum maintained by Russell 2000 could exceed the annual opening value of 1,672.13 pts. In this process, the US small-cap index could erase all of the losses originated by the massive sell-off that happened in the second half of February.

On the other hand, the next figure corresponds to the Russell 2000 Volatility Index (RVX) in its daily timeframe, highlighting the bearish breakdown from the sideways range maintained since September 21st. This breakdown led the RVX to re-enter the extreme bearish zone, supporting the extreme bullish sentiment of Russell 2000.

Consequently, the market sentiment context for Russell 2000 continues to favor bullish movements that could go as far as the approval of the new economic stimulus or until the US presidential elections.

Technical Analysis Outlook

From a technical analysis perspective, The Russell 2000 in its 12-hour chart shows an upward movement that began on March 23rd when the price confirmed the floor of mass selling at 963.62 pts, which remains valid.

The previous chart unveils the mid-term bullish sequence, which started on June 14th at 1.316.42 pts. The upward movement developed by Russell 2000 is projecting an ascending channel in which the price is seen striking the channel’s upper line. This context points to a limited correction before continuing the short-term bullish trend.

On the other hand, the 94.62% level observed in the stochastic oscillator shows the Russel 2000 overbought; in turn, considering it as a timing indicator, it shows that it is not a suitable option for bullish entries under this circumstances.

The following 4-hour of the Russell 2000 shows the short-term trading zones at which bullish bias prevails. In this context, the bullish continuity, which would be confirmed after the break of the mid-term ascending channel’s upper line, has as key resistance levels 1,670.05 and 1,713.61 pts. A drop and close below the low of the week 1,633.94 pts could lead the price towards the following areas; 1,608.00 to 1,566.77 pts.

In conclusion, Russell 2000 holds its upward pressure; the market sentiment and price action continue to show further increases. Nevertheless, the extreme bullish sentiment backed by the news media created a market participants’ consensus, which assumes that the stock market will continue rallying with the economic stimulus approval. Thus, our bias remains on the neutral side.

Categories
Forex System Design

How to Read a Simulation Report

Introduction

When the developer performs the trading strategy design, it evaluates through a historical simulation process to overview its results under certain conditions. However, once finished the simulation, the software delivers a series of data that could confuse the developer with a broad kind of information provided by the report.

In this educational article, we will present the main elements of the historical simulation report.

Essential Data of the Historical Simulation Report

Within the wide variety of platforms that allow historical simulations, there is a set of essential data that the software provides at the end of the simulation process. These data are grouped into three large blocks: Performance Summary, Equity Chart, and Trades List.

The following figure shows the example of a report of a historical simulation performed in Strategy Tester of MetaTrader 4.

The report presents three blocks, which are detailed as follows.

Performance Data Summary

This section provides summarized statistical data from the historical simulation of the trading strategy. The key performance indicators are as follows:

  • Total Net Profit: This is the financial result of all trades executed during the simulation period. This value corresponds to the difference between the “Gross Profit” and the “Gross Loss.” A reading above zero is indicative of a trading strategy with positive mathematical expectation.
  • Maximal Drawdown: This is the highest local maximum loss expressed in the deposit currency and percentage of the deposit. In general terms, this value should be as low as possible. The criterion of maximum permissible drawdown will depend on the risk target of the trading strategy developer.
  • Total Trades: Corresponds to the total number of trades executed during the historical simulation. The developer might consider this value to assess the level of aggressiveness of the strategy. Also, it can use it to value the strategy in terms of its operational costs. For example, a strategy with a high number of trades could be more aggressive for a conservative investor. In turn, it implies a high operational cost in terms of paying commissions.
  • Percentage of Trades Winners: This is the number of profitable trading positions divided by the total number of positions. 
  • Profit Factor: This is the relationship between Gross Profit and Gross Loss. A reading lower than 1 suggests that the strategy generates more losses than gains. On the contrary, if it is greater than 1, then the strategy provides more profit than losses for each currency unit invested.
  • Sharpe Ratio: Some historical simulation platforms of trading strategies provide the Sharpe Ratio. This indicator represents the expected return on a risk-adjusted investment of an asset. In general, investors tend to consider as risk-free return the rate of the United States Treasury bond. A reading of less than 1 suggests that the trading strategy provides more volatile results. In other words, the developer could assume that the trading system is riskier than another with a ratio greater than 1.

Balance Curve

The balance curve chart presents the cumulative result of the trading strategy using a line chart. The information provided in this chart represents the result of the strategy execution under conditions and parameters in which the developer carried out the historical simulation.

Considering the investor’s objectives, the developer could improve its performance by optimizing the initial parameters.

List of Trades

This section of the report shows in detail each trade that the strategy performed during the simulation period. This list usually shows the following data:

  • Date of entry.
  • Type of order (buy, sell).
  • Entry price.
  • Size of the position.
  • Date of close.
  • Closing price.
  • Profit or loss of the trade.
  • Profits and losses accumulated or Balance.


Conclusions

The historical simulation process provides an overview of trading strategy behavior according to the developer’s parameters initially defined. This information is reflected in the simulation report, which provides a wide variety of information about the strategy’s performance under predetermined conditions.

Within the information provided at the end of the historical simulation, there are key data that the developer should not fail to value these are: Total Net Profit, Maximal Drawdown, Total Trades, Percentage of Trades Winners, Profit Factor, and Sharpe Ratio, which some simulation software does not provide it. However, the lack of availability of this data is not a limitation for assessing the strategy’s performance but will depend greatly on the criteria and experience of the developer of the trading strategy.

The developer can use this information to confirm that the trading strategy is proceeding as specified initially. Also, it can use this data to understand the strategy’s behavior during each trade.

This information is also important to spot potential improvements in the strategy. For instance, you could detect that several large losses may be trimmed with a better stop-loss replacement. You could also find out that a good portion of the trades was closed at a less than optimal level. The developer may conclude that the system would greatly improve with a better take-profit algorithm.

Also, the information gathered from the simulation may help improve the entries. For instance, you could find out that there are large losses at the beginning of the trade most of the time. That could signal the entries flag too quickly, or you may notice that the strategy would benefit from early entries to improve profits.

Finally, according to the developer’s objectives and the information analysis, the developer could attempt to adjust and optimize the needed parameters that could improve the strategy’s performance.

Suggested Readings

  • Pardo, R.; The Evaluation and Optimization of Trading Strategies; John Wiley & Sons; 2nd Edition (2008).


Categories
Forex Education

Getting Started with your First Historical Simulation

Introduction

In the previous section, we learned the steps to create a trading strategy. At this stage of the trading strategy development, we will focus on the strategy’s simulation process using historical data.

What is the Historical Simulation?

The simulation is defined as a mathematical representation that describes a system or process, making it possible to generate forecasts of such a system.

As the years have advanced, computational technologies have evolved to allow many processes simultaneously performed.  Compared to what a processor could do 40 years ago, a mere smartphone outruns any of them. In this context, the trading strategies simulation has also done so, moving from the simulation using printed paper charts to the current computer systems we observe today.

By running a historical simulation on a trading strategy, the developer should be able to estimate the gains and losses the strategy would have generated under historic market conditions within a given period.

However, while the benefit of executing a historical simulation enables one to estimate the profits and losses and whether the strategy is profitable or not, this statement should be analyzed by the developer throughout the trading strategy developing process.

Getting Started

Once the developer has completed a trading strategy, including entry and exit rules, as well as the definition of risk management and position sizing, it is necessary to formulate the rules of the strategy using a computer language. This way, the trading simulation software will execute the rules algorithm and apply it to the study’s financial dataset.

Several programming languages are able to carry out the trading strategy simulation, such as MQL4 of MetaTrader, Easy Language of Trade Station, or Python. However, for this educational article, we will continue to use the MetaTrader MQL4 language.

First Steps in the Simulator

MetaTrader 4 offers its Strategy Tester to simulate trading strategies. In the following figure, we observe the Strategy Tester terminal, in which we can develop a historical simulation of any trading strategy under study. 

The figure highlights that Strategy Tester has a user-friendly and intuitive interface for the developer, who can select the Expert Advisor that will contain the trading strategy to simulate. Similarly, the user can choose both the financial market, the timeframe, and the date span in which the simulation should run.

Running the First Simulation in Strategy Tester

In this example, we will continue using a moving-average-crossover-based trading strategy. To recap, this strategy is based on the following rules:

  • A buy position will be opened when the 5-hour weighted moving average (LWMA) crosses above the 55-hour simple moving average (SMA). 
  • A sell position will be activated when the 5-hour LWMA crosses below the 55-hour SMA.
  • The buy position will be closed when the LWMA 5-hour has crossed below the SMA 20-hour.
  • The sell position will be closed when the LWMA 5-hour has crossed over the SMA 20-hour.
  • The position sizing will be a constant 0.1-lot.
  • Only one trade at a time is allowed.

The criteria for the execution of the historical simulation are as follows:

  • Market to simulate: GBPUSD pair.
  • Timeframe: 1 hour.
  • Simulation range: from January/02/2014 to October/02/2020.

From the simulation’s execution, we observe the following result provided by the Strategy Tester at the end of the simulation.

From the above figure, we note that the balance line was reduced by $2,230.63 from the initial balance of $10,000, reaching a final balance of $7,769.37. This result leads us to conclude that the average-crossover strategy is not profitable. However, this is just a preliminary result.  It is still possible that we could make this strategy profitable through an optimization process, where we will assess what parameter values perform the best.  We could also add stop-loss and take-profit targets that statistically boost the system into profitable territory.

Conclusions

In this educational article, we have seen the first steps to perform a historical simulation. This process provides the developer with an overview of the strategy’s performance in a given financial market under certain conditions. We highlight that the performance conditions could repeat in the future. For this reason, once evaluated the strategy feasibility in terms of profitability, the developer should test the trading strategy during a specific period with paper money in real-time.

On the other hand, the profitable or non-profitable result is just a snapshot of the strategy’s performance. During the optimization process, the developer will investigate the parameters that provide higher profitability or lower risk for the investor.

The next educational article will review the simulator’s information in detail once the historical simulation has been executed.

Suggested Readings

  • Jaekle, U., Tomasini, E.; Trading Systems: A New Approach to System Development and Portfolio Optimisation; Harriman House Ltd.; 1st Edition (2009).
  • Pardo, R.; The Evaluation and Optimization of Trading Strategies; John Wiley & Sons; 2nd Edition (2008).
Categories
Forex Market Analysis

How Elliott Wave View of NASDAQ Anticipates Trump’s Coronavirus Outcome

Overview

The NASDAQ 100 Index fell 2.2 percent on Friday’s trading session on the news of the US President Donald Trump’s positive coronavirus test. Still, the price action unveiled the wave B completion, suggests further declines for the US technologic benchmark in the following trading sessions.

Market Sentiment Overview

During the last trading week, the NASDAQ 100 volatility has been driven by market participants’ expectations facing the first presidential debate between US President Donald Trump and former Vice President Joe Biden.

The advance experienced by the technology index was boosted by the expectation of new economic stimulus, driving the NASDAQ 100 to raise over 4%. However, its gains were lowered after the announcement of President Trump’s positive Coronavirus test, leading it to ease up to 2.74% on Friday’s trading session.

The following 8-hour chart of NASDAQ 100 reflects the 90 days high and low range. In the figure, we distinguish that the price halted its advance towards the extreme bullish sentiment zone, closing the trading week in the bullish market sentiment area and under the weighted 200-day moving average. This market context leads us to weight a neutral market sentiment.

On the other hand, the 12-hour chart corresponding to the NASDAQ 100 Volatility Index shows the 90 days high and low range where we distinguish a sideways movement consolidating above the 200-period weighted moving average. This volatility context of the NASDAQ 100 index, added to the new test of the upper-line of the consolidation structure, leads us to expect an increase in volatility within the coming trading sessions.

Summarizing, NASDAQ 100’s market sentiment unveils that this index and its volatility figures will be driven by the news on the upcoming presidential elections on Tuesday, November 03. In particular, NASDAQ 100 could turn bearish in the following trading sessions.

Elliott Wave Outlook

The overview of NASDAQ 100 shows the full development of a five-wave bullish sequence, which began on June 15, when the price found fresh buyers at 9,383.6 pts pushing the price towards new record highs September 02 at 12,466.6 pts. Once reached the all-time high, the technological index began to perform a bearish corrective movement, which remains in progress.

The following chart shows the NASDAQ 100 in its 4-hour timeframe, where we distinguish that the price has completed a five-wave impulsive structure of Minor degree labeled green. At the same time, we can confirm that the Elliott wave theory rule, stating that there must be only one extended wave. In this case, the NASDAQ 100 index developed a fifth extended wave that ended on September 02 when the price found resistance at 12,466.6 pts. Once the fifth wave of Minor degree concluded, the NASDAQ 100 began performing a corrective sequence, which remains in progress.

In particular, the completion of the wave ((c)) of Minute degree identified in black, which completed the wave B of Minor degree, coincided with the news media release concerning the US President Trump’s positive test, activating the beginning of the wave C, labeled in green.

The following hourly chart of NASDAQ 100 illustrates the first bearish movement’s internal structure corresponding to its wave (i) of the Minuette degree identified in blue. This first downward wave reveals a drop in five moves of Subminuette degree identified in green in its internal formation. Once this second move has been completed, the technological benchmark should resume its declines.

Finally, considering that wave (i) of Minuette degree completed its descending move at 11,220.8 pts on Friday 02nd, the price could retrace, forming its second wave of the same degree. In terms of the Dow Theory, this retrace could be between 33% and 66%, or between the 11,352.3 pts and 11,483.7 pts, where NASDAQ 100 might start to develop a new decline, corresponding to wave (iii) in blue.

Categories
Forex Market Analysis

DAX 30 Unveils Exhaustion Signals

Overview

The German DAX 30 index, which groups together the 30 most capitalized companies in Germany, shows signs of exhaustion after the rally it developed since the second half of March this year. Likewise, the Elliott wave theory’s perspective reflects the exhaustion of the bullish impulsive movement, which may be advancing in the last impulsive wave of Primary degree.

Market Sentiment Overview

The German benchmark DAX 30 shows a pause in its upward trend, consolidating the rebound that the price has been developing since March 19th when the German index found support in the yearly low located at 7,957.6 pts. Since this bottom zone, DAX 30 has advanced over 60% to date; however, this year the benchmark eases over 2.75% (YTD).

The following daily chart of the German index shows the price action running in the zone of extreme bullish sentiment. However, the shift in price below the 60-day weighted moving average reveals that it could be starting to develop a new short-term corrective process. 

Although the DAX 30 remains in the zone of extreme bullish sentiment, our market bias continues being neutral as long as the likely corrective movement is not confirmed.

Elliott Wave Outlook

The DAX 30 index overview shows a bullish impulsive sequence that looks incomplete. This five-wave structural series that began in early March 2009 currently moves in a consolidation phase, showing exhaustion signals.

In its log-scale weekly chart, the DAX 30 reveals the price moving in a possible fifth bullish wave of Primary degree identified in black. At the same time, we note that the German benchmark had developed a third wave extended of Primary degree.

According to Elliott wave theory, in an impulsive structure, there can only be one extended wave. In this context, and based on the price development formed by DAX 30, we can recognize the movement of five internal impulsive waves of Intermediate degree labeled in blue within the third wave of Primary degree. This bullish movement ended in the second half of January 2018 when DAX climbed until 13,602 pts.

On the other hand, the alternation principle between corrective waves is recognized to happen between the second and fourth waves. While the second wave performed a corrective movement that took 133 days, the fourth wave was developed in 784 days.

As for the fifth wave’s potential completion, there is still no evidence to confirm this completion. On the one hand, according to Elliott wave theory, when in an impulsive sequence, the third wave is extended, it is highly likely that the fifth wave will fail in its attempt to reach new peaks.

On the other hand, we recognize that there is no confirmation of the fulfillment of the criterion of similarity in price, time, or both between the first and fifth wave. In other words, while the first wave advanced 4,024 pts in just over two years, the fifth wave, which started in the second half of March 2020,  has grown about 5,500 pts in barely six months.

To conclude, the overall market sentiment seems to have shifted from the extreme bullish to neutral. Furthermore, the market structure shows the progress fifth wave of Primary degree progress, giving exhaustion signals. Thus, our bias for the German DAX 30 index continues being neutral.

Categories
Forex Daily Topic Forex System Design

Designing a Trading Strategy – Part 5

Introduction

In a previous article, we presented the effect of incorporating additional rules in a trading strategy during the design process. In particular, we intuitively proposed a rule that opens a position using a size considering a percentage level of equity in the trading account.

In this educational article, corresponding to the last part of the series dedicated to designing trading strategies, we will expand position sizing concepts.

Position Sizing

The determination of the position size in each trade corresponds to the third element of a trading strategy. This decision will determine the capital that the investor will risk in each trade.

The position sizing corresponds to the volume committed in each trade. This volume can be the number of contracts, shares, lots, or another unit associated with the asset to be traded. The complexity of the position sizing is based on the efficient determination of the position to ensure maximum profitability with an acceptable risk level for the investor.

Programming the Position Sizing

To visualize the difference between some methods of position sizing, we will apply the criteria to the strategy of crossing moving averages analyzed in previous articles:

Fixed Size: This method is probably the most typical when developing a trading strategy. The rule consists of applying a fixed volume per trade. For example, consider the position size of 0.1 lot per trade, the code for our strategy is as follows:

extern double TradeSize = 0.1;

   //Open Buy Order, instant signal is tested first
   if(Cross(0, iMA(NULL, PERIOD_CURRENT, Period1, 0, MODE_LWMA, PRICE_CLOSE, 0) >
 iMA(NULL, PERIOD_CURRENT, Period2, 0, MODE_SMA, PRICE_CLOSE, 0))
 //Moving Average crosses above Moving Average
   )
     {
      RefreshRates();
      price = Ask;
      SL = SL_Pips * myPoint; //Stop Loss = value in points (relative to price)   
      if(IsTradeAllowed())
        {
         ticket = myOrderSend(OP_BUY, price, TradeSize, "");
         if(ticket <= 0) return;
        }
      else //not autotrading => only send alert
         myAlert("order", "");
      myOrderModifyRel(ticket, SL, 0);
     }
   
   //Open Sell Order, instant signal is tested first
   if(Cross(1, iMA(NULL, PERIOD_CURRENT, Period1, 0, MODE_LWMA, PRICE_CLOSE, 0) <
 iMA(NULL, PERIOD_CURRENT, Period2, 0, MODE_SMA, PRICE_CLOSE, 0))
 //Moving Average crosses below Moving Average
   )
     {
      RefreshRates();
      price = Bid;
      SL = SL_Pips * myPoint; //Stop Loss = value in points (relative to price)   
      if(IsTradeAllowed())
        {
         ticket = myOrderSend(OP_SELL, price, TradeSize, "");
         if(ticket <= 0) return;
        }
      else //not autotrading => only send alert
         myAlert("order", "");
      myOrderModifyRel(ticket, SL, 0);

Percentage of Risk per Trade: this criterion considers the account’s size given the account’s capital and estimates the stop loss distance needed to execute the trade according to the devised strategy. The common practice is to risk 1% of the equity currently available in the trading account. In this case, the implementation of the strategy is as follows:

double MM_Percent = 1;
double MM_Size(double SL) //Risk % per trade, SL = relative Stop Loss to
 calculate risk
  {
   double MaxLot = MarketInfo(Symbol(), MODE_MAXLOT);
   double MinLot = MarketInfo(Symbol(), MODE_MINLOT);
   double tickvalue = MarketInfo(Symbol(), MODE_TICKVALUE);
   double ticksize = MarketInfo(Symbol(), MODE_TICKSIZE);
   double lots = MM_Percent * 1.0 / 100 * AccountBalance() /
 (SL / ticksize * tickvalue);
   if(lots > MaxLot) lots = MaxLot;
   if(lots < MinLot) lots = MinLot;
   return(lots);
  }

Position Sizing to Equity: this method executes the trading order according to the trading account’s equity. For example, the developer could place one lot per $100,000 in the trading account. This method will increase or reduce each transaction’s volume as the capital of the trading account evolves.

extern double MM_PositionSizing = 100000;
double MM_Size() //position sizing
  {
   double MaxLot = MarketInfo(Symbol(), MODE_MAXLOT);
   double MinLot = MarketInfo(Symbol(), MODE_MINLOT);
   double lots = AccountBalance() / MM_PositionSizing;
   if(lots > MaxLot) lots = MaxLot;
   if(lots < MinLot) lots = MinLot;
   return(lots);
  }

There are other methods, such as martingale and anti-martingale, discussed in a forthcoming educational article. For now, we present your definition.

  • Martingale: this rule is based on the money management of gambling. This method doubles the position size after each losing trade and starts at one position after each win. This method is extremely dangerous and should be avoided.
  • Anti-Martingale: this method opposes martingale, that is, doubles the position size after each winning trade and starts with a position after a losing trade. This method plays with what the trader considers to be “market’s money.” It is advisable to reset the size after a determined number of steps since the logic bets on a winning streak, which will end at some point. A 3-step is good enough to increase profits substantially. 4-step may be an absolute maximum on most trading strategies.

Conclusions

Position sizing is one of the critical decisions that the trading strategy developer must make. This choice will influence both the trading account’s growth and the capital risk to be exposed in each trade.

On the other hand, we have seen three examples of position sizing, representing a criteria guide that the trading strategy developer can use.

Finally, the developer of the trading strategy should explore and evaluate which is the best option of position sizing to use, taking into account the benefits of each of the impacts on the strategy’s execution.

Suggested Readings

  • Jaekle, U., Tomasini, E.; Trading Systems: A New Approach to System Development and Portfolio Optimisation; Harriman House Ltd.; 1st Edition (2009).
  • Pardo, R.; The Evaluation and Optimization of Trading Strategies; John Wiley & Sons; 2nd Edition (2008).
Categories
Forex Market Analysis

Dow Jones Moves Under Bearish Signals

Overview

The Dow Jones Industrial Average is developing a descending sequence that could drive the price to new lower lows. This bearish context occurs in the middle of the US presidential elections campaign, which will take place on November 03rd.

Market Sentiment Overview

The United States benchmark, led by the Dow Jones index, appears to be preparing for the presidential elections on November 3.

The short-term market sentiment exposed in the following 8-hour chart illustrates the price shift below the 200-day weighted moving average, which has turned from support to the next short-term resistance to struggle with.

On the other hand, we observe the 90-day high and low range, where the Industrial Average Index has found support in the neutral zone at over the 26,700 pts, where it bounced, being traded slightly bullish during the last Friday 25th session. This context, added to the shifting movement of the price and against its 200-day moving average, leads us to suspect that the Dow Jones Index could see a further drop within the next few sessions.

Concerning the volatility associated with the Industrial Average, expressed by the Dow Jones Volatility Index (VXD) on its daily chart, we distinguish that the action consolidates above the 60-day moving average. Likewise, VXD shows an increasing sequence of short-term lows, which provides a chance of a new bullish movement of the VXD in the short term.

In consequence, the market context leads us to expect a potential bearish movement for the Industrial Average. However, this scenario still needs to be confirmed by the price action.

Technical Analysis Outlook

From a technical analysis perspective, the Dow Jones Index in its 4-hour chart is showing a descending sequence that began once the price found resistance at 29,193.6 pts on September 03rd. Once the Industrial Average found fresh sellers, the downward pressure drove the price to a retracement till the 26,541 level, where the leading US benchmark found support and began to bounce back to the current trading levels.

On the other hand, in the previous figure, we distinguish the progress of a head and shoulders pattern, which has its neckline at the level of 27,457.5. The bearish breakdown developed during the September 21st trading session, and its subsequent pullback confirmed the bearish signal in the Industrial Average. In this regard, according to the head and shoulder pattern definition, this trend reversal formation has a pending bearish target located at 25,724 pts.

Similarly, if the price confirms a new lower high under the previous peak at 28,370.8 pts, it would confirm a bearish continuation pattern identified as three descending peaks, which would support the bearish scenario for Dow Jones.

In conclusion, our short-term perspective is mainly bearish as long as the price remains below 28,370.8 pts, with a bearish target established at 25,724 pts. The invalidation of our bearish scenario will occur if the Industrial Average consolidates above 28,370.8 pts.


Categories
Forex System Design

Designing a Trading Strategy – Part 4

Introduction

In our previous article, we presented diverse types of filters, which work as additional rules. We also showed how to incorporate these filters into a trading strategy so that they can help improve its performance. 

In this educational article, the fourth section of the series dedicated to developing a trading strategy, we will discuss the profit management.

Profit Management

Profit management is an aspect of risk management that characterizes by its high level of complexity. The difficulty lies in that profit management seeks to preserve the profits obtained during the trade and also to prevent a premature exit from a market that still moves in a trend not over yet.

There are two available methods with which the trading strategist may manage the profits realized in an opened position. These are the trailing stop and the profit target order.

Trailing Stop

This type of order is dynamic. It moves only in the same direction of the position as it moves in the direction of the trend. In other words, a trailing stop will move upward in a buy positioning and downward in a sell trade. 

Another characteristic of the trailing stop is that it steadily advances during the life of the trade. It will never retrace when the price develops a movement against the trade’s direction.

The trailing stop has two components, which are detailed as follows:

  • Trailing stop: corresponds to the number of pips in which the stop loss order will move once the price moves in the trade direction. For example, if an order has set a 40-pip stop-loss, and the price advances 30 pips in favor of the trend, the new stop-loss will shift to 10 pips below the opening price. In general, there are several ways to establish a trailing stop: by fixed pip variation and by volatility using the Average True Range (ATR) indicator, or using SAR (Stop and reverse) stops. 
  • Step: this corresponds to the variation in pips that the dynamic stop will move behind the price when it has been activated.

Profit Target Order

The second mechanism to manage profits is by using a profit target order. This type of order is conditioned to the prince advance to a predetermined level. Likewise, compared with the trailing stop case, this order is not affected by the price decrease. However, its activation is subjected to the price reaching a specific level.

 A profit target order can be set using a specific number of pips, by a multiple of the Average True Range (ATR), a percentage of price increase ( or decrease), specific levels of resistance or support, or a specific dollar gain.

Using the Trailing Stop in a Trading Strategy

This example illustrates the impact of using a trailing stop with a two moving averages crossover strategy, corresponding to LWMA(5) and SMA(55) periods using the EURUSD pair.

 We have evaluated the performance of a 40-pip trailing stop with a variable step from 1 to 15 pips. The results are as follows.

In the table above, we distinguish the impact on drawdown reduction with respect to the base scenario, after the incorporation of a trailing stop rule to the MA crossover strategy. The base case, on which the exit rule is the MA cross in the opposite direction to the opening of the position, exhibits a 22.66% drawdown. However, the addition of trailing stops led to a reduced 10.44% drawdown and a net profit of -525.88 (USD).

Each trailing stop step variation scenario, including the base exit scenario of the trading strategy, is shown in the following figure.

Finally, we observe that a 7-pip step provides the lowest losses. We also highlight that as the step increases, the drawdown also increases, confirming the growing losses.

Conclusions

The application of Profit Management represents a significant challenge for the developer of the trading strategy. This complexity arises due to a wide variety of combinations that can be used to ensure the strategy’s gains as each trade moves in the trend direction.

In this context, as we have seen, the parameter setting to be considered, the trailing stop, profit target orders, or its combination, should be carefully evaluated before applying them to the trading strategy, to ensure the optimal settings.

In the next educational article, we will present the fifth and last part of the series dedicated to developing trading strategies that will explain the position sizing process.

Suggested Readings

  • Jaekle, U., Tomasini, E.; Trading Systems: A New Approach to System Development and Portfolio Optimisation; Harriman House Ltd.; 1st Edition (2009).
  • Pardo, R.; The Evaluation and Optimization of Trading Strategies; John Wiley & Sons; 2nd Edition (2008).
Categories
Forex Market Analysis

Gold Still Under Bearish Pressure

Overview

Gold price eases over 4% during this week, dragged by the U.S. Dollar strength, which rallies nearly 1.5%. Considering the short-term structure observed on both the market sentiment and the Elliott wave outlook, the precious metal could experience further declines during the coming trading sessions.

Market Sentiment Overview

The price of Gold continues being dominated by selling pressure this week, driven by the U.S. Dollar strength, accumulating losses of over 4% in the week. However, during this year, the precious metal has advanced over 24% (YTD). 

The market sentiment shown in the weekly chart reveals a decrease in the bullish bias of market participants, who have shifted from extreme bullish sentiment until the past week to a bullish bias. Likewise, considering that the price action continues above the 26-week moving average, the mid-term trend continues being bullish.

Likewise, the wide-range weekly candle, still in progress, reveals the current control by the bearish-side participants. However, the rebound at $1,848.84 per ounce developed during the trading session on Thursday 24th, leads us to observe that the yellow metal could have found a short-term support level.

On the other hand, according to the latest reading unveiled in the Commitment of Traders Report, where the speculative net positioning reached 240,977 positions, reveals that the big participants still maintain their bias on the bullish side. Consequently, a massive sell-off could correspond mainly to the take-profit activity rather than to a reversal of the upward trend.

The volatility presented in the following daily chart corresponds to the Gold Volatility Index (GVZ) and shows the movement consolidating into a flag pattern. At the same time, the internal structure reveals an upward pressure, which is confirmed by its last close above the 60-day moving average. This the market context leads us to expect new increments in the precious metal volatility, and with it, further declines in the price of gold.

Under the market sentiment perspective, the big picture of the precious metal reveals that the long-term trend remains mostly bullish. However, the short-term bias suggests further declines.

Elliott Wave Outlook

The gold price on its 4-hour chart shows the progress of a corrective sequence, which began on August 06th when the price reached its all-time high at $2,075.14 per ounce. Once this record high was reached, the precious metal found sellers which currently are maintaining the price under pressure.

As said, after Gold was controlled by the sellers, the price began a corrective structure made by three waves of Minuette degree labeled in blue, which is currently developing its wave (c). In the figure, we distinguish that once the price closed below the base-line b-d of the triangle pattern, the yellow metal confirmed this wave (c) that remains in progress. The internal structure of the wave (c) unveils that Gold advances in its third wave of Subminuette degree identified in green.

According to the Elliott wave theory, the wave (c) follows an internal structure formed by five segments. In the previous chart, we see that the price moves in its wave iii labeled in green. Consequently, the precious metal should develop a consolidation sequence before dropping to a new lower low with a potential target zone between $1,802.56 and $1,744.76 per ounce.

Finally, the invalidation level of the current bearish scenario locates at $1,973.43 per ounce.

Categories
Forex Signals

NZDJPY Advances Boosted by Risk-On Sentiment

Description

The NZDJPY cross advances on Thursday trading session driven by the risk-on sentiment confirmed during the U.S. session opening, where the tech sector boosted the leading stocks indices. This bullish sentiment increases the possibility of a bounce in the commodity currencies.

The price of NZDJPY, exposed in its 15-minute chart, reveals the rejection of the bearish continuation once the price rebounded mainly bullish once it attempted to penetrate under the previous low of the current trading session located at 68,652.

On the other hand, from the sideways channel, we distinguish the possibility of activation of a double bottom pattern, leading to the price to strike the psychological barrier of 69.00, where the NZDJPY cross could start to find resistance.

Our bullish scenario foresees an escalation toward the level of 69.14, where the price could find intraday resistance. On the other hand, our upward scenario’s invalidation level locates below the baseline of the sideways channel at 68.59.

Chart

Trading Plan Summary


Check out the latest trading signals on the Forex Academy App for your mobile phone from the Android and iOS App Store.

Categories
Forex Education Forex Indicators Forex System Design

Designing a Trading Strategy – Part 3

Introduction

In our previous article, we presented the first component of a trading strategy, which corresponds to the market entry and exit rules. Likewise, we exposed the case of a basic trading system based on the crossing of two moving averages.

In this educational article, we will present the filters and how they can help the trader refine a trading strategy.

Setting Additional Filters in Trading Strategy

Signals originated in a trading strategy can use filters to improve the entry or exit signals that the system generates. The purpose of incorporating filters is to improve both the accuracy and reliability of the strategy. 

A filter can be an indicator’s level or additional instructions to the initial entry, or exit rules. Some examples of filters can be:

  1. Avoid buy entries if the reading of the 60-period RSI oscillator is less than 49. 
  2. Allow Buy entries if the price closes above the high of the previous day or allow sell-short signals if the price closes below the last day’s low.

Also, rules can be established to control the strategy’s risk, and preserve the trading account’s capital. In this context, two elements that can help to manage the risk are:

  1. Initial stop-loss, which can be a fixed amount of pips or depending on some previous periods’ volatility. In turn, this rule can be fixed or dynamic, its level moving as the trade progresses through time.
  2. limiting the number of simultaneously opened trades. This rule can be useful, mainly when the market moves in a sideways path.

Measuring the Risk of Strategy

The risk of trading strategy corresponds to the amount of capital that the investor risks with the expectation of a possible return on the financial market by applying a set of rules with positive expectations.

One way to measure the risk of trading strategy is through the maximum drawdown, which corresponds to the maximum drop in equity from the peak of the equity value to the subsequent equity low.

The developer can obtain this measure as well as other strategy performance indicators by running a historical simulation.

Incorporating Additional Rules into Trading Strategy

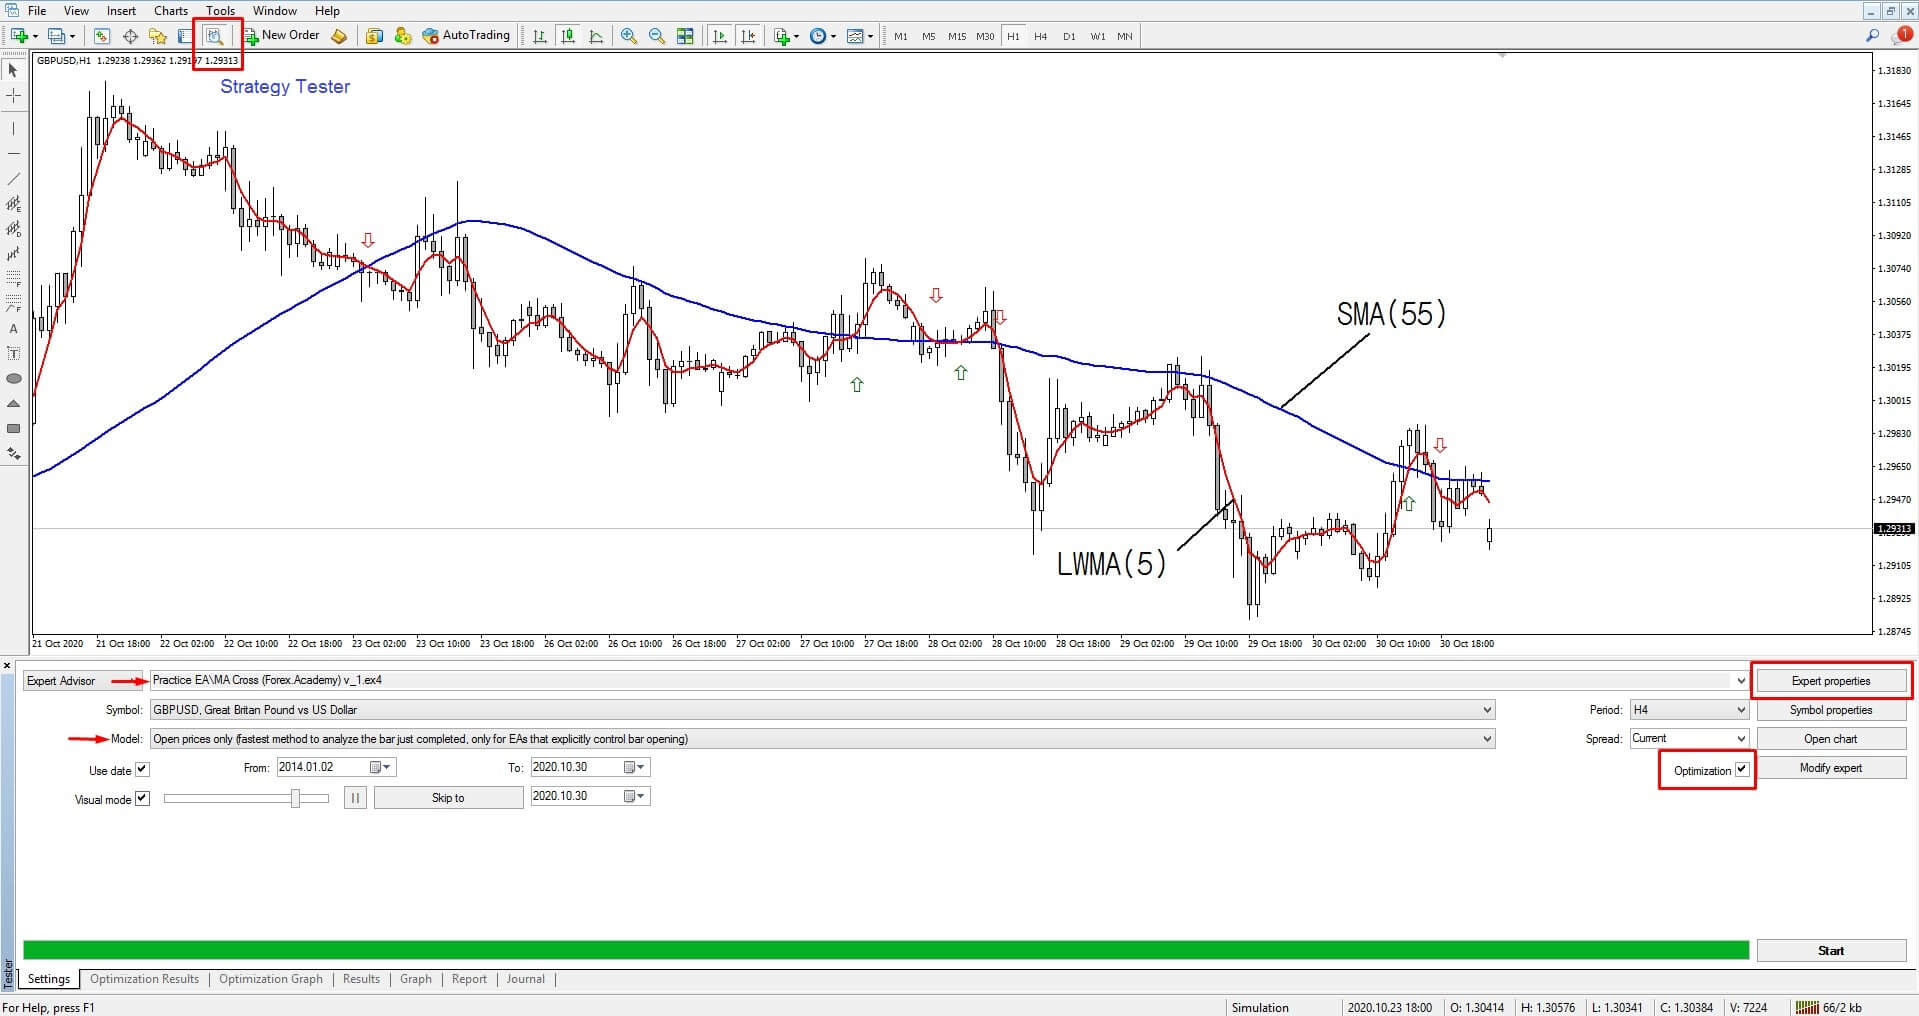
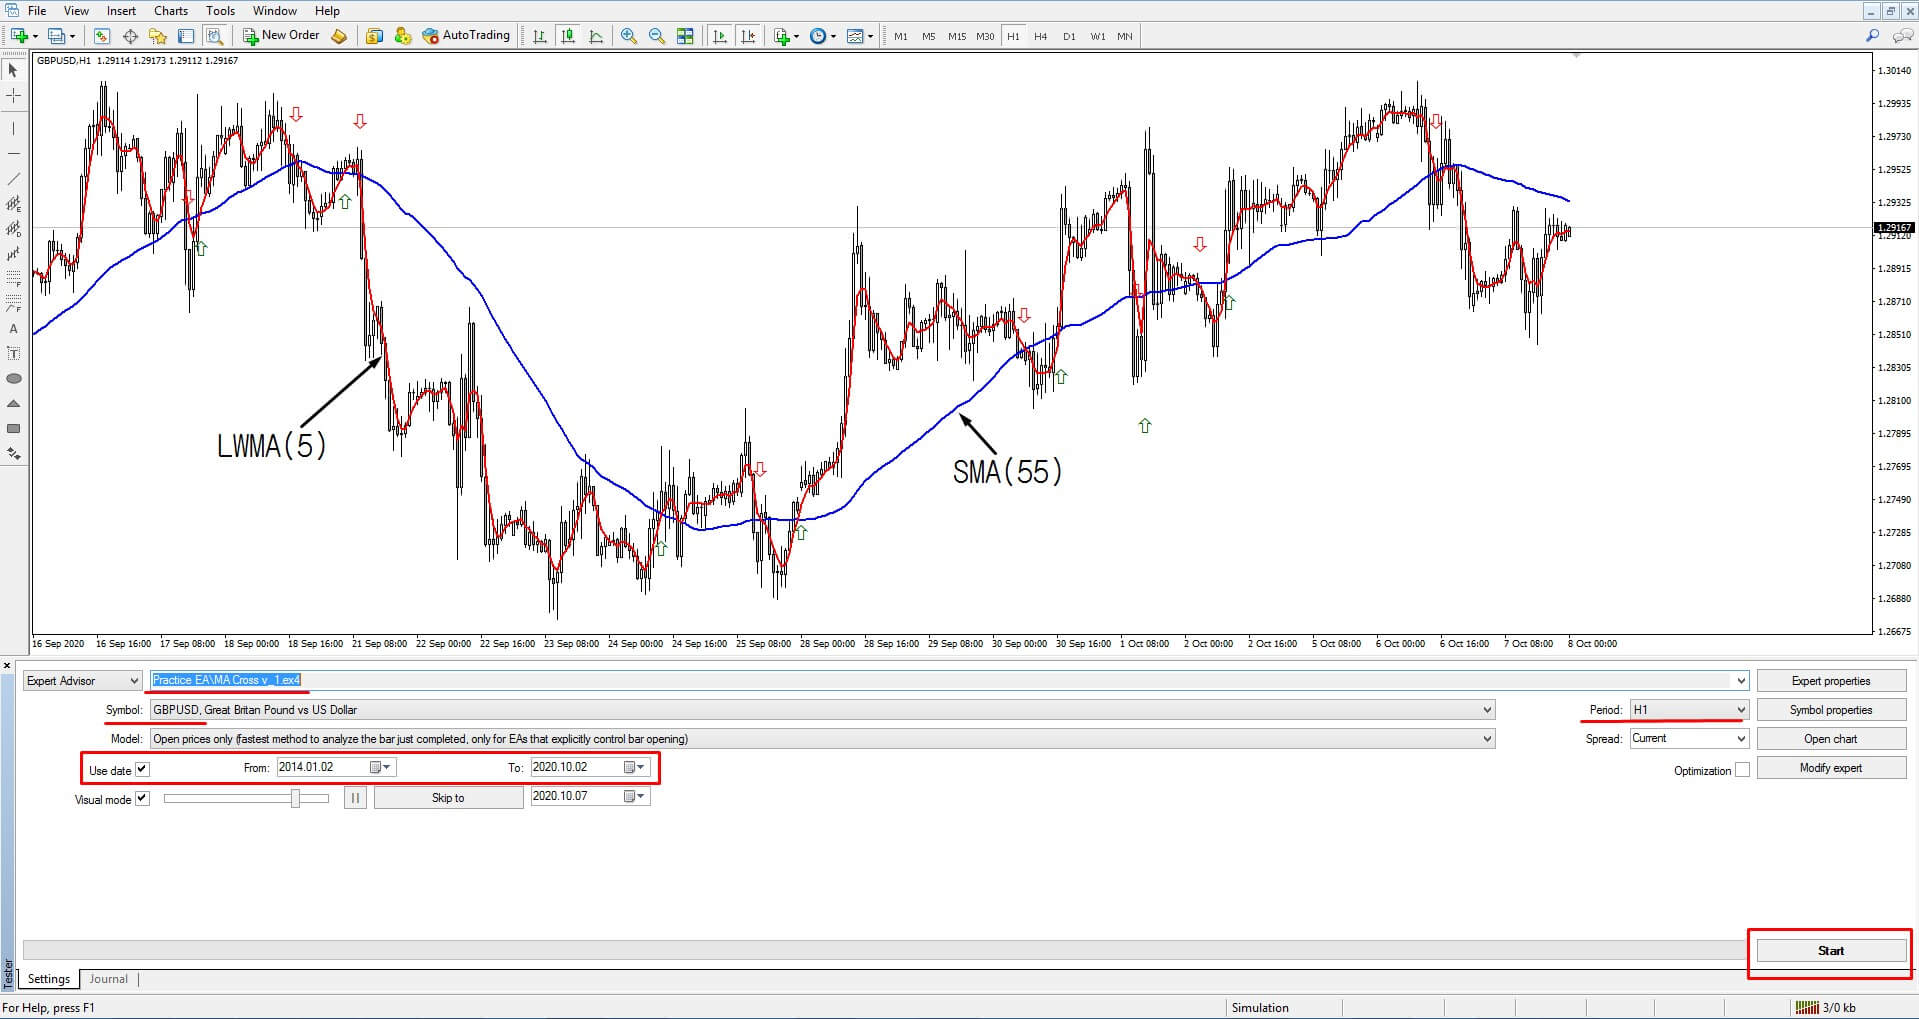
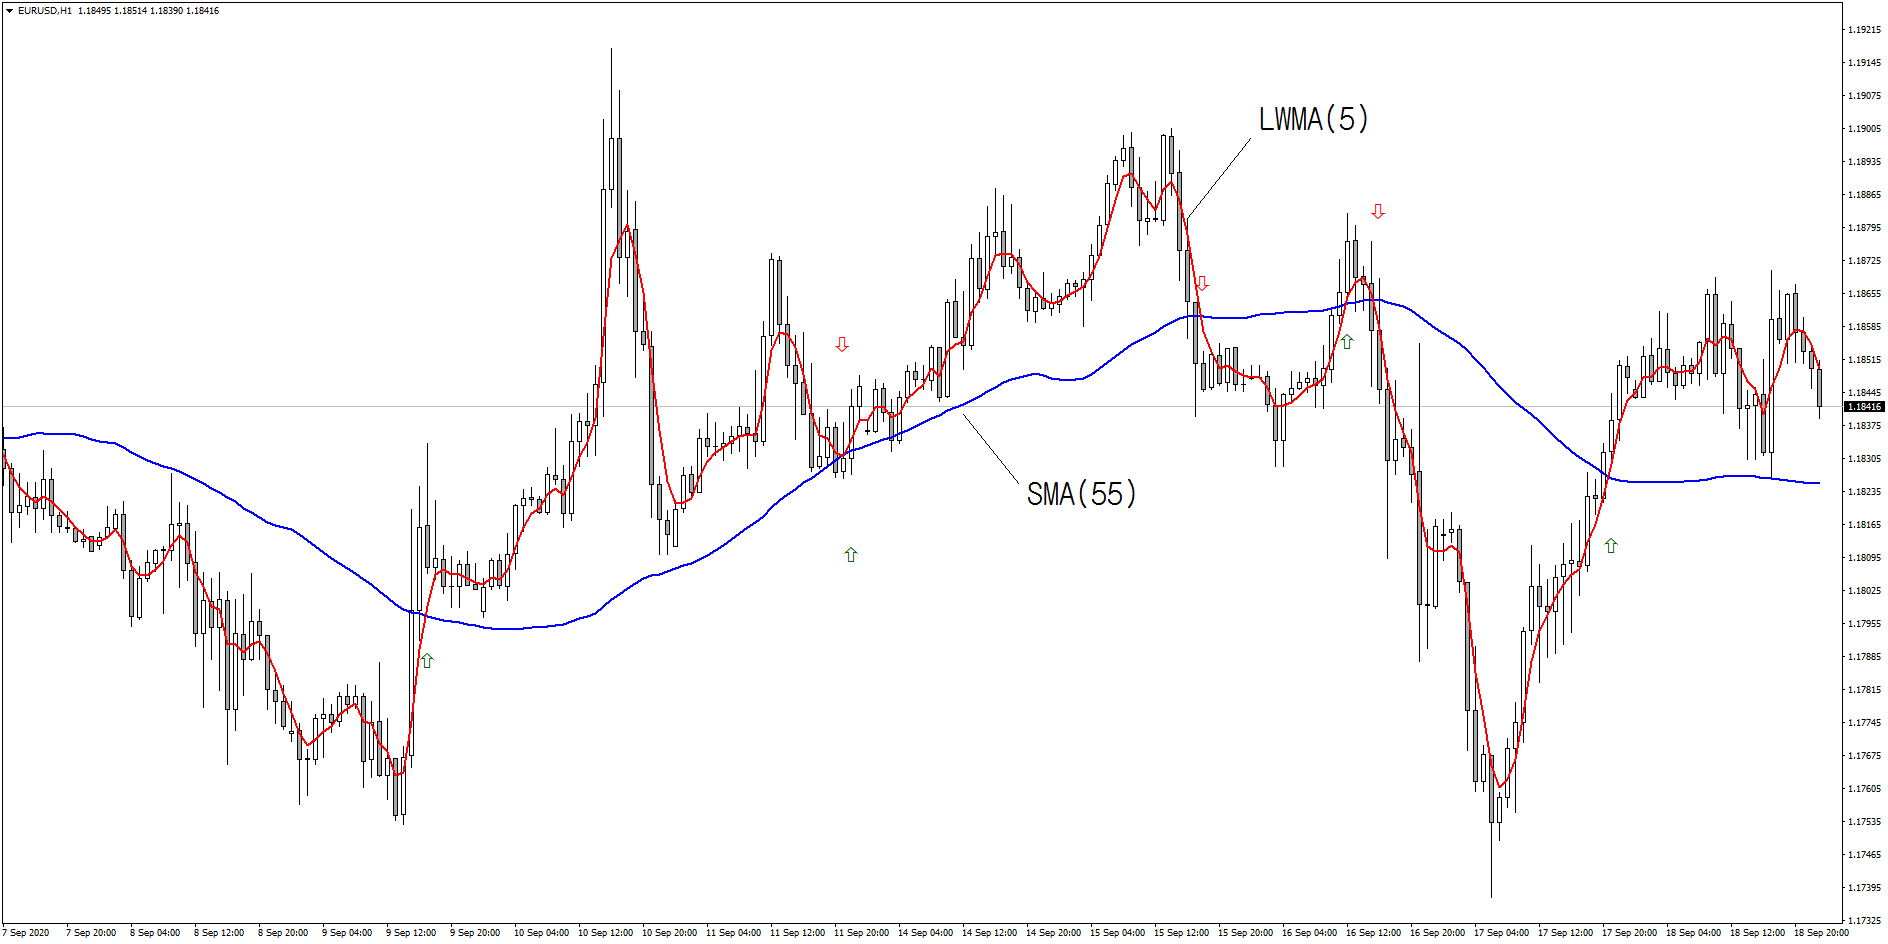
The following example corresponds to the addition of rules to the trading strategy formulated and developed in the previous article, based on  moving averages crossovers with 5 and 55 periods. 

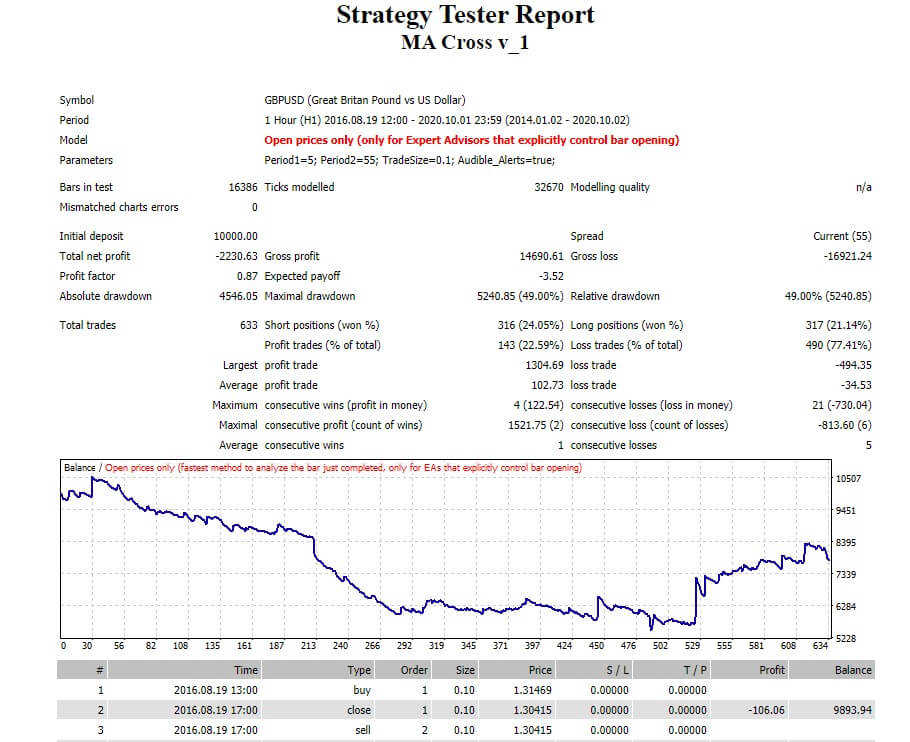
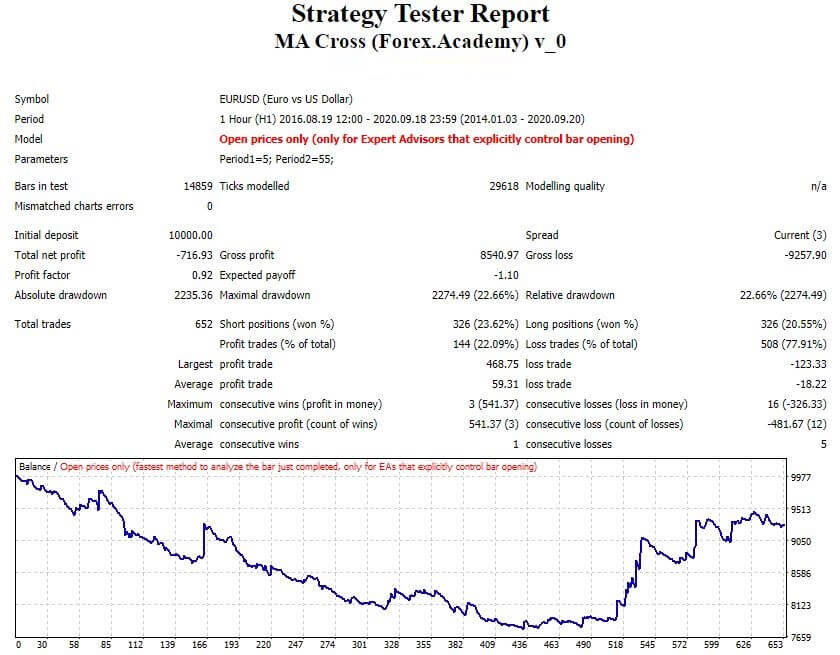
Before incorporating additional rules and evaluating their subsequent impact on the trading strategy, we will display the results of a historical simulation, developed using the EURUSD pair in its hourly timeframe. Likewise, the size of each trade position corresponded to 0.1 lot in a $10,000 account.

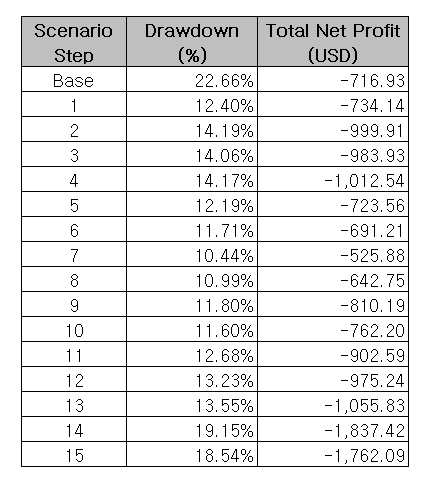
The following figure illustrates the strategy’s performance in its initial condition, which executed 652 trades providing a drawdown level of 22.66% and a net profit of -$716.93.

The additional proposed filter rules are as follows:

  • The strategy must have an initial stop loss of 30 pips. This stop will limit the possible maximum amount of loss per trade.
extern double SL_Pips = 30;
  • We propose using a Break-Even rule to ensure the opened trades’ profits, which will be used when the price advances 40 pips. Likewise, the strategy will apply a Trailing Stop of 40 pips of advance and a 3-pips step
extern double BreakEven_Pips = 40;
extern double Trail_Pips = 40;
extern double Trail_Step = 3;

The function that computes the Trailing Stop is as follows:

void TrailingStopTrail(int type, double TS, double step, bool aboveBE, double 
aboveBEval) //set Stop Loss to "TS" if price is going your way with "step"
  {
   int total = OrdersTotal();
   TS = NormalizeDouble(TS, Digits());
   step = NormalizeDouble(step, Digits());
   for(int i = total-1; i >= 0; i--)
     {
      while(IsTradeContextBusy()) Sleep(100);
      if(!OrderSelect(i, SELECT_BY_POS, MODE_TRADES)) continue;
      if(OrderMagicNumber() != MagicNumber || OrderSymbol() != 
Symbol() || OrderType() != type) continue;
	  RefreshRates();
      if(type == OP_BUY && (!aboveBE || Bid > OrderOpenPrice() + TS + aboveBEval)
 && (NormalizeDouble(OrderStopLoss(), Digits()) <= 0 ||
 Bid > OrderStopLoss() + TS + step))
         myOrderModify(OrderTicket(), Bid - TS, 0);
      else if(type == OP_SELL && (!aboveBE || Ask < OrderOpenPrice()
 - TS - aboveBEval) && (NormalizeDouble(OrderStopLoss(), Digits()) <= 0 ||
 Ask < OrderStopLoss() - TS - step))
         myOrderModify(OrderTicket(), Ask + TS, 0);
     }
  }
  • Also, the strategy must allow a maximum limit of one trade at a time.
extern int MaxOpenTrades = 1;

In this context, the code that will determined the limit reached will be as follows:

   //test maximum trades
   if((type % 2 == 0 && long_trades >= MaxLongTrades)
   || (type % 2 == 1 && short_trades >= MaxShortTrades)
   || (long_trades + short_trades >= MaxOpenTrades)
   || (type > 1 && type % 2 == 0 && long_pending >= MaxLongPendingOrders)
   || (type > 1 && type % 2 == 1 && short_pending >= MaxShortPendingOrders)
   || (type > 1 && long_pending + short_pending >= MaxPendingOrders)
   )
     {
      myAlert("print", "Order"+ordername_+" not sent, maximum reached");
      return(-1);
     }
  • The trading strategy must preserve the account equity using a position size that should be proportional to 1 lot per $100,000 of equity.
extern double MM_PositionSizing = 100000;
double MM_Size() //position sizing
  {
   double MaxLot = MarketInfo(Symbol(), MODE_MAXLOT);
   double MinLot = MarketInfo(Symbol(), MODE_MINLOT);
   double lots = AccountBalance() / MM_PositionSizing;
   if(lots > MaxLot) lots = MaxLot;
   if(lots < MinLot) lots = MinLot;
   return(lots);
  }

Now, the entry rules with the Stop-Loss rule will be as follows:

   //Open Buy Order, instant signal is tested first
   if(Cross(0, iMA(NULL, PERIOD_CURRENT, Period1, 0, MODE_LWMA, PRICE_CLOSE, 0) >
 iMA(NULL, PERIOD_CURRENT, Period2, 0, MODE_SMA, PRICE_CLOSE, 0)) 
//Moving Average crosses above Moving Average
   )
     {
      RefreshRates();
      price = Ask;
      SL = SL_Pips * myPoint; //Stop Loss = value in points (relative to price)   
      if(IsTradeAllowed())
        {
         ticket = myOrderSend(OP_BUY, price, MM_Size(), "");
         if(ticket <= 0) return;
        }
      else //not autotrading => only send alert
         myAlert("order", "");
      myOrderModifyRel(ticket, SL, 0);
     }
   
   //Open Sell Order, instant signal is tested first
   if(Cross(1, iMA(NULL, PERIOD_CURRENT, Period1, 0, MODE_LWMA, PRICE_CLOSE, 0) <
 iMA(NULL, PERIOD_CURRENT, Period2, 0, MODE_SMA, PRICE_CLOSE, 0))
 //Moving Average crosses below Moving Average
   )
     {
      RefreshRates();
      price = Bid;
      SL = SL_Pips * myPoint; //Stop Loss = value in points (relative to price)   
      if(IsTradeAllowed())
        {
         ticket = myOrderSend(OP_SELL, price, MM_Size(), "");
         if(ticket <= 0) return;
        }
      else //not autotrading => only send alert
         myAlert("order", "");
      myOrderModifyRel(ticket, SL, 0);
     }
  }

Finally, the position’s closing code including the trailing stop will be as follows:

  {
   int ticket = -1;
   double price;   
   double SL;
   
   TrailingStopTrail(OP_BUY, Trail_Pips * myPoint, Trail_Step * myPoint, false,
 0); //Trailing Stop = trail
   TrailingStopTrail(OP_SELL, Trail_Pips * myPoint, Trail_Step * myPoint, false,
 0); //Trailing Stop = trail
   
   //Close Long Positions
   if(iMA(NULL, PERIOD_CURRENT, Period1, 0, MODE_LWMA, PRICE_CLOSE, 0) <
 iMA(NULL, PERIOD_CURRENT, Period2, 0, MODE_SMA, PRICE_CLOSE, 0)
 //Moving Average < Moving Average
   )
     {   
      if(IsTradeAllowed())
         myOrderClose(OP_BUY, 100, "");
      else //not autotrading => only send alert
         myAlert("order", "");
     }
   
   //Close Short Positions
   if(iMA(NULL, PERIOD_CURRENT, Period1, 0, MODE_LWMA, PRICE_CLOSE, 0) >
 iMA(NULL, PERIOD_CURRENT, Period2, 0, MODE_SMA, PRICE_CLOSE, 0)
 //Moving Average > Moving Average
   )
     {   
      if(IsTradeAllowed())
         myOrderClose(OP_SELL, 100, "");
      else //not autotrading => only send alert
         myAlert("order", "");
     }

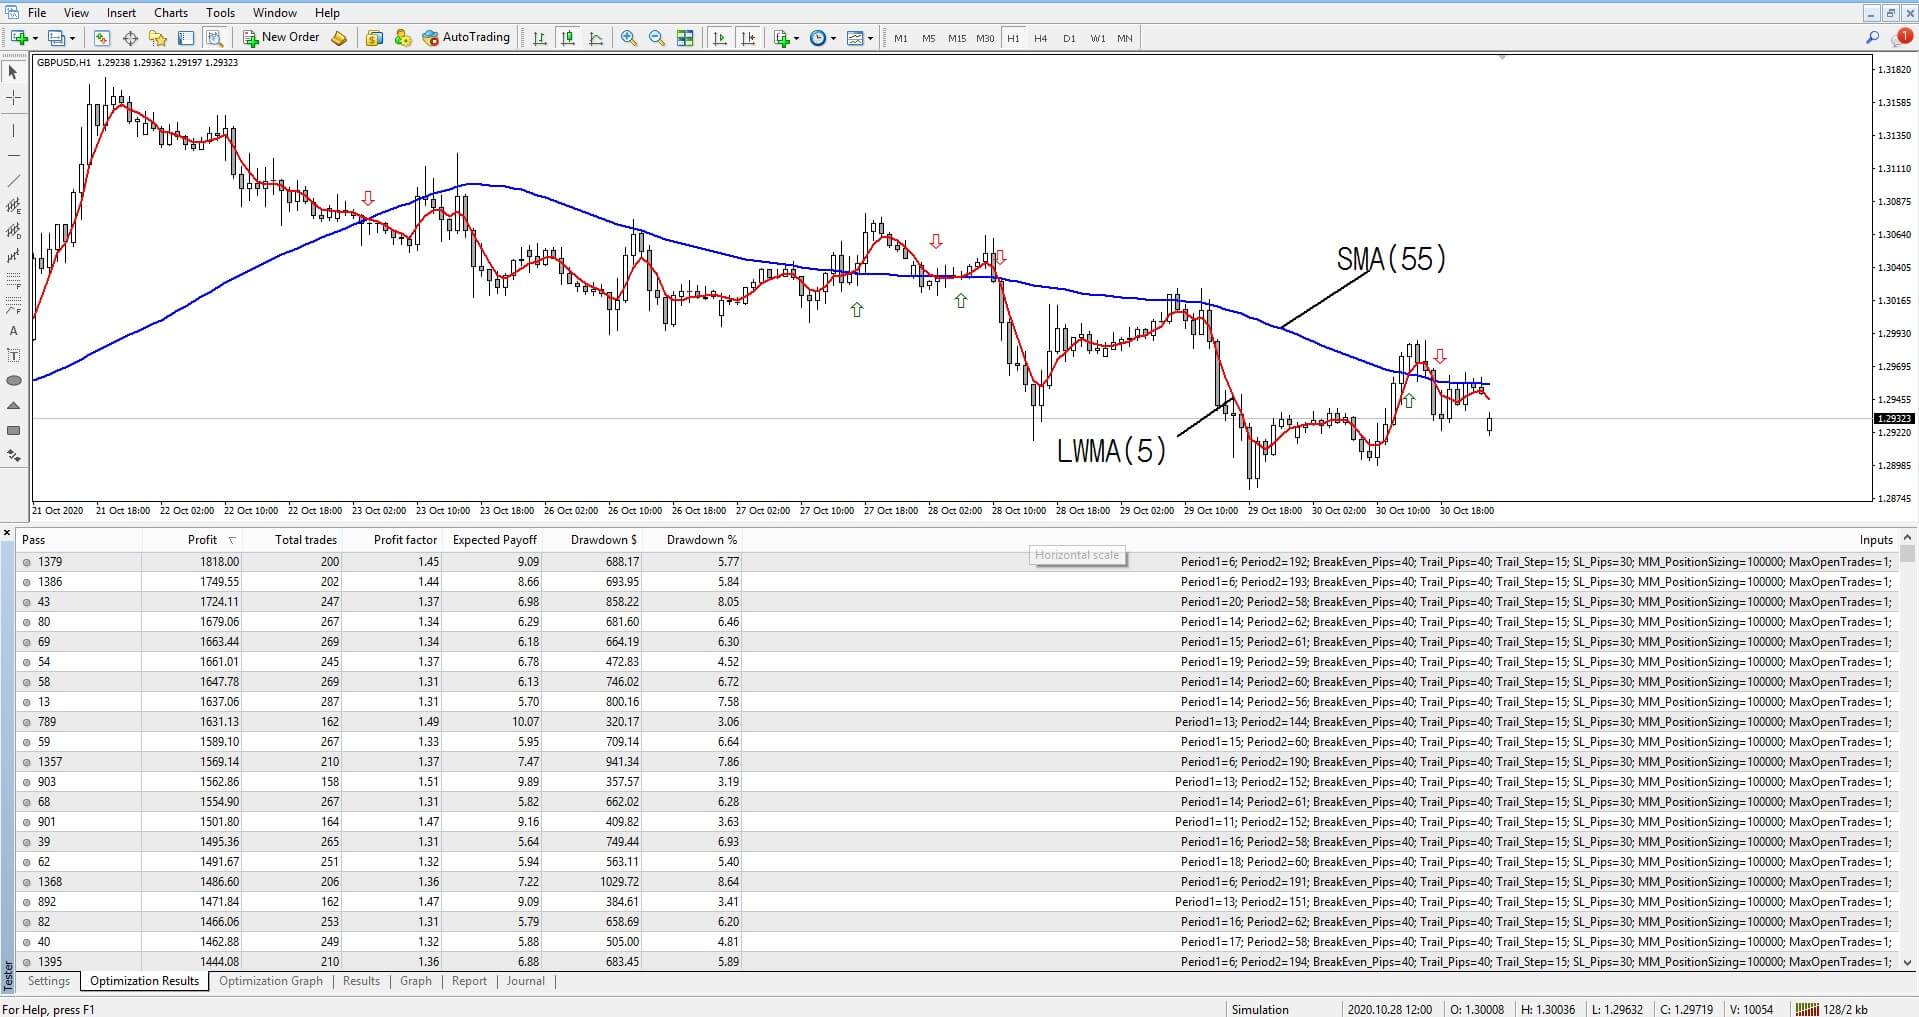
The historical simulation with the inclusion of the additional rules to the trading strategy  is illustrated in the next figure and reveals a reduction in the Drawdown from 22.66% to 10.49%. Likewise, we distinguish a variation in the Total Net Profit from -$716.93 to -$413.76.

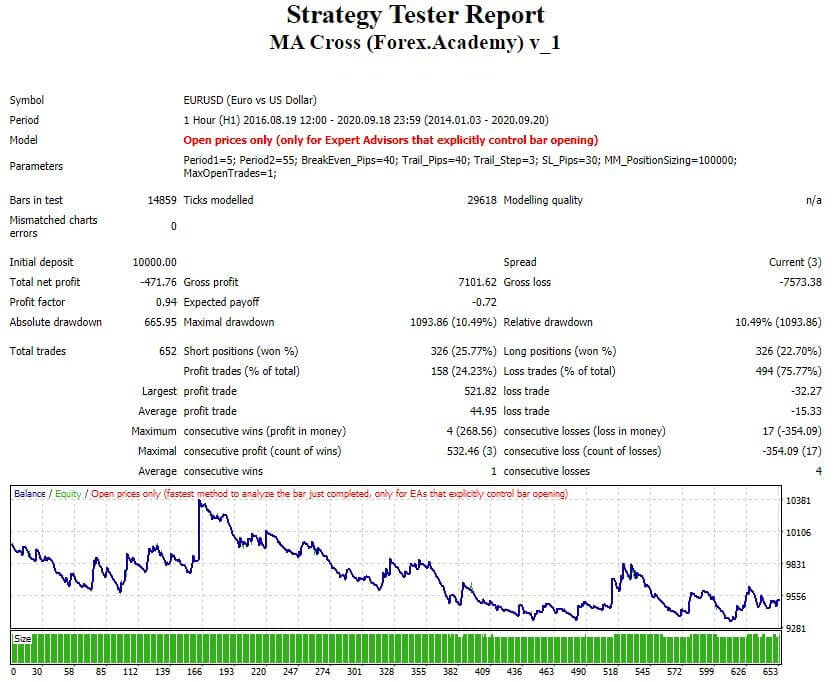
Although the trading strategy continues having a negative expectation, This exercise shows the importance of including additional rules to improve the trading strategy’s performance.

Conclusions

This educational article presented how the inclussion of filters into a trading strategy can improve the performance of two key indicators such as the Drawdown and the Total Net Profit.

On the other hand, we did not consider the parameters optimization during this step. Optimization will be discussed in a future article.

In the next educational article, we will extend the concepts of Profits Management and Position Sizing.

Suggested Readings

  • Jaekle, U., Tomasini, E.; Trading Systems: A New Approach to System Development and Portfolio Optimisation; Harriman House Ltd.; 1st Edition (2009).
  • Pardo, R.; The Evaluation and Optimization of Trading Strategies; John Wiley & Sons; 2nd Edition (2008).
Categories
Forex Signals

CADJPY Shows Intraday Bounce Signals

Description

The CADJPY cross exposes an intraday bounce structure that suggests the possibility of an upward movement, which could surpass the Wednesday trading session high at 79.09, leading to the price toward a new intraday high.

From the 30-minute chart, we observe the low of the week’s bullish reaction at 78.371 from where the price action reacted mostly upward. The price looks stopping the bearish pressure during the current trading session, developing an intraday double bottom pattern, which remains in progress.

On the other hand, the extreme bearish sentiment in the stock market leads us to expect an upward turn in the downward intraday session, increasing the possibility of weakness in the Japanese currency.

Our bullish scenario foresees an upward movement toward the September 18th consolidation high located at level 79.295, from where the price should find resistance. The invalidation level of our outlook locates at 78.52.

Chart

Trading Plan Summary

Check out the latest trading signals on the Forex Academy App for your mobile phone from the Android and iOS App Store.

Categories
Forex System Design

Designing a Trading Strategy – Part 2

Introduction

Our previous article presented the three key elements of a trading strategy, which is the base of a trading system. In this second part of the designing process of a trading strategy, we will present the first component of a trading strategy corresponding to the entry and exit.

Trade Positioning and Trading Strategy

trade is made of at least by a buy order and a sell order. In other words, when, for example, the trader places a long position (buy), he should close it using a sell (cover) order.

On the other hand, a trading strategy with a positive expectation can identify and provide both long and short trading opportunities under a specific condition. Similarly, the strategy must be able to determine when to close the trading position and exit the market.

Generating Trading Opportunities

As we have seen in previous articles, a trading strategy is born from an idea that we believe might generate profits in any financial market. In this regard, the entry signals can vary from the simplest to the most complex requirement.

A buy position will arise when the price meets a condition for a bull market. On the contrary, a short position will activate if the market accomplishes the conditions for a bear leg. Some examples of long entries are:

  1. The 5-period fast moving average crosses over the 55-period slow moving average.
  2. The 65-period RSI oscillator closes above a reading of the 52-level.
  3. The price surpasses and closes above the high of the previous day.
  4. The price breaks and closes above the high of the 55-day range.

The definition of the exit rule of the trade must be considered from the basis that an open position in one direction must be closed with a position of equal size and opposite direction. For example, if the trader has opened a long trade, it will be closed with a selling trade. In this way, the developer should define a set of criteria that allow the execution of the closing of the trade. For example:

1) Closing the trade if the price advances 1.5 times the risk of the transaction.
2) The price reaches 3 times the ATR of 14 periods.
3) The rolling average of 5 periods crosses the average of 21 periods.

An example of Trading Signals using Metatrader 4

Metatrader 4 is one of the most popular trading platforms in the retail trading segment. Despite other trading platforms, such as TradeStation, Multicharts, or VisualChart, we will use Metatrader for our example. This platform includes the MetaEditor application, with which the creation of trading strategies can be developed through the programming of custom indicators.

In the following example, we show the creation of a custom indicator based on the crossing of two moving averages. This trading strategy uses a 5-period Weighted Linear Moving Average (Fast LWMA) and a 55-period Simple Moving Average (Slow SMA). 

Now it is time to define the entry and exit rules of our trading strategy as ideas and code rules for MetaEditor of MetaTrader 4.

The setting of each moving average period is as follows:

extern int Period1 = 5;
extern int Period2 = 55;

The entry criterion will occur as follows:

  • buy position will be activated when the LWMA(5) crosses above the SMA(55).
//Open Buy Order, instant signal is tested first
   if(Cross(0, iMA(NULL, PERIOD_CURRENT, Period1, 0, MODE_LWMA, PRICE_CLOSE, 0) >
 iMA(NULL, PERIOD_CURRENT, Period2, 0, MODE_SMA, PRICE_CLOSE, 0)) 
//Moving Average crosses above Moving Average
   )
     {
      RefreshRates();
      price = Ask;   
      if(IsTradeAllowed())
        {
         ticket = myOrderSend(OP_BUY, price, TradeSize, "");
         if(ticket <= 0) return;
        }
      else //not autotrading => only send alert
         myAlert("order", "");
     }
  • sell position will trigger when the LWMA(5) crosses below the SMA(55).
//Open Sell Order, instant signal is tested first
   if(Cross(1, iMA(NULL, PERIOD_CURRENT, Period1, 0, MODE_LWMA, PRICE_CLOSE, 0) <
 iMA(NULL, PERIOD_CURRENT, Period2, 0, MODE_SMA, PRICE_CLOSE, 0)) 
//Moving Average crosses below Moving Average
   )
     {
      RefreshRates();
      price = Bid;   
      if(IsTradeAllowed())
        {
         ticket = myOrderSend(OP_SELL, price, TradeSize, "");
         if(ticket <= 0) return;
        }
      else //not autotrading => only send alert
         myAlert("order", "");
     }
  }

The exit criterion will occur as follows:

  • buy position will be closed if the LWMA(5) crosses below the SMA(55).
//Close Long Positions
   if(iMA(NULL, PERIOD_CURRENT, Period1, 0, MODE_LWMA, PRICE_CLOSE, 0) <
 iMA(NULL, PERIOD_CURRENT, Period2, 0, MODE_SMA, PRICE_CLOSE, 0) 
//Moving Average < Moving Average
   )
     {   
      if(IsTradeAllowed())
         myOrderClose(OP_BUY, 100, "");
      else //not autotrading => only send alert
         myAlert("order", "");
     }
  • sell position will be closed if the LWMA(5) crosses above the SMA(55).
//Close Short Positions
   if(iMA(NULL, PERIOD_CURRENT, Period1, 0, MODE_LWMA, PRICE_CLOSE, 0) >
 iMA(NULL, PERIOD_CURRENT, Period2, 0, MODE_SMA, PRICE_CLOSE, 0) 
//Moving Average > Moving Average
   )
     {   
      if(IsTradeAllowed())
         myOrderClose(OP_SELL, 100, "");
      else //not autotrading => only send alert
         myAlert("order", "");
     }

Until now, we have not defined a money management rule or the position size for our trading strategy, just entries, and exits.

Conclusions

Entry and exit criteria are the basis of a trading strategy, which arises from an idea. The trading strategy’s essential objective is to obtain an economic profit from applying specific rules in both long and short positioning in the financial market.

In this educational article, we presented the case of a trading strategy based on two moving averages crossovers. In particular, we used the LWMA(5) as the signal moving average with an SMA(55) as the slow m.a.

In the following article, we will present some filters to avoid false signals.

Suggested Readings

  • Pardo, R.; The Evaluation and Optimization of Trading Strategies; John Wiley & Sons; 2nd Edition (2008).
  • Jaekle, U., Tomasini, E.; Trading Systems: A New Approach to System Development and Portfolio Optimisation; Harriman House Ltd.; 1st Edition (2009).
Categories
Forex Signals

EURAUD Shows Bullish Continuation Signals

Description

The EURAUD cross develops an intraday bullish movement in the first trading session of the week after revealing a false bearish breakdown exposed in the sideways range that the cross sets since Friday, September 18th.

EURAUD, in its hourly chart, illustrates a short-term bullish sequence, which began on September 17th when the price reacted mainly bullish once it touched for the second time the zone of 1.61252 from where it started to advance, developing a sequence of higher highs and lower highs.

On the other hand, the MACD oscillator shows a short-term bullish bias, which supports the possibility of further advances in the EURAUD price. Likewise, although the price remains within a sideways intraday range, the channel’s upper zone’s re-test leads us to expect a bullish breakout, which increases since the price made a false break in the current trading session.

Our bullish scenario foresees an advance from the zone of 1.6248, from where we expect an advance until 1.6348, coinciding with the September 8th high. The invalidation level is located at 1.6198, which coincides with the base of the sideways channel.

Chart

Trading Plan Summary


Check out the latest trading signals on the Forex Academy App for your mobile phone from the Android and iOS App Store.

Categories
Forex Signals

GBPAUD Raises After Intraday Breakout

Description

The GBPAUD cross advances on the first trading session o Monday in its of the week boosted by the risk-off sentiment in the currency market.

From the GBPAUD chart, in its hourly timeframe, we distinguish the intraday breakout after the price failed its intraday decline founding support at 1.76331, from where fresh buyers took the market bias control boosting the price to surpass and break the descending intraday trendline.

In this regard, the consolidation above the downward trendline added to the 135-hour moving average leads us to expect a bullish movement that could advance toward the September 17th high located at 1.78394, where the cross could find resistance.

Our bullish foresees an upward move from the zone of 1.7718 with a potential profit target at 1.7838. The invalidation level of our scenario is located at 1.7648 that coincides with the last daily low.

Chart

Trading Plan Summary

  • Entry Level: 1.7728
  • Protective Stop: 1.7648
  • Profit Target: 1.7838
  • Risk/Reward Ratio: 1.38
  • Position Size: 0.01 lot per $1,000 in trading account.


Check out the latest trading signals on the Forex Academy App for your mobile phone from the Android and iOS App Store.

Categories
Forex Education Forex System Design

Designing a Trading Strategy – Part 1

Introduction

In a previous article, we introduced the basic concepts that should include a trading strategy. In this context, a trading strategy tends to be confused with a trading system. In this educational article, we start to present a series focused on developing a trading strategy that could end as a trading system.

The Trading Strategy Concept

Before advancing in designing a trading strategy, it is necessary to explain the difference between a trading strategy and a trading system.

trading strategy is a set of objective and formalized rules, such as parameters from a mathematical formula; these values can vary in different types of markets. Additionally, this set of rules are characterized by being independent of the emotional trader’s behavior. 

trading system is a systematic application of a trading strategy designed to achieve a profitable return by positioning in long or short financial markets. The main advantage of using a tested and validated trading system is significant confidence in producing profits.

Trading strategies can vary from the simplest to the complex rules criteria. Some classical trading strategies are moving average crosses, channel breakouts, bar patterns, candlestick patterns, and strategies based on oscillators such as MACD or RSI.

According to the complexity level of the trading strategy, as complexity increases, the construction, testing, optimization, and evaluation process will become more difficult. In this context, if the system developer does not control the trading strategy complexity, the optimization process results can become challenging, even could lead to the over-fit of the trading strategy.

The Basic Components

Each trading strategy must contain three essential components identified as follows:

Entry and Exit: Both entry and exit are the core of a trading strategy. The entry and exit criterion can vary in its complexity level. Similarly, the strategy could consider an entry in a specific price as a pending order (limit or stop), a market entry, open, or the closing price. On the other hand, the exit criteria could use a broad kind of methods such as percentage of price advancement or key support/resistance levels. As the reader may realize, the possibilities on entries and exits are unlimited.

Risk Management: It is a fact that any trading strategy will generate losing trades. In this regard, all trading strategies must contain a set of objective rules to reduce the risk. Risk management’s main objective is to limit losses in the trading account while allowing the trader to continue trading despite losing streaks.

Position Sizing: The third element a trading strategy must include is the amount to be traded. The position size may correspond to a fixed number of units, such as contracts, lots, shares, etc. The problem of position sizing becomes critical, especially when the trading strategy is profitable. In this context, Pardo suggests that it is more effective to allocate resources to improve the strategy’s entries and exits.

Conclusions

In this educational article, we have introduced the difference between a trading strategy and a trading system. In this regard, we can understand a trading strategy as the basis of a trading system.

A trading strategy can be based on the simplest or the most sophisticated criteria. However, as the complexity level of the strategy increases, the level of complexity in the trading system’s development will also increase.

On the other hand, a trading strategy must contain three elements, which are as follows:

  1. Entry and Exit.
  2. Risk Management.
  3. Position Sizing.

Finally, in the next educational article, we will expand the concepts of inputs and outputs in a trading strategy.

Suggested Readings

  • Pardo, R.; The Evaluation and Optimization of Trading Strategies; John Wiley & Sons; 2nd Edition (2008).
  • Jaekle, U., Tomasini, E.; Trading Systems: A New Approach to System Development and Portfolio Optimisation; Harriman House Ltd.; 1st Edition (2009).
Categories
Forex Signals

Gold – Breakdown Suggests Further Declines

Description

Gold prices in its 2-hour timeframe remain moving in a consolidation structure identified as a triangle pattern. At the same time, the price action reveals a breakdown in its internal sequence, suggesting the likelihood of additional drops.

According to the Elliott wave theory, the price advances in a triangle pattern, which consolidates the first downward movement that began when the precious metal topped at $2,075.14 per ounce on August 07th. With the short-term ascending trendline between waves d and e of Subminuette degree identified in green, the yellow metal unveiled the completion of wave e. It opened the possibility of a new bearish leg of the upper degree.

On the other hand, the RSI oscillator shows a breakdown that pierced below level 40 and consolidated in 41.4, confirming the intraday breakdown developed by the precious metal and increasing the downward move’s likelihood.

In a conservative scenario, the Gold prices could decline toward the $1,925.93 per ounce, which corresponds to the last swing of September 09th. The invalidation level of our bearish scenario will occur if the price soars over $1,952.93 per ounce.

Chart

Trading Plan Summary

  • Entry Level: $1,943.93 per ounce
  • Protective Stop: $1,952.93 per ounce
  • Profit Target: $1,925.17 per ounce
  • Risk/Reward Ratio: 2.08
  • Position Size: 0.01 lot per $1,000 in trading account.


Check out the latest trading signals on the Forex Academy App for your mobile phone from the Android and iOS App Store.

Categories
Forex Market Analysis

Russell 2000 Resume its Advances

Overview

Russell 2000 advances on the first trading session of the week, reporting gains over 2.6%. The market sentiment reveals to us the penetration in the extreme bullish sentiment zone, supporting the possibility of fresh upsides. In this regard, the Elliott Wave structure exposes an incomplete bullish structure supporting the likelihood of further rises.

Market Sentiment Overview

Russell 2000 advances over 2.6% in the first session of the week, easing the bearish sentiment that dominated the previous two weeks sell-off in where the U.S. index that groups to the 2,000 small capitalized companies plummeted over 5%.

The big picture of Russell 2000 exposes a divergence with the S&P 500. From the following weekly chart, we distinguish to Russell 2000 without confirming the S&P 500 record high at 3,588.8 pts reached on September 02nd. According to the Dow Theory, the fresh highs must be confirmed, and divergence must be considered an exhaustion or reversal signal of the current bull market. In this case, Russell 2000 remains without confirming the last record high reached by the S&P 500.

Although both indices move above the 26-week moving average, indicating the upward bias on the stock market, the S&P 500 remains moving in the extreme bullish sentiment zone while the Russell 2000 looks bouncing toward the extreme bullish sentiment zone. This market context carries us to expect for Russell 2000 the possibility that the price visits fresh highs, even surpassing the 1,600 pts.

The next daily chart of Russell 2000 unveils the price action bouncing from last July’s previous consolidation zone. The bullish reaction developed by the Russell leads us to foresee further upsides in the following trading sessions.

Simultaneously, the Fear & Greed index looks moving below level 50, which corresponds to the “fear zone.” This lecture added to the bearish sentiment of news media, leads us to expect a bullish reversal move.

Regarding the volatility side, the Russell 2000 Volatility Index reveals the extreme bearish sentiment zone penetration. This decline confirms the possibility of further declines to the area between 25.82 to 20.35, from where the price could find support.


In consequence, considering the penetration to the extreme bullish sentiment zone of Russell 2000 and the lowest level observed in the Russell 2000 Volatility Index, we expect fresh upsides in the U.S. stock market.

Elliott Wave Outlook

The short-term outlook under the Elliott wave perspective of Russell 2000 illustrates the advance on an incomplete five-wave sequence, which began on July 10th when the U.S. index found fresh buyers at 1,376.67 pts, starting the current bullish cycle that remains in progress.

From the 4-hour chart, we distinguish the completion of the second wave of Subminuette degree labeled in green. According to the Elliott wave theory, the canalization with its base-line from the end of wave (b) of Minuette degree identified in blue as the origin to wave ii in green and projected until the end of the first wave of the same degree should provide the target of the third wave. In this context, the potential third wave could advance to 1,617.06 and extend 1,707.29 pts.

Finally, the bullish bias confirmation will occur if the price closes above the last intraday descending trendline. At the same time, the current upward scenario will remain active while the Russell 2000 index keeps moving above 1,452.24 pts.


Categories
Forex Market Analysis

DAX Advances in an Ending Diagonal Pattern

Overview

The German benchmark index, DAX 30 advances in the extreme bullish sentiment zone accumulating gains over 60% after the German index gained support on the March’s low at 7,957.6 pts. In spite of the up-up-up market sentiment, the DAX develops an ending diagonal pattern that is still unfinished, suggesting the current upward trend’s exhaustion.

Market Sentiment Overview

DAX 30 continues its recovery following the German index drop to 7,957.6 pts, on March 23rd, which is the lowest level since late August 2013. From Mach’s low, DAX 30 advances over 60%.

The next DAX chart presents the German index in its daily timeframe illustrates the 52-week high and low range. The German index currently develops an upward movement in the extreme bullish sentiment zone. The short-term bullish sentiment is being confirmed by the 60-day moving average, which acts as support in the latest trading sessions.

The extreme bullish sentiment aided by the DAX surpassing the opening price of the year boosted the up-up-up sentiment in the news media added with the incomplete ascending wedge that remains in progress. These signals suggest the exhaustion of the current short-term bullish trend.

On the other hand, the daily chart of the DAX Volatility Index (VDAX) shows a mostly sideways movement in the extreme bearish zone. At the same time, the lateral consolidation pattern developed by VDAX, which remains unfinished, could experience a new decline raising the possibility of further upside in the German stock market.

Consequently, the German stock market sentiment is being dominated by extreme bullish bias. However, the incomplete ascending wedge pattern suggests the exhaustion of the upward movement.

Elliott Wave Outlook

The short-term outlook of the German stock market under the Elliott Wave perspective unveils the progress on an incomplete ending diagonal pattern, developing a new upward movement.

The DAX, in its 4-hour chart, exposes the progress of an upward corrective formation that follows an internal structure of a zigzag pattern of Minute degree labeled in back. The bullish move began in the March low when the German stock market plummeted until 7,957.6 pts. 

Currently, DAX advances in its fifth wave of Minuette degree labeled in blue, which, in turn, develops an ending diagonal pattern in its internal structure. This terminal formation, subdivided in a 3-3-3-3-3 sequence of Subminuette degree, identified in green, is seen advancing in its fifth wave. This pending upward movement agrees with the likely decline in the DAX Volatility Index.

Consequently, according to the Elliott wave perspective, our short-term outlook anticipates further upsides as long as the price stays above 12,737.5 pts. This potential upside could strike the 13,544.3 pts completing the wave ((c)) of Minute degree identified in black.

Categories
Forex Signals

Gold Consolidates in a Triangle Pattern

Description

In its 4-hour chart, the Gold price exposes a corrective sequence that follows the structure of a descending triangle pattern. This chartist figure suggests the possibility of a bearish continuation.
In the same way, according to the Elliott wave theory, the corrective pattern that follows a 3-3-3-3-3 sequence remains incomplete. Until now, the triangle pattern should complete its wave e of Subminuette degree identified in green before continuing its bearish short-term trend.
On the other hand, the RSI oscillator tested the zone below level 40, suggesting the change of the short-term bias from bullish to bearish.
In this context, there exists the possibility of a limited upward move toward the zone between $1,955.70 and $1,973.33 per ounce, from where the precious metal could complete the wave e in green and found fresh sellers expecting to incorporate their limit short positions.
We expect the test of the $1,956 per ounce from where the yellow metal could start to decline with a potential profit target in the zone of $1,862.9 per ounce. This level corresponds to the Augusts’ low from where the price started to consolidate in a triangle pattern.
Our bearish scenario’s invalidation level locates at $1,993.48 per ounce, corresponding to the end of wave c in green.

Trading Plan Summary

  • Entry Level: 1,956.48
  • Protective Stop: 1,993.48
  • Profit Target: 1,863.48
  • Risk/Reward Ratio: 2.51
  • Position Size: 0.01 lot per $1,000 in trading account.

Check out the latest trading signals on the Forex Academy App for your mobile phone from the Android and iOS App Store.

Categories
Forex Elliott Wave Forex Market Analysis Forex Technical Analysis

Gold Continues its Triangle-Pattern Consolidation

Overview

Gold continues on the fifth consecutive week of consolidation. The pattern is developing a contracting triangle which remains incomplete. The internal structure observed in this consolidation pattern suggests a limited upside before completing the corrective formation in progress.

Market Sentiment Overview

The price of Gold continues moving sideways by the fifth week in a row, testing the support on the extreme bullish sentiment zone of the 52-week high and low range. Although the precious metal eases 7.5% from its all-time high at $2,075.14 per ounce to date, the yellow metal report gains over 27.7% (YTD).

The following chart presents the yellow metal in its weekly timeframe. In it we distinguish the price movement testing the extreme bullish zone support located at $1,917.81 per ounce. This market condition leads us to expect a new decline for the coming trading sessions, finding support in the 26-week moving average, which currently moves in the $1,850.10 per ounce.

The potential decline in Gold’s price is backed by the strength of the U.S. Dollar Index, shown in the next intraday chart. In the figure, we observe the Greenback showing recovery signals moving above the 120-hour moving average.

On the other hand, the Gold Volatility index continues consolidating in a flag pattern. As discussed in our previous analysis, the current sideways movement, in progress, converges with gold’s consolidating formation, suggesting a new decline in the valuation of the precious metal.

Summarizing, the market sentiment for the yellow metal reveals the exhaustion of the extreme bullish sentiment that dominated the market participants’ activity until early August when the yellow metal reached its record high at $2,075.14 per ounce. At the same time, the recovery signals unveiled by the U.S. Dollar Index lead us to expect further declines in the precious metal.

Elliott Wave Outlook

The short-term Elliott Wave perspective for the yellow metal illustrated in the following hourly chart reveals a consolidation formation identified as an incomplete contracting triangle pattern.

In the hourly chart, we recognize the price action advancing in an incomplete corrective structural series, which began after the yellow metal topped at $2,075.14 per ounce from where the golden metal started to find sellers. The first decline corresponding to wave (a) of Minuette degree identified in blue found support at $1,832.62 per ounce. This bearish aggressively-looking leg alternates with wave (b), which still remains in progress.

The incomplete wave (b) in progress follows the internal sequence of a contracting triangle pattern, which currently ended its wave d of Subminuette degree labeled in green. According to the Elliott wave theory, the price should develop a marginal advance completing a wave e, in green, before continuing its bearish path. The limited upward move expected corresponds with the potential decline foreseen in the Gold Volatility Index, which shows a consolidation in the form of a flag pattern.

Categories
Forex Market Analysis

Dow Jones Declines Below an Ending Diagonal Pattern

Overview

The Dow Jones Industrial Average stopped its progress that started on the March 23rd’s low at 18,213.5 pts, from which it proceeded toward the 29,193.6 pts, reached on September 03rd. This movement made it recover its yearly losses that happened in the first quarter of 2020. The latest decline observed following the ending-diagonal breakdown leads us to warn about a likely bearish scenario.

Market Sentiment Overview

The Dow Jones Industrial Average stopped its advance from the mentioned recovery in our previous analysis. In our previous outlook, we commented about the divergence between the S&P 500 and the Industrial Average, which still did not reach a fresh record high as the S&P 500 did. As the following figure illustrates, the divergence observed between the two U.S. indices drives us to the conclusion that the last all-time high reached by the S&P 500 remains without confirmation by the Dow Jones. This situation carries us to expect the exhaustion of the current stock market recovery.


The next chart illustrates the Industrial Average in its daily timeframe. In the figure, we distinguish the market action moving on an extreme bullish sentiment zone, confirmed by its price action above the 60-day moving average. However, the latest sell-off negated the strike of the opening 2020 price easing near to 1.75% (YTD).

The breakdown observed in the Fear and Greed Index highlighted in yellow, signal the decline of the bullish sentiment prevailing during the previous stock market sessions. This reading adds to the context observed in the Dow Jones Volatility Index daily chart, which remains well in the bearish sentiment zone – above the 60-day moving average. This leads us to suspect that the recovery observed in the stock market is ending.

In consequence, from a market sentiment perspective, our position for the Dow Jones changes from bullish to neutral expecting the bullish continuation or bearish reversal confirmation.

Elliott Wave Outlook

Under the mid-term Elliott Wave perspective, the Industrial Average in its 4-hour chart reveals the completion on September 03rd of the fifth wave of Minuette degree labeled in blue, as the price topped at 29,193.6 pts., where Dow Jones found fresh sellers.

The last Dow Jones rally observed in the previous chart, developed in five waves, illustrates an ending diagonal pattern, which, after the price broke and closed below the line (ii)-((iv), dropped until the wave (iii) in blue. This movement leads us to expect further corrections in the U.S. stock market.

Simultaneously, the completion of the wave ((c)) of Minute degree in black and wave B of Minor degree in green points us to anticipate the development of a regular flat pattern, which follows a 3-3-5 structural sequence. In this context, Dow Jones might start to develop a new decline into five waves.

Finally, our central perspective for the Industrial Average remains neutral, expecting additional confirmation signals for the next movement. If the price action confirms a bearish continuation, the Dow Jones index could find support in 21,000 pts.