Description
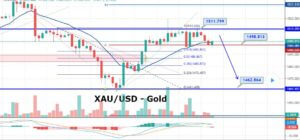
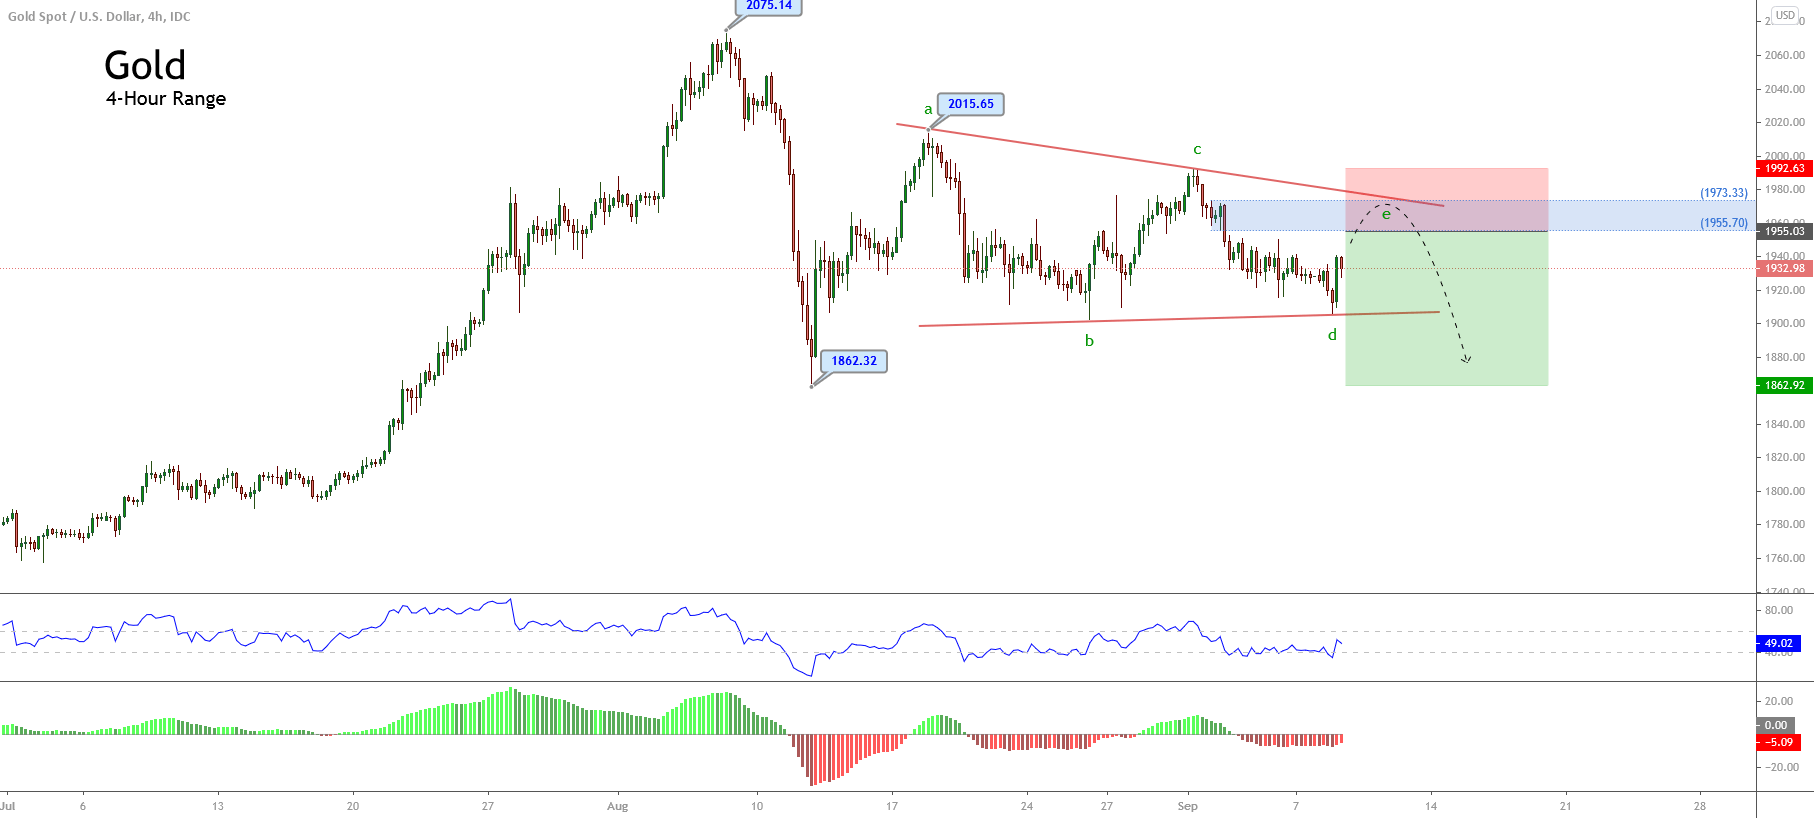
In its 4-hour chart, the Gold price exposes a corrective sequence that follows the structure of a descending triangle pattern. This chartist figure suggests the possibility of a bearish continuation.
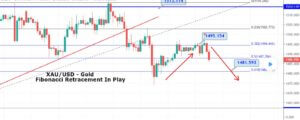
In the same way, according to the Elliott wave theory, the corrective pattern that follows a 3-3-3-3-3 sequence remains incomplete. Until now, the triangle pattern should complete its wave e of Subminuette degree identified in green before continuing its bearish short-term trend.
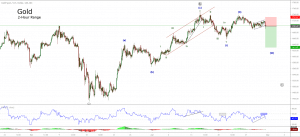
On the other hand, the RSI oscillator tested the zone below level 40, suggesting the change of the short-term bias from bullish to bearish.
In this context, there exists the possibility of a limited upward move toward the zone between $1,955.70 and $1,973.33 per ounce, from where the precious metal could complete the wave e in green and found fresh sellers expecting to incorporate their limit short positions.
We expect the test of the $1,956 per ounce from where the yellow metal could start to decline with a potential profit target in the zone of $1,862.9 per ounce. This level corresponds to the Augusts’ low from where the price started to consolidate in a triangle pattern.
Our bearish scenario’s invalidation level locates at $1,993.48 per ounce, corresponding to the end of wave c in green.

Trading Plan Summary
- Entry Level: 1,956.48
- Protective Stop: 1,993.48
- Profit Target: 1,863.48
- Risk/Reward Ratio: 2.51
- Position Size: 0.01 lot per $1,000 in trading account.
Check out the latest trading signals on the Forex Academy App for your mobile phone from the Android and iOS App Store.