Description
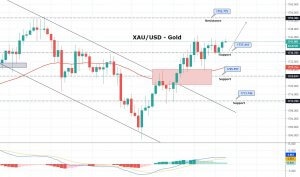
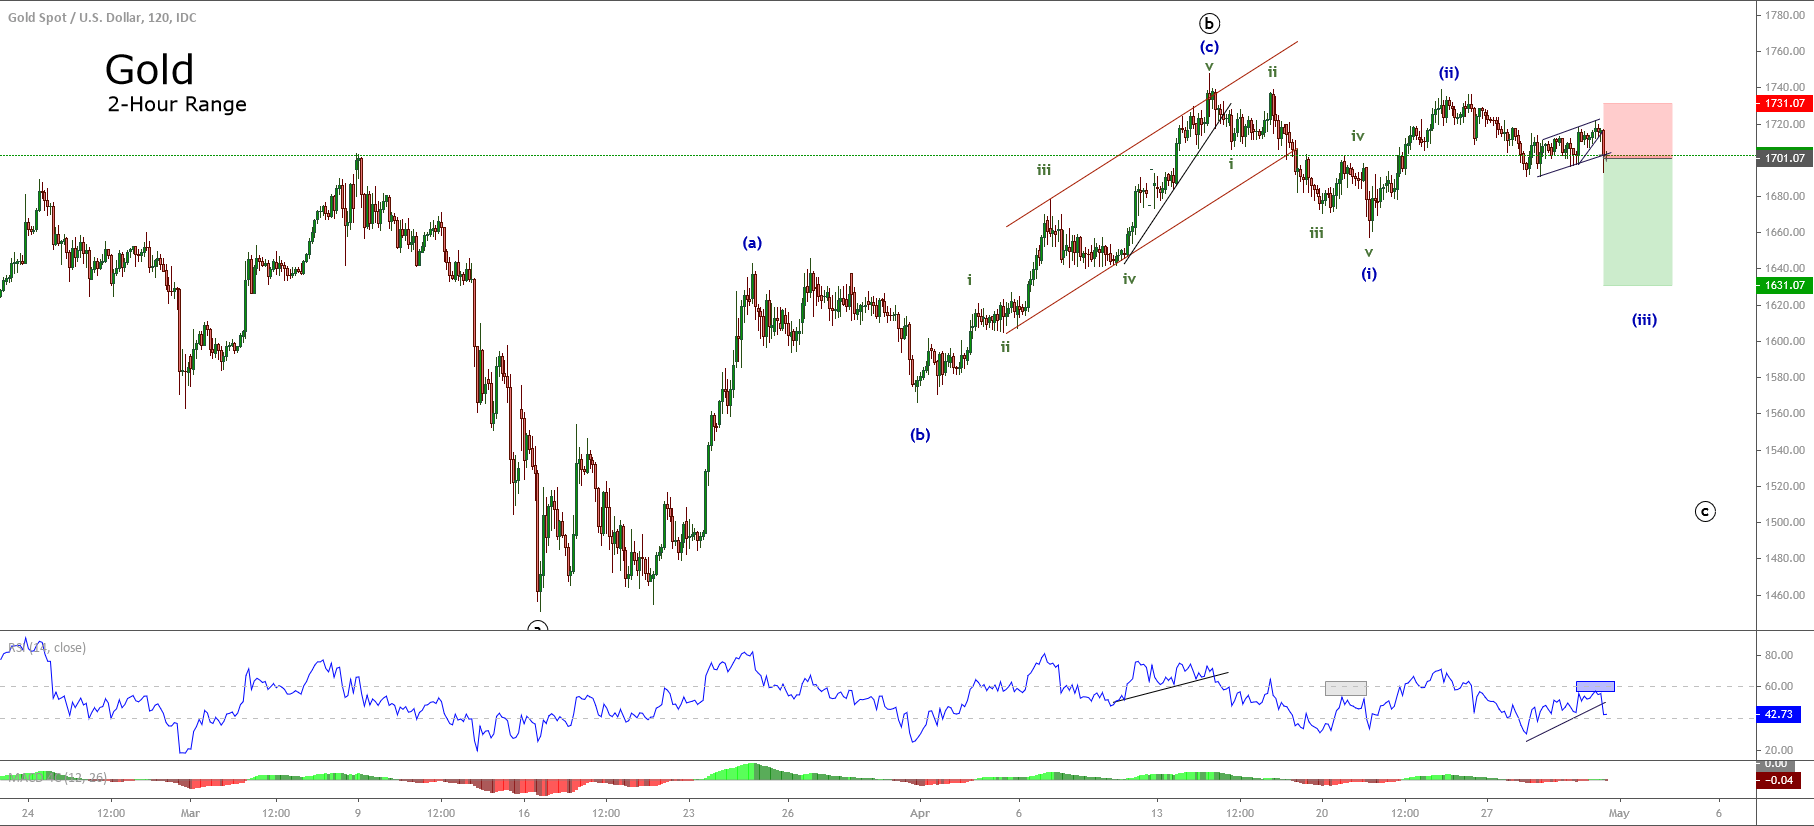
Gold, in its 2-hour chart, exposes the violation of the ascending trendline that links the latest lower highs.

The last pause structure that looks like a flag pattern suggests the possibility of bearish continuation of the previous downward movement.
On the other hand, the lower speed observed in the price action, and considering the alternation principle, we expect an aggressive sell-off, which could be supported by the strength of the US Dollar.
In the same way, the RSI oscillator rejected the last upside below level 60, which provide us an additional clue for the bearish sentiment.
We consider a bearish scenario from the current levels expecting a decline until $1,631 per ounce.
Our bearish outlook will be invalid if the price soars and closes above $1,731 per ounce.
Chart
Trading Plan Summary
- Entry Level: $1,701.07
- Protective Stop: $1,731.07
- Profit Target: $1.631.07
- Risk/Reward Ratio: 2.33
- Position Size: 0.01 lot per $1,000 in account.