Description
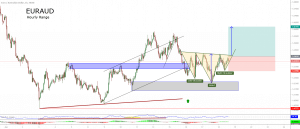
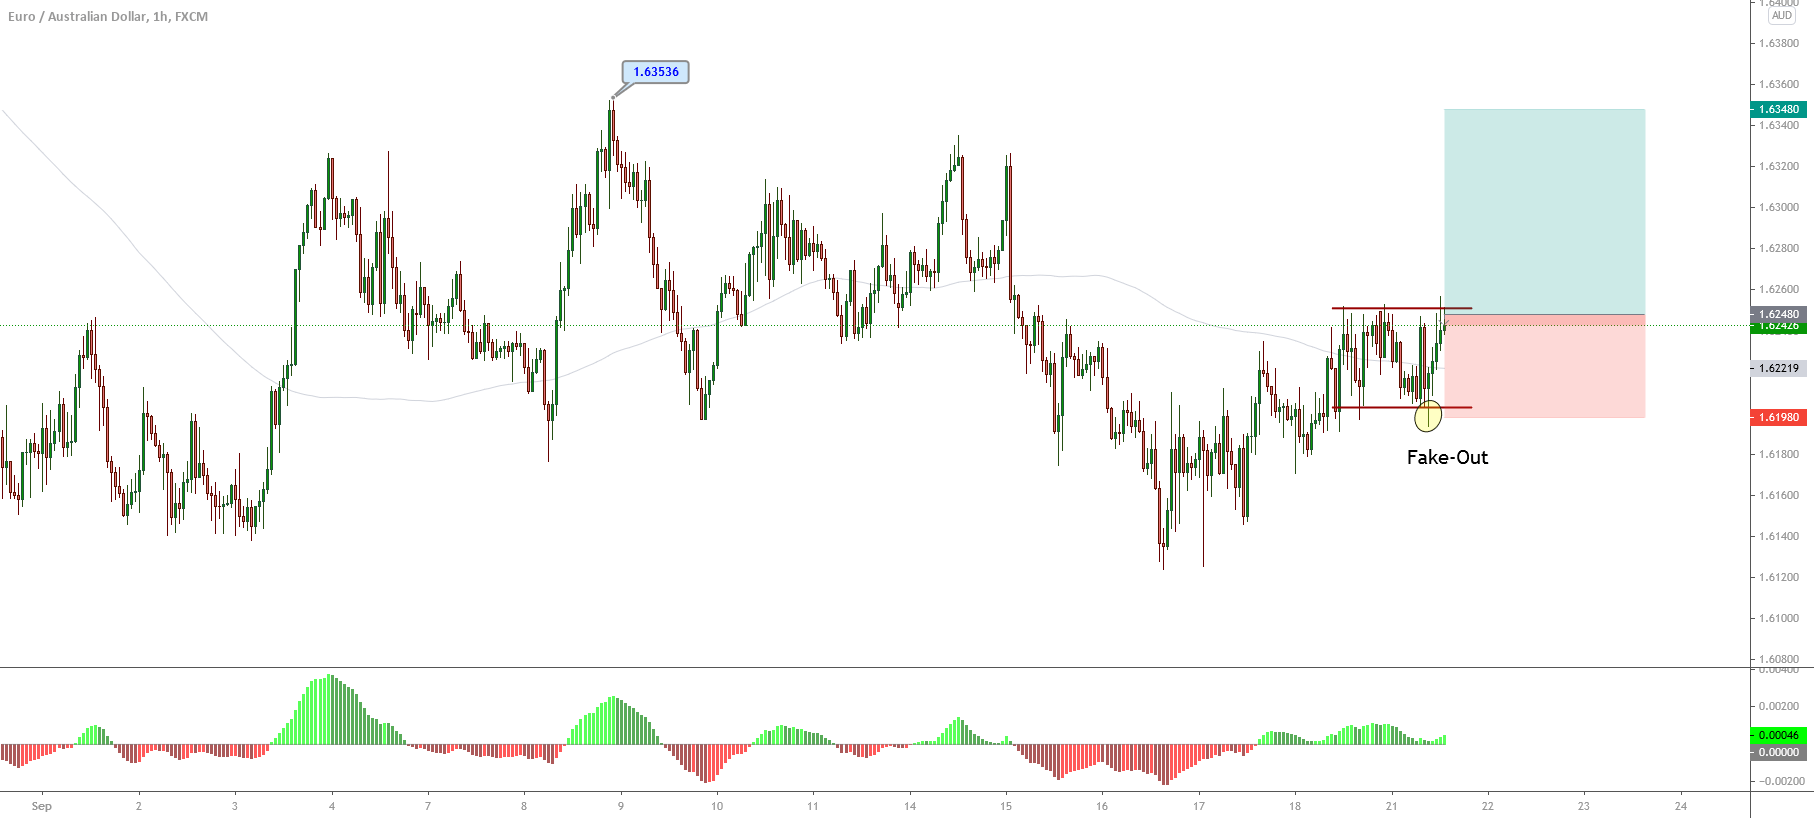
The EURAUD cross develops an intraday bullish movement in the first trading session of the week after revealing a false bearish breakdown exposed in the sideways range that the cross sets since Friday, September 18th.
EURAUD, in its hourly chart, illustrates a short-term bullish sequence, which began on September 17th when the price reacted mainly bullish once it touched for the second time the zone of 1.61252 from where it started to advance, developing a sequence of higher highs and lower highs.
On the other hand, the MACD oscillator shows a short-term bullish bias, which supports the possibility of further advances in the EURAUD price. Likewise, although the price remains within a sideways intraday range, the channel’s upper zone’s re-test leads us to expect a bullish breakout, which increases since the price made a false break in the current trading session.
Our bullish scenario foresees an advance from the zone of 1.6248, from where we expect an advance until 1.6348, coinciding with the September 8th high. The invalidation level is located at 1.6198, which coincides with the base of the sideways channel.
Chart
Trading Plan Summary
- Entry Level: 1.6248
- Protective Stop: 1.6198
- Profit Target: 1.6348
- Risk/Reward Ratio: 2.0
- Position Size: 0.01 lot per $1,000 in trading account.
Check out the latest trading signals on the Forex Academy App for your mobile phone from the Android and iOS App Store.