The Asian session has exhibited thin trading volume and volatility amid Chinese banks will be closed in observance of the Mid-Autumn Festival. However, the eyes will remain on the ECB President Lagarde Speak later during the European session.
Economic Events to Watch Today
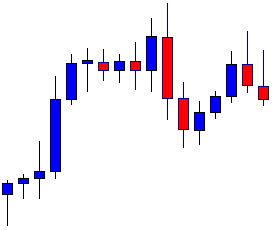
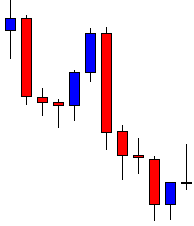
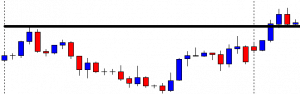
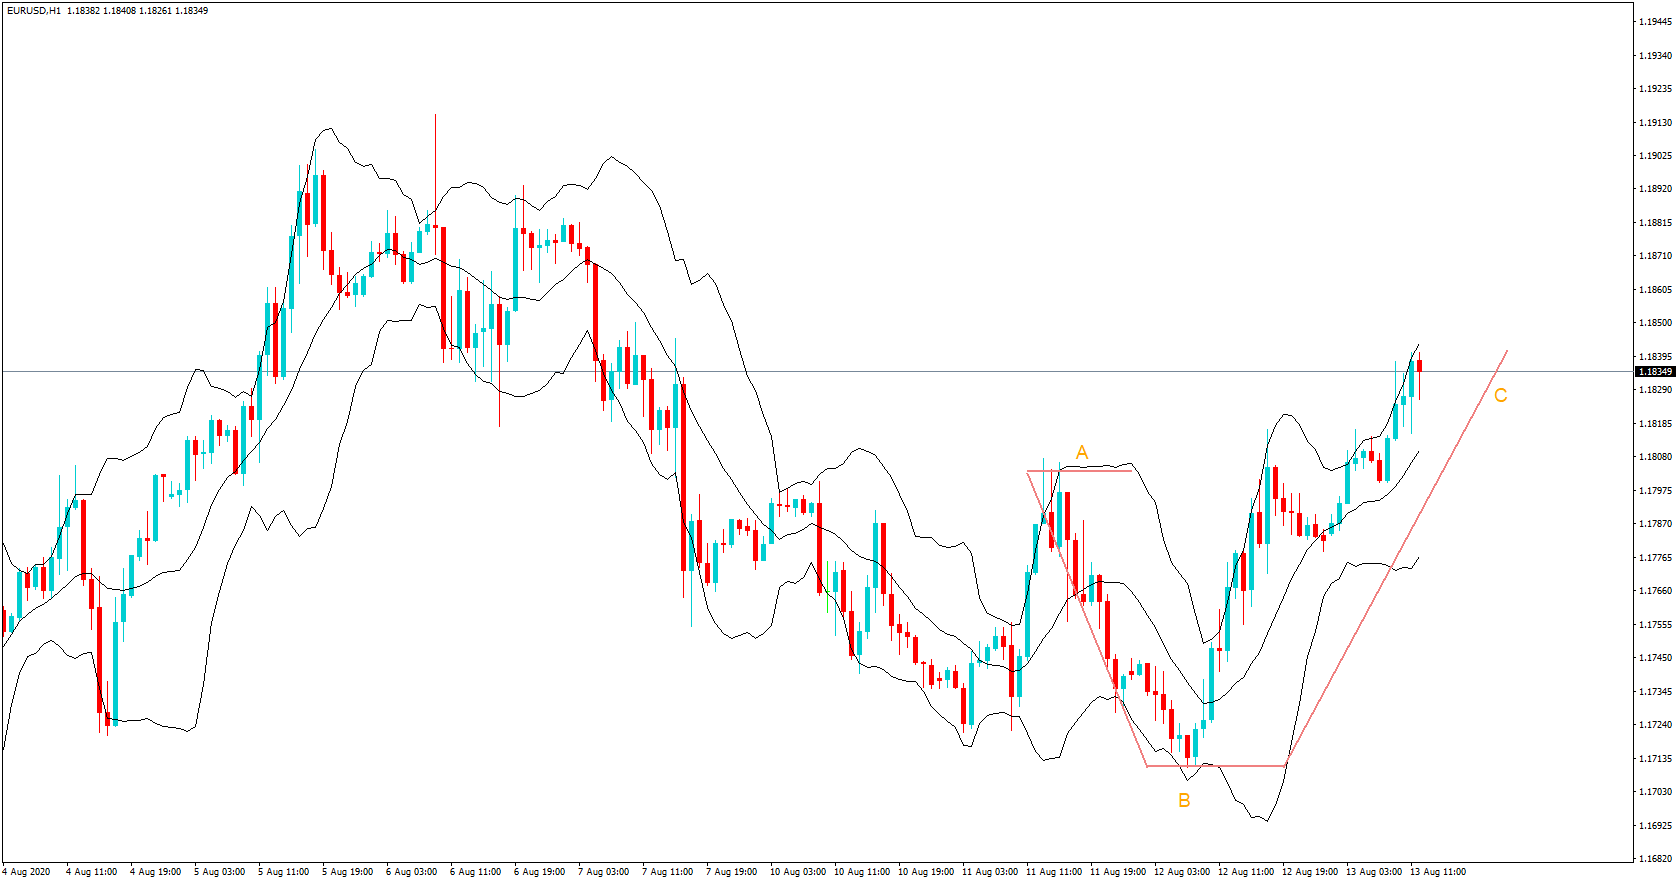
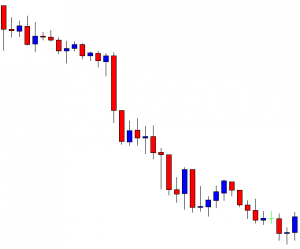
EUR/USD – Daily Analysis
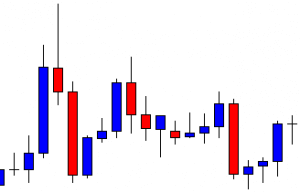
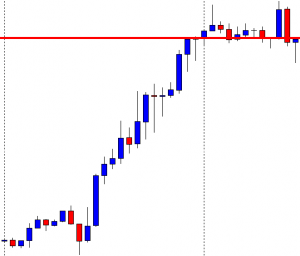
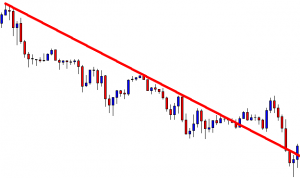
The EUR/USD pair was closed at 1.16299 after placing a high of 1.16848 and a low of 1.16120. Overall the movement of the EUR/USD pair remained bearish throughout the day. The pair dropped to its 2-months lowest level below 1.16200 level on Friday as the risk-sentiment was dropped in the market, and the U.S. dollar gained renewed strength. The strength of the greenback was the main driver of the EUR/USD pair on Friday.
The greenback posted the biggest weekly gain on Friday since March and rose to 2-months high level after the safe-haven momentum rose amid the weak economic data. The safe-haven appeal was also supported by the ongoing worries about the economic fallout from a delayed U.S. stimulus measure.
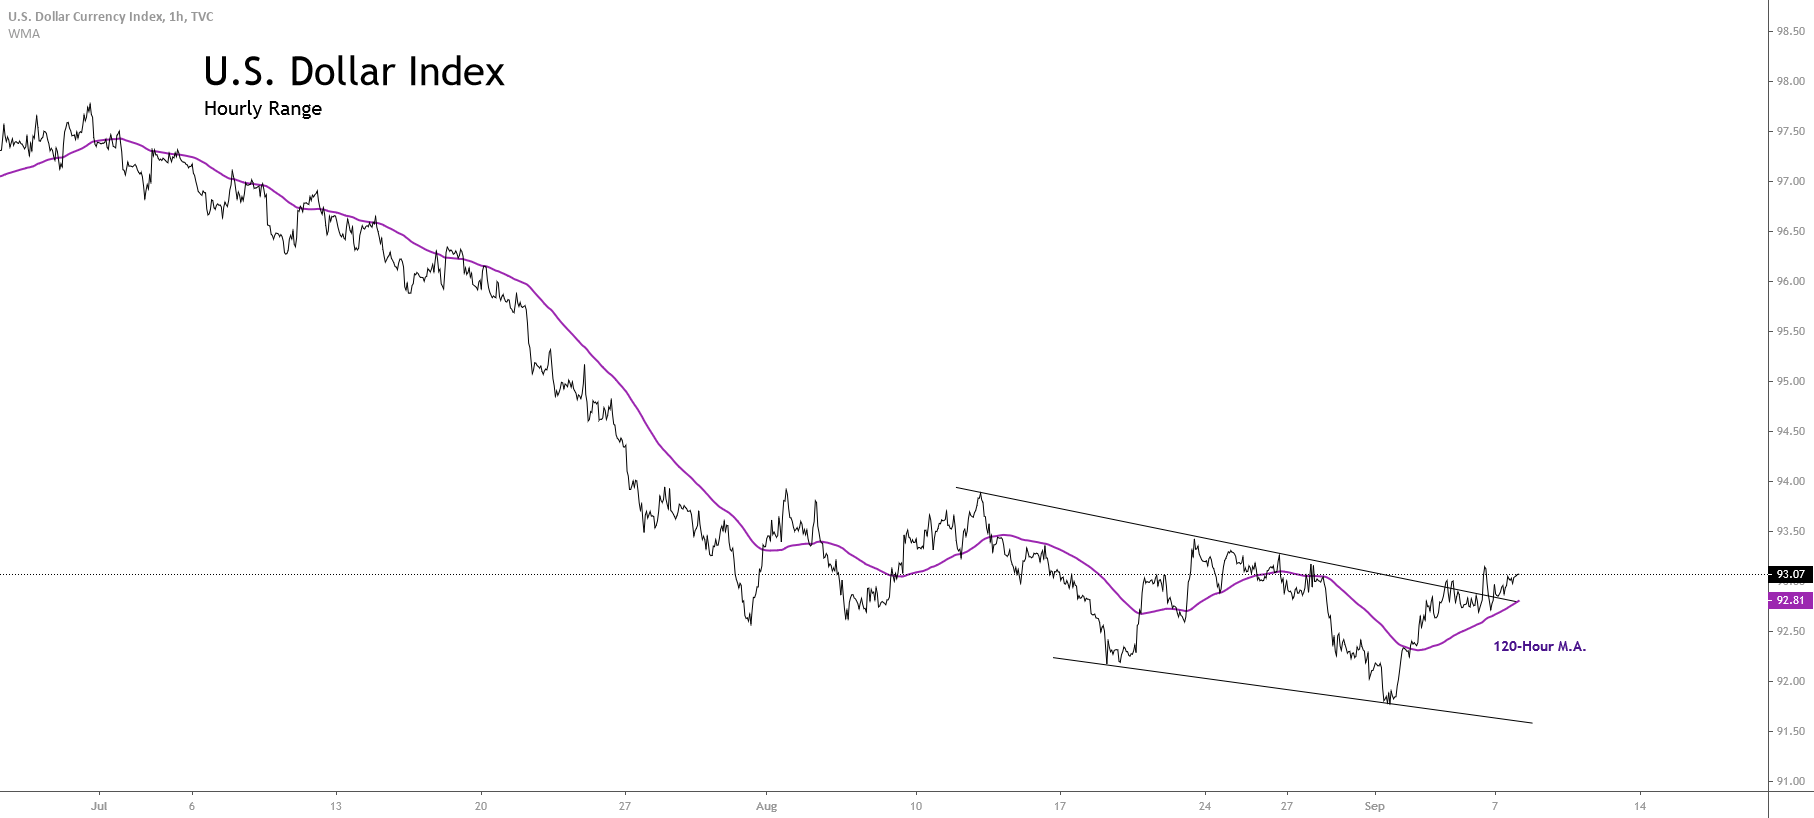
On Friday, the U.S. Dollar Index rose to its 2-months highest level above 96.6 level and weighed heavily on the EUR/USD pair. The M3 Money Supply from the E.U. dropped to 9.5% from the projected 10.0% at 13:00 GMT on the data front. Private Loans from the European Union remained flat with expectations of 3.0%. The depressing data from the E.U. added further losses in the EUR/USD pair.
From the U.S. side, the Core Durable Goods Orders in August dropped to 0.4% against the projected 1.0%, and the Durable Goods Orders also declined to 0.4% from the anticipated 1.1% and weighed on the greenback. The declining goods orders raised concerns for the economic recovery and raised the safe-haven appeal that ultimately supported the greenback. The strong U.S. dollar added further in the downward momentum of the EUR/USD pair. On the coronavirus front, the second wave of the pandemic in Europe was hitting the European countries hard as the number of coronavirus infections increased day by day. The daily count of infected people rose to an all-time high in France and the U.K. on Thursday.
France recorded 16,096 new cases in a single day, and the U.K. reported 6634 cases in 24 hours. Meanwhile, other countries also saw the highest number of infected cases since the pandemic started earlier this year.
The European Union health commissioner said that coronavirus’s situation was even worse in some member states than during the peak in March, and this weighed heavily on the local currency Euro. The declining Euro currency supported the downward momentum of the EUR/USD pair on Friday.
The rising safe-haven market sentiment kept the EUR/USD pair under heavy pressure due to its riskier nature. The U.S. dollar regained its safe-haven status and was further supported by the uncertainty in the market related to the rising number of coronavirus cases and the rising tensions between the U.S. & China that could also lead to a new cold war. The strength of the greenback kept the pair EUR/USD under pressure throughout the whole week.
Daily Technical Levels
Support Resistance
1.1636 1.1698
1.1600 1.1724
1.1573 1.1760
Pivot point: 1.1662
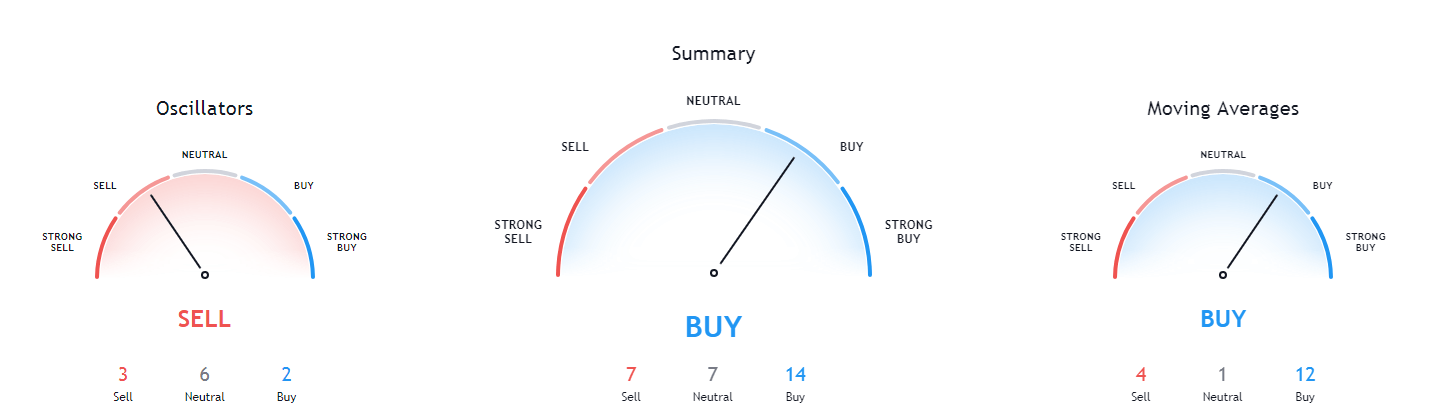
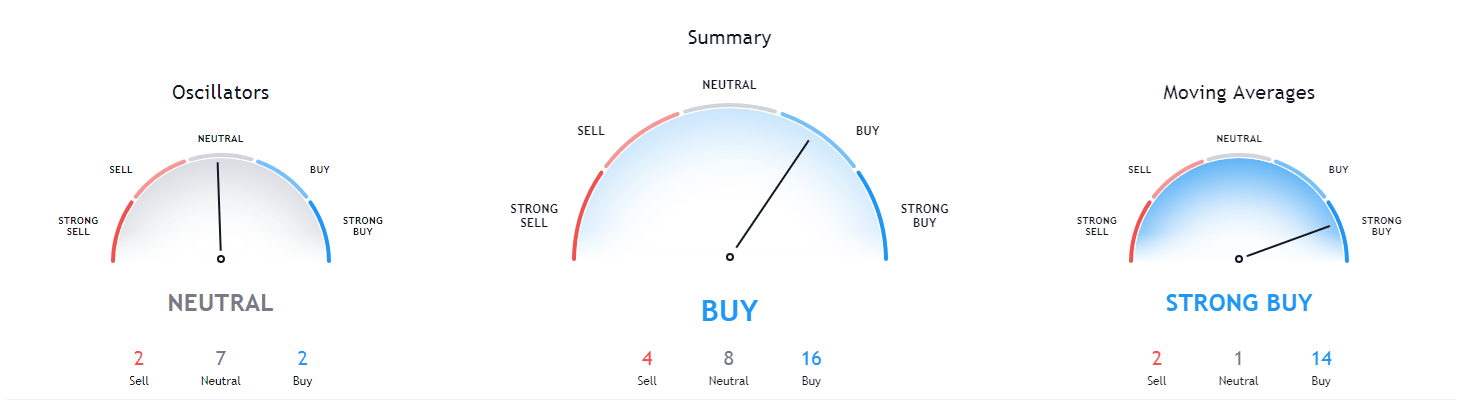
EUR/USD– Trading Tip
The bearish bias of the EUR/USD continues to dominate the market as it’s providing selling bias at 1.1650. Staying below 1.1650 level can extend the selling trend until 1.1590 level while resistance stays at the 1.1680 level today. A bullish breakout of the 1.1686 level can drive the buying trend until the 1.1760 level. Mixed bias prevails in the market today. The ECB President Lagarde Speech will remain in highlights today.
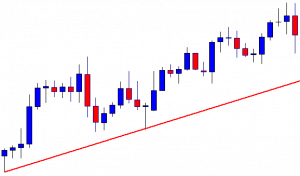
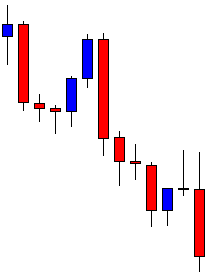
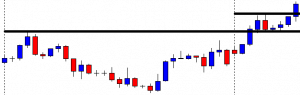
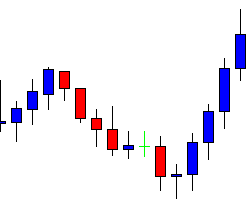
GBP/USD – Daily Analysis
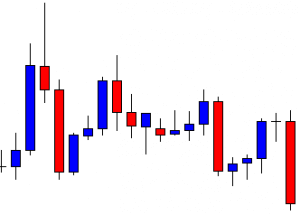
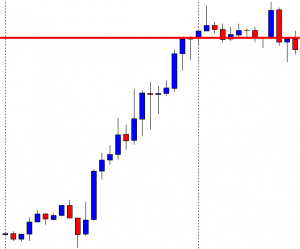
The GBP/USD currency pair extended its early-day bullish bias and took some further bids around well above the mid-1.2750 level despite the U.K. preparing to impose a total social lockdown across much of Northern Britain and potentially London. However, the reason for the bullish trend in the currency pair could be associated with the bearish sentiment surrounding the broad-based U.S. dollar ahead of the U.S. presidential debate on Tuesday and the release of U.S. economic data.
Adding to the U.S. dollar’s problem could also be the market risk-on sentiment, which tends to undermine the safe-haven U.S. dollar and contributed to the currency pair gains. Apart from this, the bullish tone around the currency pair was further bolstered by the latest positive report suggesting brighter odds of success for the key Brexit talks. On the contrary, the latest fears of strict lockdown conditions in the U.K. hampering global economic growth seem to challenge the currency pair bulls and become the key factor that kept the lid on any additional currency gains pair. At this particular time, the GBP/USD currency pair is currently trading at 1.2776 and consolidating in the range between 1.2752 – 1.2778. Moving on, the currency pair traders seem cautious to place any strong position ahead of the U.S. presidential debate on Tuesday and the release of U.S. economic data later in the week.
The market trading sentiment rather unaffected by the fears of rising COVID-19 cases in the UK, Spain, and some of the notable Asian nations like India, which keeps fueling worries that the economic recovery could be halt. However, the market trading sentiment has been reporting gains since the Asian session started, possibly due to the latest headlines suggesting a strong immune response to the coronavirus vaccine with a single dose in the early trial stages. Besides this, the market sentiment was further bolstered by the hopes of the U.S. stimulus to combat the coronavirus (COVID-19). Apart from this, the Brexit optimism also exerted a positive impact on market sentiment.
This, in turn, the broad-based U.S. dollar failed to gain any positive traction and edged lower on the day ahead of the U.S. presidential debate on Tuesday and the release of U.S. economic data later in the week. Besides, the upbeat market sentiment also keeps the USD bulls on the defensive. However, the losses in that U.S. dollar kept the GBP/USD currency pair higher. Whereas, the U.S. Dollar Index that tracks the greenback against a bucket of other currencies edged down by 0.04% to 94.588 by 10 PM ET (2 AM GMT).
At home, the Confederation of British Industry (CBI) head Carolyn Fairbairn showed some readiness about the Brexit trade deal ahead of the 9th-phase of talks starting from Tuesday. Also on the positive side is the Internal Market Bill (IMB) has ripped off the latest round of Brexit talks. This, in turn, underpinned the British Pound and extended some support to the currency pair.
On the contrary, the Irish leader Taoiseach Micheál Martin’s latest statement that the U.K. headed for no-deal Brexit eventually fueled the worries of losing a trade deal and becoming the key factor that cap further gains in the currency pair. It is worth reporting that the cost of losing a trade deal is estimated as near 1.0 million British jobs, as per the Financial Times. Meanwhile, the further burden on the economy that is yet to overcome the COVID-19 woes seems to push the BOE policymakers to defend the negative rate policies.
Across the ocean, the U.K. policymakers are ready to a strict ban on socializing due to the recent surge in the coronavirus (COVID-19) cases, which also keeps challenging the currency pair upside momentum. The re[orts also revealed that the new lockdown measures put forward a complete closure for all pubs, restaurants, and bars for two weeks initially. Looking ahead, the market traders will keep their eyes on headlines concerning Brexit, pandemic, and U.S. Presidential Election, which may offer important clues. Meanwhile, the USD price dynamics will be key to watch.
Daily Technical Levels
Support Resistance
1.2698 1.2791
1.2647 1.2833
1.2605 1.2884
Pivot point: 1.2740
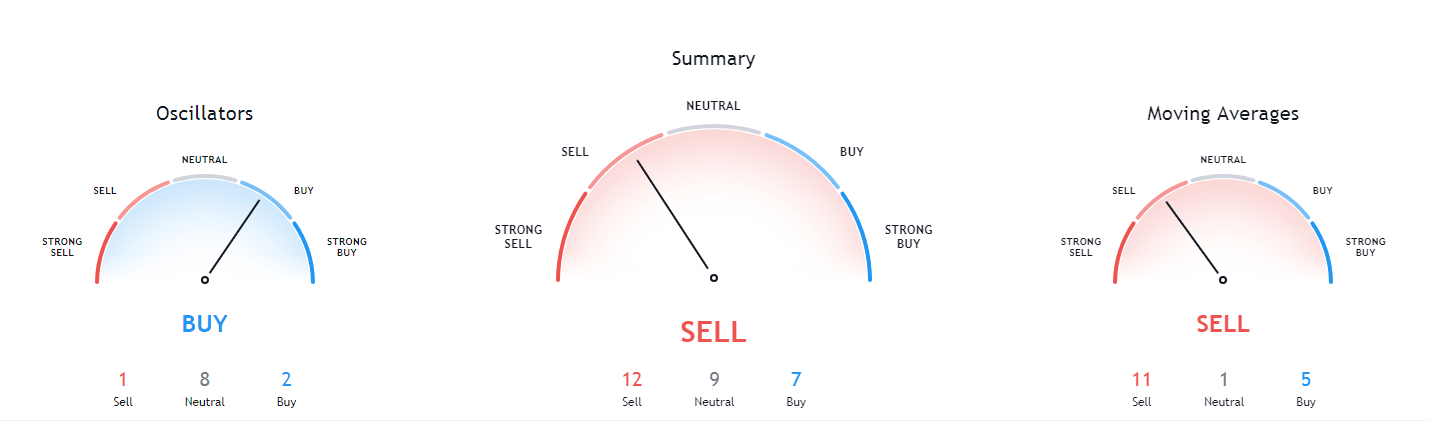
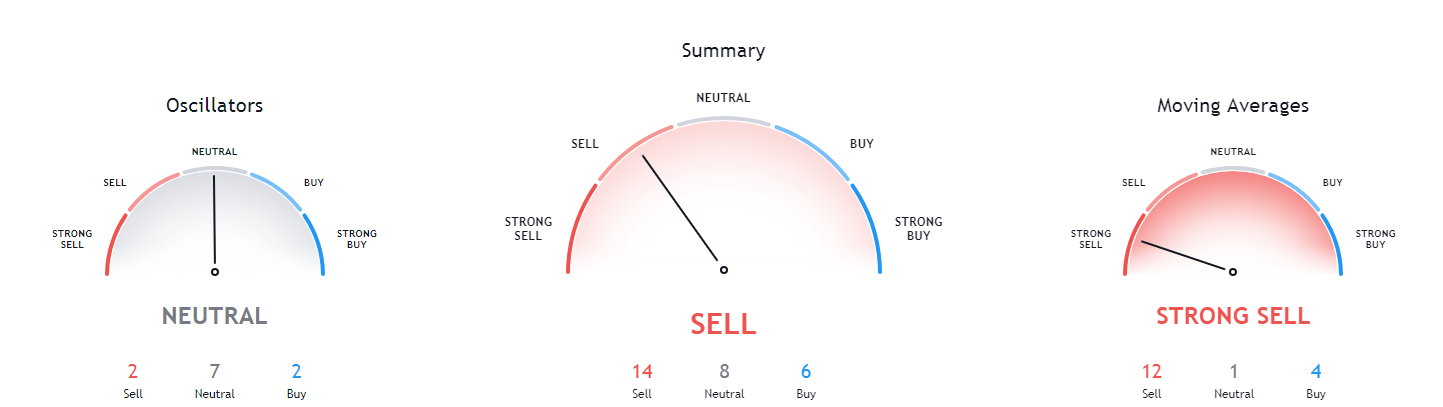
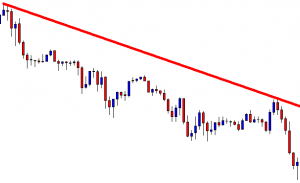
GBP/USD– Trading Tip
The cable is consolidating in a sideways trading range of 1.2770 to 1.2725 level, as it has formed an ascending triangle pattern on the hourly timeframe. A bullish breakout of 1.2770 level can lead the Sterling price towards 1.2819 level on the higher side. Bullish bias will be more substantial over the 1.2770 level and bearish below the same level today.
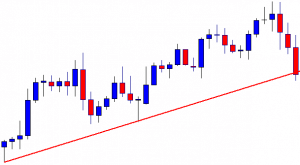
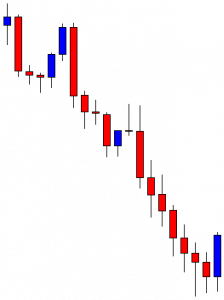
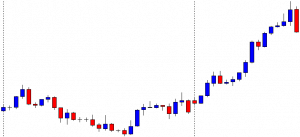
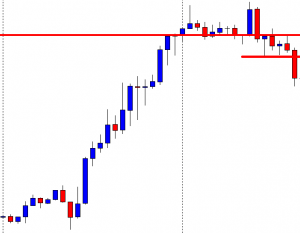
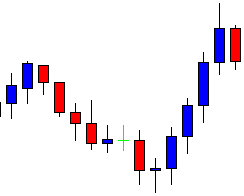
USD/JPY – Daily Analysis
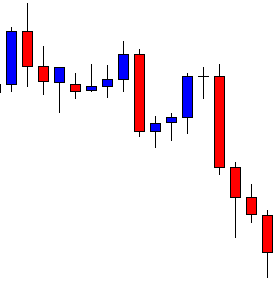
The USD/JPY currency pair extended it’s early-day losing momentum and picked up further offers around 105.30 level mainly due to the broadly weaker U.S. dollar. That was triggered by traders’ cautious mood ahead of Tuesday’s U.S. presidential election debate between President Donald Trump and Democratic candidate Joe Biden. Apart from this, the upticks in the U.S. stock futures, which refer to market risk-on sentiment, also undermined the safe-haven U.S. dollar. This, in turn, kept the currency pair under pressure. The reason for the currency pair losses could be associated with the stronger Japanese yen across the pond. Despite the upbeat tone in the Japanese stocks, the Japanese yen remains in demand across the board, which keeps the currency pair down.
On the contrary, the upbeat market mood, backed by the recently positive coronavirus (COVID-19) vaccine news and stimulus hopes, tends to undermine the safe-haven Japanese yen, which might help the currency pair to limit its deeper losses. Meanwhile, the latest Japanese Chief Cabinet Secretary Kato’s latest report that the government will not hesitate to deploy additional economic measures could also be considered one of the key factors that kept the lid on any additional losses in the currency pair.
Despite the rise in the COVID-19 cases, coupled with the expected return of lockdown conditions in major economies, the market trading sentiment started to flash green during the Monday’s Asian session amid hopes of the American stimulus, which keeps the broad-based U.S. dollar under pressure. Moreover, the cautious mood of traders ahead of Tuesday’s U.S. presidential election debate between President Donald Trump and Democratic candidate Joe Biden also kept the U.S. dollar bulls on the defensive.
The broad-based U.S. dollar failed to keep its early-day gains and edged lower before the European trading hours due to the risk-on market sentiment. Moreover, the U.S. dollar losses could also be associated with lingering doubts about the U.S. economic recovery ahead of plenty of economic data and political developments in the United States. However, the losses in the U.S. dollar kept the USD/JPY currency pair under pressure. Whereas, the U.S. Dollar Index that tracks the greenback against a bucket of other currencies edged down by 0.04% to 94.588 by 10 PM ET (2 AM GMT).
However, the market trading sentiment was supported by the hopes of the U.S. stimulus to combat the coronavirus (COVID-19). As per the latest report, the U.S. House Speaker Nancy Pelosi thinks that the COVID-19 aid package deal is possible while considering the Democratic preparation for a new package. Besides this, the New York Times alleged U.S. President Donald Trump over income tax returns of $750 for 2016 and 2017, which initially left the negative impact on the government. Afterward, the Democratic leader proved it as “fake news” while showing strong belief to have tremendous victory in the election.
Across the pond, the reason for the upbeat market mood could also be associated with the latest reports suggesting that the Confederation of British Industry (CBI) head Carolyn Fairbairn is confident about the Brexit trade deal ahead of the 9th-round of discussions, which is scheduled to start from Tuesday.
As in result, the S&P 500 Futures keeps its Friday’s upbeat performance of Wall Street while rising 0.36% to 3,298 as of writing. Although, the risk barometer seems to await clearer signals to extend the latest recovery.
At home, the new Japanese Chief Cabinet Secretary Kato told that the government would not hesitate to deploy additional economic measures if needed. This, in turn, undermined the Japanese yen currency and helped the currency pair limit its deeper losses. Looking ahead, the market traders will keep their eyes on headlines concerning Brexit, pandemic, and U.S. Presidential Election, which may offer important clues. Meanwhile, the USD price dynamics will be key to watch.
Daily Technical Levels
Support Resistance
105.22 105.56
105.04 105.72
104.88 105.90
Pivot point: 105.38
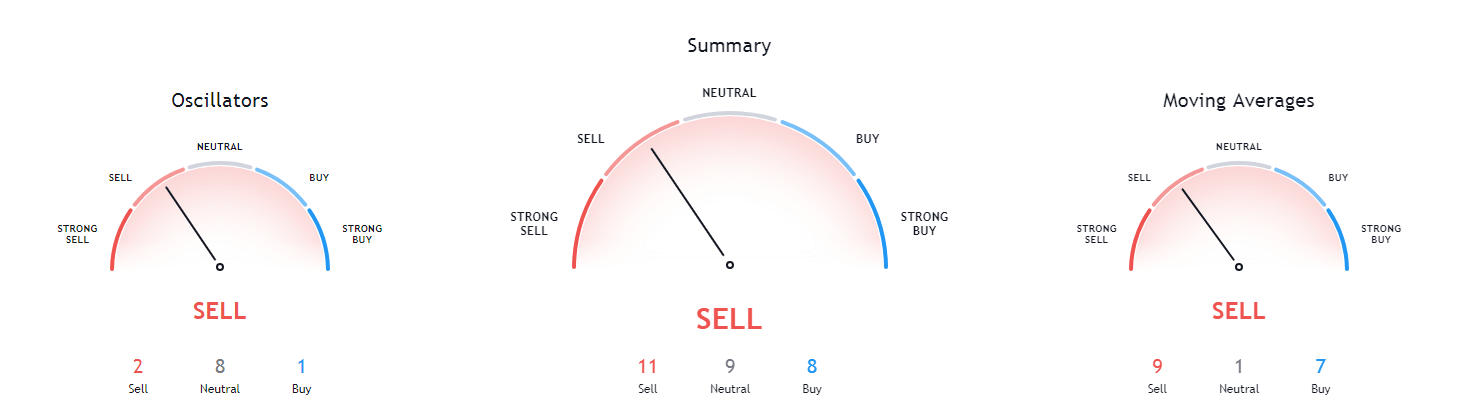
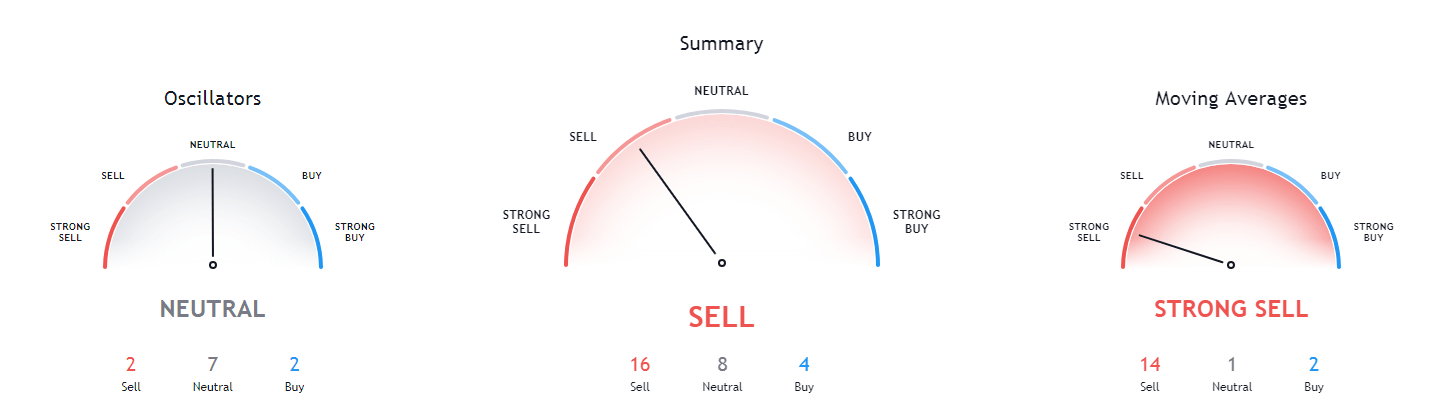
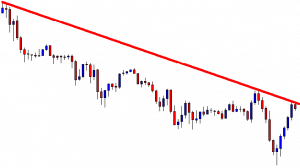
USD/JPY – Trading Tips
The USD/JPY is consolidating with a bullish bias to trade at 105.460 level, and the series for EMA is now extending at 105.550 level. On the lower side, the support holds at 104.840 level. The MACD also supports the bullish bias amid a stronger U.S. dollar and diminished safe-haven appeal. A Bullish crossover of the 105.550 level may drive more buying until 106.258. The idea is to stay bearish below 105.470 today. Good luck!