Categories
Forex Market Analysis

Daily F.X. Analysis, 13th October – Top Trade Setups In Forex – U.S. Inflation in Highlights! 

Investor’s eyes will stay on the Final CPI and Final core CPI due to the U.S. Economy. The analysts are forecasting no significant changes in the inflation rate; thus, it may go muted. However, the Claimant Count Change and Unemployment Rate data from the U.K. is likely to drive market movements. Let’s keep an eye on U.K. labor market figures and U.S. CPI m/m later today.

Economic Events to Watch Today  


EUR/USD – Daily Analysis

The EUR/USD pair was closed at 1.18109 after placing a high of 1.18265 and a low of 1.17865. Overall the movement of the EUR/USD pair remained flat throughout the day. The EUR/USD pair was flat on Monday, as the European Central Bank members reportedly downplayed expectations that it would adopt the Federal Reserve’s average inflation targeting measure, cooling bets on central banks allowing inflation to run above target.

Several ECB policymakers appeared reluctant to follow the Fed with an average inflation target on concerns it could lead to unrealistic expectations about future policy decisions. The European Central Bank has targeted an inflation policy of below but close to 2% for years. If ECB adopts average inflation targeting like Fed, this move will see the ECB allow inflation to run above its 2% target for some time to make up for periods of sluggish price increases. 

Recently, Eurozone inflation has remained short of the bank’s target. Following U.S. Federal Reserve on inflation targeting measure could allow inflation to rise above 2% and makeup periods of lagging price pressures.

Meanwhile, the signs that the second wave of coronavirus has started to weigh on growth have attracted the central bank’s attention and caused a sluggish move in the single currency Euro. On the data front, at 10:59 GMT, the German Wholesale Price Index dropped to 0.0% from the forecasted 0.2% and weighed on single currency Euro that ultimately weighed on EUR/USD pair.

On the U.S. front, the U.S. dollar remained strong onboard on Monday amid the rising hopes that a small coronavirus relief bill will be passed before elections as the talks over the massive stimulus bill stalled on the day. The new proposed bill by Trump of 1.8 trillion dollars faced rejection from both Republicans and Democrats. Republicans were reluctant to add more to the government debt pile, and Democrats wanted their 2.2 trillion packages.

After this, Trump Administration called on Congress for a small stimulus package to be funded from leftover funds and used for hardly-hit sectors like airline and small businesses. The hopes that a small package will be delivered before elections gave strength to the U.S. dollar that added pressure on EUR/USD, and the pair remained flat throughout the day.

Daily Technical Levels

Support Resistance

1.1791 1.1832

1.1767 1.1851

1.1749 1.1874

Pivot point: 1.1809

EUR/USD– Trading Tip

The EUR/USD pair is supported over 1.1790 level, which marks double bottom level on the 4-hour timeframe. Above this level, the EUR/USD is likely to bounce off until the 1.1811 level, and the bullish breakout of the 1.1831 level can also extend buying until the next target level of 1.1870. Conversely, the bearish breakout of the 1.1790 level can extend the selling trend until the 1.1750 level.

GBP/USD – Daily Analysis

The GBP/USD pair was closed at 1.30644 after placing a high of 1.30824 and a low of 1.30052. Overall the movement of the GBP/USD pair remained bullish throughout the day. The GBP/USD pair remained positive on Monday despite broad-based U.S. dollar strength. The pair traded at its four-week highest level, but the prospect remained depressed as the local country’s coronavirus situation escalated and forced to impose new restrictive measures.

The U.S. dollar was high on board after the talks for massive stimulus measures stalled again, and the Chinese yuan depreciated. The strong U.S. dollar helped cap further gains in GBP/USD pair on Monday. The latest move also weighed the gains in the GBP/USD pair from the Bank of England, who asked commercial banks earlier today about their readiness to cope with negative interest rates. On Monday, the Bank of England wrote banks to ask them how ready they were to cope with adopting negative interest rates.

This move from BoE raised concerns that it was considering cutting interest rates further to cope with the rising coronavirus cases in the U.K. The rising speculations over further rate cuts from BoE in the coming months weighed on British Pound and limited the additional gains in GBP/USD pair.

Meanwhile, the Governor of Bank of England, Andrew Bailey, said on Monday that the central bank thought Britain’s economy could struggle more than it has forecasted to recover from the coronavirus pandemic crisis. Bailey said that risk was, unfortunately, all on the downside, which added further pressure on British Pound.

Moreover, British Prime Minister Boris Johnson implemented a three-tiered system of restrictions with the closure of pubs in certain parts of England as the country was trying to deal with the rising number of coronavirus cases. These restrictive measures also exerted downside pressure on GBP/USD pair on Monday.

Furthermore, on the U.S. front, the U.S. dollar remained strong across the board after the Chinese yuan was depreciated. The Chinese city gave away 10M yuan in a lottery trial of digital currency. The latest digital currency trial was aimed at stimulating consumer spending to aid China’s economic recovery from the coronavirus pandemic.

Other than that, the U.S. dollar was also strong as the talks for a massive stimulus bill stalled again when Republicans and Democrats disagreed with passing the newly proposed bill by Trump of worth $1.8 trillion. After this, Trump Administration called on Congress to small stimulus aid for airline and small businesses. The strong U.S. dollar also kept the GBP/USD pair’s gain limited on Monday.

On the Brexit deal front, the concerns rose that negotiations could collapse as the differences between E.U. & U.K. demands were only rising. The deadline to reach a deal is just three days far, and no progress has been reported as of yet that has raised the risk sentiment in the market. The improved risk sentiment kept the GBP/USD pair higher on board.

Daily Technical Levels

Support Resistance

1.3018 1.3098

1.2971 1.3131

1.1938 1.3177

Pivot point: 1.3051

GBP/USD– Trading Tip

The GBP/USD is trading at 1.3043 level, holding right below an immediate resistance level of 1.3063. The resistance is extended by an upward channels’ trendline on the two-hourly timeframes. Below the 1.3063 resistance level, the Sterling can trigger selling until the 1.3003 level and 1.2959 level. On the higher side, a bullish breakout of 1.3063 levels can trigger buying until the 1.3127 level. The fundamental side is muted today, and the U.S. banks are closed in the observance of Columbus day; therefore, we may experience thin volatility. 

USD/JPY – Daily Analysis

The USD/JPY pair was closed at 105.317 after placing a high of 105.817 and a low of 105.240. Overall the movement of the USD/JPY pair remained bearish throughout the day. The USD/JPY pair failed to cheer the Chinese Yuan depreciation and U.S. dollar strength on Monday and continued decline over the fresh hopes that the U.S. stimulus aid package will be delivered before the elections.

The people’s Bank of China removed a 20% reserve requirement ratio for yuan forward settlements that undermined the cost of shorting yuan and weighed on the Chinese currency. But investors failed to take advantage of this depreciation in yuan, and the pair USD/JPY remained depressed in the market.

The rising number of coronavirus cases worldwide and the increased restrictions to curb the coronavirus pandemic’s effect raised the safe-haven appeal and supported the Japanese Yen that weighed on the USD/JPY pair. Meanwhile, the absence of key macroeconomic events due to the U.S. and Canada celebrating Columbus Day and Thanksgiving respectively exerted more pressure on the USD/JPY pair.

On the Japan front, the Bank Lending for the year was released at 04:50 GMT that remained flat at 6.4%. The Core Machinery Orders raised to 0.2% from the forecasted -1.0% and supported the Japanese Yen that weighed on the USD/JPY pair. Whereas, the PPI for the year from Japan decreased to -0.8% against the forecasted -0.5%. At 10:58 GMT, the Prelim Machine Tool Orders for the year remained flat at -15.0%.

Furthermore, the newly proposed U.S. stimulus measure of $1.8 trillion by Trump also faced rejection from both parties. In response to this, the Trump administration asked Congress to provide Americans with a small relief fund specifically for airlines and small businesses before elections.

The hopes that a small package could be passed before elections and a massive stimulus package after elections weighed on the U.S. dollar and added further losses in the USD/JPY pair on Monday.

Moreover, the White House physician Sean Conley said that U.S. President Donald Trump was free of transmission risk to others on Saturday. On Sunday, Trump claimed that he was now immune from the coronavirus, but the chances to get infected remained again. Trump was tested positive for coronavirus on first October, and he has been getting medical assistance since then. The news that Trump was getting better and has no transmission risk raised risk sentiment and capped further losses in the USD/JPY pair by weighing on safe-haven Japanese yen.

Daily Technical Levels

105.05 105.70

104.82 106.12

104.40 106.36

Pivot point: 105.47

USD/JPY – Trading Tips

On Tuesday, the USD/JPY traded sharply bearish to drop from 105.900 level to the 105.450 mark. Most of the selling triggered after the USD/JPY violated an upward channel at 105.900 level. Currently, the USD/JPY pair is trading at 105.459 level, the support level that’s extended by double bottom level. A bearish breakout of 105.450 level may drive further selling until the 105.070 support level as the MACD, and the 50 periods EMA are in support of selling bias today. Let’s consider opening sell trade below 105.40 level today. Good luck!  

Categories
Forex Signals

EUR/JPY Breaks Below Upward Channel at 124.850 – Quick Update on Sell Signal! 

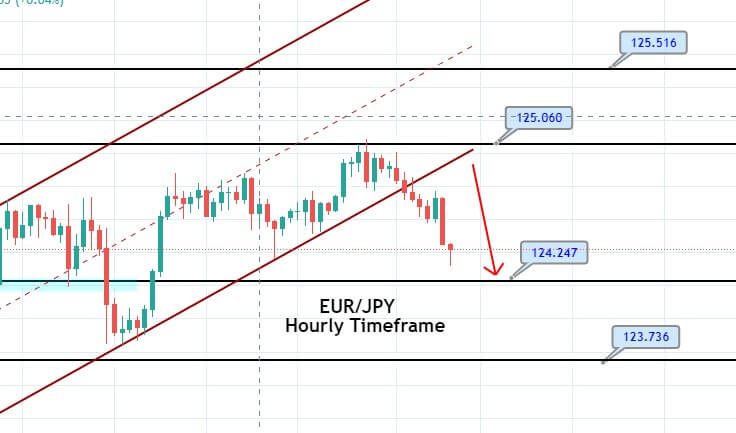
Today in the European trading session, the EUR/JPY currency pair failed to stop its previous session losing streak and remain depressed around below the 124.50 marks. However, the bearish bias around the currency pair could be associated with upbeat Japan’s Machinery Orders data, underpinning the Japanese yen currency and contributing to the currency pair declines. Apart from this, Europe’s intensified coronavirus concerns undermined the shared currency and add further pessimism around the currency pair. On the contrary, the prevalent market risk-on sentiment tends to undermine the safe-haven Japanese yen, which becomes the key factor that helps the pair to limit its deeper losses. At this particular time, the EUR/JPY currency pair is currently trading at 124.38 and consolidating in the range between 124.32 – 125.08.

As we all well aware that the coronavirus resurgence in Europe is intensifying, which fueled the worries over the EUR economic recovery. As per the latest report, France has reported record-high new daily cases of approximately 27K during the recession. At the Spain front, Catalonia and Navarre’s regions will tighten restrictions on working and public gatherings after the continued rise in COVID-19 cases, which keeps the shard currency under pressure and contributed to the currency pair losses.

Across the pond, the market trading sentiment has been flashing mixed signals since the day started. Be it the American lawmakers’ failure to offer any positive announcement on the coronavirus (COVID-19) relief package or the on-going in the Sino-American tussle, not to forget the no-deal Brexit fears, these all factors have been weighing on the market risk tone. This, in turn, underpinned the safe-haven Japanese yen and dragged the currency pair further lower.

Across the pond, upbeat Japan’s Machinery Orders data also supported the Japanese yen currency, which keeps the currency pair under pressure. At the data front, the August month’s Machinery Orders recovered from -16.2% previous and -15.6% forecast to -15.2% YoY. On the other hand, the Producer Price Index (PPI) for September dropped below -0.5% expected and previous readings to -0.8%.

On the contrary, the market risk sentiment recently got lift by the positive reports suggesting that Trump had fully recovered from his bout with COVID-19. These hopes were further fueled after his physician Sean Conley stating that he is no longer an infection risk. This, in turn, boosted the market trading sentiment and helped the currency pair limit its deeper losses.


Daily Support and Resistance

S1 121.85

S2 122.64

S3 123.04

Pivot Point 123.43

R1 123.83

R2 124.22

R3 125

Technically, the EUR/JPY is trading at 124.450 level, having violated the upward channel supporting the pair at 124.800 level. For now, the EUR/JPY may find resistance at 124.800, and on the lower side, the pair may drop until 124.247. The leading indicators, such as MACD and RSI, are holding below 50, suggesting the odds of further selling bias among traders. Check out the forex trading signal below… 

Entry Price – Buy 124.439

Stop Loss – 124.839

Take Profit – 124.039

Risk to Reward – 1:1

Profit & Loss Per Standard Lot = -$400/ +$400

Profit & Loss Per Micro Lot = -$40/ +$40

Fellas, now you can check out forex trading signals via Forex Academy mobile app. Follow the links below.

iPhone Users: https://apps.apple.com/es/app/fasignals/id1521281368

Andriod Users: https://play.google.com/store/apps/details?id=academy.forex.thesignal&hl=en_US

Categories
Crypto Market Analysis

Daily Crypto Review, Oct 12 – Crypto Market Consolidating After a Surge: What’s Next?

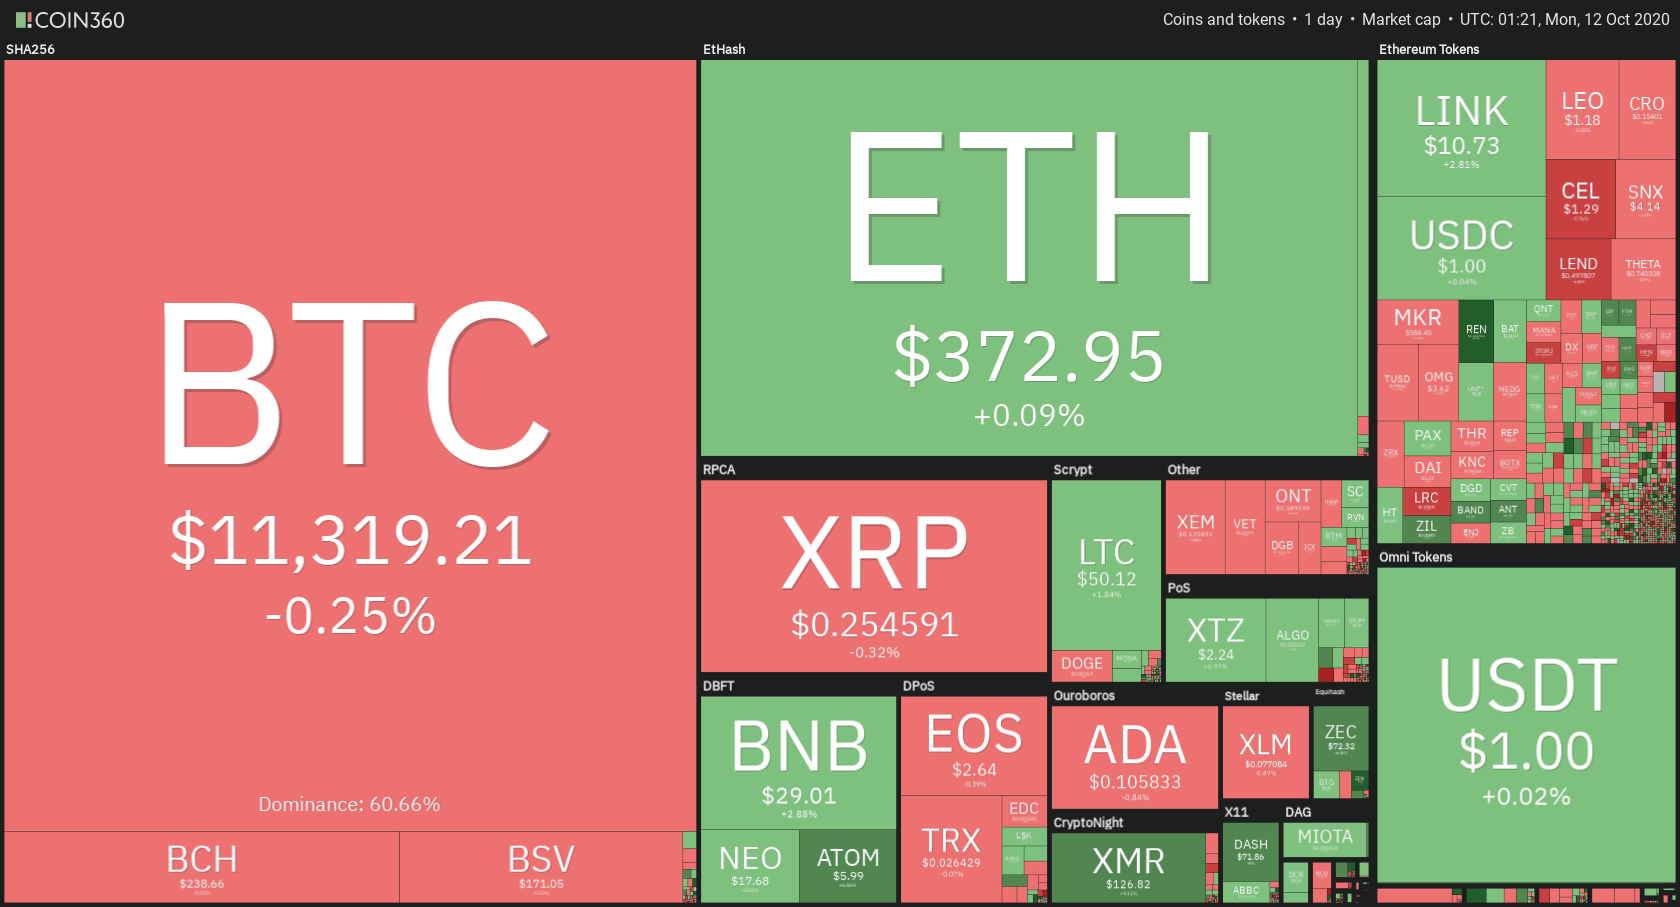
The cryptocurrency sector has experienced a surge over the weekend as Bitcoin pushed above $11,000. Bitcoin is currently trading for $11,319, representing a decrease of 0.25% on the day. Meanwhile, Ethereum gained 0.09% on the day, while XRP gained 0.32%.

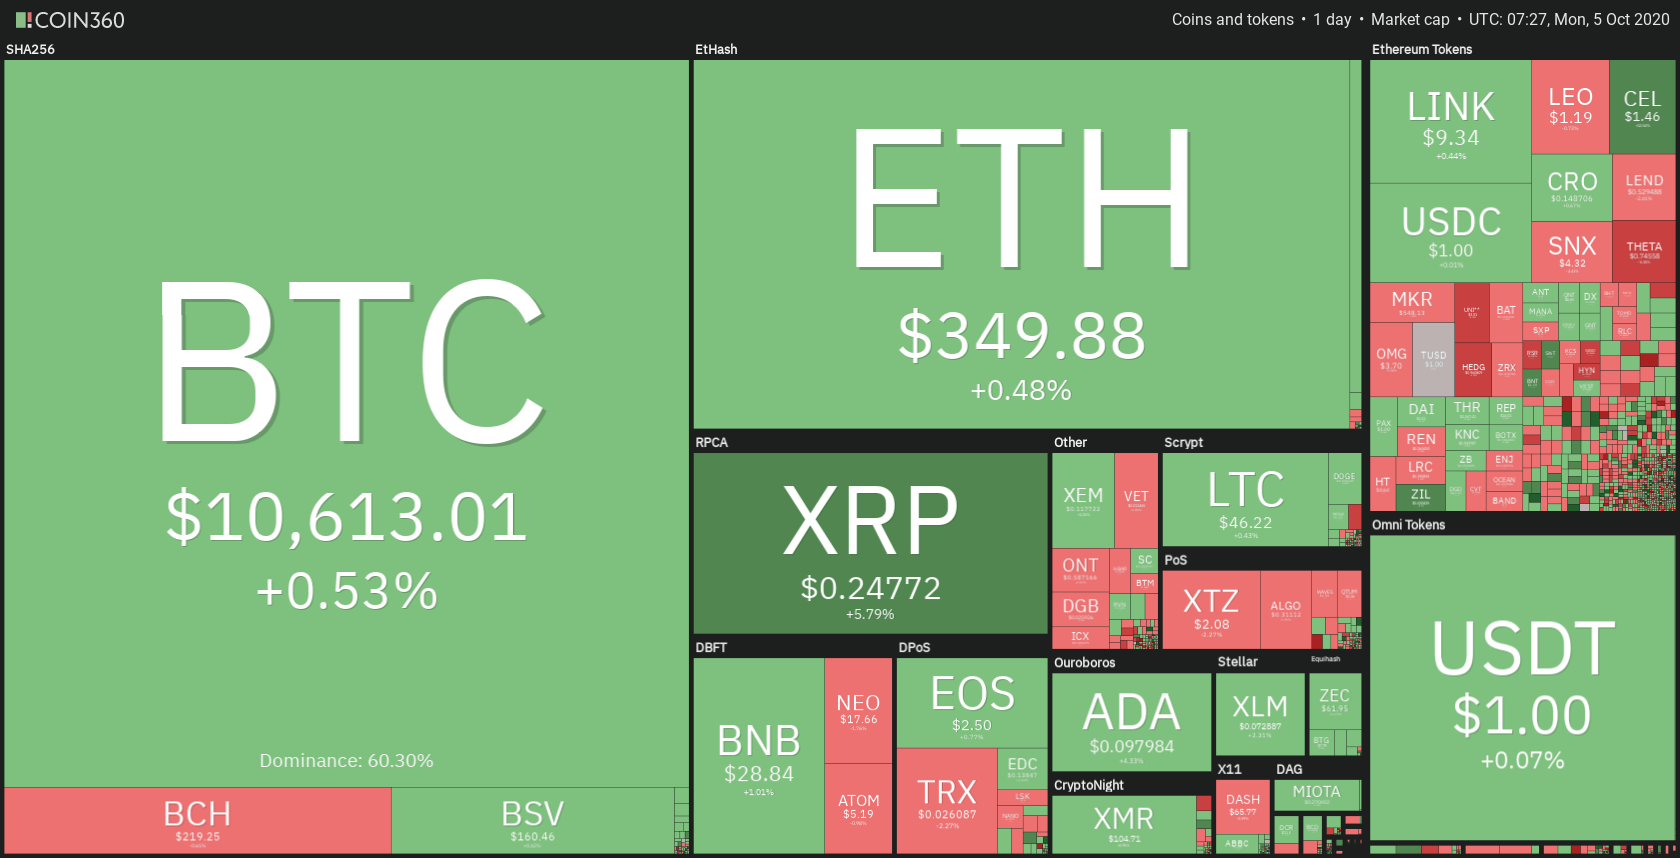
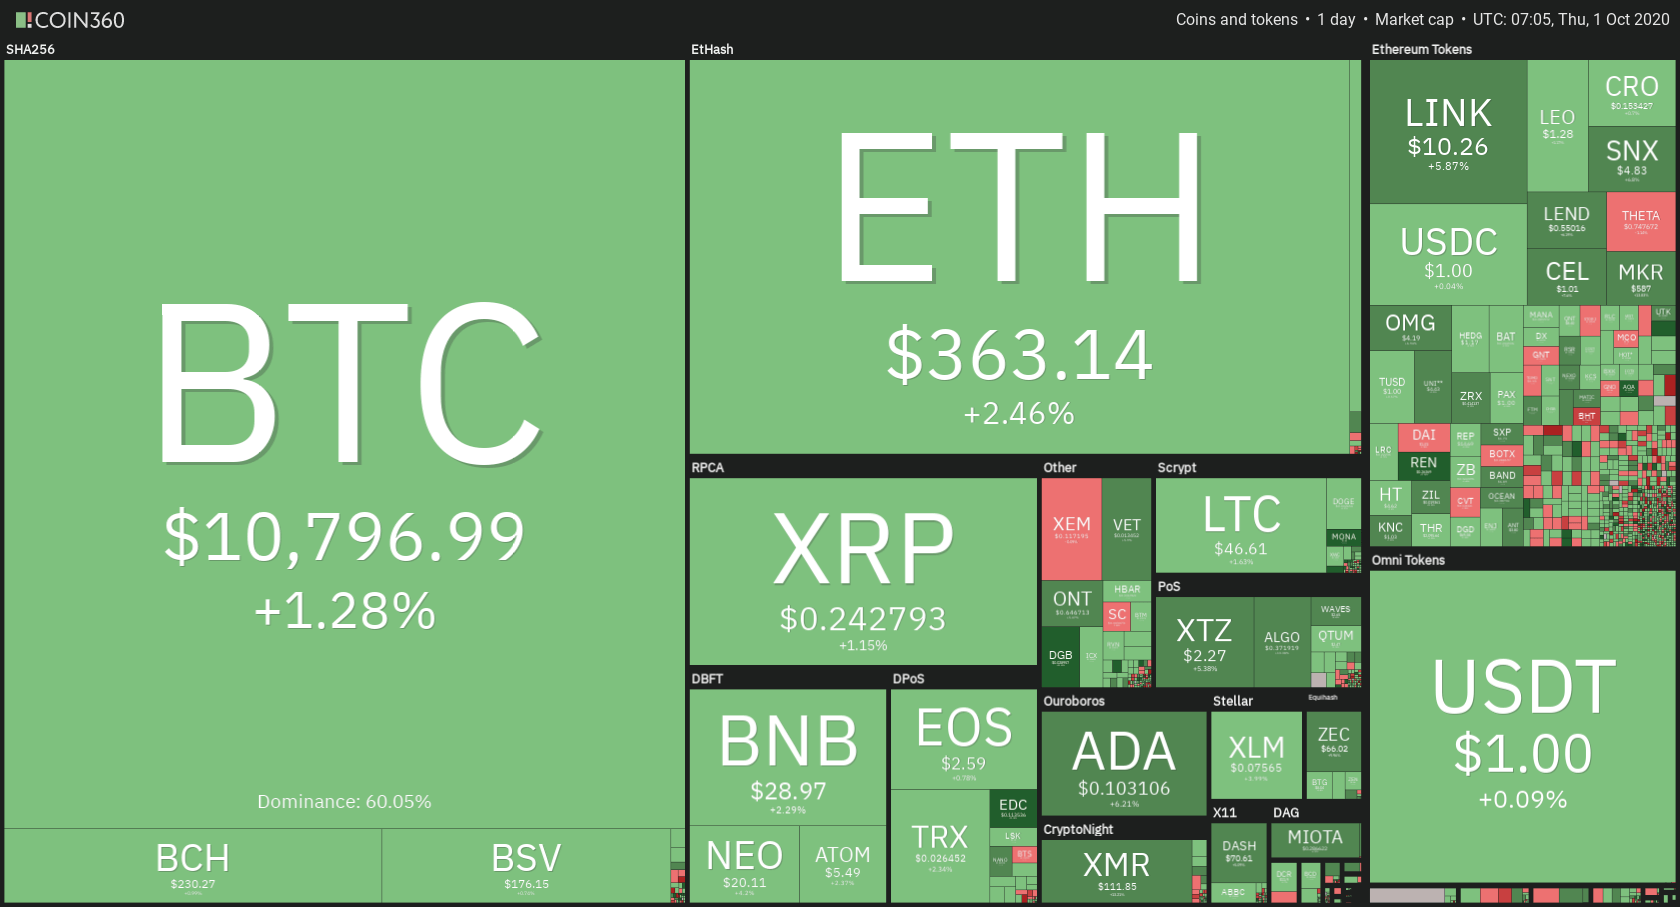
 Daily Crypto Sector Heat Map

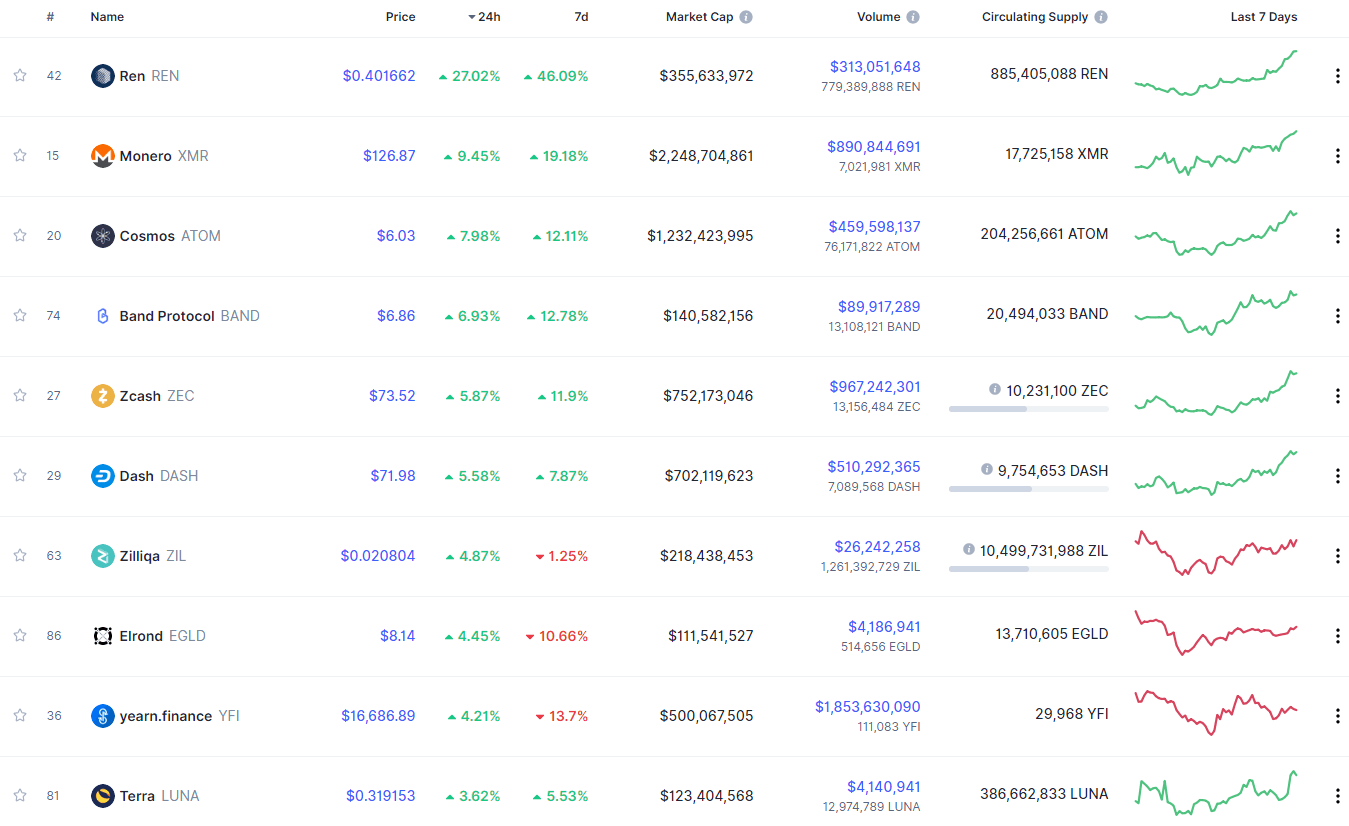
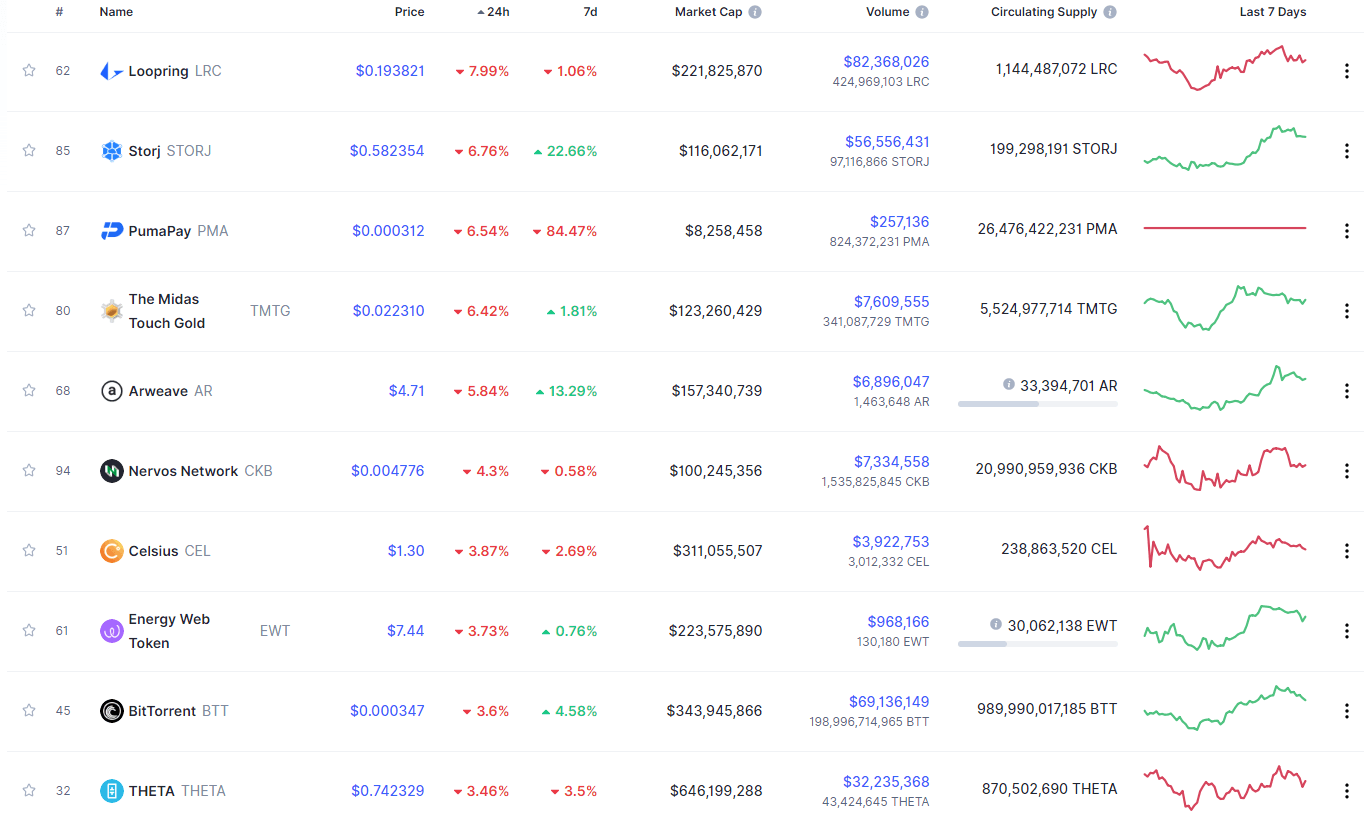
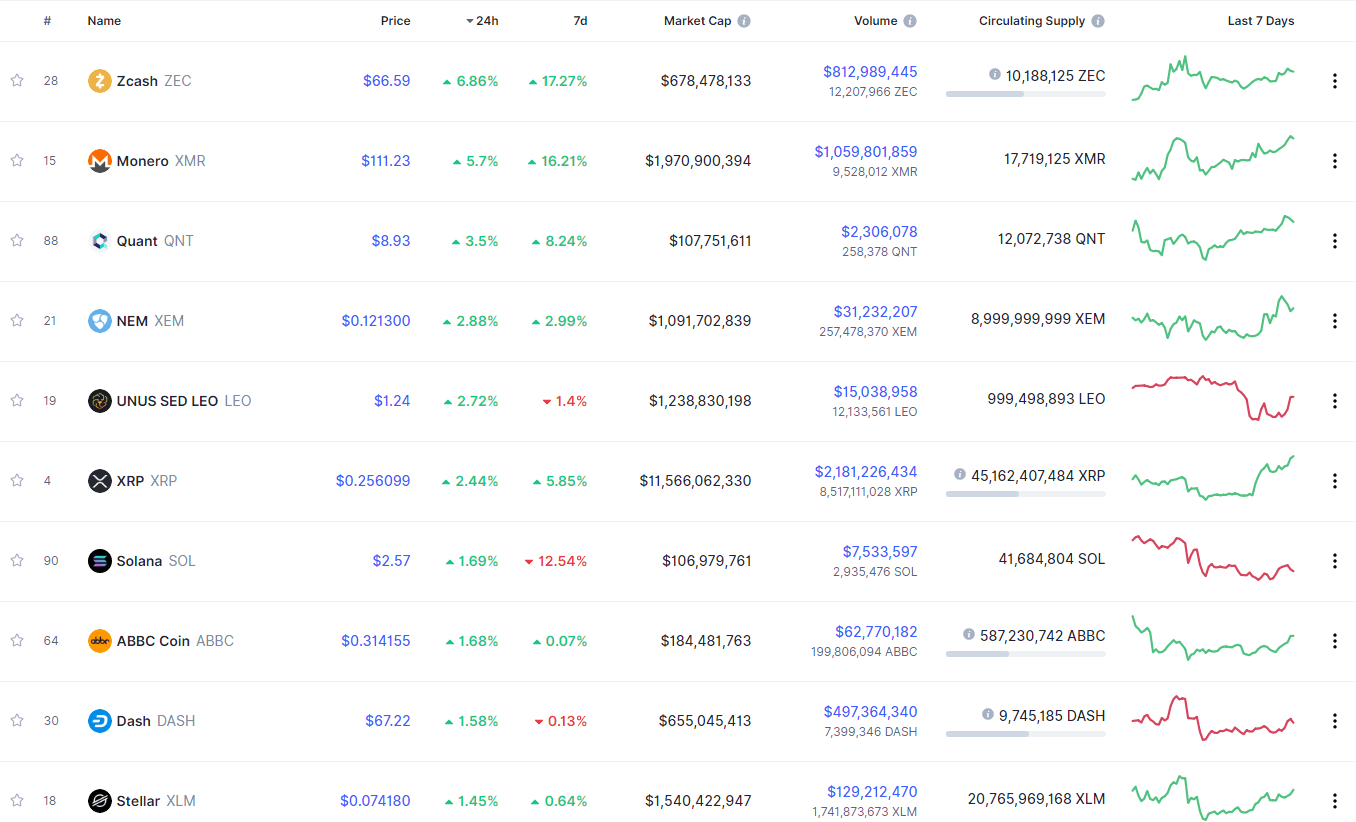
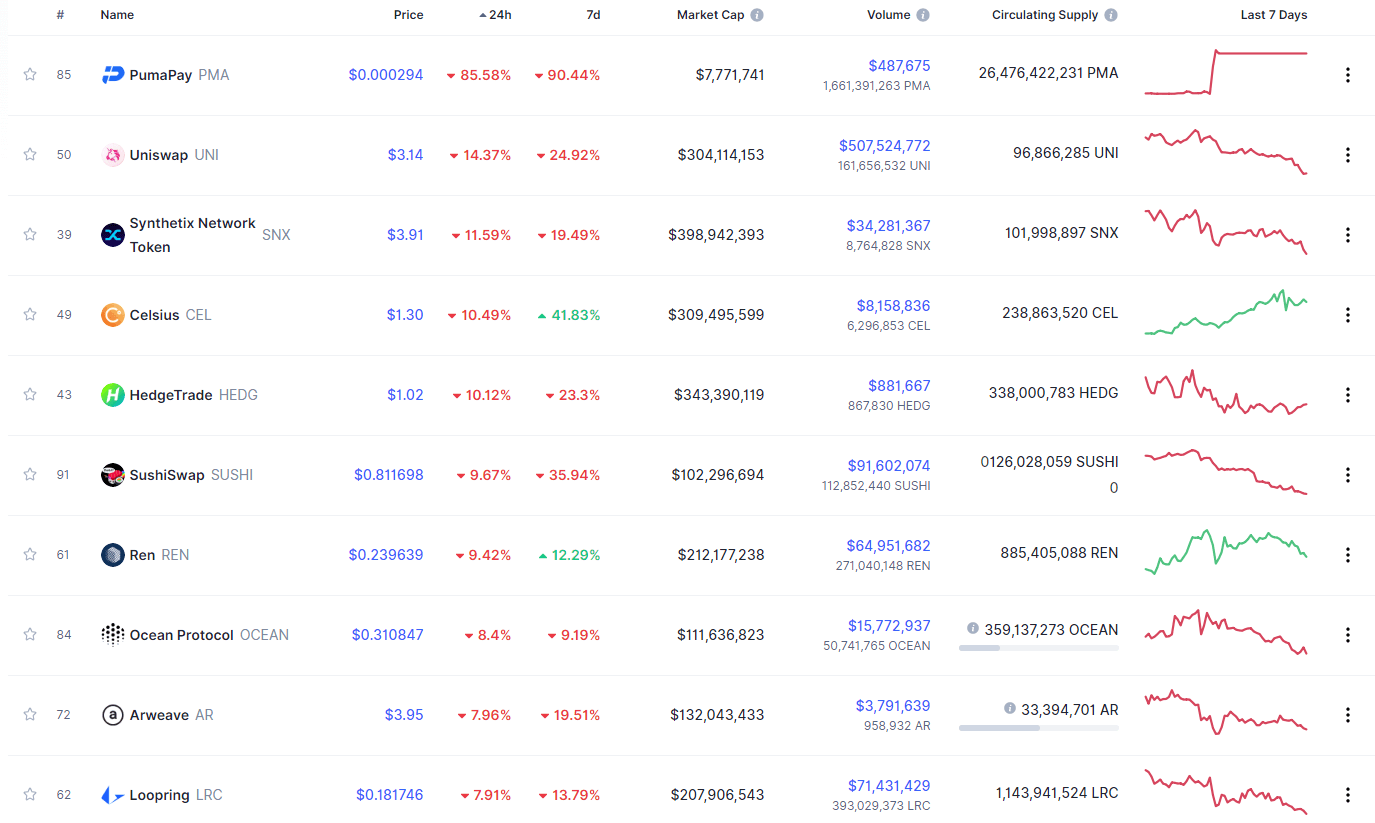
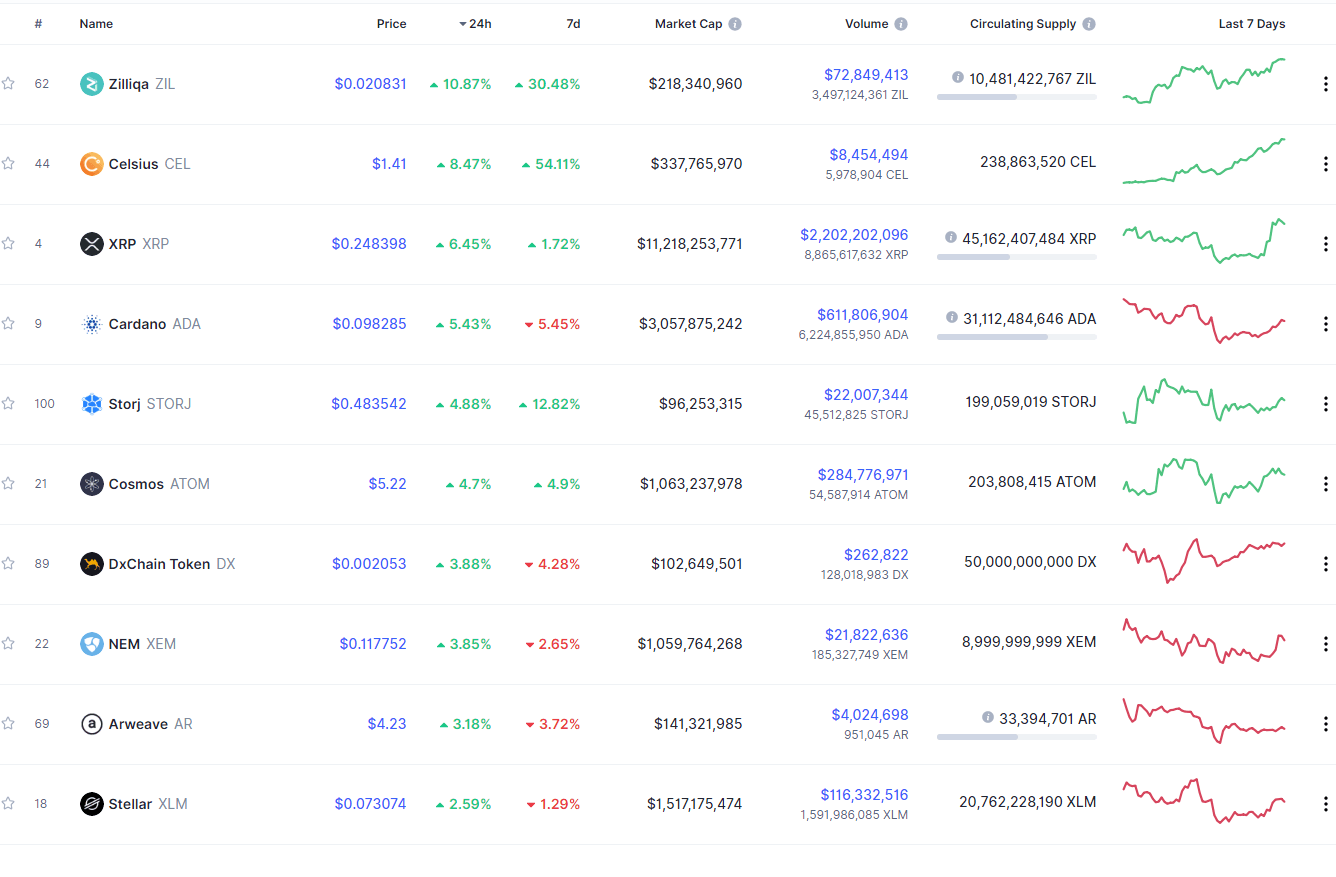
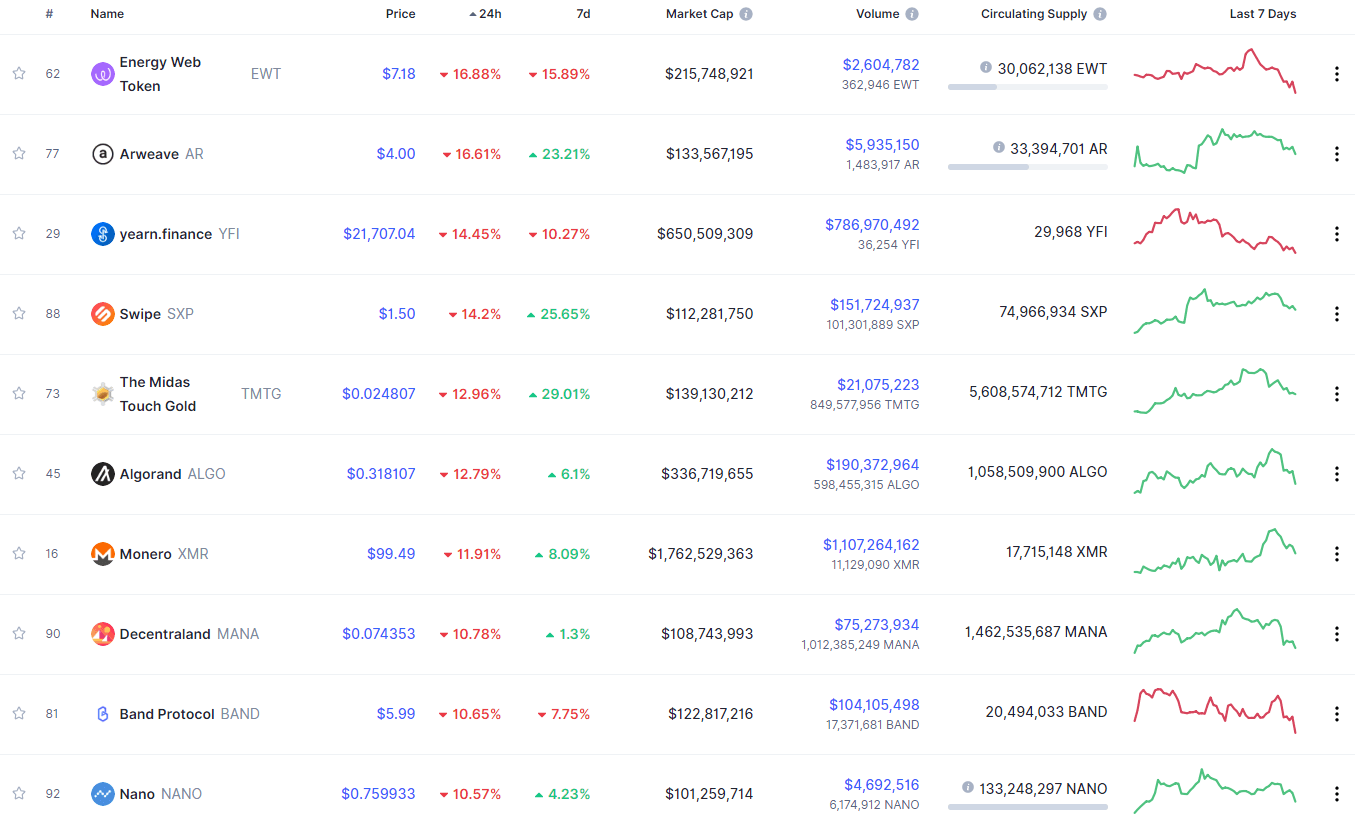
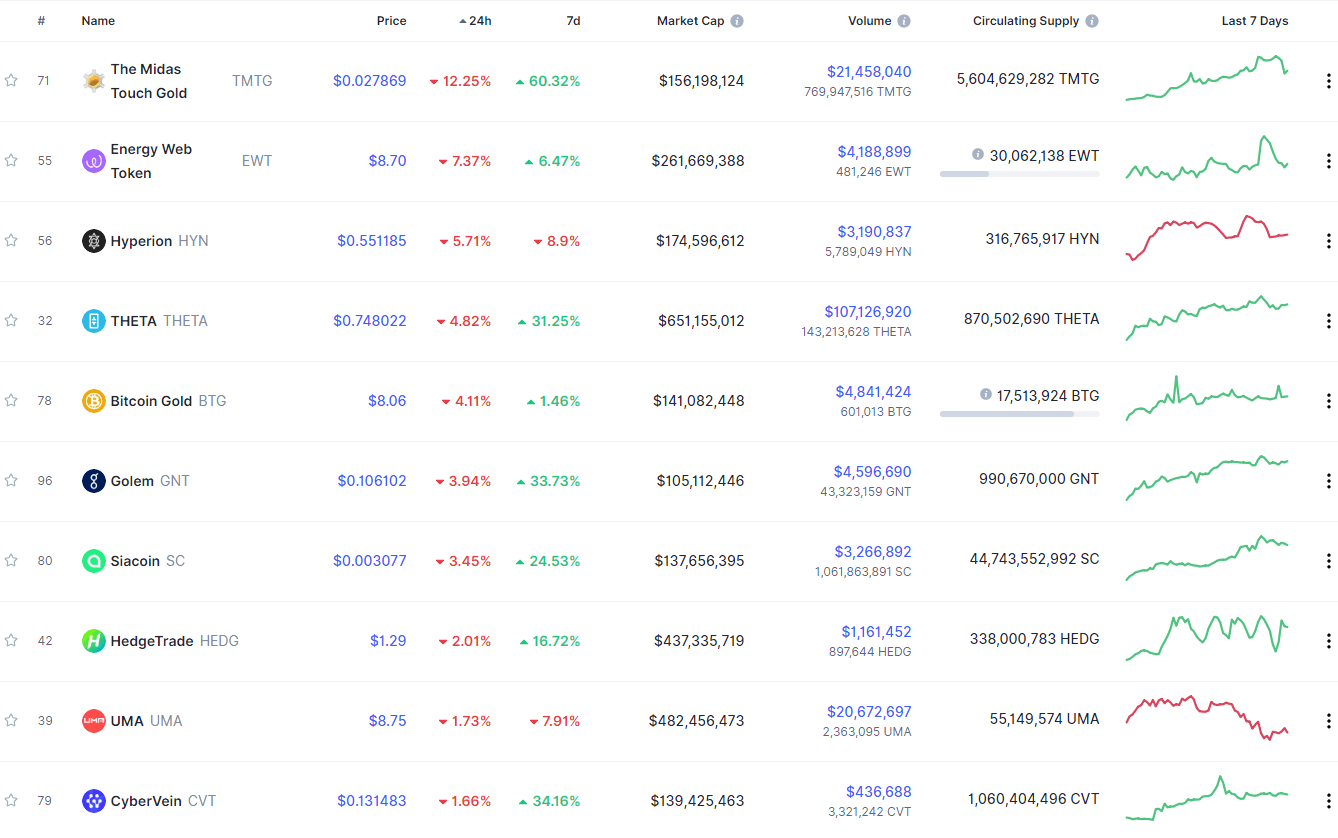
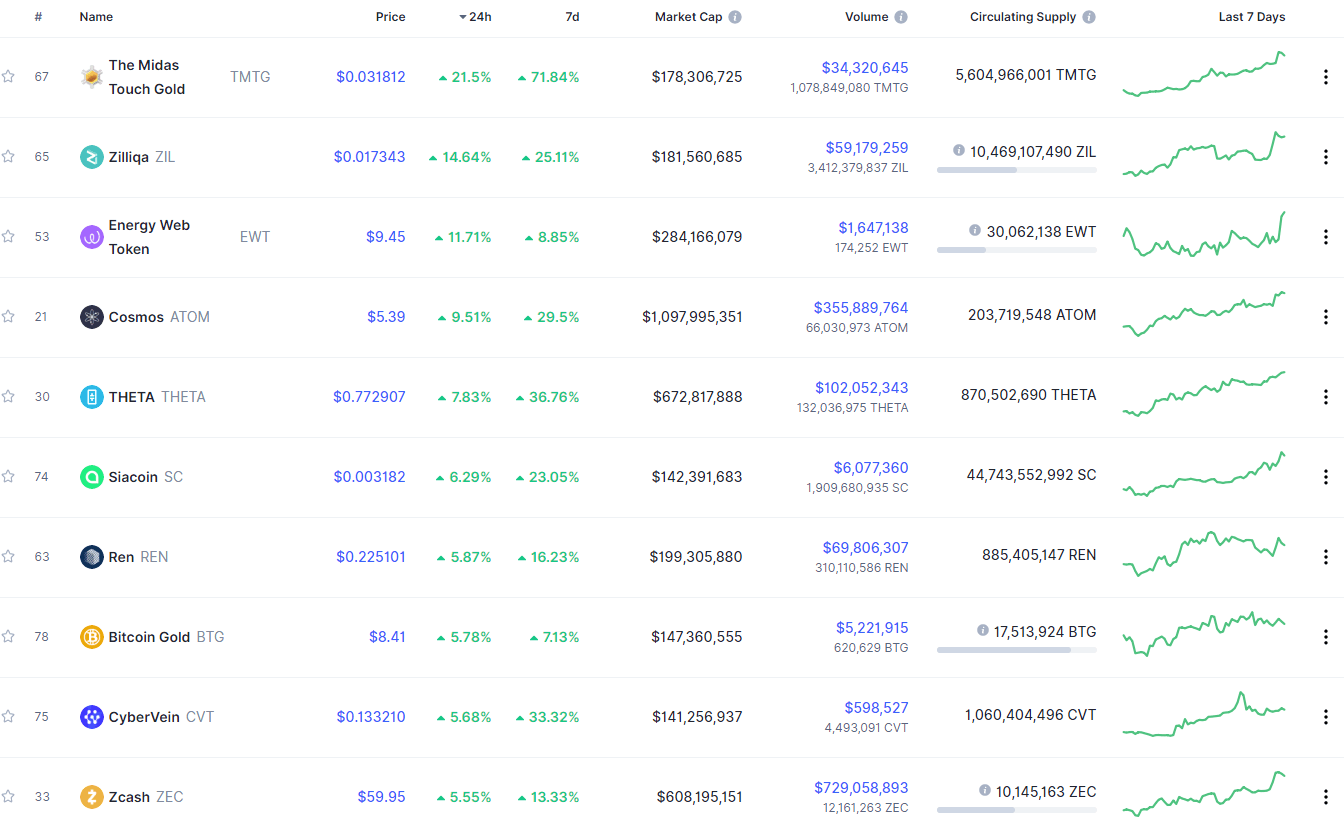
Taking a look at the top 100 cryptocurrencies, we can see that Ren gained 27.02% in the past 24 hours, making it the top daily gainer. Monero (9.75%) and Cosmos (7.98%) also did great. On the other hand, Loopring lost 7.99%, making it the most prominent daily loser. It is followed by StorJ’s loss of 6.76% and PumaPay’s loss of 6.54%.

Top 10 24-hour Performers (Click to enlarge)

Bottom 10 24-hour Performers (Click to enlarge)

Bitcoin’s market dominance level has decreased slightly since our last report, with its value currently being 60.66%. This value represents a 0.67% difference to the downside when compared to when we last reported.

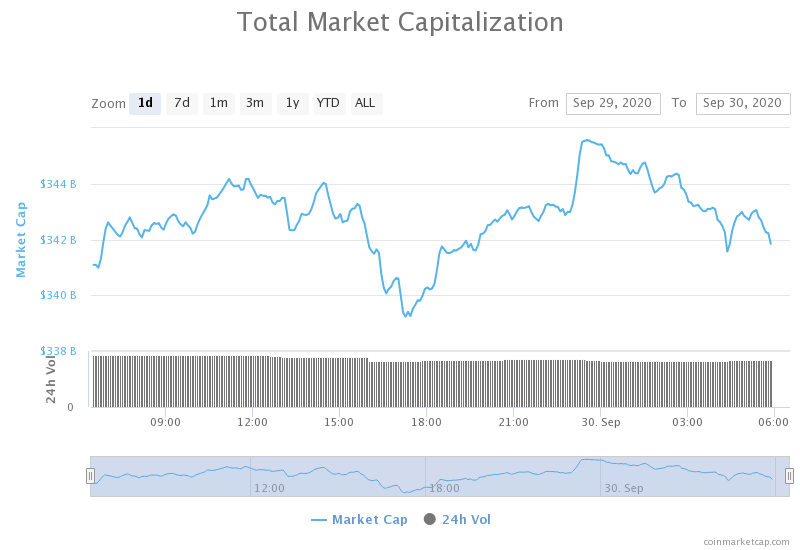
Daily Crypto Market Cap Chart

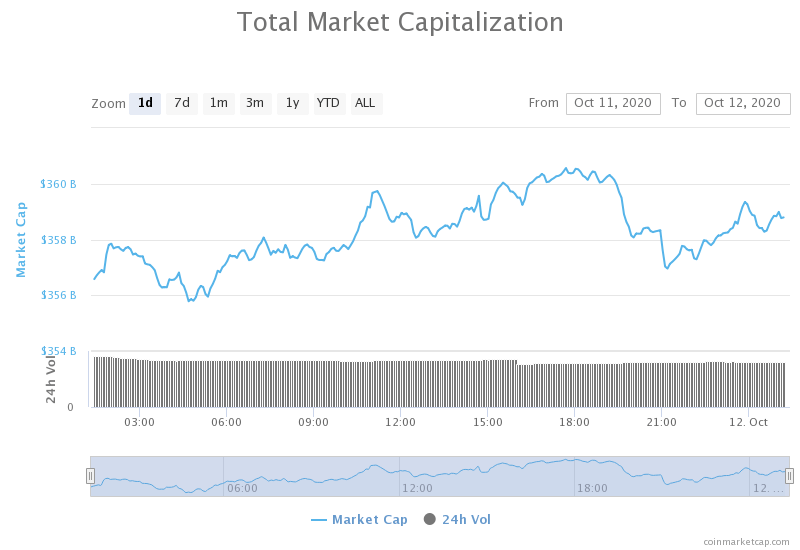
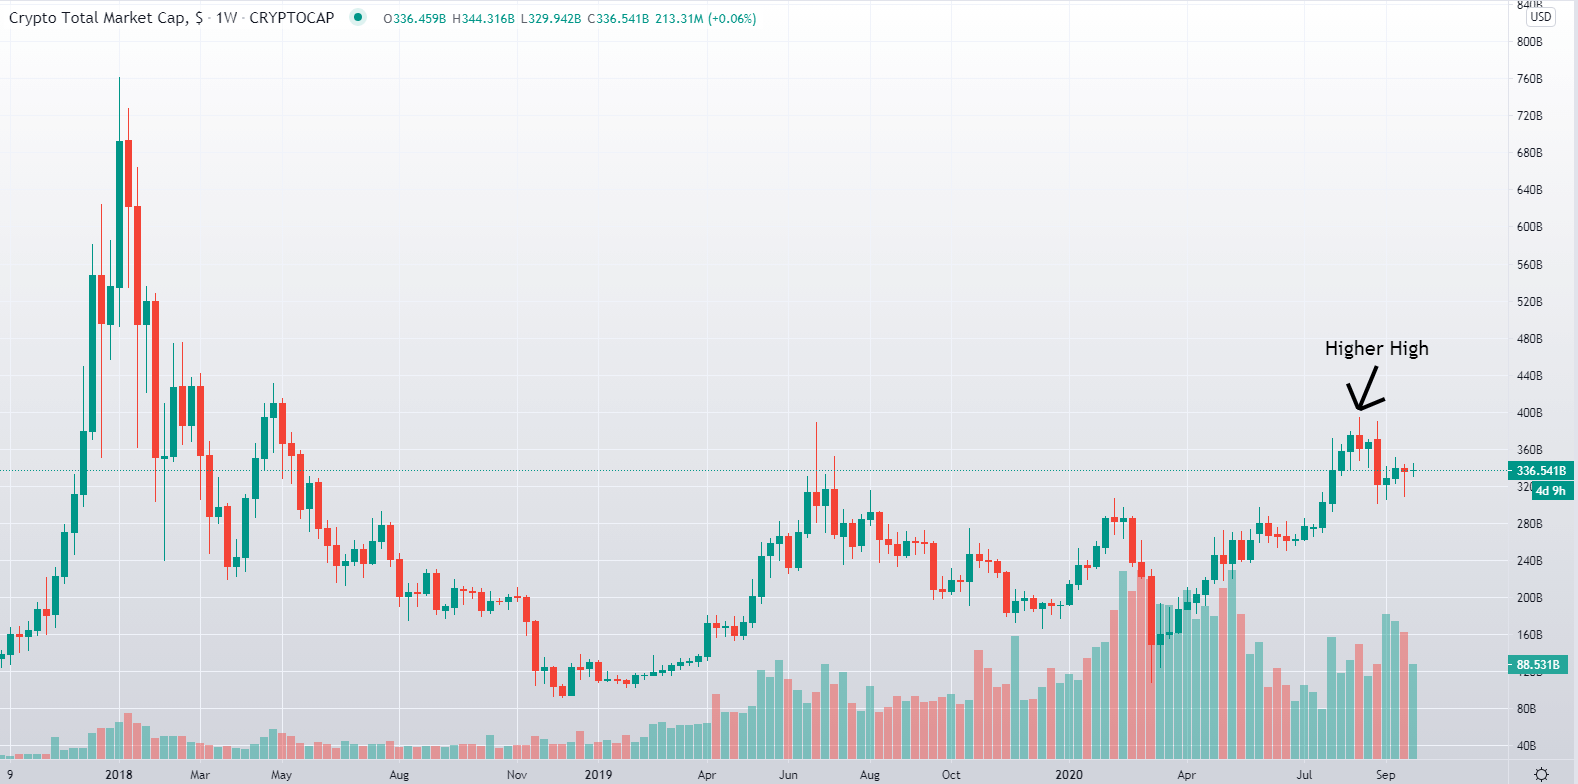
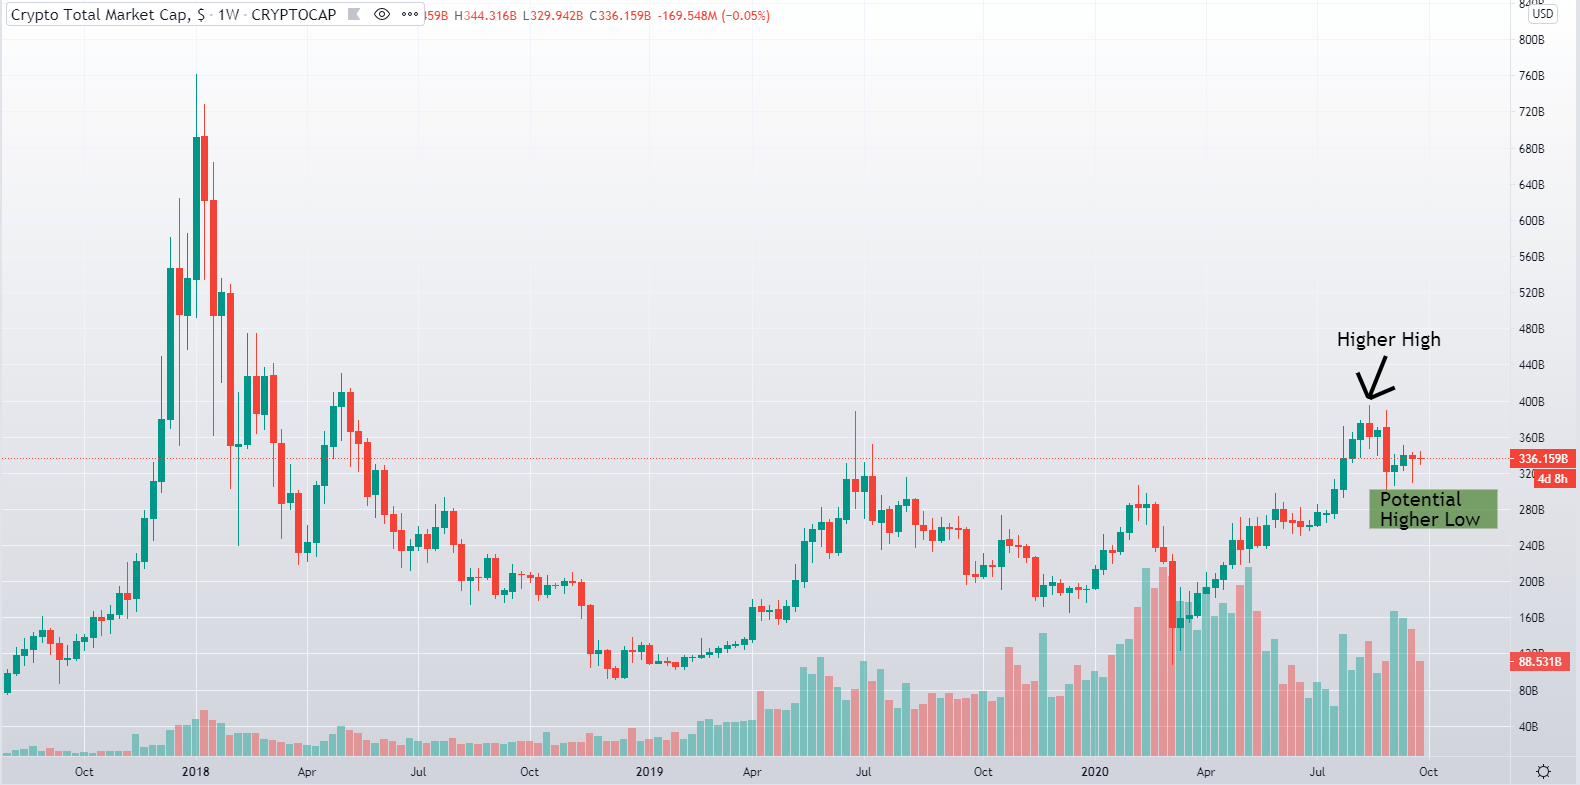
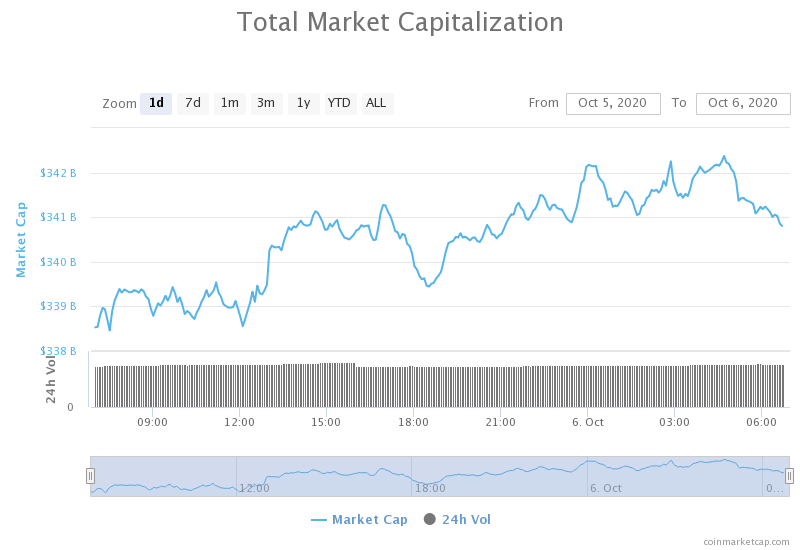
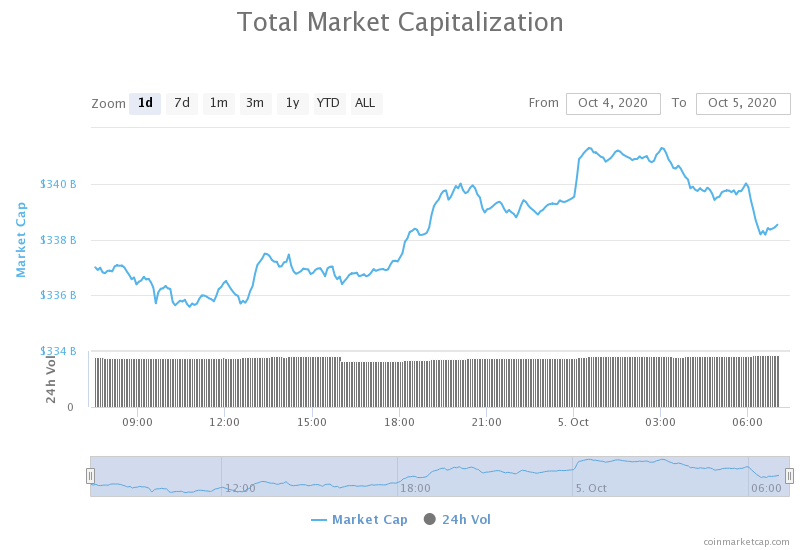
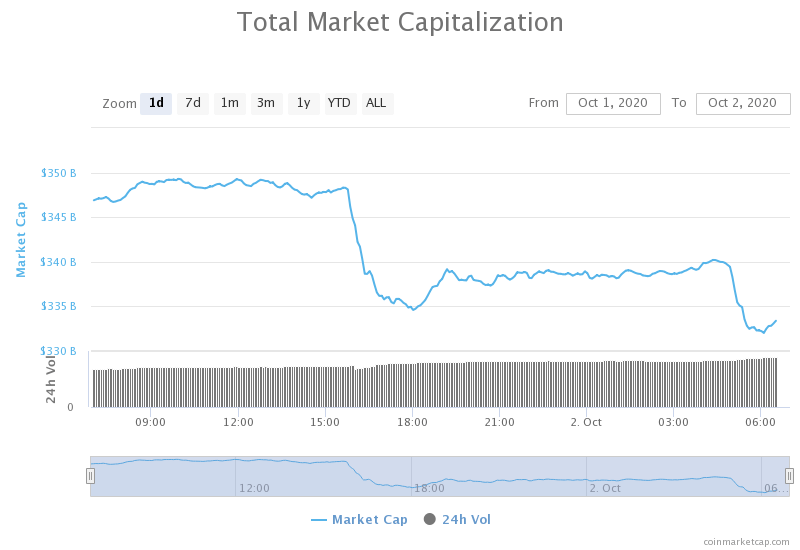
The crypto sector capitalization has gained quite a bit of value over the course of the weekend. Its current value is $358.48 billion, representing an increase of $14.33 billion compared to our previous report.

_______________________________________________________________________

What happened in the past 24 hours?

_______________________________________________________________________

_______________________________________________________________________

Technical analysis

_______________________________________________________________________

Bitcoin

The largest cryptocurrency by market cap has continued its push towards the upside on Friday/Saturday, reaching as high as $11,500. The move has died out since, and Bitcoin is now trading in a narrow range between the $10,300 support level and $10,500 resistance level (61.8% Fib retracement). The volume seems to be dying off, while the RSI is descending, which may indicate a short window where traders shouldn’t expect much volatility, but rather trade within this range. However, Bitcoin cannot stay locked up in such a narrow range for too long and will have to make another move in the short future.


BTC/USD 4-hour Chart

Bitcoin’s technical overview is tilted towards the buy-side overall, but its short-term (4-hour and 1-day) technicals are a bit mixed up, with oscillators questioning the bullishness. However, its long-term outlook is completely bullish

BTC/USD 1-day Technicals

Technical factors (4-hour Chart):
  • Price is above both its 50-period EMA and 21-period EMA
  • Price is near the middle Bollinger band
  • RSI is descending from almost-overbought levels (66.90)
  • Volume is descending
Key levels to the upside          Key levels to the downside

1: $11,500                                 1: $11,300

2: $11,630                                 2: $11,180

3: $12,000                                  3: $11,000

Ethereum

Ethereum’s movement over the weekend was similar to Bitcoin’s, with its price skyrocketing on Friday/Saturday, only to consolidate after the move ended. Ethereum bulls reached exhaustion after the price hit the 38.2% Fib retracement, and started consolidating right below it. Just as with Bitcoin, Ethereum is stuck within a range, bound by $371 to the downside and $378 to the upside.

Ethereum’s flat (and nearly overbought) RSI and descending volume indicate that Ethereum is preparing for a move.

ETH/USD 4-hour Chart

Ethereum’s short-term technicals are somewhat unclear, with its 4-hour overview turning to bullish and 1-day overview still being tilted towards the sell-side quite heavily. On the other hand, its long-term technicals are quite bullish.

ETH/USD 1-day Technicals

Technical Factors (4-hour Chart):
  • The price is above both its 50-period and 21-period EMA
  • The price is near its middle Bollinger band
  • RSI is flat and nearly overbought(66.85)
  • Volume is below average
Key levels to the upside          Key levels to the downside

1: $378                                     1: $371

2: $400                                     2: $360

3: $415                                      3: $334

Ripple

While XRP has also moved over the weekend, its move was not as significant as Bitcoin’s or Ethereum’s move. This is simply because it did not break any recent resistances, but rather got stuck at the same one it couldn’t get past on Oct 6. XRP is now consolidating at around $0.255, and we may possibly see a pullback to the orange ascending line as a retest of this upward-facing trend.

XRP has two possibilities now: it will either push towards $0.266 (less likely) or pull back towards the ascending line (more likely). Traders should keep in mind both of these scenarios when attempting to trade XRP.

XRP/USD 4-hour Chart

XRP’s 4-hour, 1-day, and weekly technicals are practically the same and are all tilted towards the buy-side (with oscillators being more or less neutral), while its monthly overview is heavily tilted towards the sell-side.

XRP/USD 1-day Technicals

Technical factors (4-hour Chart):
  • The price is above its 50-period EMA and at its 21-period EMA
  • Price is at its middle Bollinger band
  • RSI is descending (52.16)
  • Volume is average (descending)
Key levels to the upside          Key levels to the downside

1: $0.266                                   1: $0.2454 

2: $0.27                                     2: $0.235

3: $0.273                                  3: $0.227


Categories
Forex Course Forex Daily Topic

149. Trading The Fakeouts In The Most Conservative Way

Introduction

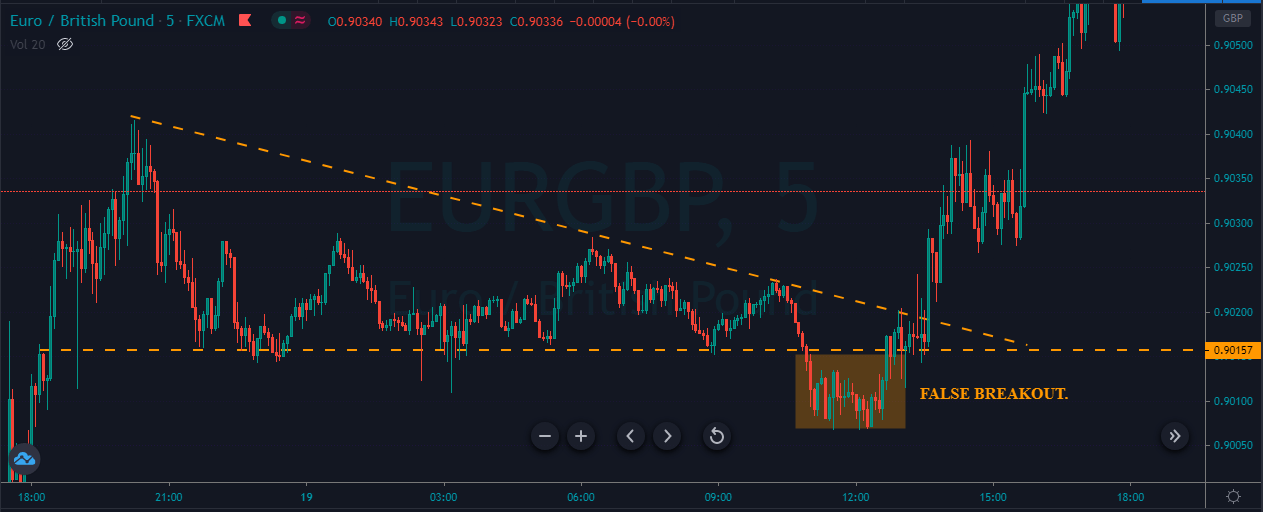
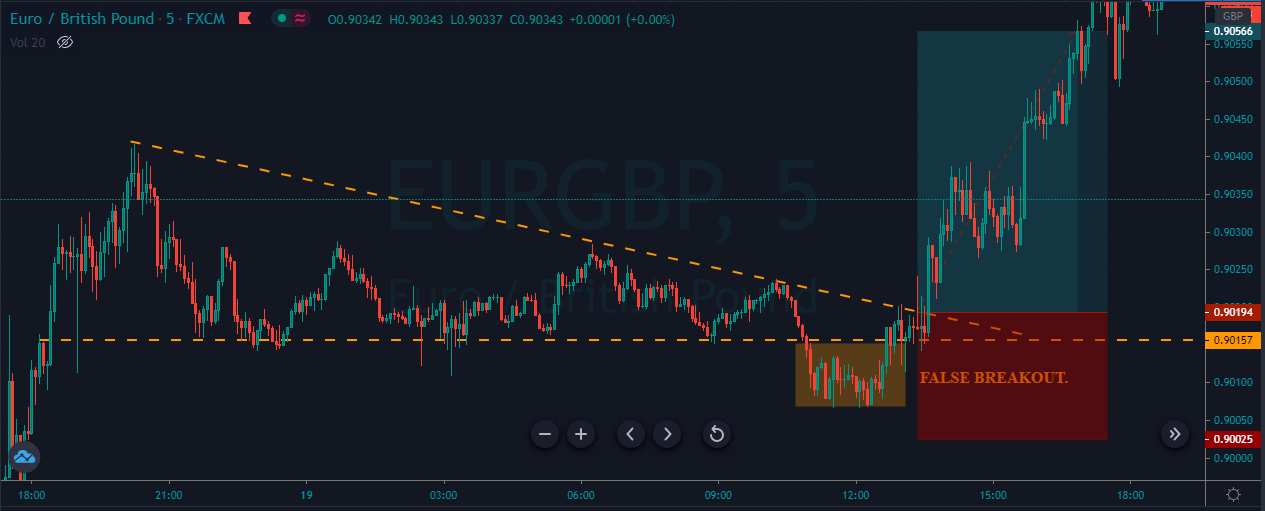
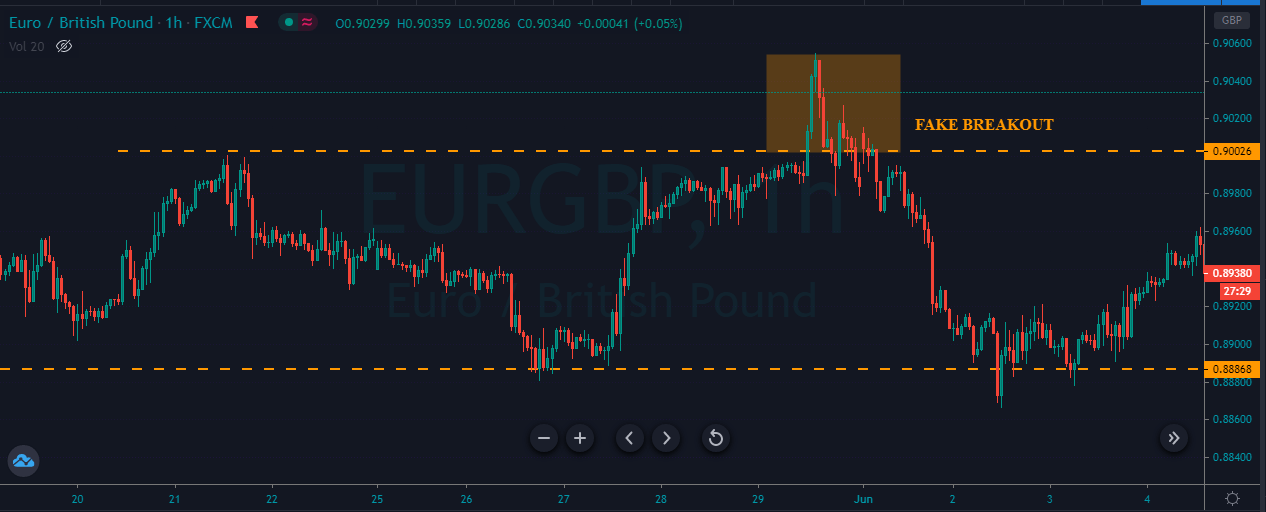
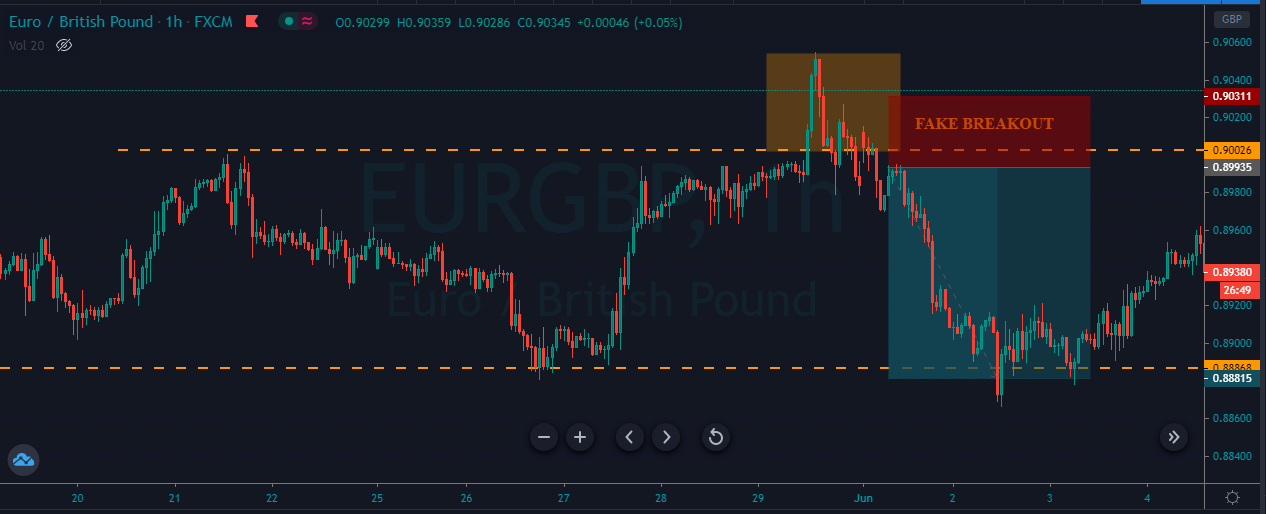
Breakout trading is prevalent among all types of traders. Professional traders make a lot of cash by trading these breakouts, while some novice traders fail to effectively trade them. While trading these breakouts, the pretty basic strategy is to pull the trigger when the price breaks above or below any significant level. But many times, the price tends to reverse its direction and cause immediate losses. This is one of the most frustrating experiences breakout traders go through.

Did this ever happen to you, and did you wonder why this happens? The reason is that you have no pre-planned entries. You are just reacting to the price action and chasing the markets purely based on your feelings, but you must accept that the market has no feelings.

How to Trade the fakeouts?

❶ Primarily, find the confluence level on the price chart. This is a place where most of the indicators point towards one direction.

❷ Avoid trading range breakouts as both the parties hold equal power when the market is ranging. In this state of the market, the chance of spikes is very high. So it is always advisable to trade breakouts only in a trending market.

❸ Wait for the price to break above any significant level in an uptrend and break below any major level in a downtrend.

❹ Right after the breakout, wait for the price to test above or below any major level to confirm the breakout’s authenticity.

Trading Strategies

Buy Example

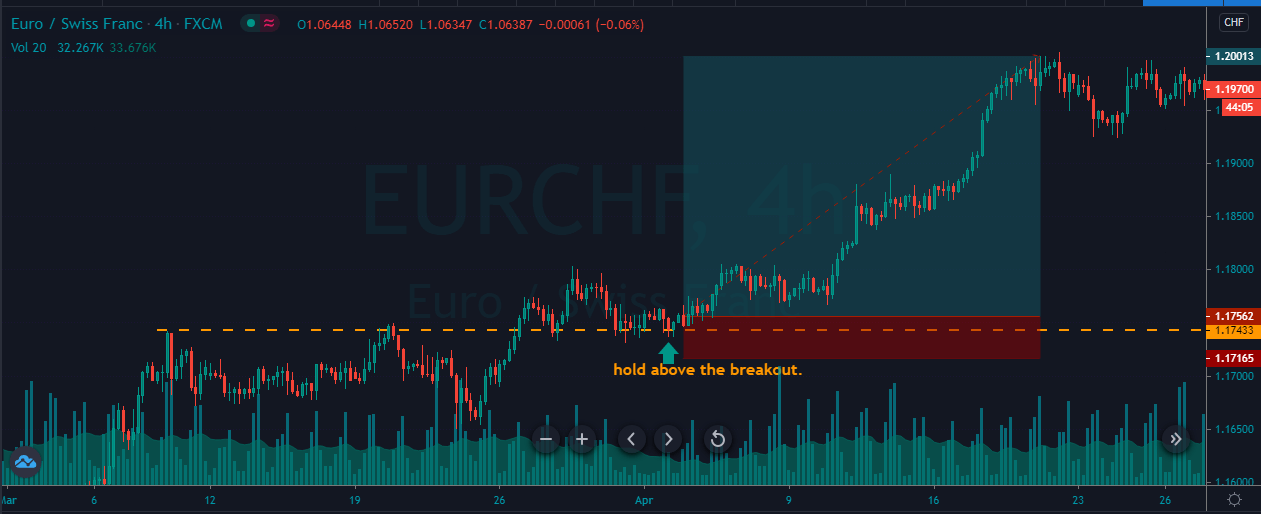
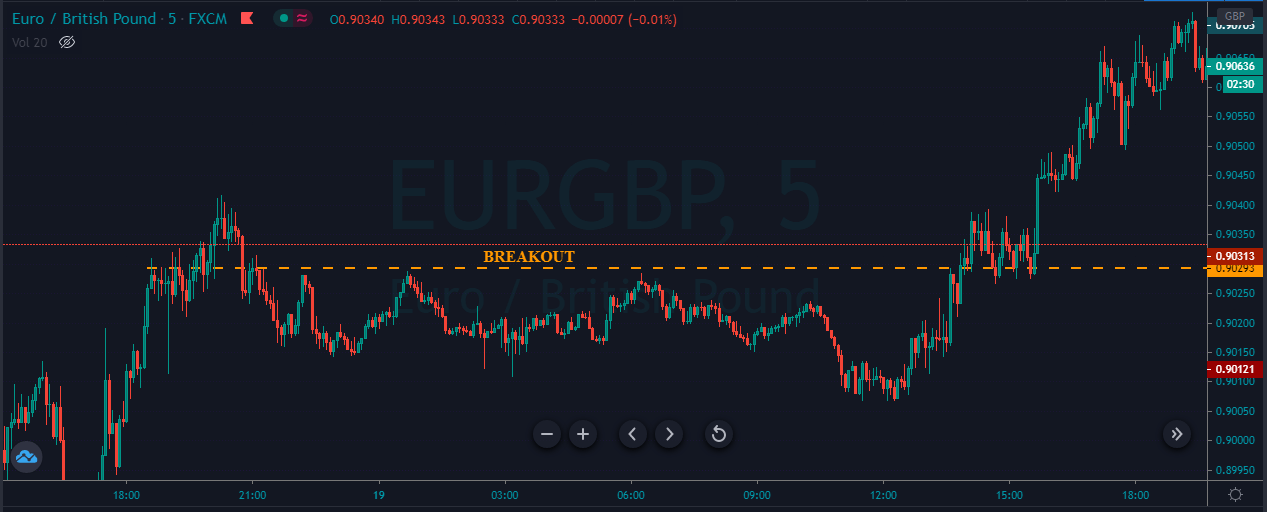
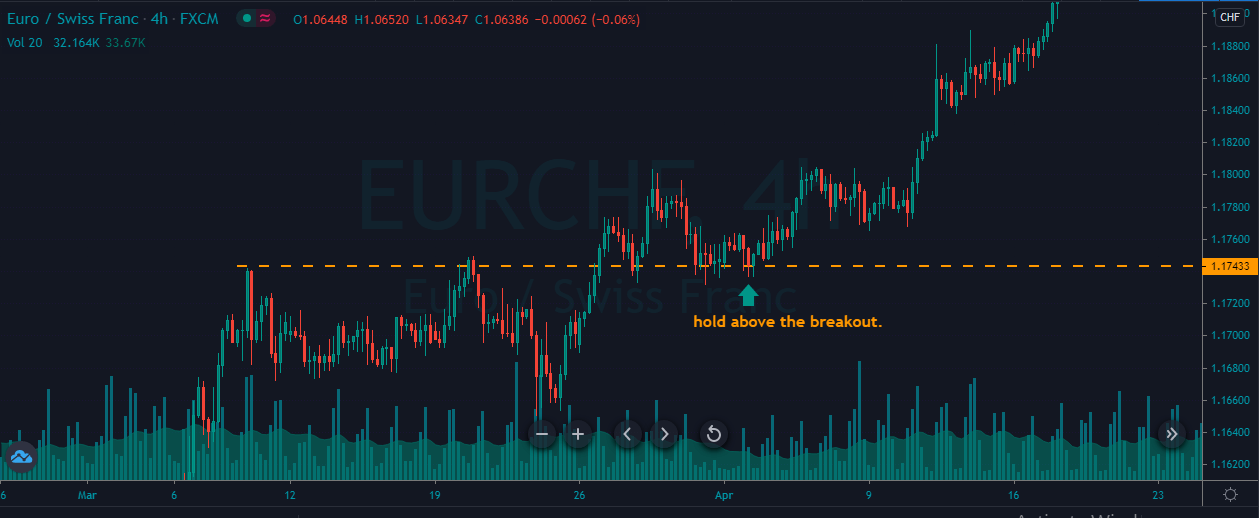
The image below represents a breakout in the EUR/CHF Forex pair.

As you can see in the below chart, we waited for the price action to holds above the breakout line. We have only entered the market after we confirmed the breakout. If the price action fails to hold, it simply means that it was a fakeout, and we can ignore it completely.

In this example, prices held above the breakout, which confirms the validity of the breakout. We took entry at the breakout line and chose to go for a brand new higher high. The exit was purely based on the higher timeframe’s significant resistance area, and the stop loss was just below our entry.

Sell Example

The image below represents a sell breakout in the GBP/NZD forex pair.

In the below image, we can see the price holding below the significant resistance level, which confirms the breakout. Our entry was at the red candle at the significant resistance level. The price sharply rejects to go any higher. Now we can see a brand new lower low forming after our entry.

The stop-loss is placed just above the entry as the seller response was quite aggressive. When the price started to struggle and failed to go down further, we chose to close our trade.

This is one of the best ways to trade the fakeouts in the most conservative way. We hope you got a clear understanding of this concept. Please let us know if you have any questions in the comments below. Cheers!

[wp_quiz id=”92087″]
Categories
Forex Market Analysis

Daily F.X. Analysis, 12th October – Top Trade Setups In Forex – U.S. Bank Holiday! 

On the news front, the market is likely to exhibit slight movements as the U.S. and Canadian banks are closed in Columbus’s observance and thanksgiving holiday. Therefore, most of the focus should stay on the technical side of the market today.

Economic Events to Watch Today  


EUR/USD – Daily Analysis

The EUR/USD pair was closed at 1.18296 after placing a high of 1.18308 and a low of 1.17478. Overall the movement of the EUR/USD pair remained bullish throughout the day. The EUR/USD raised to its more than 2-weeks highest level on Friday on the back of lifted sentiment in the market after the renewed hopes for a U.S. stimulus package. EUR/USD pair rose on Friday despite the increasing tensions regarding the coronavirus pandemic.

The second wave of the COVID-19 pandemic in the Eurozone forced governments across the region to start implementing fresh restrictions mostly on leisure activities like bars, pubs, and restaurants. The Chief Economist of European Central Bank, Philip Lane, said that the next phase of coronavirus would be tougher for the European economy.

Lane said that the central bank would wait to see the government’s response to the coronavirus challenge as they publish their budgets for 2021; by saying so, he dampened expectations for fresh stimulus from the ECB by this month. The news that the ECB will not announce any stimulus measure by the end of this month despite rising coronavirus cases raised the risk sentiment and pushed EUR/USD pair on board. 

On the other hand, Trump, who said earlier this week that talks between Republicans & Democrats will be halted until elections, said that he wanted a bigger stimulus package for Americans on Friday. The U-turn by Trump for the coronavirus stimulus package came in after polls suggested a victory of Joe Biden in upcoming elections due to his support for the big stimulus package.

The talks between Nancy Pelosi and Steven Mnuchin resumed on Friday after Trump gave the go-ahead stimulus package. These developments raised risk sentiment in the market as the hopes increased that a package will be delivered before the elections. This, in turn, weighed on the U.S. dollar, and that ultimately pushed the already rising EUR/USD pair on the upside towards more than 2—weeks highest level.

Meanwhile, at 11:45 GMT, the French Industrial Production for August declined to 1.3% from the expected 2.1% and weighed on Euro on the data front. At 13:00 GMT, the Italian Industrial Production for August raised to 7.7% from the expected 1.3% and supported the single currency that ultimately added further in the EUR/USD pair upside momentum.

From the U.S. side, the Final Wholesale Inventories dropped to 0.4% from the forecasted 0.5% and supported the U.S. dollar that capped further gains in EUR/USD pair.

Daily Technical Levels

Support Resistance

1.1734     1.1784

1.1708     1.1808

1.1684     1.1834

Pivot point: 1.1758

EUR/USD– Trading Tip

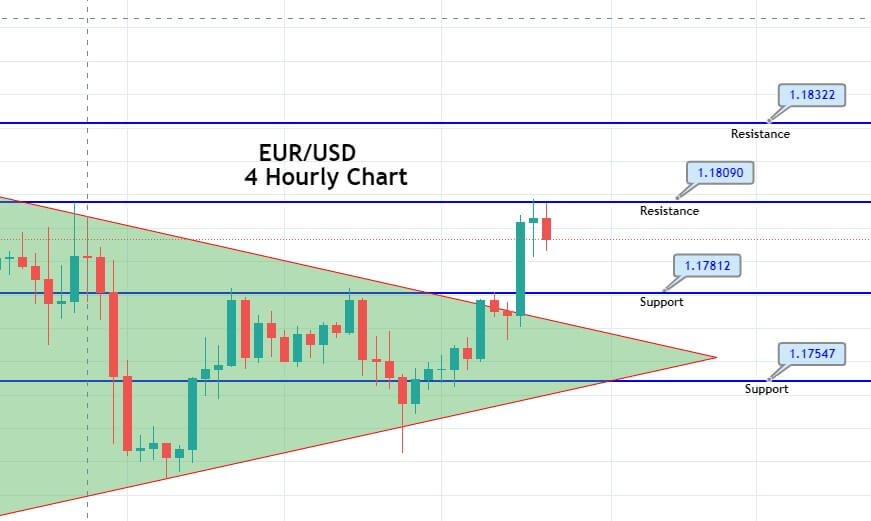
On Monday, the EUR/USD is trading with a bullish bias around 1.1798 level, having an immediate resistance at 1.1832 level. A bullish crossover of 1.1832 level may lead the EUR/USD pair further higher until the 1.1870 mark. At the same time, the support continues to stay at 1.1798 level. The violation of the symmetric triangle pattern nad an upward channel is supported by bullish bias in the EUR/USD pair today. Let’s consider taking a buy trade over 1.1798 level today. 


GBP/USD – Daily Analysis

The GBP/USD pair was closed at 1.30441 after placing a high of 1.30489 and a low of 1.29135. Overall the movement of the GBP/USD pair remained bullish throughout the day. The GBP/USD pair moved to its one month’s highest level on Friday after the U.S. dollar came under pressure over fresh stimulus hopes. In the absence of any latest development surrounding the Brexit talks, the GBP/USD pair continued following the U.S. dollar’s movements.

Wall Street’s main indexes remained in the positive territory for the third straight day on Friday after Trump gave the go-ahead for talks over the next round of the stimulus package. Earlier this week, Trump ordered to halt further talks with Democrats over the stimulus package till elections. But later, he decided sideways and said that he wanted a small stimulus package specifically for airline workers. And now, on Friday, Trump said that he wanted to give a big stimulus package to Americans before the elections. He proposed a $1.8 trillion package and approved further talks. The latest proposed package will include checks to individuals and an extension of the paycheck protection program.

The U.S. Treasury Secretary Steven Mnuchin and House Speaker Nancy Pelosi resumed talks on the revised package of 1.8 trillion dollars on Friday. This gave hopes that the package will be delivered before elections and supported the GBP/USD pair’s risk sentiment.

On the Brexit front, on Friday, an E.U. diplomat said that European Union chief Brexit negotiator, Michel Barnier wanted a few more concessions from Britain before entering the last intense phase of negotiations on a trade deal.

The two main negotiators from the E.U. side, Barnier and David Frost, said they were inching towards a deal. However, they also said that important gaps remained on fishing, level playing field, and governance issues. 

As we already know, the PM Boris Johnson has given the 15th October deadline to reach a deal, and given this deadline, before reaching the final round of make-or-break negotiations, Barnier has asked for a few more concessions. It remains that Johnson will allow for a further concession or not; however, both sides have confirmed that they were prepared for a no-deal scenario if needed. 

Furthermore, France has sharpened its tone on fishing rights and warned that an agreement on the fishing issue with the United Kingdom would be an integral part of the Brexit deal, and its proposals have fallen short. The French Minister of the Sea Annick Girardin said that the U.K. had made unacceptable proposals, and the nation’s fisherman has said in response that they would prefer no-deal over a bad one.

On the data front, at 11:00 GMT, the Construction Output for August dropped to 3.0% against the forecasted 5.1% and weighed on GBP/USD pair. August’s GDP also fell to 2.1% from the forecasted 4.6% and weighed on GBP/USD pair. 

The Goods Trade Balance came in line with the expectations of -9.0B. The Index of Services for the quarter raised 7.1% from the forecasted 7.0% and supported British Pound. The Industrial Production for August decreased to 0.3% from the projected 2.6% and weighed on GBP. The Manufacturing Production for August also declined to 0.7% from the projected 3.2% and weighed on British Pound. Despite poor than expected macroeconomic data from Great Britain, the GBP/USD pair raised in the market to its one month’s highest level on the back of improved risk sentiment amid Brexit and U.S. stimulus package developments.

Daily Technical Levels

Support Resistance

1.2921     1.3013

1.2863     1.3049

1.2828     1.3106

Pivot Point: 1.2956

GBP/USD– Trading Tip

The GBP/USD is trading at 1.3043 level, holding right below an immediate resistance level of 1.3063. The resistance is extended by an upward channels’ trendline on the two-hourly timeframes. Below the 1.3063 resistance level, the Sterling can trigger selling until the 1.3003 level and 1.2959 level. On the higher side, a bullish breakout of 1.3063 levels can trigger buying until the 1.3127 level. The fundamental side is muted today, and the U.S. banks are closed in the observance of Columbus day; therefore, we may experience thin volatility 


USD/JPY – Daily Analysis

The USD/JPY pair was closed at 105.603 after placing a high of 106.039 and a low of 105.579. Overall the movement of the USD/JPY pair remained bearish throughout the day. On Friday, the USD/JPY pair dropped and reversed its direction as the U.S. President Donald Trump took a U-turn from his earlier statements related to the U.S. stimulus package. The market moved against the U.S. dollar and made it weak across the board after hopes for Joe Biden to win the election increased, and Trump approved stimulus talks.

On Friday, the U.S. President Donald Trump said he wanted a new and big stimulus package than earlier proposed in a radio interview. He said that he wanted to provide checks to Americans before elections. Whereas, earlier this week, Trump said that he wanted to halt further talks till elections, and after that, he said that he wanted a small stimulus package for airline workers.

The U-turn by U.S. President over the stimulus package gave a boost to risk sentiment as it increased the hopes that the package will be delivered before the elections. This weighed on the U.S. dollar, and the pair USD/JPY suffered on Friday. Furthermore, on Friday, Larry Kudlow said that Trump had approved the talks for a new proposed stimulus package worth $1.8 trillion. The talks for it have resumed on Friday between U.S. Treasury Secretary Steven Mnuchin and House Speaker Nancy Pelosi. 

On the data front, at 04:30 GMT, the Average Cash Earnings for the year declined to -1.3% against the forecasted -1.2% and weighed on the Japanese Yen. The Household Spending for the year from Japan also dropped to -6.9% from the forecasted -6.6% and weighed on the Japanese Yen. Despite Japan’s negative macroeconomic data, the USD/JPY pair remained bearish throughout the day amid broad-based U.S. dollar weakness. From the U.S. side, the Final Wholesale Inventories for August were released at 19:00 GMT that dropped to 0.4%from the projected 0.5% and supported the U.S. dollar. However, traders ignored the U.S. data as the focus was shifted completely towards the U.S. stimulus developments.

On the other hand, the United Kingdom’s coronavirus situation worsened as one of the U.K.’s top scientists warned that the country was at a tipping point. He said that more deaths from the viruses would follow a rise in cases in the coming weeks. He added that country was facing a similar situation that it last seen in March. The rising number of coronavirus cases worldwide raised safe-haven appeal and supported the Japanese Yen and weighed on the USD/JPY pair.

Daily Technical Levels

Support Resistance

105.53    105.80

105.42     105.98

105.25     106.08

Pivot point: 105.70

USD/JPY – Trading Tips

The USD/JPY traded sharply bearish to drop from 105.900 level to 105.450 mark. Most of the selling triggered after the USD/JPY violated an upward channel at 105.900 level. Currently, the USD/JPY pair is trading at 105.459 level, the support level that’s extended by double bottom level. A bearish breakout of 105.450 level may drive further selling until the 105.070 support level as the MACD, and the 50 periods EMA are in support of selling bias today. Let’s consider opening sell trade below 105.40 level today. Good luck!  

Categories
Crypto Market Analysis

BTC/USD Weekly Overview + Possible Outcomes

This is the BTC/USD 1-day timeframe analysis, where we are looking at the most recent events, the current technical formations, as well as discussing possible outcomes.

Overview


Bitcoin has shown some volatility in recent days after bouncing off of the 100-period moving average (black line). The largest cryptocurrency by market cap bounce off of this line as well as the $10,500 level brought a lot of bulls back to the market, causing another price swing upwards. While it was more likely that Bitcoin would push down towards $10,360, the news surrounding it (many accredited and institutional investors putting their funds in the market at this particular moment) outweighed the bearishness caused by the macro events.

Technical factors

Bitcoin has been building a triangle formation for over a month now, and it was a consensus among analysts and traders that the triangle will most likely break towards the downside. However, the most recent push off of the 100-period MA (mostly due to fundamentals rather than technical factors) has proven traders wrong and decided Bitcoin’s short-term future.

The push towards the upside briefly stopped after breaking the uncertainty area, only to consolidate there and create enough pressure for the next move. After this happened, Bitcoin was free to move towards the $11,000 resistance level . At the moment, the pressure created by the bulls is fading, and we may expect a pullback.

Likely Outcomes


Bitcoin has encountered strong resistance at the $11,000 level, which will most likely cause it to back down towards $10,850. With (as we spoke in our numerous analyses) $10,850 level being the pivot pointBitcoin will choose to either back down towards $10,500 or $10,360 before (most likely) rising again, or to bounce from the $10,850 area and push towards $11,000-$11,300. At this moment, the most likely scenario is that Bitcoin will stay above $10,850 for the time being and that its next push will possibly move its price above $11,000, but almost certainly not above $11,300.

If we are talking about straightforwards pushes towards the upside or downside, it would take a great deal of pressure to either side to break its support or resistance levels, sitting at $10,850 and $11,300.

Categories
Forex Signals

EUR/JPY Upward Channel Underpins Bullish Trend – An Update on Signal 

During the Friday’s European trading hours, the EUR/JPY currency pair succeeded to extend its previous session gaining streak and hit the intra-day high level around above 125.00 level mainly due to the risk-on market sentiment, backed by the prevalent optimism over treatment for the highly infectious coronavirus, which tends to undermine the safe-haven Japanese yen and contributes to the currency pair gains. Moreover, the market risk tone was further boosted by the increasing expectations of further US stimulus package, which provided further boost to the currency pair. 

On the contrary, Europe’s quickly rising coronavirus (COVID-19) cases fueled the worries over the EUR economy recovery, which becomes the key factor that kept the lid on any additional gains in the currency pair. Meanwhile, the latest report that the Spanish Prime Minister (PM) Pedro Sánchez announced a state of emergency in Madrid also played a major role in capping further currency pair gains. As of writing, the EUR/JPY currency pair is currently trading at 124.97 and consolidating in the range between 124.51 – 125.02.

As we already mentioned that the equity market has been flashing green since the day started. The reason could be associated with the major positive catalysts. Be it the renewed probabilities of the further stimulus package or optimism over treatment for the highly infectious coronavirus, not to forget the upbeat China data, these all factors favor the market trading sentiment, which could be considered the main factors that kept the currency pair higher. 

It should be noted that the US President Donald Trump stepped back from his earlier ‘NO’ to the coronavirus (COVID-19) aid package talks. However, US President Donald Trump is ready to shift towards the large scale bill, which propels the market’s risk sentiment and weighs on the safe-haven Japanese yen. Apart from this, the coronavirus (COVID-19) vaccine’s hopes also favored the market risk tone, which eventually underpinned the safe-haven US Japanese yen and contributed to the currency pair gains.

As per the latest report, China joins the World Health Organization’s virus vaccine program after returning from one week-long holiday, which initially fueled the hopes of a disease cure. Meanwhile, the market trading sentiment was further bolstered by the positive reports that Gilead and Regeneron’s vaccine research efforts will offer strong results to stop the virus.

On the contrary, the Spanish Prime Minister (PM) Pedro Sánchez announced a state of emergency in Madrid as the COVID-19 cases in the UK and Germany are also worrisome. At the coronavirus front, the coronavirus cases grew to 314,660, with a total of 9,589 deaths toll, according to the German disease and epidemic control center, Robert Koch Institute (RKI) report. In the meantime, the cases rose by 4,516 on the day while the death toll rose by 11. The daily rise in new cases topped 4,000 for the second day in a row, the highest numbers since April 10. These virus fears could be considered one of the key factors that kept the lid on any additional currency pair gains.

In the absence of the major data/events on the day, the market traders will keep their eyes on the Canadian jobs data. In the meantime, the risk catalyst like geopolitics and the virus woes, not to forget the Brexit, will also be key to watch for the fresh direction.


Daily Support and Resistance

S1 121.85

S2 122.64

S3 123.04

Pivot Point 123.43

R1 123.83

R2 124.22

R3 125

The EUR/JPY has violated the triple top resistance level of 124.850 mark, and now this is opening further room for buying until the next resistance level of 125.300 level. On the lower side, the support continues to stay at 124.850 level. The MACD and the 50 periods EMA are also supporting the buying trend today and check out a trading plan below.

Entry Price – Buy 124.933

Stop Loss – 124.533

Take Profit – 125.333

Risk to Reward – 1:1

Profit & Loss Per Standard Lot = -$400/ +$400

Profit & Loss Per Micro Lot = -$40/ +$40

Fellas, now you can check out forex trading signals via Forex Academy mobile app. Follow the links below.

iPhone Users: https://apps.apple.com/es/app/fasignals/id1521281368

Andriod Users: https://play.google.com/store/apps/details?id=academy.forex.thesignal&hl=en_US

Categories
Forex Signals

EUR/USD Violated Symmetric Triangle Pattern – Brace for Selling! 

During the Friday’s European trading hours, the EUR/USD currency pair succeeded to extend its previous session gaining streak and hit the intra-day high level around above 1.1800 level mainly due to the broad-based U.S. dollar selling bias, triggered by the market risk-on sentiment. However, the market risk tone was being supported by optimism over a possible vaccine and treatment for the highly infectious coronavirus. 

Meanwhile, the increasing expectations of further U.S. stimulus packages also boosted the market trading sentiment, which keeps the U.S. dollar lower. Apart from this, the United States’ political uncertainty also weighs on the broad-based U.S. dollar, which provided an additional boost to the currency pair. 

On the contrary, Europe’s quickly rising coronavirus (COVID-19) cases fueled the worries over the EUR economy recovery, which becomes the key factor that kept the lid on any additional gains in the currency pair. Meanwhile, the latest report that the Spanish Prime Minister (PM) Pedro Sánchez announced a state of emergency in Madrid also played a significant role in capping further currency pair gains.

However, the reason for the risk-on market sentiment could be associated with the renewed probabilities of the further stimulus package, triggered after the U.S. President Donald Trump stepped back from his earlier ‘NO’ to the coronavirus (COVID-19) aid package talks. This was witnessed after the discussions between House of Representative Speaker Nancy Pelosi and Treasury Secretary Steven Mnuchin over the U.S. stimulus package resumed overnight. Apart from this, the coronavirus (COVID-19) vaccine’s hopes also favored the market risk tone, which eventually underpinned the safe-haven U.S. dollar. 

As per the latest report, China joins the World Health Organization’s virus vaccine program after returning from one week-long holiday, which initially fueled the hopes of a disease cure. Meanwhile, the market trading sentiment was further bolstered by the positive reports that Gilead and Regeneron’s vaccine research efforts will offer strong results to stop the virus.

As in result, the broad-based U.S. dollar failed to stop its previous session losing streak & remained depressed during the European session as the investors continue to sell U.S. dollars on the back of the U.S. fiscal stimulus hopes, which keeps the market sentiment bullish. Furthermore, the U.S. dollar losses could also be associated with political uncertainty in the U.S. ahead of U.S. elections. Thus, the losses in the U.S. dollar kept the currency pair higher.

On the contrary, the Spanish Prime Minister (PM) Pedro Sánchez announced a state of emergency in Madrid as the COVID-19 cases in the U.K. and Germany are also worrisome. At the coronavirus front, the coronavirus cases grew to 314,660, with a total of 9,589 deaths toll, according to the German disease and epidemic control center, Robert Koch Institute (RKI) report. In the meantime, the cases rose by 4,516 on the day while the death toll rose by 11. The daily rise in new cases topped 4,000 for the second day in a row, the highest numbers since April 10. These virus fears could be considered one of the key factors that kept the lid on any additional currency pair gains.


Daily Support and Resistance

S1 1.1626

S2 1.1672

S3 1.1694

Pivot Point 1.1718

R1 1.174

R2 1.1764

R3 1.181

The EUR/USD pair is consolidating below 1.1780 level, and the closing of candles below the triple top resistance level of 1.1780 level may drive the selling trend in the EUR/USD pair until the support level of 1.1758 and 1.1740 level. Conversely, the bullish breakout of the 1.1780 level can trigger a sharp buying trend until today’s 1.1807 mark. Checkout a trading signal below.. 

Entry Price – Sell 1.17755

Stop Loss – 1.18155

Take Profit – 1.17355

Risk to Reward – 1:1

Profit & Loss Per Standard Lot = -$400/ +$400

Profit & Loss Per Micro Lot = -$40/ +$40

Fellas, now you can check out forex trading signals via Forex Academy mobile app. Follow the links below.

iPhone Users: https://apps.apple.com/es/app/fasignals/id1521281368

Andriod Users: https://play.google.com/store/apps/details?id=academy.forex.thesignal&hl=en_US

Categories
Crypto Market Analysis

Daily Crypto Review, Oct 9 – Bitcoin Close to $11,000: What’s Next?

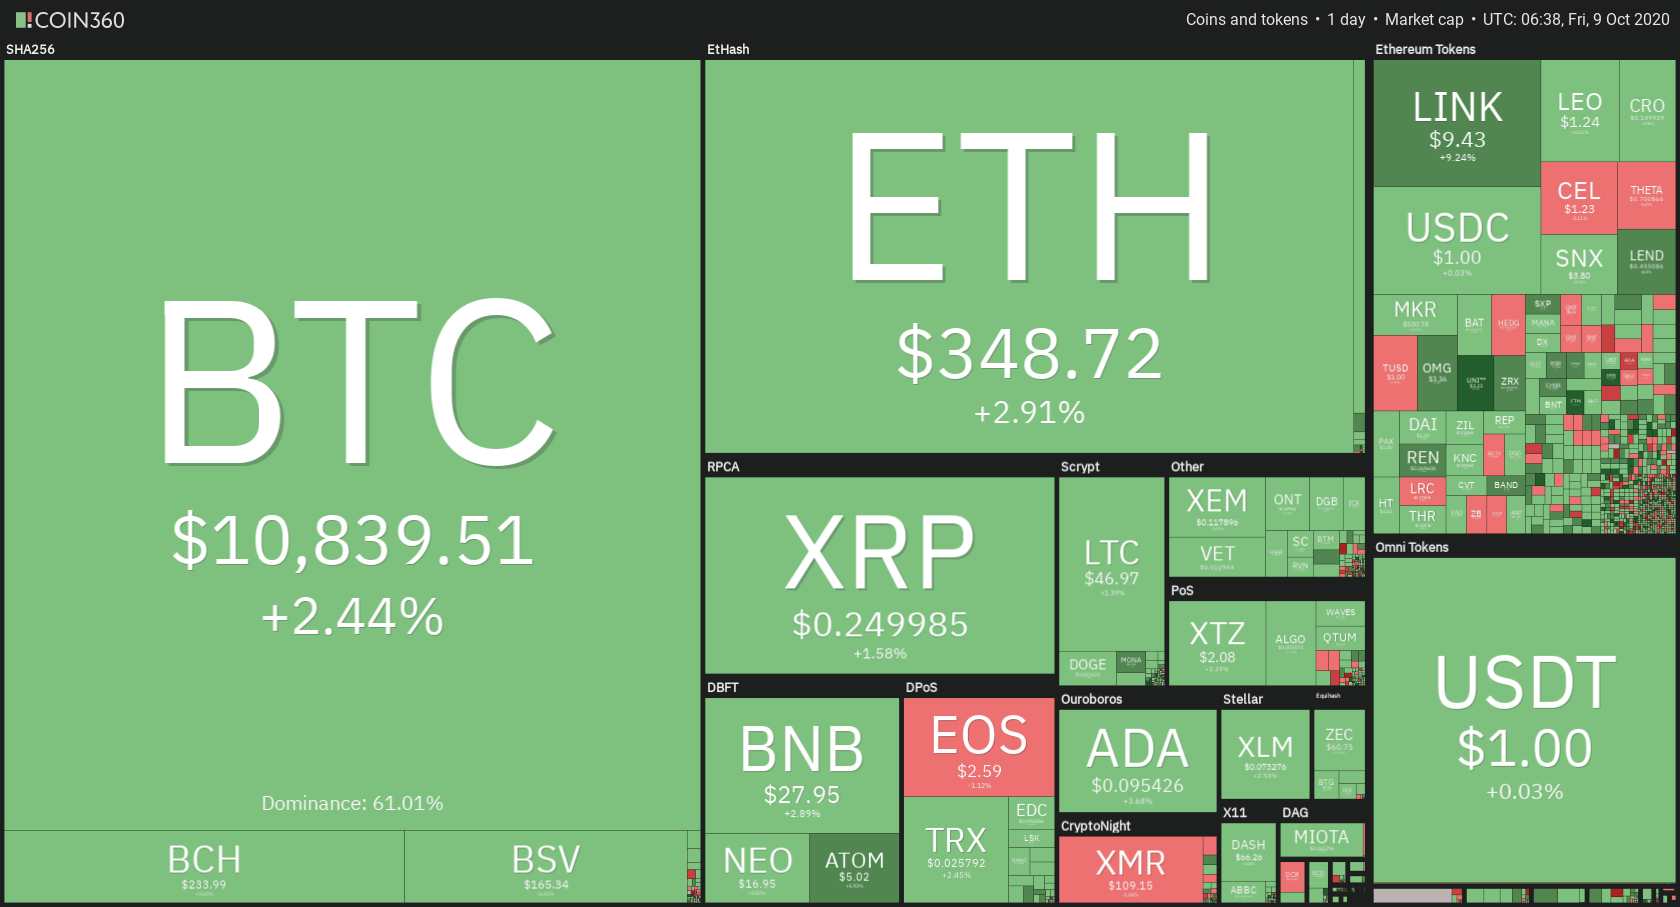
The cryptocurrency sector as a whole has experienced a quick push to the upside. Bitcoin is currently trading for $10,839, representing an increase of 2.44% on the day. Meanwhile, Ethereum gained 2.91% on the day, while XRP gained 1.59%.

 Daily Crypto Sector Heat Map

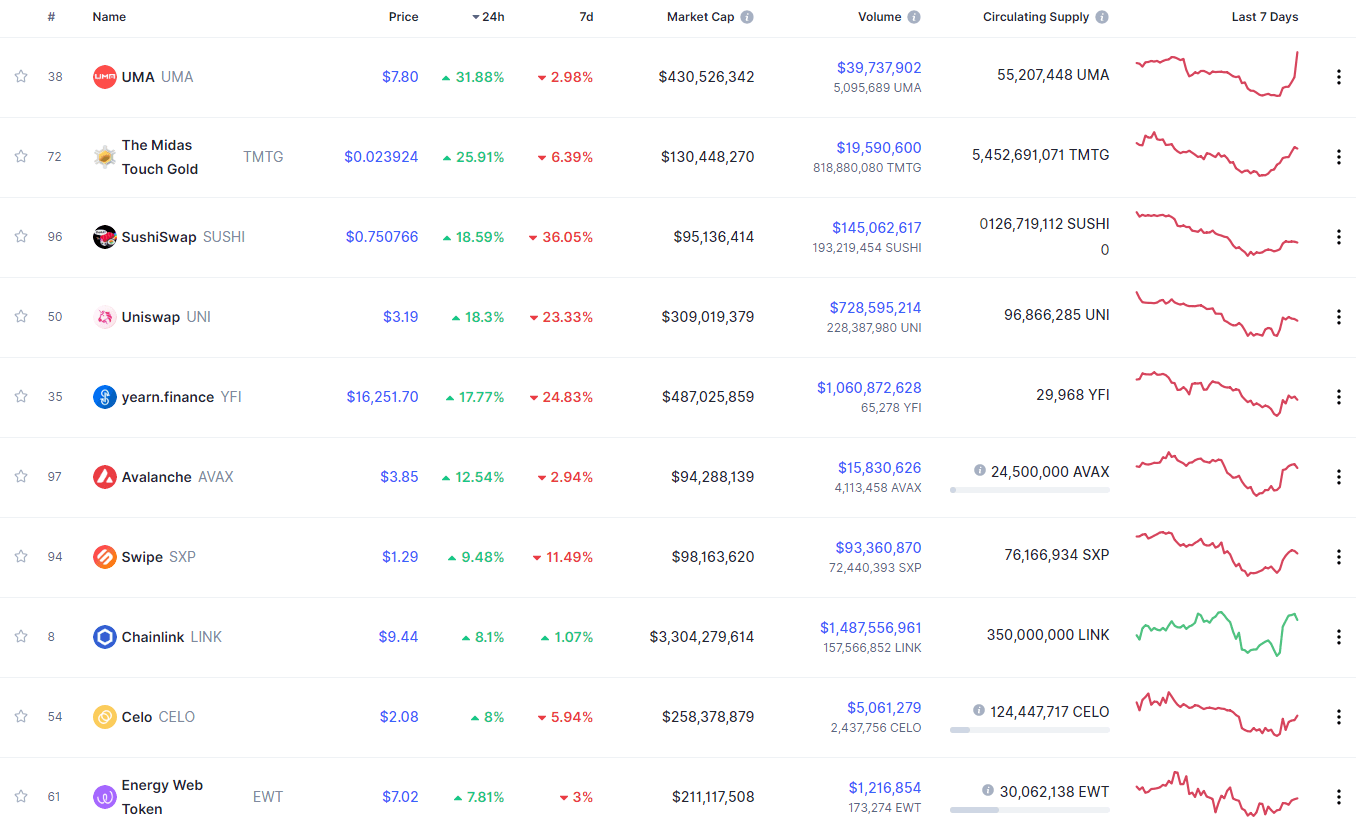
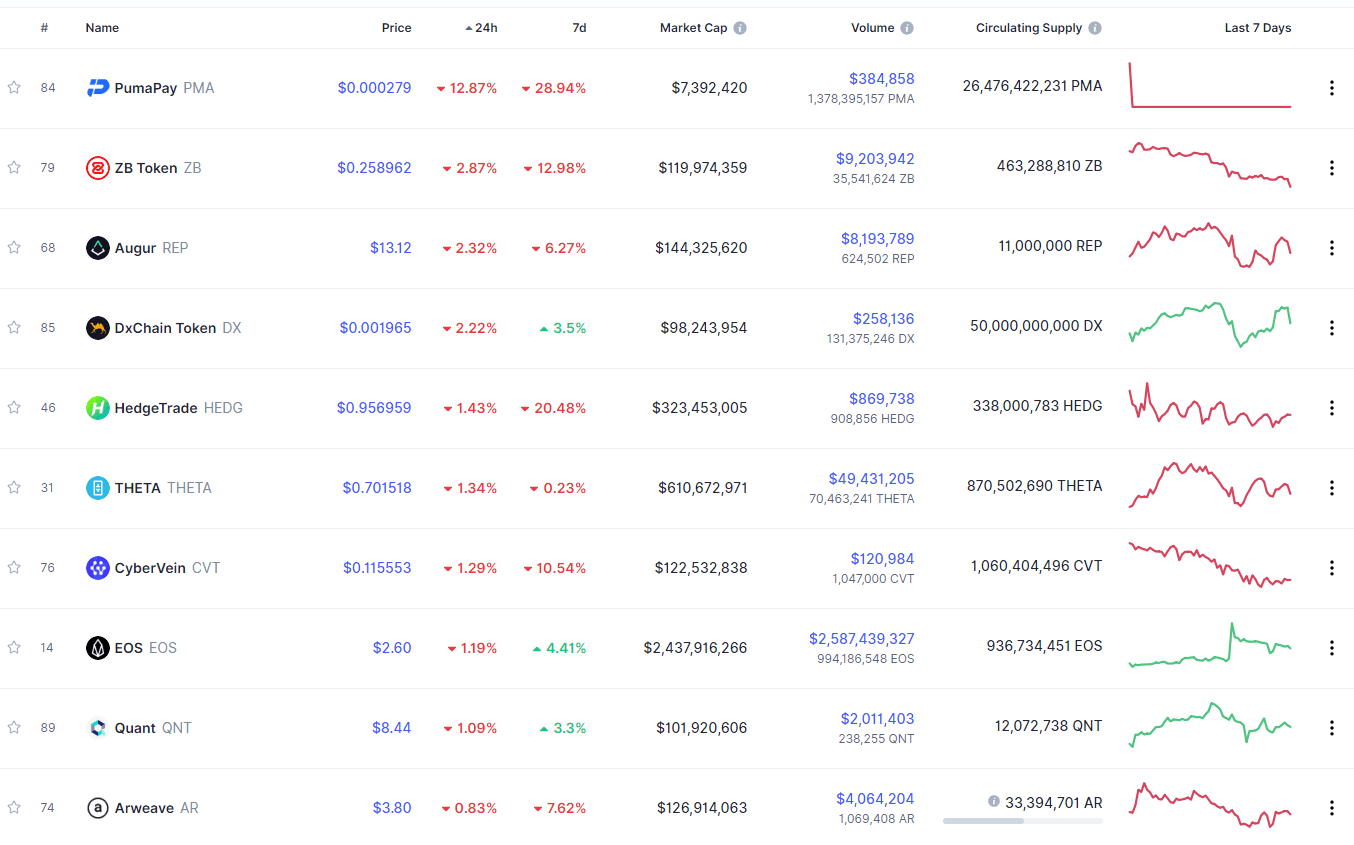
If we look at the top 100 cryptocurrencies, we can see that UMA gained 31.88% in the past 24 hours, making it the most prominent daily gainer. The Midas Touch Gold (25.91%) and SushiSwap (18.59%) also did great. On the other hand, PumaPay lost 12.87%, making it the most prominent daily loser. It is followed by Zuba Token’s loss of 2.87% and Augur’s loss of 2.32%.

Top 10 24-hour Performers (Click to enlarge)

Bottom 10 24-hour Performers (Click to enlarge)

Bitcoin’s market dominance level has stayed at the same place since our last report, with its value currently being at 61.01%. This value represents a 0.05% difference to the upside when compared to when we last reported.

Daily Crypto Market Cap Chart

The crypto sector capitalization has gained quite a bit of value over the course of the past 24 hours. Its current value is $343.72 billion, representing an increase of $10.6 billion compared to our previous report.

_______________________________________________________________________

What happened in the past 24 hours?

_______________________________________________________________________

_______________________________________________________________________

Technical analysis

_______________________________________________________________________

Bitcoin

The largest cryptocurrency by market cap has broken its triangle formation towards the upside after a bounce from the $10,500 support level. The massive bull presence had brought the price just under $11,000 before BTC started to pull back and seek an appropriate level to consolidate at. At the time being, Bitcoin is fighting for $10,850, and staying above, it would be a major precursor to its future possible push towards $11,000-$11,300.

Traders should pay close attention to Bitcoin’s price movement around the $10,850 level, as well as the ascending line (pink), and trade based on how the price reacts to these levels.

BTC/USD 4-hour Chart

Bitcoin’s technical overview has turned bullish overall, with every single time-frame being bullish. While its weekly and monthly overviews were bullish for months now, its daily and 4-hour technicals have turned bullish only after the most recent spike.

BTC/USD 4-hour Technicals

Technical factors (4-hour Chart):
  • Price is above both its 50-period EMA and 21-period EMA
  • Price is near the top Bollinger band
  • RSI is descending from almost-overbought levels (61.39)
  • Volume is descending from above-average
Key levels to the upside          Key levels to the downside

1: $11,000                                 1: $10,850

2: $11,180                                 2: $10,630

3: $11,300                                  3: $10,500

Ethereum

Ethereum has moved towards the upside alongside Bitcoin, but its price movement didn’t do anything as impactful as Bitcoin’s price. While the bounce from the $344 level was significant, it could not reach, let alone pass, the $360 level. Ethereum’s short-term future is certainly within this range, which traders can make use of.

Once again, we will point out an extremely high chance of Ethereum staying between $334 and $360.

ETH/USD 4-hour Chart

Ethereum’s short-term technicals are somewhat unclear, with its 4-hour overview turning to bullish and 1-day overview still being tilted towards the sell-side quite heavily. On the other hand, its long-term technicals are quite bullish.

ETH/USD 4-hour Technicals

Technical Factors (4-hour Chart):
  • The price is above both its 50-period and 21-period EMA
  • The price is near its middle Bollinger band
  • RSI is neutral (54.08)
  • Volume is below average (one-candle spike)
Key levels to the upside          Key levels to the downside

1: $360                                     1: $334

2: $371                                     2: $300

3: $400                                      3: $289

Ripple

XRP has used Bitcoin’s move towards the upside to fuel its own move and established itself above the $0.2454 level. The third-largest cryptocurrency by market cap has bounced off the ascending line (and not the $0.2454 level this time) dating back from Sep 24 and pushed up, reaching as high as $0.253 before ending the move.

Traders should pay attention to any sharp increases in volume, as well as how XRP handles the immediate support and resistance levels. Most analysts are currently quite bullish on XRP, mostly when it comes to 1-hour and 4-hour charts.

XRP/USD 4-hour Chart

XRP 4-hour, daily, and weekly technicals are quite bullish, while its monthly overview is tilted towards the sell-side.

XRP/USD 4-hour Technicals

Technical factors (4-hour Chart):
  • The price is above its 50-period EMA and its 21-period EMA
  • Price is close to its middle Bollinger band
  • RSI is neutral (55.13)
  • Volume is above average
Key levels to the upside          Key levels to the downside

1: $0.266                                   1: $0.2454 

2: $0.27                                     2: $0.235

3: $0.273                                  3: $0.227


Categories
Forex Signals

Overbought Gold Braces for Bearish Correction – Brace for a Sell! 

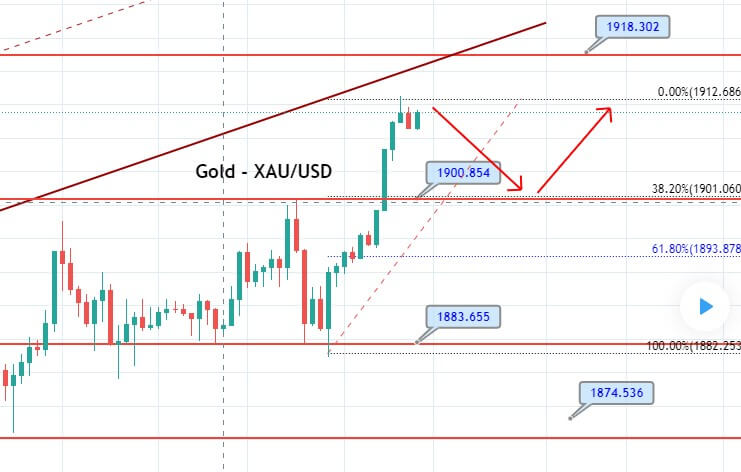
The yellow metal prices extended its early-day bullish rally and remained well bids around above the 1,900 level. However, the bullish sentiment around the bullion prices could be associated with the broadly weaker U.S. dollar. The risk-on market sentiment undermined that. Meanwhile, the U.S.’s prevailing political uncertainty also pushed the U.S. dollar down for the second consecutive day. Thus, the U.S. dollar losses could be considered one of the key factors that kept the gold prices higher as the price of gold is inversely related to the price of the U.S. dollar. Apart from this, the surge in the coronavirus (COVID-19) numbers in the U.K. and Europe also favoring the yellow-metal bulls. 

In the meantime, the U.S. geopolitical tension with the Middle East and China provided an additional boost to the safe-haven metal prices. On the contrary, the optimism over a potential vaccine/treatment for the highly infectious coronavirus and hopes of the further stimulus package keep the market trading sentiment bullish, which could be considered as the key factor that cap further upside momentum for the gold prices. Whereas, the Trump recovery from the COVID-19 infection also offers an additional reason for the market traders to remain hopeful. The yellow metal prices are currently trading at 1,909.87 and consolidating in the range between 1,893.78 – 1,912.96.

Despite the ongoing Sino-US tussle and worries concerning the coronavirus (COVID-19) crisis, the market trading sentiment extended its early-day positive tone and remained supportive by combining factors. As in result, the S&P 500 Futures gain over 0.40%, whereas Japan’s Nikkei slips four points to 23,643 as of writing. Hence, the basis for the risk-on market trading bias could be connected to the positive headlines implying that the discussions between House of Representative Speaker Nancy Pelosi and Treasury Secretary Steven Mnuchin over the U.S. stimulus package resumed overnight. While President Donald Trump announced that discussions with Congress have resumed despite stopped the coronavirus (COVID-19) stimulus talks until the Nov. 3 presidential election. However, this helped the market’s risk sentiment and undermined the U.S. dollar’s safe-haven demand.

Apart from this, Trump continues to recover from the COVID-19 infection. Whereas the White House physician Sean Conley said that Trump completed his therapy course, and his condition remains stable since returning to the White House on Monday.

Across the ocean, the tensions between the U.S. and China and the surge in the coronavirus (COVID-19) numbers in the U.K. and Europe keep challenging the market risk-on tone. Although the Dragon Nation has recently started facing global pressure against its treatment of Uighur Muslims, 18 Iranian banks were sanctions off-late by the U.S. State Department to curb Tehran’s financial access help further safe-haven yellow metal.

At the coronavirus front, the ongoing rise in COVID-19 cases globally continues to fuel worries concerning the global economic outlook for the foreseeable tomorrow. As per the latest report, Spanish Prime Minister (PM) Pedro Sánchez announced a state of emergency in Madrid while the calls of closing the pubs and restaurants in the U.K. have been out and clear off-late. Looking forward, the market traders will keep their eyes on updates surrounding the Sino-US tussle and stimulus headlines. Whereas China’s return and Caixin Services PMI will be key to watch. In the meantime, the 


Daily Support and Resistance

S1 1847.32

S2 1874.78

S3 1887.18

Pivot Point 1902.24

R1 1914.64

R2 1929.7

R3 1957.16

Gold has risen distinctly to trade at 1,912 marks, but the neutral candle’s closing below 1,912 levels implies mixed bias amongst traders. Hence, another formation of bearish engulfing or tweezers top pattern may begin bearish correction/retracement in gold. On the downside, gold may gain support at 1,906 and 1,899. Conversely, a bullish breakout of 1,912 stand-level may prolong the buying trend until the 1,919 level.

Entry Price – Sell 1909.74

Stop Loss – 1915.74

Take Profit – 1902.24

Risk to Reward – 1:1

Profit & Loss Per Standard Lot = -$600/ +$750

Profit & Loss Per Micro Lot = -$60/ +$75

Fellas, now you can check out forex trading signals via Forex Academy mobile app. Follow the links below.

iPhone Users: https://apps.apple.com/es/app/fasignals/id1521281368

Andriod Users: https://play.google.com/store/apps/details?id=academy.forex.thesignal&hl=en_US

Categories
Forex Market Analysis

Daily F.X. Analysis, 09th October – Top Trade Setups In Forex – U.K. GDP in Highlights 

On the news front, the eyes will remain on the series of economic events from the U.K., especially the GDP m/m, Goods Trade Balance, and Industrial Production m/m. The sterling may suffer today as the GDP and Construction Output are forecasted to be worse than before. Besides, the Canadian economy will also remain in highlights for the release of Employment Change and Unemployment Rate as both of these are expected to report negative data.

Economic Events to Watch Today  


EUR/USD – Daily Analysis

The EUR/USD pair was closed at 1.17599 after placing a high of 1.17815 and a low of 1.17325. Overall the movement of the EUR/USD pair remained flat throughout the day. The EUR/USD pair remained flat on Thursday as it closed its day on the same level it was started with. The earlier decline in the EUR/USD pair was due to the rising concerns mentioned in monetary policy accounts. At the same time, the surge in the EUR/USD pair was caused by the latest comments from President Trump about the U.S. stimulus deal.

The ECB issued its September’s monetary policy meeting minutes on Thursday that suggested that ECB could roll out more stimulus later this year as the Bank was more concerned about the pandemic hit economy than analysts had previously thought. 

The minutes revealed that ECB was more concerned about the inflation trajectory and Euro than market participants anticipated. The Euro struggled to find demand after the release of minutes that suggested that further stimulus was not too distant in the future amid an uncertain economic outlook. The ECB officials’ tone in the September meeting minutes was in contrast to the ECB President Christine Lagarde’s speech that showed no concerns about the rising Euro and was optimistic about the Eurozone economy.

Lagarde had said that the strong rebound in activity was broadly in line with previous projections. Whereas, the ECB accounts showed that members preferred the Bank to remain flexible on policy and have concerns about the pace of inflation.

Furthermore, the Vice President of the European Central Bank, Luis de Guindos, said that ECB has to use its tools at its disposal as the coronavirus pandemic depresses inflation expectations. These concerns weighed on single currency euro and dragged the prices of the EUR/USD pair in the early trading session. Whereas, in the late trading session, the U.S. President Donald Trump said that he favored a mini-accord focused on airlines and checks to all Americans. After terminating talks with Democrats for further stimulus, these comments raised hopes that some packages will be announced soon. This weighed on the U.S. dollar and raised the EUR/USD pair in the late trading session and closed the day at the opening level that provided flat movement in the pair.

On the data front, at 10:59 GMT, the German Trade Balance for August dropped to 15.7B from the projected 17.1B and weighed on single currency Euro. Whereas from the U.S. side, the Unemployment claims during last week rose to 840K against the expected 820K and weighed on the U.S. dollar that added strength to EUR/USD pair.

Daily Technical Levels

Support Resistance

1.1734    1.1784

1.1708    1.1808

1.1684    1.1834

Pivot point: 1.1758

EUR/USD– Trading Tip

The EUR/USD pair is consolidating below 1.1780 level, and the closing of candles below the triple top resistance level of 1.1780 level may drive the selling trend in the EUR/USD pair until the support level of 1.1758 and 1.1740 level. Conversely, the bullish breakout of the 1.1780 level can trigger a sharp buying trend until today’s 1.1807 marks.


GBP/USD – Daily Analysis

The GBP/USD pair was closed at 1.29340 after placing a high of 1.29702 and a low of 1.28913. Overall the movement of the GBP/USD pair remained bullish throughout the day. The Governor of the Bank of England’s positive comments and Trump’s support for the U.S. stimulus package pushed GBP/USD pair higher on grounds on Thursday. GBP/USD pair raised and extended its previous day’s gains despite rising concerns over the coronavirus situation in the U.K. and Brexit deal.

On Thursday, the Bank of England Governor Andrew Bailey said that the Bank was not out of power to handle the downside risks faced by the economy as the country focus was shifted to the second wave of the coronavirus crisis. Bailey said that economic recovery has been very uneven, with different sectors gaining more than others. He also said that there was an unprecedented level of uncertainty at the moment, and the risk was very much on the downside, but the Bank was not out of ammunition to fight the crisis yet. 

He added that the Bank has many policy tools that could be used promptly in response to the second wave and third wave if needed. 

Britain experienced a record decline in economic output in the second quarter of this year by a GDP contraction of 19.8%, the biggest drop since the record began in 1955. Bailey said that the country was still in a very big recession, with the economic recovery from the pandemic height very uneven. These comments from Bailey raised British Pound and helped GBP/USD pair to post gains.

The upward trend of the GBP/USD pair was further supported by the latest Trump’s call for a small stimulus package from the U.S. Congress for airline and small businesses. The change of view by Trump over stimulus measure within a day weighed on the U.S. dollar and supported the upward movement of the GBP/USD pair.

 Furthermore, the U.S. dollar was also weighed by the last week’s Unemployment Claims that rose to 840K from the projected 820K last week. The weak U.S. dollar pushed GBP/USD further on the upside on Thursday and extended its gains.

Whereas, the coronavirus cases in the north of England were getting out of control and were under a serious situation. The minister defended the government plans to introduce new restrictions that would include a ban on overnight stays and closing the pubs and restaurants in the worst-affected areas. These potential restrictions to control the coronavirus situation in the U.K. weighed on GBP and capped further gains in GBP/USD pair on Thursday.

On the data front, at 04:01 GMT, the RICS House Price Balance raised to 61% from the expected 39% and supported British Pound that added strength to GBP/USD pair. On the Brexit front, the hopes for a Brexit deal were fading in the market and weighing on British Pound with Boris Johnson giving threats to walk away from talks if the deal was not reached by 15th October. At the same time, E.U. officials have dared Johnson to walk away if he views a deal as impossible. 

According to Bloomberg, the E.U. officials are working on a plan that will find a way to carry on discussions into the second half of October despite some differences remaining on both sides. The uncertain Brexit developments have weighed on British Pound and limited the additional gains in GBP/USD on Thursday.

Daily Technical Levels

Support Resistance

1.2921    1.3013

1.2863   1.3049

1.2828    1.3106

Pivot Point: 1.2956

GBP/USD– Trading Tip

The GBP/USD is trading at 1.2960 level, holding right below an immediate resistance level of 1.2960. The resistance is extended by a double top resistance level on the hourly timeframe. Below the 1.2960 resistance level, the Sterling can trigger selling until the 1.2920 level and 1.2900 level. On the higher side, a bullish breakout of 1.2960 levels can trigger buying until the 1.3000 level. The fundamental side is busy today, and the U.K. economy is due to release series of economic events, with a special focus on the U.K. GDP data. A positive date is likely to drive a bullish breakout until 1.3000. At the same time, the negative GDP figures may lead the GBP/USD price towards 1.29350. 


USD/JPY – Daily Analysis

The USD/JPY pair was closed at 106.026 after placing a high of 106.106 and a low of 105.923. Overall the movement of the USD/JPY pair remained bullish throughout the day. The pair USD/JPY consolidated in a range of around 106 marks on Thursday amid mixed statements from President Trump, House Speaker Pelosi, and Treasury Secretary Mnuchin related to U.S. stimulus measure. 

Earlier this week, President Trump halted further negotiations with Democrats for a stimulus measure package and said he would provide a massive stimulus measure to win the election. However, the next day, Trump backed from his statement amid the need for financial support to airlines and small businesses that had been hit hardest by the pandemic crisis. 

Trump called for a small stimulus aid for airlines, which weighed on the U.S. dollar that was moving higher due to his previous comments. U.S. stocks, however, rallied after the new call for a small package by President Trump. These statements helped the USD/JPY pair to post gains due to improved risk sentiment in the market on Thursday.

On the other hand, the House Speaker Nancy Pelosi said that a mini-accord was not possible without passing a big stimulus in response to calls for a small aid package. These contrasting statements from both sides frustrated the traders and increased concerns in the market. After Pelosi’s comments, the rally in equities that started earlier suffered and was reversed on Thursday.

On the data front, at 04:50 GMT, the Current Account Balance from Japan raised in August to 1.65T against the forecasted 1.50T and supported the Japanese Yen. At 10:02 GMT, the Economy Watchers Sentiment increased to 49.3 from the projected 45.0 and supported the Japanese Yen.

From the U.S. side, the Consumer Credit for August was released at 00:00 GMT, which dropped to -7.2B against the forecasted 14.9B and weighed on the U.S. dollar. At 17:30 GMT, the Unemployment Claims from last week raised to 840K from the anticipated 820Kand weighed on the U.S. dollar.

Despite Japan’s positive data and negative data from the United States, the currency pair USD/JPY managed to remain bullish throughout the day on Thursday. Meanwhile, the risk sentiment was also improved by the latest news that the United States has enough coronavirus vaccine for every American by March. The Health and Human Services (HHS) Secretary Alex Azar said that Americans could use vaccines by March to be available for every one of them. This improved risk sentiment weighed on the safe-haven Japanese Yen and supported the USD/JPY pair on Thursday.

Daily Technical Levels

Support Resistance

105.66    106.18

105.36    106.42

105.13    106.71

Pivot point: 105.89

USD/JPY – Trading Tips

The USD/JPY pair has violated the ascending triangle pattern at 105.800 level, and now the same level is working as a support for the safe-haven pair. On the higher side, the USD/JPY pair can continue its bullish bias until the 106.270 level. However, we can expect USD/JPY to retrace back until the support level of 105.800 level before showing us a bullish trend. Let us wait to buy over 105.800, but the next support will prevail at the 105.450 level. Let’s consider staying bullish over the 105.800 level today, and selling should also be considered only below this level today. Good luck! 
Categories
Forex Daily Topic Forex Price Action

Trading Within Last Weekly Range

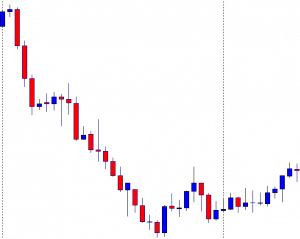
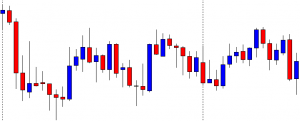
In today’s lesson, we will demonstrate an example of a chart where the price is having a retracement within the last weekly range. The price produces a double bottom and makes a breakout at the neckline. It then consolidates but does not head towards the North as it normally does when it makes a breakout at weekly high/low. Let us proceed and find out the possible reason behind it.

The price makes a long bearish move and finds its support. Upon producing a bullish engulfing candle, it heads towards the North and comes back again. At the support zone, it produces a bullish inside bar. Let us see what happens next.

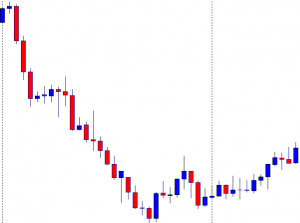
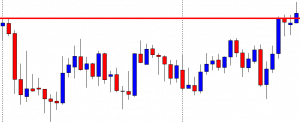
The price heads towards the North next week. It means it is trading within the last week’s range. The price is at the last swing high. If it makes a bullish breakout, the buyers may want to go long at its weakness.

The chart produces two bearish candles followed by a bullish engulfing candle closing within the last swing high. It seems that the price may consolidate more to find its way.

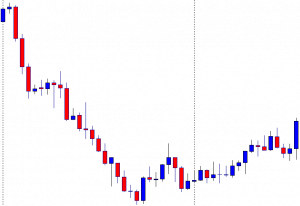
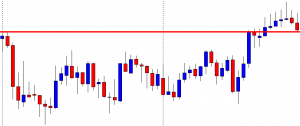
The price upon producing a spinning top followed by a bullish engulfing candle makes a bullish breakout at the last swing high. It is a neckline breakout of a double bottom. The buyers may keep their eyes on the chart to go long on its weakness.

The price produces a bearish inside bar followed by a spinning top with a bullish body. Then, it produces a bullish candle closing above consolidation resistance. Since it is a breakout at the resistance, it is supposed to be a buy signal. The question is whether the buyers should trigger a long entry or not. Let us see the next chart.

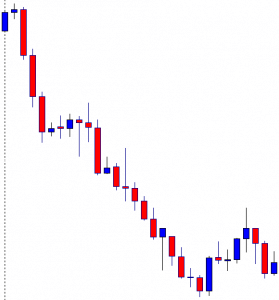
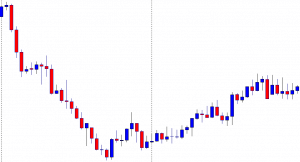
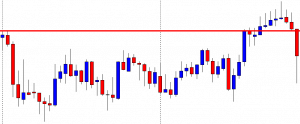
The price gets choppy, struggling to make a breakout towards the North. The buyers would not love to see such price action after triggering the entry. If the price makes a breakout at the last week high/low, traders wait for the price to consolidate and produce a bullish/bearish reversal candle to take entry upon a breakout. On the other hand, if the price trades within last week’s range, the price usually makes retracement (instead of consolidation) to offer entry. The Fibonacci level, such as the 38.2% and 61.8%, play a significant role in producing the reversal candle. In today’s chart, the price is in the weekly range. Thus, traders are to wait for the price to make a retracement to offer them entry. It rather consolidates, which ends up making the price choppy.

Categories
Forex Signals

EUR/JPY Testing Double Top – Let’s Capture Bearish Correction!

<script type=”text/javascript” src=”https://s3.tradingview.com/tv.js”></script>
<script type=”text/javascript”>
var tradingview_embed_options = {};
tradingview_embed_options.width = ‘100%’;
tradingview_embed_options.height = ‘350’;
tradingview_embed_options.chart = ‘isGdqIfb’;
new TradingView.chart(tradingview_embed_options);
</script>

Entry Price – Sell 124.62
Stop Loss – 125.02
Take Profit – 124.22
Risk to Reward – 1:1
Profit & Loss Per Standard Lot = -$400/ +$400
Profit & Loss Per Micro Lot = -$40/ +$40
Fellas, now you can check out forex trading signals via Forex Academy mobile app. Follow the links below.
iPhone Users: https://apps.apple.com/es/app/fasignals/id1521281368
Andriod Users: https://play.google.com/store/apps/details?id=academy.forex.thesignal&hl=en_US

Categories
Forex Signals

USD/CAD Breaking Below Double Bottom Support – Quick Outlook! 

The USD/CAD pair was closed at 1.32564 after placing a highof1.33404 and a low of 1.32548. The USD/CAD pair dropped and removed all of its previous day’s gains on Wednesday amid broad-based U.S. dollar weakness and increasing crude oil prices. The U.S. dollar weakness was due to Trump’s latest U-turn on Wednesday’s previous day’s statement. The U.S. President Donald Trump backed his statement of halting the negotiations with Democrats because of continuous disagreement between both parties over the stimulus measure’s size. However, a day after that, Trump again called for more aid to Americans from U.S. congress as airlines and other small businesses were facing huge crises. 

This U-turn by Trump raised risk sentiment in the market and supported the riskier Canadian Dollar that ultimately dragged the USD/CAD pair on Wednesday. The hopes for further stimulus dimmed on Tuesday after Trump’s advice to Republicans to stop negotiating with Democrats. These declined hopes added strength to the U.S. dollar on the previous day, but the strength was turned into weakness after Trump backed from his own statement on Wednesday.

The weak U.S. dollar added further pressure on the USD/CAD pair, and the pair posted big declines on Wednesday. Furthermore, the rising Crude oil prices also affected the USD/CAD pair movements on Wednesday. The WTI Crude oil rose on Wednesday despite the negative Crude Oil Inventories report from the United States.

At 19:30 GMT, the Crude Oil Inventories data from Energy Information Administration revealed that U.S. crude oil inventories for the previous week came in as 0.5M against -1.2M. The crude oil prices remained above $40 on Wednesday and added strength in commodity-linked currency Loonie. The rising crude oil prices raised the Canadian Dollar, which added pressure on the USD/CAD pair. Meanwhile, the Ivey Purchasing manager’s Index for September was released from Canada that dropped to 54.3 points against the forecasted 64.5 and weighed on the Canadian Dollar. It kept the losses in the USD/CAD pair limited on Wednesday.

Federal Reserve also released its September meeting minutes on Wednesday that revealed that officials were concerned about economic recovery and called for more stimulus measures to support the economic recovery. Minutes from Fed failed to give any specific direction to the USD/CAD pair on Wednesday, and the pair kept moving in a bearish trend.


Daily Technical Levels

Support Resistance

1.3222 1.3312

1.3192 1.3372

1.3132 1.3402

Pivot point: 1.3282

The USD/CAD is heading lower with a bearish bias at 1.3245 level, having violated the double bottom support level of 1.3250. The closing of the bearish engulfing pattern on the 4-hour timeframe triggered a bearish breakout, which is now likely to open further room for selling until 1.3202 levels. Checkout a trading plan below…

Entry Price – Sell 1.32344

Stop Loss – 1.32744

Take Profit – 1.31944

Risk to Reward – 1:1

Profit & Loss Per Standard Lot = -$400/ +$400

Profit & Loss Per Micro Lot = -$40/ +$40

Fellas, now you can check out forex trading signals via Forex Academy mobile app. Follow the links below.

iPhone Users: https://apps.apple.com/es/app/fasignals/id1521281368

Andriod Users: https://play.google.com/store/apps/details?id=academy.forex.thesignal&hl=en_US

Categories
Crypto Market Analysis

Daily Crypto Review, Oct 8 – DeFi Bubble Popped: Token Prices Shatter on Low Trading Volumes

The cryptocurrency sector as a whole has experienced a slight decrease as Bitcoin continued to path towards the downside. Bitcoin is currently trading for $10,525, representing a decrease of 0.47% on the day. Meanwhile, Ethereum lost 0.95% on the day, while XRP lost 1.09%.

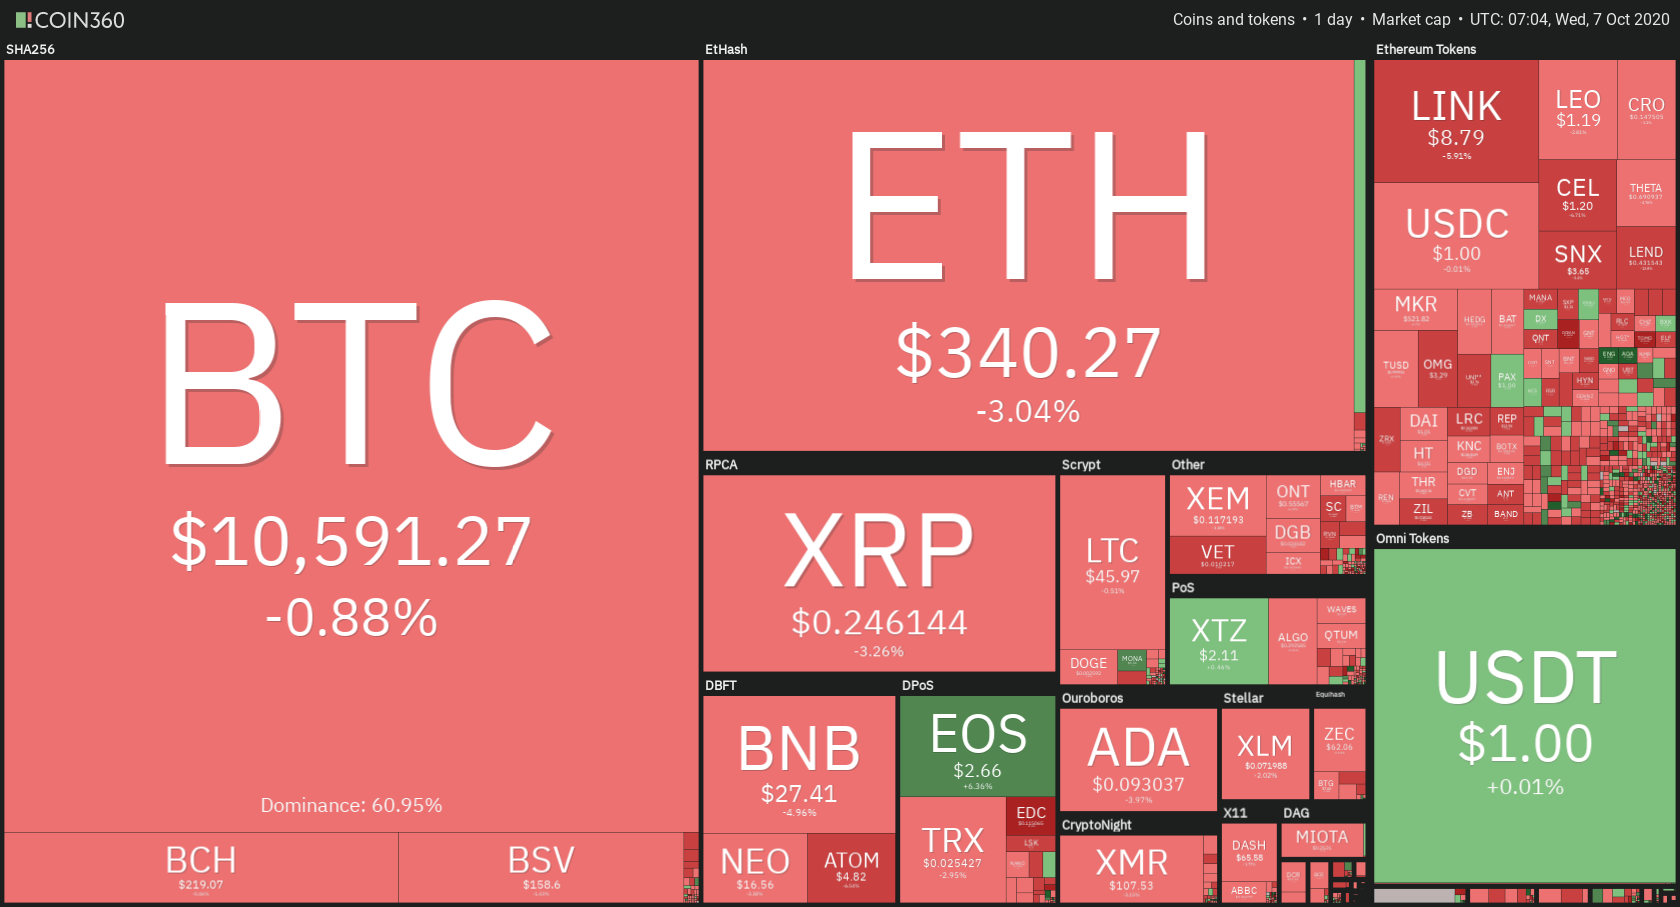
 Daily Crypto Sector Heat Map

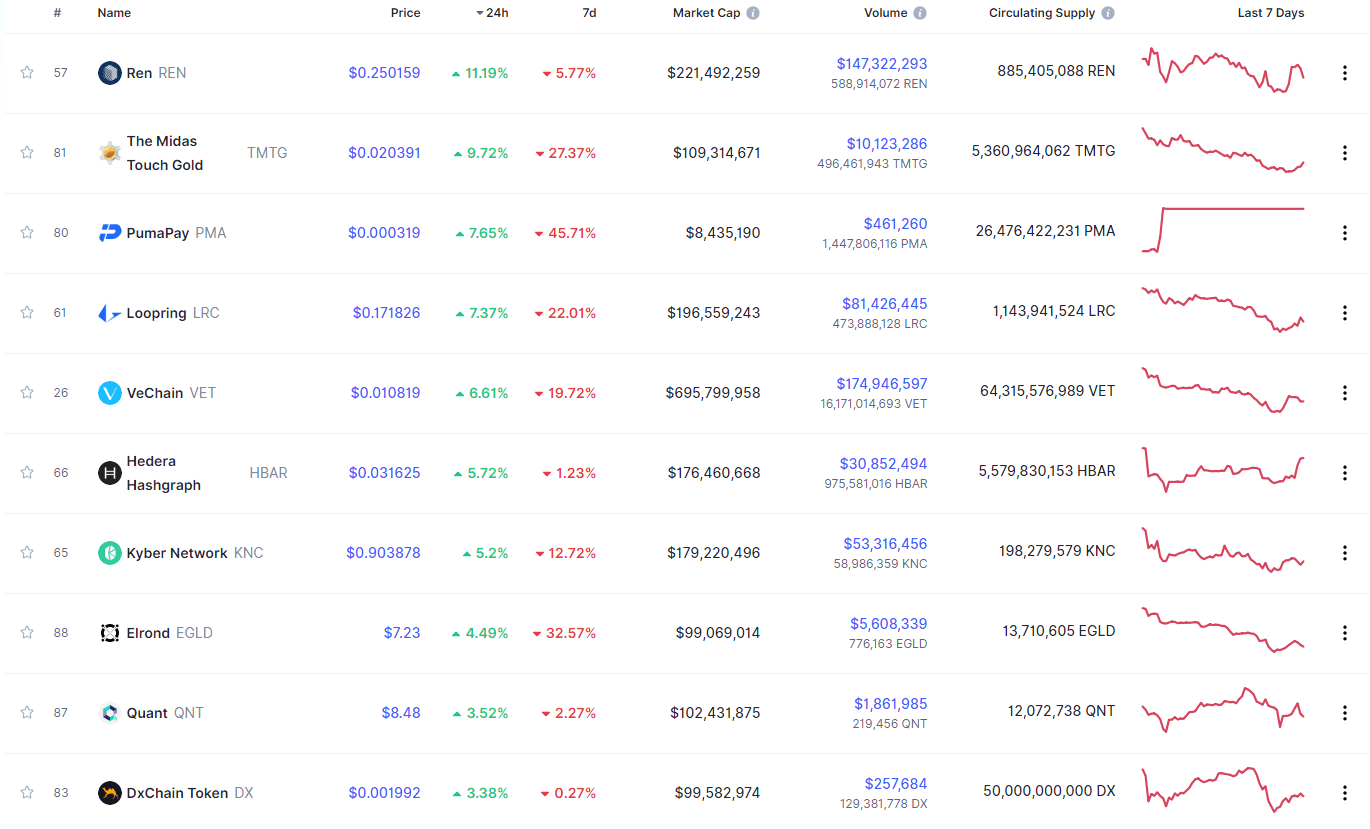
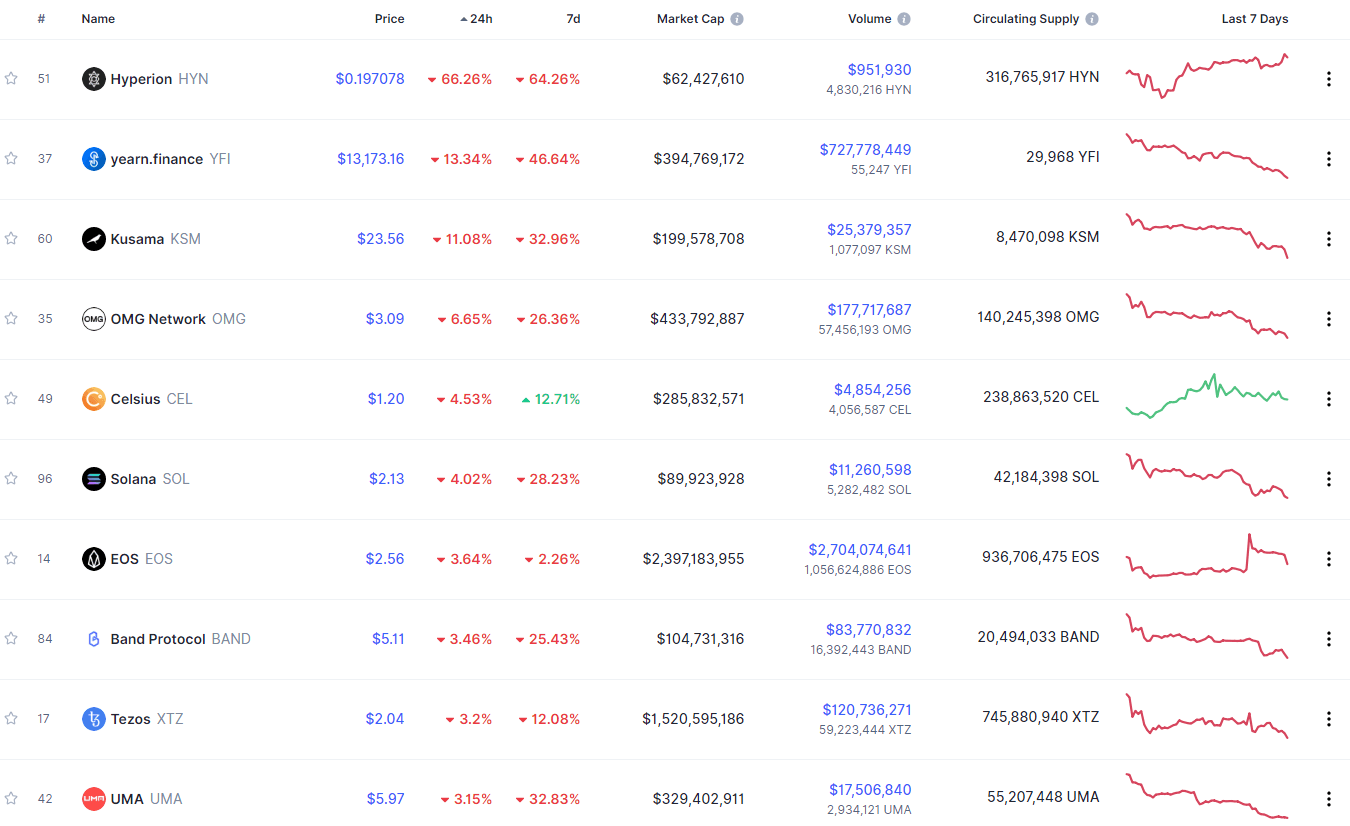
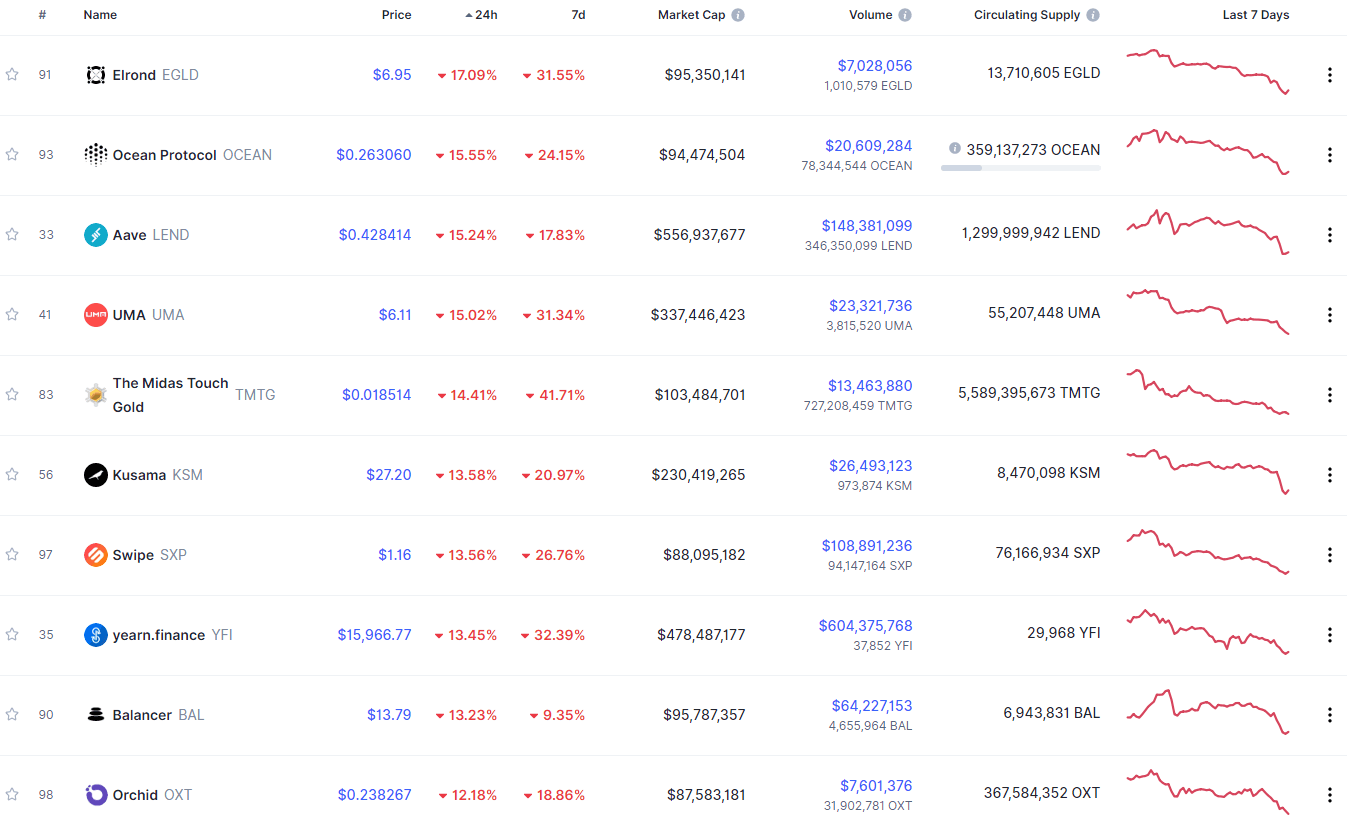
If we look at the top 100 cryptocurrencies, we can see that Ren gained 11.19% in the past 24 hours, making it the most prominent daily gainer. The Midas Touch Gold (9.72%) and PumaPay (7.65%) also did great. On the other hand, Hyperion lost 66.26%, making it the most prominent daily loser. It is followed by yearn.finance’s loss of 13.34% and Kusama’s loss of 11.08%.

Top 10 24-hour Performers (Click to enlarge)

Bottom 10 24-hour Performers (Click to enlarge)

Bitcoin’s market dominance level has stayed at the same place since our last report, with its value currently being at 60.96%. This value represents a 0.1% difference to the upside when compared to when we last reported.

Daily Crypto Market Cap Chart

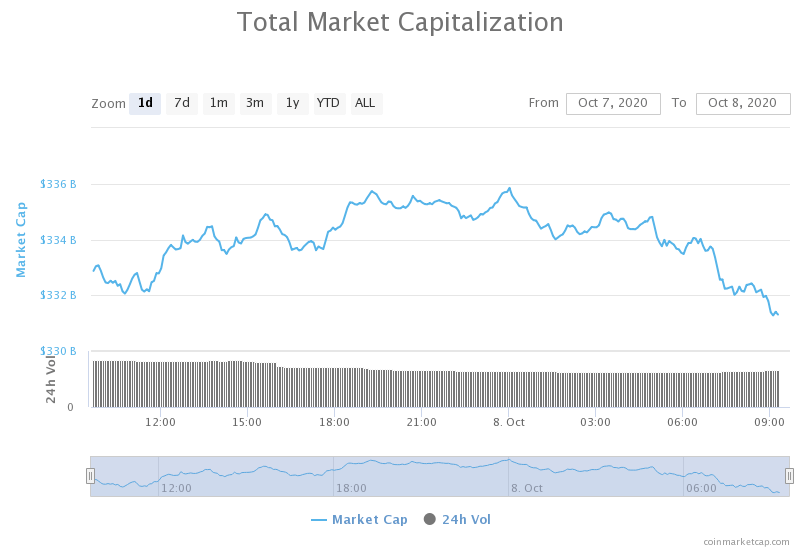
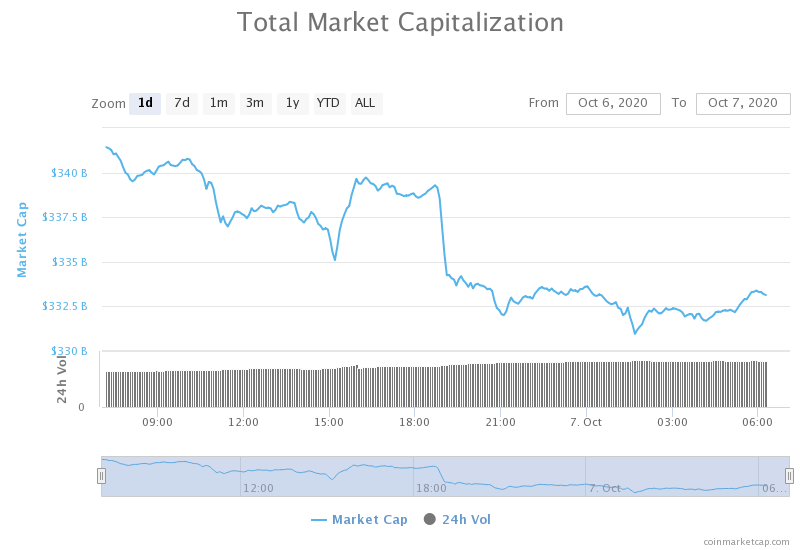
The crypto sector capitalization has lost a bit of value over the course of the past 24 hours. Its current value is $333.12 billion, representing a decrease of $2.28billion compared to our previous report.

_______________________________________________________________________

What happened in the past 24 hours?

_______________________________________________________________________

While the top cryptocurrencies lost only a fraction of their respective market capitalization value, the DeFi market has deflated drastically. It is estimated that the daily DeFi token trade volumes have dropped by 30% combined, while recent market leaders Sushi, Uniswap, and yearn.finance are among the hardest hit with weekly losses of as much as 51%, 38%, and 31%, respectively. On top of that, the Binance DeFi composite index dropped over 20% yesterday, and 63% from its first trading day in August.

However, this is not the end of DeFi, but rather a small pop of the inflated price bubble. The DeFi market has seen various “whales” accumulating DeFi tokens and using its protocols, which is a great sign that this part of the crypto sector is here to stay.

_______________________________________________________________________

Technical analysis

_______________________________________________________________________

Bitcoin

The largest cryptocurrency by market cap has continued moving down and testing its support levels. This time, Bitcoin tested the $10,500 level, which held up nicely (for now). While the immediate sentiment is certainly bearish, there isn’t enough volume to test and break the  $10,360 level, which is crucial for the future price development of Bitcoin.

While short-term traders are mostly tilted towards the sell-side due to both macroeconomic events and technical analysis, investors are quite bullish on Bitcoin simply due to how the largest cryptocurrency develops in terms of usability, adoption, and other fundamental concepts.

BTC/USD 4-hour Chart

Bitcoin’s technical overview follows what we previously said, with short-term technicals being bearish, while the longer-term ones are bullish. Its 4-hour and 1-day overview tilting towards the downside, while its longer-term technicals have remained bullish.

BTC/USD 4-hour Technicals

Technical factors (4-hour Chart):
  • Price is below both its 50-period EMA and 21-period EMA
  • Price is near the bottom Bollinger band
  • RSI is neutral (42.08)
  • Volume is average
Key levels to the upside          Key levels to the downside

1: $10,630                                 1: $10,500

2: $10,850                                 2: $10,360

3: $11,000                                  3: $10,015

Ethereum

Ethereum was moving towards the downside throughout the day, testing its $334 support level once again. Trading volume faded as Ethereum couldn’t break this support, therefore staying above $334. On top of that, the near-oversold RSI oscillator shows that the move might be over for the time being.

As we mentioned many times now, traders should be careful and pay attention to any increase in volume, but should ultimately try to trade Ethereum’s movements between $334 and $360.

ETH/USD 4-hour Chart

Ethereum’s short-term and long-term technical overviews both look very similar to Bitcoin’s. While its short-term technicals (4-hour and 1-day) are heavily tilted towards the sell-side, its weekly and monthly outlooks are still quite bullish (though the bearish sentiment in short-term technicals is stronger than with Bitcoin, while the bullishness of its long-term overviews is weaker than with Bitcoin).

ETH/USD 4-hour Technicals

Technical Factors (4-hour Chart):
  • The price is below both its 50-period and 21-period EMA
  • The price is at its lower Bollinger band
  • RSI is neutral (37.59)
  • Volume is descending
Key levels to the upside          Key levels to the downside

1: $360                                     1: $334

2: $371                                     2: $300

3: $400                                      3: $289

Ripple

XRP did not differ much from the aforementioned two cryptocurrencies, and pushed towards the downside itself as well. The third-largest cryptocurrency by market cap has broken the $0.2454 level to the downside and entered the “safe zone” between $0.235 and $0.2454. However, the fight for $0.2454 is not over yet, and XRP still has a chance to regain this high, even though it is highly unlikely at this point.

XRP will most likely stay below $0.2454, and traders can use that to their advantage when trading as they could trade XRP’s sideways movements.

XRP/USD 4-hour Chart

XRP 4-hour overview is tilted towards the sell-side, while its daily and weekly overviews are completely bullish. However, its monthly overview is just as bearish as the 4-hour one, showing signs of pre-established bearish sentiment.

XRP/USD 4-hour Technicals

Technical factors (4-hour Chart):
  • The price is at its 50-period EMA and below its 21-period EMA
  • Price is close to its bottom Bollinger band
  • RSI is neutral (46.60)
  • Volume is average
Key levels to the upside          Key levels to the downside

1: $0.266                                   1: $0.2454 

2: $0.27                                     2: $0.235

3: $0.273                                  3: $0.227


Categories
Forex Market Analysis

Daily F.X. Analysis, 08th October – Top Trade Setups In Forex – ECB Monetary Policy Meeting! 

On the news side, the economic calendar is likely to offer another round of central bankers’ speeches worldwide. BOC Gov Macklem, BOE Gov Bailey, and SNB Chairman Jordan are due to speak today. Simultaneously, the day’s main highlight is likely to be ECB Monetary Policy Meeting Accounts and Unemployment Claims from the U.S. economy.

Economic Events to Watch Today  


EUR/USD – Daily Analysis

The EUR/USD pair was closed at 1.17637 after placing a high of 1.17816 and a low of 1.17248. On Wednesday, the EUR/USD pair recovered most of its previous day’s losses after the U.S. dollar became weak on the back of U.S. President Trump’s support to multiple aid measures. This raised the risk-on market sentiment and helped the EUR/USD pair to gain traction in the market.

On Tuesday, the U.S. president called off negotiations with Democrats over the next round of stimulus measure and spurred the risk-off market sentiment that weighed on currency pair. Just a day after this announcement, Trump flipped and changed his statement and called for checks to all Americans, especially Airlines and payroll protection. 

On the data front, the German Industrial Production for August dropped to -0.2% against the forecasted 1.5% and weighed on Euro. At 11:45 GMT, the French Trade Balance dropped to -7.7B against the projected -6.5B and weighed on single currency Euro. At 13:00 GMT, the Italian Retail Sales for August increased to 8.2% from the projected 3.8% and raised the EUR/USD pair.

Meanwhile, the European Central Bank’s President Christine Lagarde said that ECB would not remove monetary support until the coronavirus crisis remains. She reinforced that the central Bank and fiscal authorities must work together. Lagarde said that ECB should guard against premature withdrawal of stimulus and stated that the risk of more divergence in the euro area would remain even after the coronavirus crisis. Lagarde’s comments did not have any major impact on the EUR/USD currency pair as she did not provide any new information.

Whereas, on the U.S. front, the FOMC published its September meeting minutes on Wednesday. Minutes revealed that economic data was recovering faster than expected from the Q2 decline. The outlook for the Eurozone economy assumed additional fiscal support, and Fed lawmakers urged U.S. Congress to deliver the next round of aid packages. However, the Federal Reserve September meeting minutes also had no major impact on the EUR/USD pairs.

Moreover, as the U.S. President Donald Trump has repeatedly pushed for approving a vaccine before elections, the U.S. Food and Drug Administration (FDA) said that a coronavirus vaccine would not be approved by Election Day. This news raised the risk sentiment in the market and appreciated the EUR/USD pair.

Daily Technical Levels

Support Resistance

1.1729    1.1788

1.1697    1.1815

1.1670    1.1846

Pivot point: 1.1756

EUR/USD– Trading Tip

On Thursday, the EUR/USD is trading with a slight bullish bias around 1.1740 level, holding within an upward channel providing support at 1.1759 level and resistance at 1.1800. Bullish trend continuation may lead the EUR/USD exchange rate towards 1.1840 mark, and continuation of upward movement may lead the pair towards 1.1865. While on the lower side, support stays at 1.1760 and 1.1725 level today. The ECB Monetary Policy Meeting Accounts will be in highlights to determine the next movement in the market.  


GBP/USD – Daily Analysis

The GBP/USD pair was closed at 1.29181 after placing a high of 1.29294 and a low of 1.28449. The GBP/USD pair followed its previous day bearish trend dropped further in the earlier trading session; however, the pair managed to reverse its direction in the late session and posted gains for the day. The improving risk sentiment in the market helped GBP/USD pair to move upward on Wednesday.

The U.S. President Donald Trump flipped from its Tuesday’s statement that negotiations between Republicans and Democrats will not proceed until after the election. On Wednesday, Trump backed from it and called for additional support to Americans, especially Airline workers. This turn back from Trump was not expected and supported the risk sentiment that ultimately added strength to the GBP/USD pair.

Meanwhile, the statement by Michael Gove gave new optimism about the Brexit deal and supported British Pound. The Chancellor of Lancaster’s duchy said that there were 66% chances that a Brexit deal would be reached amid fresh optimism over a breakthrough on one stocking point of state aid. 

It seems like just like state aid, other sticking points will break, and the Brexit deal will be reached before the end of this year. This optimism lifted British Pound in the market against its rivals and pushed GBP/USD pair on the upside. However, some concerning news also circulated about the European Union being hard on fisheries issues in the market. E.U. had hardened its stance over the fisheries issue and said that Britain should be forced to hand over the same amount of fish as it used to do when it was an E.U. member. The rising concerns over fisheries sticking point limited the British Pound gains on Wednesday.

On the data front, at 12:32 GMT, the Halifax HPI from the United Kingdom for September rose to 1.6% from the projected 1.5% and supported British Pound. At 13:30 GMT, the Housing Price Index for the year in August dropped to 2.3% from the forecasted 3.4% and weighed on British Pound.

From the U.S. side, the Federal Reserve issued its meeting minutes from September, which showed that lawmakers were urging U.S. Congress to deliver the next round of stimulus package, and they were stressing the need for it. 

The economic data was recovering much better than expected in Q2, but the fiscal government still needed support. Minutes failed to impress the U.S. dollar, and the pair GBP/USD continued to move higher.

British Pound investors will closely look forward to the speech of Governor of Bank of England Andrew Bailey to find fresh clues about the U.K. economic condition. On the data front, the Unemployment Claims form the U.S. will also greatly impact the GBP/USD pair’s prices on Thursday.

Daily Technical Levels

Support Resistance

1.2921    1.3013

1.2863    1.3049

1.2828    1.3106

Pivot Point: 1.2956

GBP/USD– Trading Tip

The GBP/USD is trading at 1.2930 level, heading north to complete Fibonacci retracement, especially after breaking the bullish channel at 1.2930. For the moment, the same level is anticipated to produce resistance to the GBP/USD pair. We may notice a bullish movement in Sterling, particularly in the wake of bullish correction unto 1.2930. Failure to violate this mark or closing candles beneath the 1.2930 mark is anticipated to drive selling bias unto the 1.2865 level. The MACD and RSI support bullish bias. However, the recent smaller histograms of MACD advise neutral bias among traders. Let’s consider taking buy over 1.2956 or selling below the same.


USD/JPY – Daily Analysis

The USD/JPY closed at 105.962 after placing a high of 106.105 and a low of 105.593. The USD/JPY pair rose to its highest level since 14th September on Wednesday on the back of improved risk sentiment and U.S. dollar strength. Trump’s latest flip from his own words gave a push to risk sentiment in the market and supported the USD/JPY pair’s an upward trend on Wednesday.

The Federal Reserve issued minutes from its recent meeting, which showed that officials were worried about what would happen if financial aid decreased or disappeared. Furthermore, on Wednesday, the Minneapolis Federal Reserve President Neel Kashkari said that the U.S. economy would face enormous consequences if the next round of stimulus packages were not approved soon. He stated that there were no moral hazards in issuing more aid, and further delay would cause a much worse downturn. 

Kashkari added that unlike the 2008 financial crisis, the 2020 pandemic crisis was not born of financial system weakness, so financial aid must be approved to support airlines and other industries that were facing big damages. The comments from Kashkari raised concerns and helped improve risk sentiment that supported the USD/JPY pair’s bullish stance on the day.

Meanwhile, the Bank of Japan’s Governor Haruhiko Kuroda said that Japan’s economy was difficult, but it has started to pick up. He said that the impact of COVID-19 would be watched carefully to take additional steps in monetary easing. He added that Bank would not hesitate to further assess in time of need. Kuroda said that the Consumer Prices in Japan are likely to fall for the time being and will start to increase as the economy will improve. The comments from Kuroda also failed to provide any meaningful impact on the USD/JPY pair prices.

On the data front, the Leading Indicators from Japan were released at 10:00 GMT that came in line with 88.8% expectations. Furthermore, the U.S. President Donald Trump said that Republicans would not proceed with the negotiations on the U.S. Stimulus package with Democrats as they were proposing a $2.4 trillion package and Republicans were ready for only a $1.6 trillion packages. However, on Wednesday, Trump backed from his statement and asked for more aid from U.S. Congress for Americans, especially for airline workers and small businesses.


The flip of Trump raised risk sentiment in the market and weighed on the safe-haven Japanese Yen that lifted the USD/JPY pair. Moreover, the risk-sentiment was further bolstered by the news that the US FDA has said that the developed vaccine’s availability will be delayed until after the U.S. presidential elections on 03rd November. It also affected the Japanese Yen due to its safe-haven status and supported the USD/JPY pair is an upward trend.

Daily Technical Levels

Support Resistance

105.66    106.18

105.36    106.42

105.13    106.71

Pivot point: 105.89

USD/JPY – Trading Tips

The USD/JPY pair has violated the ascending triangle pattern at 105.800 level, and now the same level is working as a support for the safe-haven pair. On the higher side, the USD/JPY pair can continue its bullish bias until the 106.270 level. However, we can expect USD/JPY to retrace back until the support level of 105.800 level before showing us a bullish trend. Let us wait to buy over 105.800, but if the pair breaks below this level, the next support will prevail at the 105.450 level. Good luck! 

Categories
Forex Signals

USD/CHF Trades Bearish Downward – Weaker Dollar in Play! 

During the Wednesday’s Asian trading hours, the USD/JPY currency pair failed to stop its previous sessU.S.n bearish trend and took further offers below the 0.9170 level. However, the reason for the bearish tone around the currency pair could be associated with the broad-based U.S. dollar weakness, triggered by the renewed concerns about the already shaky U.S. economic recovery. 

Apart from this, the upbeat market sentiment also undermined safe-havU.S. U.S. dollar and contributed to the currency pair losses. On the contrary, the U.S. positive tone around the equity market undermined the safe-haven Swiss franc, which becomes the fU.S.tor that helps the USD/CHF currency pair limit its deeper losses. Currently, the USD/CHF currency pair is currently trading at 0.9168 and consolidating in the range between 0.9160 – 0.9186.

The market trading sentiment remained supported by reports suggesting that the U.S. President Trump showed a willingness to pass $25 billion for Airline Payroll Support and $135 billion for small businesses for the Paycheck Protection Program. The U.S. positive data provided a fresh boost to the market’s risk sentiment and trimmed the U.S. dollar’s safe-haven bids.

However, the optimism around the equity market was unaffected by U.S. President Donald Trump’s decision to cancel the talks with Democrats on theU.S.conomic stimulus package to boost the coronavirus-hit economy. It is worth recalling that the theU.S. President Donald Trump canceled talks with Democrats over the stimulus package, which raised doubts about the U.S. economic recovery. This, in turn, led in no small fallU.S.n the U.S. equity markets on Tuesday, but the reaction turned out to be short-lived.

As a result of the upbeat markeU.S.sentiment, the broad-based U.S. dollar failed to gain any positiU.S. traction during the European trading session. Besides, the losses could be associated with the renewed concerns about the already shakyU.S.S economic recovery, which also undermine the broad-based U.S. dollar. However, the U.S. dollar losses became the key factor that kept the currency pair under pressure. U.S.ereas, the U.S. Dollar Index, which tracks the greenback U.S.ainst a basket of six other currenciU.S., was up 0.1% at 93.737.

Looking forward, the market traders keeping their eyes on theU.S. Chair Jerome Powell’s scheduled speech. In the meantime, the updates surrounding the fresh Sino-US tussle, as well as the coronavirus (COVID-19), could not lose their importance.


Daily Support and Resistance

S1 0.9127

S2 0.9164

S3 0.9185

Pivot Point 0.9202

R1 0.9222

R2 0.9239

R3 0.9277

The USD/CHF pair is trading with a bearish bias at 0.9165 level, forming a downward channel on the 4-hour timeframe. On the lower side, the bearish trend continuation is likely to drive the selling trend until the 0.9140 support level. At the same time, the MACD is also forming smaller histograms than before, suggesting selling bias in the market. Here’s a quick trade plan… 

Entry Price – Sell 0.91736

Stop Loss – 0.92136

Take Profit – 0.91336

Risk to Reward – 1:1

Profit & Loss Per Standard Lot = -$400/ +$400

Profit & Loss Per Micro Lot = -$40/ +$40

Fellas, now you can check out forex trading signals via Forex Academy mobile app. Follow the links below.

iPhone Users: https://apps.apple.com/es/app/fasignals/id1521281368

Andriod Users: https://play.google.com/store/apps/details?id=academy.forex.thesignal&hl=en_US

Categories
Forex Signals

EUR/JPY Extends Bullish Bias Amid Faded Safe Haven – Signal Update 

During the Wednesday’s Asian trading hours, the EUR/JPY currency pair extended its Asian session winning streak and remain bullish around above 124.50 level mainly due to a fresh and robust rebound in the equity markets, which undermined the Japanese yen’s safe-haven demand and turned out to be the key factor that extending some support to the USD/JPY currency pair. However, market traders digested the US President Donald Trump’s decision to cancel talks with Democrats on the stimulus package. This was witnessed after the steep fall in the US equity markets turned out to be short-lived. 

On the contrary, the dismal German industrial figures and coronavirus woes in Europe ten undermine the shard currency and become the key factor that kept the lid on any additional gains in the currency pair. As of writing, the EUR/JPY currency pair is currently trading at 124.64 and consolidating in the range between 123.86 – 124.72.

As we already mentioned, the Industrial Production in Germany unexpectedly dropped in August, as per the official data showed on the day, suggesting that the manufacturing sector’s recovery is losing momentum. Apart from this, the bearish sentiment around the shared currency was further bolstered by the World Health Organization’s (WHO) Regional European Director Hans Kluge warnings that Europeans suffer “pandemic fatigue” from the disruption caused by the rapid spread of the coronavirus. Thus, it was seen as one of the key factors that capped further currency pair gains.

On the contrary, the positive mood around the equity markets, triggered by a strong pickup in the US Treasury bond yields, tends to undermine the Japanese yen’s safe-haven demand and becomes one of the key factors that kept the currency pair intra-day high. It is worth recalling that the US President Donald Trump’s yesterday’s decision to cancel negotiations with Democrats over the stimulus package raised doubts about the US economic recovery. This, in turn, led to a large fall in the US equity markets on Tuesday, but the reaction turned out to be short-lived.

Looking forward, the market traders keeping their eyes on the Fed Chair Jerome Powell’s scheduled speech. In the meantime, the updates surrounding the fresh Sino-US tussle, as well as the coronavirus (COVID-19), could not lose their importance.


Daily Support and Resistance

S1 121.85

S2 122.64

S3 123.04

Pivot Point 123.43

R1 123.83

R2 124.22

R3 125

The EUR/JPY pair is trading with a bullish bias at 124 level as the single currency Euro gained bullish momentum. Simultaneously, the Japanese yen is getting weaker, just like gold amid weakness in the safe-haven appeal. We opened a buying trade over 124.175 level as it was extended by an upward channel on the 2-hour timeframe. Since we are already out, encashing 36 green pips, I would like to take a second trade, perhaps, a selling one below the 125.300 resistance level now. Let’s brace for it! 

Categories
Crypto Market Analysis

Daily Crypto Review, Oct 7 – Crypto Sector Falls As Trump Rejects Stimulus Proposal

The cryptocurrency sector has declined slightly as Bitcoin returned to the level it was on Monday. Bitcoin is currently trading for $10,591, representing a decrease of 0.88% on the day. Meanwhile, Ethereum lost 3.04% on the day, while XRP lost 3.26%.

 Daily Crypto Sector Heat Map

If we look at the top 100 cryptocurrencies, we can see that PumaPay gained 6.93% in the past 24 hours, making it the most prominent daily gainer. EOS (5.08%) and Ethereum Classic (2.6%) also did great. On the other hand, Elrond lost 17.09%, making it the most prominent daily loser. It is followed by Ocean Protocol’s loss of 15.55% and Aave’s loss of 15.24%.

Top 10 24-hour Performers (Click to enlarge)

Bottom 10 24-hour Performers (Click to enlarge)

Bitcoin’s market dominance level has increased slightly since our last report, with its value currently being at 60.95%. This value represents a 0.49% difference to the upside when compared to when we last reported.

Daily Crypto Market Cap Chart

The crypto sector capitalization has lost quite a bit of value over the course of the past 24 hours. Its current value is $335.30 billion, representing a decrease of $7.1 billion compared to our previous report.

_______________________________________________________________________

What happened in the past 24 hours?

_______________________________________________________________________

_______________________________________________________________________

Technical analysis

_______________________________________________________________________

Bitcoin

The largest cryptocurrency by market cap has spent a day declining in price slightly, with many analysts speculating that it was because of US President Donald Trump’s tweet on his rejection of the most recent stimulus proposal. Analysts that are less concerned about fundamentals saw a potential death cross as well as Bitcoin not being able to confidently pass the ascending trend (pink line), ultimately causing a small crash.

For the time being, Bitcoin will remain range-bound by the $10,360 level to the downside and $10,850 level to the upside as main support and resistance levels.

BTC/USD 4-hour Chart

Bitcoin’s short-term technicals have turned more bullish than yesterday, with both its 4-hour and 1-day overview tilting towards the downside. However, its longer-term technicals have remained bullish.

BTC/USD 4-hour Technicals

Technical factors (4-hour Chart):
  • Price is below both its 50-period EMA and 21-period EMA
  • Price is slightly below its middle Bollinger band
  • RSI is ascending (46.96)
  • Volume is average (after the one-candle spike)
Key levels to the upside          Key levels to the downside

1: $10,630                                 1: $10,500

2: $10,850                                 2: $10,360

3: $11,000                                  3: $10,015

Ethereum

Ethereum was trading on increased volume in the past 24 hours, with the volume starting to ramp up as the second-largest cryptocurrency by market cap was unable to break the top Bollinger Band line. This caused a slight crash, which pulled back Ether to its support level of $334, which held up quite nicely.

As we mentioned many times now, traders should pay attention to any increase in volume, but should ultimately trade Ethereum’s movements between $334 and $360.

ETH/USD 4-hour Chart

Ethereum’s short-term and long-term technical outlook looks very similar to Bitcoin’s. Its short term technicals (4-hour and 1-day) are heavily tilted towards the sell-side, while its weekly and monthly outlooks are still quite bullish.

ETH/USD 4-hour Technicals

Technical Factors (4-hour Chart):
  • The price is below both its 50-period and 21-period EMA
  • The price is at its lower Bollinger band
  • RSI is neutral (40.44)
  • Volume is above average
Key levels to the upside          Key levels to the downside

1: $360                                     1: $334

2: $371                                     2: $300

3: $400                                      3: $289

Ripple

XRP had a pullback day, where its price tried to find equilibrium after two days of pushing towards the upside. The third-largest cryptocurrency by market cap traded on increased volume, which indicated that the pullback would be more severe. The price has reached the $0.2454 support level and briefly fell under it as well. It is yet uncertain whether XRP has finished its pullback phase and remained above $0.2454, or if the fight for this level still continues.

XRP/USD 4-hour Chart

XRP 4-hour, daily, and weekly technicals are now tilted towards the buy-side, while its monthly outlook remains tilted towards the sell-side.

XRP/USD 4-hour Technicals

Technical factors (4-hour Chart):
  • The price is above its 50-period EMA and right at its 21-period EMA
  • Price is at its middle Bollinger band
  • RSI is neutral (51.12)
  • Volume is above average
Key levels to the upside          Key levels to the downside

1: $0.266                                   1: $0.2454 

2: $0.27                                     2: $0.235

3: $0.273                                  3: $0.227


Categories
Forex Market Analysis

Daily F.X. Analysis, October 07 – Top Trade Setups In Forex – FOMC Meeting Minutes Ahead! 

It’s going to be another busy day from the news front as the ECB and Fed officials are due to speak during the U.S. and European session today. The ECB President Lagarde is expected to speak at the Paris Europlace online International Financial Forum. Simultaneously, FOMC Member Kashkari is scheduled to discuss racism and the economy at a virtual event series. However, the investor’s focus will also stay on the FOMC Meeting Minutes from the U.S. In can be a big market mover during the mid-U.S. session.

Economic Events to Watch Today  


EUR/USD – Daily Analysis

The EUR/USD closed at 1.17824 after placing a high of 1.17973 and a low of 1.17047. Overall the movement of the EUR/USD pair remained bullish throughout the day. The EUR/USD pair rose to its nine-day highest level amid the broad-based U.S. dollar weakness and the strong positive macro-economic data from the European side.

The U.S. dollar was lower after the news about U.S. President Donald Trump’s health came into the market. Another factor helping the risk sentiment was the hopes that U.S. stimulus measures will now be delivered soon as Trump’s infection has brought the virus to Capitol Hill. Both Democrats and Republicans will now realize the urgency of responding to the virus impact and reach a consensus over the aid bill’s size. The renewed stimulus hoped also added strength to the risk sentiment and helped the EUR/USD pair to gain further.

At 13:00 GMT, the Final Services PMI for the whole Eurozone also rose to 48.0 from the anticipated 47.6 and supported the Euro currency. At 13:30 GMT, the Sentix Investor Confidence came in as -8.3 against the forecasted -9.2 and supported Euro. At 14:00 GMT, the Retail Sales from Europe rose to 4.4% from the expected 2.4% and supported Euro.

The Retail Sales in August from Eurozone raised nearly double than expectations to 4.4% and supported the local currency against its rival U.S. dollar and pushed the EUR/USD pair higher.

The Services PMI from all over European nations also rose and showed that the service industry improved from their previous levels and helped Euro to post gains. Furthermore, the Eurogroup meeting and the Financial Affairs Council meeting will start on 5-6th October. The Eurogroup will discuss its priorities under its new presidency and adopt a work program. The Eurozone’s policy priorities in the context of economic recovery and the draft budgets for 2021 will be discussed. Traders will look forward to meeting results for finding fresh clues about the EUR/USD pair in the coming days.

Daily Technical Levels

Support Resistance

1.1726     1.1817

1.1670     1.1854

1.1634     1.1909

Pivot point: 1.1762

EUR/USD– Trading Tip

The EUR/USD is trading at 1.1740 level, having reviolated the upward channel at 1.1750 level, mostly traded in line with our forecast to test the resistance level of 1.1801 level. On Tuesday, the EUR/USD is trading below a resistance level of 1.1801 level. Below this mark, the EUR/USD can plunge until the support resistance level of 1.1760 and 1.1740. In contrast, an upward breakout of 1.1801 can lead the EUR/USD pair towards 1.1840 areas. 


GBP/USD – Daily Analysis

The GBP/USD closed at 1.29726 after placing a high of 1.29920 and a low of 1.28995. Overall the movement of the GBP/USD pair remained bullish throughout the day. The GBP/USD pair extended its previous daily gains and reached its 11-day highest level above 1.299 level amid the broad-based U.S. dollar weakness and renewed Brexit deal hopes along with the improving risk sentiment around the market.

The British Pound to U.S. dollar exchange rate moved higher on rising expectations that the U.K. and E.U. will reach a consensus on the post-Brexit trade deal. The Goldman Sachs forecasted that both parties would reach a deal by early November.

Another factor involved in the Brexit deal’s raised hopes was the report that suggested that E.U. chief negotiator Michel Barnier aimed to hold talks with European coastal states to get the freedom to negotiate terms with the U.K. on the fisheries issue. It is one of the sticking points that have caused a delay in the Brexit deal progress. The Brexit hopes were further bolstered after Prime Minister Boris Johnson and European Commission president Ursula von der Leyen agreed that talks should be intensified to close the significant gap that has stalled the negotiations’ progress. 

All these above optimistic reports helped the local currency and pushed the GBP/USD pair on the above side. The bullish calls were supported by Goldman Sachs that urges investors to buy Sterling. However, the Goldman Sachs Bank did not completely take the prospect of no-deal Brexit out off the table and said that No-Deal Brexit’s perceived probability would remain intact beyond the next European Council meeting in mid-October.

If no deal is reached between the E.U. and U.K., Britain will leave the E.U. without a deal at the end of the transition period on December 31.

Meanwhile, on the data front, at 13:30 GMT, the Final Services PMI from Great Britain for September rose to 56.1 against the 55.1 and supported GBP. The stronger than expected Services PMI showed an expansion in the U.K. services activities and supported the already rising GBP/USD pair.

However, the U.S. dollar was weaker due to the rising risk sentiment on the reports of the quick recovery of the U.S. President Donald Trump from coronavirus infection. The stronger U.S. dollar onboard, along with the improved risk sentiment, also helped the GBP/USD pair’s plunge.

Daily Technical Levels

Support Resistance

1.2921     1.3013

1.2863     1.3049

1.2828     1.3106

Pivot Point: 1.2956

GBP/USD– Trading Tip

On Wednesday, the GBP/USD is trading at 1.2890 level after violating the upward channel at 1.2930. For the moment, the same level is expected to provide resistance to the Cable pair. We may see a slight upward movement in Sterling, especially in the wake of bullish correction until 1.2930. Failure to break this level or closing candles below the 1.2930 level is likely to drive selling bias until the 1.2865 level. The MACD and RSI are supporting selling bias, but the recent smaller histograms of MACD suggest sellers are exhausted, and we may see a slight upward correction in the market today. 


USD/JPY – Daily Analysis

The USD/JPY pair was closed at 105.735 and a high of 105.792 and a low of 105.228. Overall the movement of the USD/JPY pair remained bullish throughout the day. After posting hefty losses on Friday, USD/JPY reversed its direction and moved higher amid the improved risk sentiment and rising optimism in the market. 

The market’s mood was improved after a bumpy weekend related to the concerning news about the health of U.S. President Donald Trump. The Leader of the world’s largest economy was tested positive for coronavirus on Friday and was shifted to a military medical facility for treatment. The Contradictory headlines about his health and its effects on upcoming Presidential elections were raising concerns throughout the weekend. 

This news canceled the above fears and raised optimism around the market, boosting risk sentiment. The U.S. equities and the U.S. Treasury yields raised on the day, giving a boost to the U.S. dollar. Simultaneously, the rising risk sentiment weighed on the safe-haven Japanese Yen and pushed the USD/JPY pair.

On the data front, at 18:45 GMT, the Final Services PMI in September from the United States remained flat with the forecasts of 54.6. While at 19:00 GMT, the highlighted ISM Services PMI from the United States rose to 57.8 against the forecasted 56.3 and supported the U.S. dollar.

The ISM Services PMI showed an expansion in U.S. services activities in September and raised hopes for the quick economic recovery that helped improve the market’s risk sentiment and weighed on the Japanese Yen due to its safe-haven nature and ultimately pushed the USD/JPY pair even higher.

Moreover, the risk sentiment was also supported by the better than expected Retail Sales report from the European Union that doubled the expected number and supported riskier assets. The European stocks raised after this report, and U.S. stocks followed them that raised the market’s risk sentiment and helped the riskier GBP/USD pair gain further in the market.

Meanwhile, the USD/JPY pair’s gains remain limited by the rising fears of a second wave of coronavirus globally in the winter season. From all across the globe, the reports were suggesting a rising number of coronavirus cases. Europe struggled hard to fight against the pandemic and contained the spread as France, and the U.K. saw a continuous rise in daily count on infection cases. 

Meanwhile, other countries like Oman, Israel, India, France, Canada, UK, and Japan also reported a rise in infected people. This raised global concerns, supported the safe-haven appeal, and capped further gains in the USD/JPY pair.

Daily Technical Levels

Support Resistance

105.39     105.91

105.08     106.12

104.88     106.43

Pivot point: 105.60

USD/JPY – Trading Tips

On Wednesday, the USD/JPY is also trading bullish at 105.750 over the stronger U.S. dollar; however, the recent bullish bias in safe-haven Japanese yen drives a slight bearish correction in the market. On the 4 hour chart, the double top resistance level of the 105.800 level keeps the pair bearish. In case of a bullish breakout, the 105.800 resistance level may lead the USD/JPY pair towards the next target level of 106.240. On the lower side, the USD/JPY may find support at 105.400 level today. I will be looking to take a buy position over the 105.810 level. Good luck! 

Categories
Forex Options

FX Options Market Combined Volume Expiries for 7th October 2020

Thank you for visiting the Forex Academy FX Options market combined volume expiries section. Each day, where available, we will bring you notable maturities in FX Options of amounts of $100 million-plus, and where these large combined maturities at specified currency exchange rates often have a magnetic effect on price action, especially in the hours leading to their maturities, which happens daily at 10.00 AM Eastern time. This is because the big institutional players hedge their positions accordingly. Each option expiry should be considered ‘in-play’ with a good chance of a strike if labelled in red, still in play and a possible strike if labelled in orange and ‘out of play’ and an unlikely strike if labelled in blue, about the likelihood of price action meeting the strike price at maturity.

…………………………………………………………………………………………………………

FX option expiries for Tuesday, October 7 at the 10 am NY cut

USDJPY (USD amount)

  • 105.10 385m
  •  105.25 450m
  •  105.50 1.8bn
  •  106.20 549m

USDJPY is close to an area of resistance and is overbought. The 105.50 option expiry level looks open for a retest.

………………………………………………………………………………….

As you can see on the preferred 1-hour chart(s), we have also plotted the expiration levels at the various exchange rate maturities, and we have also labelled in red, orange, and blue.  Therefore, if you see option expiry exchange rates labelled in red, these should be considered in-play because we believe there is a greater chance of the expiry maturing at these levels based on technical analysis at the time of writing. There is still a lesser possibility of a strike if they are in orange, and so these are ‘in-play’ too. However, if we have labelled them in blue, they should be considered ‘not in-play,’ Therefore, price action would be unlikely to reach these levels, which are often referred to as Strikes, at the time of the 10 AM New York cut.

Our technical analysis is based on exchange rates, which may be several hours earlier in the day and may not reflect price action at the time of the maturities. We have not factored in economic data releases or keynote speeches by policymakers, or potential market volatility leading up to the cut.

Although we have added some technical analysis, we suggest you take the levels and plot them onto your own trading charts and incorporate the information into your own trading methodology to use the information to your advantage. Remember, the higher the amount, the larger the gravitational pull towards the exchange rate maturity at 10:00 AM Eastern time.

If you want to learn how forex option expiries affect price action in the spot FX market, see our educational article by clicking here: https://bit.ly/2VR2Nji

DISCLAIMER: Please note that this information is for educational purposes. Also, the maturities will look more or less likely to become a strike at 10 AM NY time due to exchange rate fluctuations resulting in a different perspective regarding technical analysis and upcoming economic data releases for the associated pairs.

Categories
Forex Basic Strategies

Pairing Significant S&R Levels With RSI Indicator To Generate Accurate Trading Signals

Introduction

In the previous set of articles, we discussed strategies based on trend continuation or trend reversal. Let us change the subject a little bit and discuss a strategy based on ‘Support and Resistance.’ Although we all know how to trade support and resistance, there is always a problem of consistency when it comes to trading using the conventional support and resistance strategy. We have a look into some of these issues by designing a strategy that provides not only decent risk-to-reward (RR) but also a high probability of success.

Markets are continually changing due to changes in market participants, global politics, and economic events. This means if we continue to trade the usual way, we could be in trouble. It is necessary that, along with markets, we, too, change our trading strategy in order to adapt to the changing market environment.

Time Frame

The strategy works well on the 1-hour, 4-hour, and ‘Daily’ time frame. Therefore, the strategy is suitable for the swing to long-term traders.

Indicators

We make use of only one technical indicator in the strategy, and that is the Relative Strength Index (RSI) with its default settings.

Currency Pairs

The strategy is suitable for trading almost all currency pairs listed on the broker’s platform. One thing we need to ensure before choosing a currency pair is that it should be volatile.

Strategy Concept

‘Cup and Handle’ is a powerful candlestick pattern that shows the prevalence of bullish strength in the market. It is a very reliable pattern that offers excellent trading opportunities. ‘Cup’ formation indicates that the price was unable to make a proper ‘lower low’ on the higher time frame due to a strong buyer who took the price up. The ‘handle’ indicates that the market was unable to reach the previous ‘low’ due to weak sellers where eventually buyers bought at a higher price and are in the process of making a new ‘higher high.’

The logic behind the formation of the ‘Cup and Handle’ pattern makes it one of the most powerful patterns. But the pattern alone is not the basis for the strategy; we also use the RSI to take the highest probability trades. We apply the concept of ‘Cup and Handle’ pattern and RSI indicator at a long-term ‘Support’ level to execute low-risk ‘long’ trades.

The same concept applies when taking ‘short’ trades at long-term ‘Resistance’ level. Here we should look for the formation of the ‘Inverse Cup and Handle’ pattern at ‘Resistance.’ ‘Cup’ here indicates that the price was unable to make a proper ‘higher high’ on the higher time frame due to strong seller who crashed the price. The ‘handle’ indicates that the market was unable to reach the previous ‘high’ due to weak buyers where eventually sellers sold at a lower price and are in the process of making a new ‘lower low.’ We use the RSI indicator to take the highest probability trades by looking for ‘overbought’ and ‘oversold’ situations in the market.

Trade Setup

In order to use the strategy, we have considered the 4-hour chart of AUD/USD, where we will be illustrating a ‘long’ trade using the rules of the strategy.

Step 1:
The first step is to identify long-term support and resistance levels. By long-term we mean, support and resistance levels on the 1-hour time frame and above. Note that the greater number of touches, the stronger is the support or resistance. We would recommend at least three touches at the support or resistance to calling it a strong one. To raise the odds in our favour, we can look for trading at support level in an uptrend and resistance in a downtrend.
The below image shows long-term support being formed in the AUD/USD pair on the 4-hour chart.

Step 2:
Once we have identified the critical technical level, we will wait for the price to present the ‘cup and Handle’ pattern at support and ‘Inverse Cup and Handle’ pattern at resistance. Here we should make sure that when the price at support, the RSI indicates an oversold (below 30) situation in the market at least once and then shows up the pattern. On the other hand, when the price is at resistance, the RSI should cross above the level of 70, indicating an overbought situation and then show up the ‘Inverse cup and handle’ pattern.

Step 3:
After ensuring that the pattern is formed at the right place along with suitable indications from the RSI, we now discuss how to enter the trade. In a ‘cup and handle’ pattern, we enter ‘long’ right at the price break out above the ‘high’ of ‘cup’ pattern. In an ‘inverse cup and handle’ pattern, we enter ‘short’ when ‘price’ breaks below the ‘low’ of the ‘cup’ pattern.
The below image shows an example of we enter for a ‘buy’ at ‘support.’

Step 4:
After entering, it is essential to determine the stop-loss and take-profit levels for the trade. One of the primary reasons behind low risk-to-reward (RR) ratio is late ‘entry.’ Stop-loss is placed below the ‘low’ of the ‘handle’ pattern in a ‘long’ position and above the ‘high’ of the ‘handle’ pattern in a ‘short’ position. The strategy essentially says to enter when prices have travelled a decent amount of distance from support or resistance, which considerably reduces the risk-to-reward (RR) ratio.
The below image shows the result of the trade executed using the above strategy where the resultant risk-to-reward (RR) of the trade is 1:1.

Strategy Roundup

Although the ‘Cup and Handle’ pattern is a bullish continuation pattern, if we understand the logic of the pattern and apply at key technical levels, it can provide excellent opportunities for short as well as long-term traders. Using the RSI indicator along with the pattern gives an extra edge to the strategy, which makes it highly suitable in changing market environment.

Categories
Forex Signals

EUR/JPY Enters Oversold Zone – Can We Expect Bearish Correction?

The EUR/JPY currency pair extended its Asian session declining streak and remain depressed around below 124.50 level mainly due to the cautious mood around the equity markets, which tend to underpin the Japanese yen’s safe-haven demand and turned out to be the key factor that exerting some pressure on the EUR/JPY currency pair. Apart from this, the latest optimism over the US-Japan relationship provided further support to the Japanese yen, which add further pessimism around the currency pair. 

On the contrary, the better-than-forecasts German Factory Orders data and positive comments from the ECB policymakers over the EUR economy help the currency pair to limit its deeper losses. As of writing, the EUR/JPY currency pair is currently trading at 1.1780 and consolidating in the range between 1.1766 – 1.1802.

As we already mentioned, the German Factory Orders improved more-than-expected in August, suggesting that the manufacturing sector recovery in Europe’s largest economy is regaining traction. This, in turn, underpinned the shard currency and becomes the key factor that kept the lid on any additional losses in the currency pair. At the data front, the Contracts for goods’ Made in Germany’ came in at +4.5% on the month vs. +2.6% expected and +2.8% last, as per the latest data showed by the Federal Statistics Office showed on the day. Annually, Germany’s Industrial Orders dropped only by 2.2% in the reported month vs. -7.3% previous and -19.9% expectations.

Apart from this, the positive comments from the ECB policymakers over the euro area economy also played its role in capping the currency pair losses. As per the latest comment from the European Central Bank (ECB) policymaker and Irish Central Bank Governor Gabriel Makhlouf, the euro area economy has recovered sharply from the trough seen in April. 

On the contrary, the cautious mood around the equity markets, triggered by the US political uncertainty ahead of the presidential election on November 3, tends to underpin the Japanese yen’s safe-haven demand and becomes one of the key factors that kept the currency pair under pressure. However, the overnight optimism over the US President Donald Trump’s return to the White House recently overshadowed by the prevalent US political uncertainty. In the meantime, the hopes of a compromise over a new coronavirus relief package also failed to boost trading’ sentiment, which is not good for the currency pair.

At the US-China front, the renewed US-China tussle also keeps challenging the market risk mood, which might add further pessimism around the currency pair. As per the latest report, the Dragon Nation continuing criticizing the US ban on TikTok and WeChat at the World Trade Organization (WTO). 

Across the pond, the losses in the currency pair were further bolstered after the US Secretary of State Mike Pompeo said that Japan’s Prime Minister (PM) Yoshihide Suga would strengthen the relationship with the US, which in turn, Japanese yen got impressed and added further downside pressure around the EUR/JPY currency pair.


Technically, the EUR/JPY pair is trading bearish today at 124.200 level, holding over the 38.2% Fibonacci retracement level. Recently, the EUR/JPY formed a bearish engulfing pattern on the 4-hour timeframe that may lead the pair towards 124.055 level. The candle’s closing below 124.055 level may extend the selling trend until the 61.8% Fibonacci retracement level of 123.66. But in case, if the EUR/JPY pair reverses and breaks the resistance level of 124.700 level, then I will consider closing the signal in the loss. Let’s keep an eye on it.

Entry Price – Sell 124.42

Stop Loss – 124.82

Take Profit – 123.92

Risk to Reward – 1:1

Profit & Loss Per Standard Lot = -$400/ +$400

Profit & Loss Per Micro Lot = -$40/ +$40

Fellas, now you can check out forex trading signals via Forex Academy mobile app. Follow the links below.

iPhone Users: https://apps.apple.com/es/app/fasignals/id1521281368

Andriod Users: https://play.google.com/store/apps/details?id=academy.forex.thesignal&hl=en_US

Categories
Crypto Videos

When Will Bitcoin Push Towards $20,000


When Will Bitcoin Push Towards $20,000?

Bitcoin remaining relatively stable above $10,000 despite a major cryptocurrency exchange getting hacked is certainly a positive sign for the market’s maturity. While major volatility was expected several times throughout the past couple of weeks, this didn’t really happen, even with all the macro-economic uncertainty surrounding the sector.
The question remains, is boring price action becoming a new reality for Bitcoin?

Bitcoin is range-bound on the daily chart

Sometimes, charting can be quite simple and straightforward, and this is one of those cases. Bitcoin’s price fell below $11,090 resistance at the start of the month, establishing new support at $10,000-$10,360. The $11,090-11,300 zone that has been lost is now confirmed resistance.
When taking a look at the downside, a potential drop towards the $9,300-$9,600 zone wouldn’t be completely unexpected as the level around the $9,600 mark is still untested with the lingering CME futures gap.

Crypto sector market capitalization looking for support

The 1-week chart of the crypto sector market capitalization is showing a clear pattern by posting a higher high in the previous months, marking the potential start of a brand new uptrend.

After a higher high, the market needs to set a new higher low in which a range-bound structure can be defined. While the new possible higher low might be the $300 billion mark, it is also possible for the sector to pull back to the previous resistance zone, which is between $250-275 billion.
However, the price has possibly found resistance at the $320 billion mark, which is where it hit the 100-day moving average. While this bounce is extremely bullish and unexpectedly high, the move is not over yet, and the crypto sector market cap might end up going lower.

If the given area holds, it also shows how the beginning of a new cycle can be relatively dull. With each new start of a fresh market cycle, levels are flipped as support and resistance, after which we can see months of range-bound trading periods. We can use the price movement of Bitcoin in 2016 as an example, as that year was also a halving year.

During these periods, Bitcoin’s price stabilized in an accumulation range all throughout 2015. After the accumulation range has ended, Bitcoin’s price broke out and pushed towards the next zone of resistance.
This rally ended up with a sideways range that lasted for six months. A new breakout occurred, followed by another sideways range that lasted for six months. The current market sentiment, as well as price movement, is comparable with that period. The real excitement will come only when the total market capitalization of the sector, as well as Bitcoin itself, break into price discovery, as new potential parabolic runs can come back into play at that point.

A Bull case for Bitcoin

It should be noted that the scenarios shown here are based on lower time-frames (specifically the 4-hour time-frame) and, therefore, should be considered a short-term outlook.
As Bitcoin’s price is currently stuck in a range and is currently facing strong resistance, it’s more likely to anticipate a pullback to the $10,360 area, which is the vital area to hold for any form of bullish continuation.
If Bitcoin’s price holds at least that level and creates a higher low, we can expect a strong push towards the upside. If the price decides to just shoot up, the crucial breaker would be the $10,850 area. If Bitcoin breaks that area with confidence, we may see a rally towards the $11,090 or even 11,300 area.
While it would be unexpected to see a massive breakout that would surpass the aforementioned area, that would warrant an even stronger case for the Bitcoin bulls, and even possible highs of above-$20,000.

A Bear case for Bitcoin

The same levels surround the bearish scenario as well. A failure to break the $10,800 zone with confidence would present a potential test of the $10,360 area.
As we discussed in the bullish case for Bitcoin, a potential higher low can fuel the bulls and rally, even more buying power. However, if Bitcoin falls below the $10,360, further downward momentum should be expected, even including the still-open CME gap. However, very few people are expecting Bitcoin to fall below $9,000 any time soon, if ever.

WASHINGTON, DC – SEP. 27: U.S. President Donald Trump reacts to a journalist question during a news conference in the Briefing Room of the White House. Trump is planning for the first presidential debate with Democratic Nominee and former Vice President Joe Biden on Sep. 29 in Cleveland, Ohio. Joshua Roberts/Getty Images/AFP

Bears are mostly making their case based on the economic and political events, such as the U.S. presidential elections, U.S. President Donald Trump announcing that he is ill from COVID-19, as well as events in the crypto space such as the BitMEX platform fallout due to the U.S. government charges against it.

Who is in the right?

While we have no way of finding out who is currently in the right and where Bitcoin will head in the short-term, we can look at its day-to-day price movement as well as fundamentals and sentiment to get a clearer view.
Bitcoin is on track for its best Q3 ever, as Skew’s data shows. According to this on-chain analytics resource, Bitcoin’s Q3 closing price will be stronger than any Q3 before.

BTC/USD traded at somewhere in the $10,700 range on Sep. 30. That number very comfortably beats any other Q3 close on record, with the next highest one being 2019’s close of $8,310. On top of that, Bitcoin has sealed the second-best quarterly close in general, as it beat Q2 of 2019, which had a closing price of $10,590.
On top of that, network fundamentals also speak to Bitcoin’s overall strength, with the network difficulty itself at all-time highs and set for another push towards the upside. Hash rate, a measure of the estimated computing power that is being directed to mining, is also trending back towards its all-time-high levels.

Conclusion

While there are many discussions on whether Bitcoin will retrace to sub-$9,600 levels or push past $11,000, one thing is certain: Bitcoin’s dull price movement will not remain like this for good. Whether its short-term movement will be tilted towards the upside or downside is irrelevant, Bitcoin is here to stay, and good times remain ahead.

Categories
Forex Signals

AUD/USD Breaking Below Descending Triangle Pattern – Brace for Selling! 

The AUD/USD currency pair failed to extend its early-day bullish moves and dropped below the 0.7200 level despite the upbeat market sentiment and weaker U.S. dollar. Conclusion: as we all know that these both factors tend to support the currency pair; unfortunately, the currency pair was rather unaffected by these positive factors. However, the reason for the ongoing bearish sentiment around the currency pair could be associated with the RBA’s announcement of no rate change, which is seen as negative, or bearish for the AUD currency. 

Meanwhile, the losses in the currency pair were further bolstered after the RBA shared a dovish view on the Australian economy, which eventually undermined the Australian dollar and contributed to the currency pair gains. On the contrary, the broad-based U.S. dollar weakness, buoyed by the market risk-on mood, could be considered the key factor that might cap the further downside for the currency pair. Furthermore, the positive reports over the U.S. President Donald Trump’s health also help the currency pair limit its deeper losses. The AUD/USD currency pair is currently trading at 0.7152 and consolidating in the range between 0.7147 – 0.7208.

Despite the ongoing rise in the COVID-19 cases, coupled with the fears of lockdown restrictions, the pair’s loosest trading sentiment has been flashing green since the day started. However, the market trading tone was being supported by the optimism over the U.S. President Trump’s health. As per the latest report, the U.S. President Donald Trump returned to the White House after a three-night hospital stay due to coronavirus infection, which boosted the market risk tone and helped the currency pair to limit its deeper losses. 

However, the concern over the U.S. President Trump’s health remains on the card. It should be noted that the U.S. President Trump released a video to confirm that he will soon trail the presidential election race, after losing a high time off-late. However, the video clip showed that U.S. President Trump’ is still struggling while speaking, raising concerns for his health. Thus, these concerns might keep the market sentiment cautious.

At home, the Reserve Bank of Australia (RBA) kept its cash rate and the targeted yield on 3-year bonds unchanged at 0.25% during the latest announcement. In the meantime, the RBA shared a dovish view on the Australian economy, which undermined the Australian dollar and contributed to the currency pair losses. According to the RBA latest report, Unemployment and underemployment rate are expected to remain high for an extended period, as well as “Wage, and inflation pressures remain very depressed.”.

Furthermore, the reason for the losses in the currency pair could be associated with some repositioning trade ahead of the Australian budget. It should be noted that the Australian government is expected to unveil a fiscal blueprint and introduce other measures to drive the economic recovery from the coronavirus-induced recession. This might weak the AUD demand and drag the currency pair further down.


At the USD front, the broad-based U.S. dollar failed to gain any positive traction on the day amid risk-on market sentiment. Moreover, the U.S. dollar losses could also be associated with the rising hopes that the U.S. Congress will reach an agreement over the latest stimulus measures to control the economic impact of COVID-19. However, the U.S. dollar losses became the key factor that kept the currency pair’s losses limited. Whereas, the U.S. Dollar Index, which tracks the greenback against a bucket of other currencies, dropped by 0.03% to 93.468 by 9:52 PM ET (1:52 AM GMT). Looking forward, the market traders keeping their eyes on the Fed Chair Jerome Powell’s scheduled speech. In the meantime, the updates surrounding the fresh Sino-US tussle, as well as the coronavirus (COVID-19), could not lose their importance.

Daily Support and Resistance

S1 0.7068

S2 0.7112

S3 0.7138

Pivot Point 0.7157

R1 0.7182

R2 0.7201

R3 0.7245

The AUDUSD is likely to trade with a bearish bias today, as we can see on the hourly timeframe, gold has violated an upward trendline support level of 0.7177 level, and the closing of candles below this level is likely to drive selling bias until 0.7160 and 0.7140 level. Selling bias remains dominant today.

Entry Price – Sell 0.71701

Stop Loss – 0.72101

Take Profit – 0.71301

Risk to Reward – 1:1

Profit & Loss Per Standard Lot = -$400/ +$400

Profit & Loss Per Micro Lot = -$40/ +$40

Fellas, now you can check out forex trading signals via Forex Academy mobile app. Follow the links below.

iPhone Users: https://apps.apple.com/es/app/fasignals/id1521281368

Andriod Users: https://play.google.com/store/apps/details?id=academy.forex.thesignal&hl=en_US

Categories
Forex Signals Forex Technical Analysis

AUD/JPY Pair Failed to Gains Positive Traction – Brace for Selling!  

Today in the Asian trading session, the AUD/JPY currency pair failed to keep its early-day bullish momentum and dropped well below the 76.00 level despite the upbeat market sentiment. However, the reason for the prevalent bearish sentiment around the currency pair could be associated with the RBA’s announcement of no rate change, as well as, the RBA has a dovish view on the Australian economy, which could be considered as one of the key factors that undermine the Australian dollar and contributed to the currency pair losses. Across the pond, the currency pair declines were further bolstered after the US Secretary of State Mike Pompeo said Japan’s Prime Minister (PM) Yoshihide Suga would strengthen the relationship with the US. Thus, the Japanese yen got impressed by the above comments, which adds further downside pressure around the AUD/JPY currency pair. 

On the contrary, the upbeat market mood, backed by optimism over US President Trump’s health, could be considered one of the key factors that help the currency pair limit its deeper losses. The AUD/USD currency pair is currently trading at 75.64 and consolidating in the range between 75.60 – 76.16. As we already mentioned, the global risk sentiment got a strong boost after US President Trump leaves the hospital and feels “20-years younger”. Despite this, the doubts over Donald Trump’s remain high as a recent video from the American leader showed that he struggles while breathing. Besides, the doubts were further fueled after the White House’s recent confirmation that Trump will be under 24-hour care, and anybody nearing the President will need to wear the PPE kit. 

At the US-China front, the renewed US-China tussle also keeps challenging the market risk-on mood, adding further pessimism around the currency pair. As per the latest report, the Dragon Nation recently fueled the Sino-American tussle by criticizing the US ban on TikTok and WeChat at the World Trade Organization (WTO). 

At the AUD front, the Reserve Bank of Australia (RBA) held its cash rate, and the targeted yield on 3-year bonds unchanged at 0.25% during the latest announcement. In the meantime, the RBA has a dovish view of the Australian economy, which ten underpins the Australian dollar and contributes to the currency pair losses. It should be noted that the RBA confirmed that Unemployment and underemployment are expected to remain high for an extended period. They further added, “Wage and inflation pressures remain very depressed.”

Across the ocean, the currency pair losses got an additional boost after the US Secretary of State Mike Pompeo said Japan’s Prime Minister (PM) Yoshihide Suga is a ‘powerful force for good’, as well as Pompeo further added that he believes Suga will strengthen the relationship with the US. These positive comments tend to underpin the Japanese yen currency and drag the currency pair lower.


Daily Support and Resistance

S1 73.89

S2 74.62

S3 75.05

Pivot Point 75.36

R1 75.78

R2 76.09

R3 76.82

Looking forward, the market traders keeping their eyes on the crude oil supply data from the American Petroleum Institute (API) due later in the day. In the meantime, the updates surrounding the fresh Sino-US tussle, as well as the coronavirus (COVID-19), could not lose their importance.

Entry Price – Sell 75.862

Stop Loss – 76.262

Take Profit – 75.462

Risk to Reward – 1:1

Profit & Loss Per Standard Lot = -$400/ +$400

Profit & Loss Per Micro Lot = -$40/ +$40

Fellas, now you can check out forex trading signals via Forex Academy mobile app. Follow the links below.

iPhone Users: https://apps.apple.com/es/app/fasignals/id1521281368

Andriod Users: https://play.google.com/store/apps/details?id=academy.forex.thesignal&hl=en_US

Categories
Crypto Market Analysis

Daily Crypto Review, Oct 6 – XRP Gains Over 10% As It Announces The Launch Of A New Crypto Exchange

The cryptocurrency sector has had a slow and steady day of mostly slight price increases. Bitcoin is currently trading for $10,707, representing an increase of 1.03% on the day. Meanwhile, Ethereum gained 0.7% on the day, while XRP gained 3.18%.

 Daily Crypto Sector Heat Map

If we look at the top 100 cryptocurrencies, we can see that the privacy coin sector did really well today. Zcash gained 6.86% on the day, making it the most prominent daily gainer. Monero (5.7%) and Quant (3.5%) also did great. On the other hand, PumaPay lost an astonishing 85.58%, making it the most prominent daily loser. It is followed by Uniswap’s loss of 14.37% and Synthetix Network Token’s loss of 11.59%.

Top 10 24-hour Performers (Click to enlarge)

Bottom 10 24-hour Performers (Click to enlarge)

Bitcoin’s level of market dominance has increased slightly since our last report, with its value currently being at 60.46%. This value represents a 0.16% difference to the upside when compared to when we last reported.

Daily Crypto Market Cap Chart

The crypto sector capitalization has gained value over the course of the past 24 hours. Its current value is $342.40 billion, which represents an increase of $1.16 billion when compared to our previous report.

_______________________________________________________________________

What happened in the past 24 hours?

_______________________________________________________________________

_______________________________________________________________________

Technical analysis

_______________________________________________________________________

Bitcoin

The largest cryptocurrency by market cap has spent another day by slowly gaining in value. The bulls were patient as Bitcoin approached the ascending trend line, ultimately passing it. Bitcoin’s short-term future will be decided by how he manages the $10,850 level. If the level gets tackled and Bitcoin stays above it confidently, we can expect a push towards $11,000-$11,300, or even higher. However, if that level doesn’t hold up, Bitcoin will return to the $10,360 level. Traders should pay attention to any spikes in volume.


BTC/USD 4-hour Chart

Bitcoin’s short-term technicals are a bit less bullish today, as the majority of the oscillators are neutral/bearish. However, its longer-term technicals have remained completely bullish.

BTC/USD 4-hour Technicals

Technical factors (4-hour Chart):
  • Price is above its 50-period EMA and its 21-period EMA
  • Price is slightly below its top Bollinger band
  • RSI is ascending (60.09)
  • Volume is below average
Key levels to the upside          Key levels to the downside

1: $10,630                                 1: $10,500

2: $10,850                                 2: $10,360

3: $11,000                                  3: $10,015

Ethereum

Ethereum’s price is slowly rising ever since the drop on Oct 2. However, the volume is slowly descending, turning Ethereum’s moves more and more dull. We may expect more slow and sideways movement until the volume picks up the pace.

Traders should pay attention to any increase in volume, as well as to Ethereum’s movement between $334 and $360.

ETH/USD 4-hour Chart

Ethereum’s 4-hour outlook has changed to full-out bullish, while its 1-day overview remains tilted towards the sell-side. On the other hand, its long-term overview seems extremely bullish, as its weekly or monthly technicals are both tilted towards the buy-side.

ETH/USD 4-hour Technicals

Technical Factors (4-hour Chart):
  • The price is above both its 50-period and 21-period EMA
  • The price is slightly above its middle Bollinger band
  • RSI is neutral (52.71)
  • Volume is below average
Key levels to the upside          Key levels to the downside

1: $360                                     1: $334

2: $371                                     2: $300

3: $400                                      3: $289

Ripple

XRP has had another amazing day, where its price moved further towards the upside and reached as high as $0.26. If the price manages to stay at this level, its next resistance will be found at the $0.266 level. However, a pullback is expected, where the area between $0.2454 and $0.251 has strong support.

It seems that the bulls have gathered around XRP on news of the company launching a cryptocurrency exchange on top of the XRP ledger, as well as because of the fact that XRP is very close to reaching a golden cross (50-period moving average crossing the 200-period moving average to the upside).

XRP/USD 4-hour Chart

XRP technicals are now tilted towards the buy-side, with the exception of its monthly outlook, which remains bearish.

XRP/USD 4-hour Technicals

Technical factors (4-hour Chart):
  • The price is well-above both its 50-period EMA and its 21-period EMA
  • Price is at its top Bollinger band
  • RSI is overbought (70.16)
  • Volume is above average
Key levels to the upside          Key levels to the downside

1: $0.266                                   1: $0.2454 

2: $0.27                                     2: $0.235

3: $0.273                                  3: $0.227


Categories
Forex Market Analysis

Daily F.X. Analysis, October 06 – Top Trade Setups In Forex – U.S. and ECB Central Bankers to Speak!

On the news front, the eyes will remain on the Central Bank officials such as Fed Chair Powell Speaks and ECB President Lagarde Speaks. The ECB President Lagarde is due to speak at a fireside chat at the Wall Street Journal’s online CEO Summit while Fed Chair Powell is due to talk about the U.S. economic outlook at the National Association of Business Economics annual meeting, via satellite. Audience questions are also expected.

Economic Events to Watch Today  


EUR/USD – Daily Analysis

The EUR/USD closed at 1.17824 after placing a high of 1.17973 and a low of 1.17047. Overall the movement of the EUR/USD pair remained bullish throughout the day. On Monday, the EUR/USD pair rose to its nine days highest level amid the broad-based U.S. dollar weakness and the strong positive macro-economic data from the European side.

The U.S. dollar was lower on Monday after the news about U.S. President Donald Trump’s health came into the market. The hopes that Trump will recover soon and be discharged from his military hospital as soon as Monday raised risk sentiment in the market and weighed on the safe-haven U.S. dollar. The fears that U.S. Presidential elections might not take place on schedule also dropped after the reports of Trump’s possible release from the hospital.

Another factor helping the risk sentiment was the hopes that U.S. stimulus measures will now be delivered soon as Trump’s infection has brought the virus to Capitol Hill. Both Democrats and Republicans will now realize the urgency of responding to the virus impact and reach a consensus over the aid bill’s size. The renewed stimulus hoped also added strength to the risk sentiment and helped the EUR/USD pair to gain further.

On the data front, at 12:15 GMT, the Spanish Services PMI for September dropped to 42.4 against the expected 46.4. AT 12:45 GMT, the Italian Services PMI rose to 48.8 from the projected 46.7 and supported Euro. At 12:50 GMT, the French Final Services PMI came in line with the expectations of 47.5. At 12:55 GMT, the German Final Services PMI rose to 50.6 against the forecasted 49.1 and supported Euro. 

At 13:00 GMT, the Final Services PMI for the whole Eurozone also rose to 48.0 from the anticipated 47.6 and supported the Euro currency. At 13:30 GMT, the Sentix Investor Confidence came in as -8.3 against the forecasted -9.2 and supported Euro. At 14:00 GMT, the Retail Sales from Europe rose to 4.4% from the expected 2.4% and supported Euro.

The Retail Sales in August from Eurozone raised nearly double than expectations to 4.4% and supported the local currency against its rival U.S. dollar and pushed the EUR/USD pair higher.

The Services PMI from all over European nations also rose and showed that the service industry improved from their previous levels and helped Euro to post gains. Furthermore, the Eurogroup meeting and the Financial Affairs Council meeting will start on 5-6th October. The Eurogroup will discuss its priorities under its new presidency and adopt a work program. The Eurozone’s policy priorities in the context of economic recovery and the draft budgets for 2021 will be discussed. Traders will look forward to meeting results for finding fresh clues about the EUR/USD pair in the coming days.

Daily Technical Levels

Support Resistance

1.1726    1.1817

1.1670    1.1854

1.1634    1.1909

Pivot point: 1.1762

EUR/USD– Trading Tip

On Monday, the EUR/USD has mostly traded in line with our forecast to test the resistance level of 1.1801 level. On Tuesday, the EUR/USD is trading below a resistance level of 1.1801 level. Below this mark, the EUR/USD can plunge until the support resistance level of 1.1760 and 1.1740. In contrast, an upward breakout of 1.1801 can lead the EUR/USD pair towards 1.1840 areas. Let’s keep an eye on the Fed Chair Powell and ECB President Lagarde Speaks to determine further market trends. The bullish bias remains dominant today.


GBP/USD – Daily Analysis

The GBP/USD pair was closed at 1.29726 after placing a high of 1.29920 and a low of 1.28995. Overall the movement of the GBP/USD pair remained bullish throughout the day. The GBP/USD pair extended its previous daily gains and reached its 11-day highest level above 1.299 level on Monday amid the broad-based U.S. dollar weakness and renewed Brexit deal hopes along with the improving risk sentiment around the market.

The British Pound to U.S. dollar exchange rate moved higher on Monday on rising expectations that the U.K. and E.U. will reach a consensus on the post-Brexit trade deal. The Goldman Sachs forecasted that both parties would reach a deal by early November.

Another factor involved in the Brexit deal’s raised hopes was the report that suggested that E.U. chief negotiator Michel Barnier aimed to hold talks with European coastal states to get the freedom to negotiate terms with the U.K. on the fisheries issue. It is one of the sticking points that have caused a delay in the Brexit deal progress. The Brexit hopes were further bolstered after Prime Minister Boris Johnson and European Commission president Ursula von der Leyen agreed that talks should be intensified to close the significant gap that has stalled the negotiations’ progress. 

All these above optimistic reports helped the local currency and pushed the GBP/USD pair on the above side. The bullish calls were supported by Goldman Sachs that urges investors to buy Sterling. However, the Goldman Sachs Bank did not completely take the prospect of no-deal Brexit out off the table and said that No-Deal Brexit’s perceived probability would remain intact beyond the next European Council meeting in mid-October.

If no deal is reached between the E.U. and U.K., Britain will leave the E.U. without a deal at the end of the transition period on December 31.

Meanwhile, on the data front, at 13:30 GMT, the Final Services PMI from Great Britain for September rose to 56.1 against the 55.1 and supported GBP. The stronger than expected Services PMI showed an expansion in the U.K. services activities and supported the already rising GBP/USD pair on Monday.

However, the U.S. dollar was weaker on Monday due to the rising risk sentiment on the reports of the quick recovery of the U.S. President Donald Trump from coronavirus infection. The reports suggested that Trump would be released from his military hospital as soon as Monday, and he raised the risk sentiment after breaking the concerns that election might suffer from his illness. The weak U.S. dollar onboard, along with the improved risk sentiment, also helped the GBP/USD pair’s gains on Monday.

Daily Technical Levels

Support Resistance

1.2921    1.3013

1.2863    1.3049

1.2828    1.3106

Pivot Point: 1.2956

GBP/USD– Trading Tip

The GBP/USD is holding over a strong resistance become a support level of 1.2954 level. On the 4 hour timeframe, the Cable has formed an upward channel supporting the pair around 1.2950 and 1.2925 level. Whereas, the resistance stays at 1.3003 and 1.3058 level. The MACD and 50 EMA support bullish bias, which may keep the GBP/USD pair bullish over 1.2956 level. Let’s consider taking buying trades over 1.3000 level and bearish below the same level to target 1.2956. 


USD/JPY – Daily Analysis

The USD/JPY pair was closed at 105.735 and a high of 105.792 and a low of 105.228. Overall the movement of the USD/JPY pair remained bullish throughout the day. After posting hefty losses on Friday, USD/JPY reversed its direction and moved higher on Monday amid the improved risk sentiment and rising optimism in the market. 

The market’s mood was improved on Monday after a bumpy weekend related to the concerning news about the health of U.S. President Donald Trump. The Leader of the world’s largest economy was tested positive for coronavirus on Friday and was shifted to a military medical facility for treatment. The Contradictory headlines about his health and its effects on upcoming Presidential elections were raising concerns throughout the weekend. However, after the weekend, the news suggested that Trump was recovering, and he will be released from the hospital as soon as Monday. 

This news canceled the above fears and raised optimism around the market, boosting risk sentiment. The U.S. equities and the U.S. Treasury yields raised on the day, giving a boost to the U.S. dollar. Simultaneously, the rising risk sentiment weighed on the safe-haven Japanese Yen and pushed the USD/JPY pair on Monday.

On the data front, at 18:45 GMT, the Final Services PMI in September from the United States remained flat with the forecasts of 54.6. While at 19:00 GMT, the highlighted ISM Services PMI from the United States rose to 57.8 against the forecasted 56.3 and supported the U.S. dollar.

The ISM Services PMI showed an expansion in U.S. services activities in September and raised hopes for the quick economic recovery that helped improve the market’s risk sentiment and weighed on the Japanese Yen due to its safe-haven nature and ultimately pushed the USD/JPY pair even higher.

Moreover, the risk sentiment was also supported by the better than expected Retail Sales report from the European Union on Monday that doubled the expected number and supported riskier assets. The European stocks raised after this report, and U.S. stocks followed them that raised the market’s risk sentiment and helped the riskier GBP/USD pair gain further in the market.

Meanwhile, the USD/JPY pair’s gains remain limited by the rising fears of a second wave of coronavirus globally in the winter season. From all across the globe, the reports were suggesting a rising number of coronavirus cases. Europe struggled hard to fight against the pandemic and contained the spread as France and the U.K. saw a continuous rise in the number of daily count on infection cases. 

Meanwhile, other countries like Oman, Israel, India, France, Canada, UK, and Japan also reported a rise in the number of infected people. This raised global concerns supported the safe-haven appeal and capped further gains in the USD/JPY pair.

Daily Technical Levels

Support Resistance

105.39    105.91

105.08    106.12

104.88    106.43

Pivot point: 105.60

USD/JPY – Trading Tips

The USD/JPY is also trading bullish at 105.650 over the stronger U.S. dollar; however, the recent bullish bias in safe-haven Japanese yen drives a slight bearish correction in the market. On the 4 hour chart, the double top resistance level of the 105.800 level keeps the pair bearish. In case of a bullish breakout, the 105.800 resistance level may lead the USD/JPY pair towards the next target level of 106.240. On the lower side, the USD/JPY may find support at 105.400 level today. I will be looking to take a buy position over the 105.810 level. Good luck! 

Categories
Forex Signals

USD/JPY Violated Downward Trendline – Quick Update on Signal! 

The USD/JPY currency pair managed to extend its previous session gains and took further bids around well above the mid-105.00 level after posting a one-week low of 104.95 on Friday. However, the currency pair’s sentiment was being supported by the upbeat market mood, which tends to undermine the safe-haven Japanese yen and contributed to the currency pair gains. Apart from this, the Bank of Japan (BOJ) Governor Haruhiko Kuroda shared a negative picture over Japan’s economy and inflation, which added further pressure on the Japanese yen and provided a further boost to the currency pair. 

On the contrary, the broad-based U.S. dollar, triggered by the low safe-haven demand in the market, becomes the key factor that capped further upside momentum for the currency pair. Currently, the USD/JPY currency pair is currently trading at 105.65 and consolidating in the range between 105.28 – 105.68.

As we already mentioned, market trading sentiment has been gaining positive traction since the day started and supported by the optimism over the U.S. President Donald Trump’s recovery from COVID-19. It should be noted that the Trumps’ doctors told that President Trump was doing well and could be discharged from his military hospital as soon as Monday. This positive news urged investors to withdraw their money from safe-haven assets. As in result, undermined the safe-haven Japanese yen and contributed to the currency pair gains.

Apart from this, the updates suggest that the national leader spoke to U.S. Treasury Secretary Steve Mnuchin over the weekend for the COVID-19 stimulus, which raised hopes that deadlock could end sooner. This also favored the risk-tone sentiment and undermined the safe-haven Japanese yen. 

Across the pond, the currency pair’s gains were further bolstered after the Bank of Japan (BOJ) Governor Haruhiko Kuroda shared the gloomy picture over Japan’s economy, which adds additional pressure around the JPY provided further boost to the currency pair. As per the latest report by Bank of Japan (BOJ) Governor Haruhiko Kuroda, “Japanese economy in severe condition but picking up.” He further added, “Uncertainties surrounding the outlook remain extremely high.”

However, the market trading sentiment was unaffected by the fears of fresh lockdown restrictions in Britain and Europe. Whereas, the usage of dexamethasone in President Trump’s treatment keep questioning the market optimists.

At the USD front, the broad-based U.S. dollar extended its previous session bearish bias and failed to gain any positive traction during the European trade Monday amid risk-on market sentiment. Apart from this, the greenback losses could also be associated with Friday’s released mixed U.S. data, which instantly raised doubts over the U.S. economic recovery. However, the U.S. dollar losses might stop bulls from placing any strong position and keep a lid on any further gains for the USD/JPY pair. Whereas, the U.S. Dollar Index Futures that tracks the greenback against a basket of other currencies dropped by 0.13% to 93.787 by 10:12 PM ET (2:12 AM GMT).

Moving ahead, the market traders will keep their eyes on the U.S. economic docket, which will show the release of the ISM Non-Manufacturing PMI. This data might affect the U.S. dollar price dynamics and provide fresh direction for the pair. In the meantime, the updates surrounding the fresh Sino-US tussle, as well as the coronavirus (COVID-19), could not lose their importance.


Daily Support and Resistance

S1 103.88

S2 104.6

S3 104.98

Pivot Point 105.32

R1 105.7

R2 106.05

R3 106.77

The USD/JPY is also trading neutral at 105.560 amid thin trading volume and China national holiday today. The downward trendline is extending resistance at 105.560 level on the two-hourly timeframes today. The closing of Doji candles below the trendline is suggesting neutral bias among traders. The technical side of USD/JPY may extend the pair lower towards 105.200, and the series for EMA is now developing support at 105.400 level. On the flip side, the bullish breakout of 105.590 level may lead the haven pair towards 105.800. Consider taking buying trade over 105.450 level and selling below the same today. 

Entry Price – Buy 105.602

Stop Loss – 105.202

Take Profit – 106.002

Risk to Reward – 1:1

Profit & Loss Per Standard Lot = -$400/ +$400

Profit & Loss Per Micro Lot = -$40/ +$40

Fellas, now you can check out forex trading signals via Forex Academy mobile app. Follow the links below.

iPhone Users: https://apps.apple.com/es/app/fasignals/id1521281368

Andriod Users: https://play.google.com/store/apps/details?id=academy.forex.thesignal&hl=en_US

Categories
Crypto Market Analysis

Daily Crypto Review, Oct 5 – XRP Skyrockets and Gains Over 9%; Uniswap’s Volume Trumps Coinbase

The cryptocurrency sector is experiencing a slow but steady increase in price as Bitcoin is moving towards the upside after the $10,360 low it hit on Oct 2. Bitcoin is currently trading for $10,613, representing an increase of 0.53% on the day. Meanwhile, Ethereum gained 0.48% on the day, while XRP gained 5.79%.

 Daily Crypto Sector Heat Map

If we look at the top 100 cryptocurrencies as well as their gains and losses, Zilliqa gained 10.87% on the day, making it the most prominent daily gainer. Celsius (8.47%) and XRP (6.45%) also did great. On the other hand, SushiSwap Token lost 9.94%, making it the most prominent daily loser. It is followed by UMA’s loss of 8.93% and Bitcoin Gold’s loss of 8.64%.

Top 10 24-hour Performers (Click to enlarge)

Bottom 10 24-hour Performers (Click to enlarge)

Bitcoin’s level of market dominance stayed at the same spot since our last report, with its value currently being at 60.30%. This value represents a 0.07% difference to the downside when compared to when we last reported.

Daily Crypto Market Cap Chart

The crypto sector capitalization has gained value over the course of the weekend. Its current value is $341.26 billion, which represents an increase of $5.80 billion when compared to our previous report.

_______________________________________________________________________

What happened in the past 24 hours?

_______________________________________________________________________

_______________________________________________________________________

Technical analysis

_______________________________________________________________________

Bitcoin

The largest cryptocurrency by market cap has dropped in price due to the fundamentals, such as the US President Donald Trump being ill from COVID-19 as well as one of the largest trading platforms, BitMEX, being charged by the CFTC and the DOJ. However, the drop was only strong enough to push BTC to the $10,360 level, not below it. This is an extremely bullish sign as this support holding is key to the future development of Bitcoin.

Ever since then, Bitcoin has been slowly and steadily gaining in value but is being checked by the ascending trend line (pink). Traders should watch how BTC handles the trend line and if it surpasses it or keeps bouncing off of it.

BTC/USD 4-hour Chart

Bitcoin’s short-term technicals have changed to bullish over the weekend. Its longer-term technicals, however, have remained completely bullish, except for the daily outlook, which is just slightly more neutral.

BTC/USD 4-hour Technicals

Technical factors (4-hour Chart):
  • Price is above its 50-period EMA and its 21-period EMA
  • Price is at its top Bollinger band
  • RSI is ascending (56.69)
  • Volume is below average
Key levels to the upside          Key levels to the downside

1: $10,630                                 1: $10,500

2: $10,850                                 2: $10,360

3: $11,000                                  3: $10,015

Ethereum

Ethereum’s price has acted similar to Bitcoin’s movements, with Ether plummeting on Oct 2 and dropping to the $334 support level. However, bulls have taken over the market, and Ethereum has been slowly rising in the past couple of days. The prediction that options traders made regarding Ether trading below $360 and above $340 during October is still valid, and even more likely.

Traders should pay attention to any increase in volume, as that will spark the next move. The current volume is unable to bring any volatility to Ethereum.

ETH/USD 4-hour Chart

Ethereum’s 4-hour outlook has changed to slightly bullish, while its 1-day overview remains tilted towards the sell-side. However, its long-term overview seems extremely bullish, as its weekly or monthly technicals are both heavily tilted towards the buy-side.

ETH/USD 4-hour Technicals

Technical Factors (4-hour Chart):
  • The price is right below its 50-period and right above its 21-period EMA
  • The price is slightly above its middle Bollinger band
  • RSI is neutral (50.85)
  • Volume is below average
Key levels to the upside          Key levels to the downside

1: $360                                     1: $334

2: $371                                     2: $300

3: $400                                      3: $289

Ripple

XRP has had an amazing day and even managed to get in the top3 daily gainers section. The third-largest cryptocurrency by market capitalization started off the weekend with its price dropping and hitting $0.228. However, the price quickly recovered and hovered below the $0.235 level until it finally broke. The push towards the upside was strong and with high volume, which helped XRP reach as high as $0.254.

XRP is now trying to consolidate above the $0.2454 level, which traders should pay attention to. An additional spark of volatility might be good for trading, regardless of XRP’s direction.

XRP/USD 4-hour Chart

XRP technicals are now quite uniformed and bullish, with both short-term and long-term technicals being completely tilted towards the buy-side. However, its monthly outlook still remains bearish.

XRP/USD 4-hour Technicals

Technical factors (4-hour Chart):
  • The price is above both its 50-period EMA and its 21-period EMA
  • Price is at its top Bollinger band
  • RSI is heading towards the oversold territory (67.36)
  • Volume is above average
Key levels to the upside          Key levels to the downside

1: $0.2454                                 1: $0.235 

2: $0.266                                   2: $0.227

3: $0.27                                    3: $0.221


Categories
Forex Daily Topic Forex Price Action

Weekly High/Low Breakout Trading: Count the Breakout Candle’s Attributes

In today’s lesson, we are going to demonstrate an example of an H4 breakout at the last week’s high. However, the price does not head towards the North as it usually does. Let’s find out why that happens.

The chart shows that the price after making a strong bearish move gets choppy. The H4 traders may wait for the price to make a breakout at either side. A bullish breakout may attract the buyers to go long in the pair. On the other hand, the sellers may wait for the price to make a bearish breakout.

The price produces a bearish candle to start the next week. The price finds its support, and it heads towards the North. However, the last weekly high is still intact. The buyers must wait for the breakout at the level to go long.

The price finds its intraweek resistance. It comes down. Intraweek support holds the price and produces a bullish inside bar. It is not a strong bullish reversal candle. However, it is produced at double bottom support. Let us wait and see whether it makes a breakout at the neckline or not.

The price heads towards the North and makes a breakout at the neckline. The candle closes within the last week’s high and consolidates. It then produces a bullish candle closing above the last week’s high. However, the candle has a long upper shadow. Considering its upper shadow, traders do not usually get attracted to trade upon such a breakout candle.

As anticipated, the chart produces some bullish candles with long upper shadow after the breakout. The price heads towards the North with a sluggish pace. It then produces a bearish Pin Bar and drives the price towards the breakout level again. A bullish reversal candle closing above consolidation resistance may attract the buyers to go long in the chart again. Let us find out what happens next.

The chart produces a long bearish candle with long lower shadow. The pair is trading within the last week’s range again. The H4 buyers have lost their hope. They may skip eying on the chart to concentrate on somewhere else.

If we look back, a double bottom, along with a breakout at the last week’s high, do not push the price towards the North. Most probably, this is because of the breakout candle’s attributes. We may still keep an eye on such a chart, but it would be wise to concentrate more on those charts, which makes a breakout with a commanding candle.


Categories
Forex Signals

AUD/USD Bearish Bias Continues – Ascending Triangle Pattern!

The AUD/USD currency pair succeeded to stop its early-day losses and drew some fresh bids around closer to the 0.7200 level mainly due to the risk-on market sentiment, backed by the positive news over the U.S. President Donald Trump’s recovery from COVID-19, which eventually underpinned the perceived risk currency Australian dollar and contributed to the currency pair gains. As per the latest report, the doctors of U.S. President Donald Trump said that he and his wife could be discharged from the hospital as soon as Monday. 

Apart from this, the trading sentiment was further bolstered by the updates suggesting a sooner end to the deadlock over the U.S. aid package talks. Besides, the fresh hopes of a soft Brexit, triggered after the weekend meeting between the UK PM Boris Johnson and E.U. Commission President Ursula von der Leyen, also favors the market risk-tone extended further support to the currency pair. Across the pond, Australia reports suggest a A$7.5B boost for transport infrastructure spending, which also gave additional support to the Australian dollar and helped the currency pair to stay bids on the day. 

In the meantime, the broad-based U.S. dollar selling bias, triggered by the marker risk-on sentiment, also played its major role in supporting the currency pair. Moreover, the U.S. dollar losses were further bolstered by the intensifying doubts over the U.S. economic recovery. On the contrary, the virus news from elsewhere keeps challenging the upbeat market sentiment and becomes the key factor that kept the pressure on any additional gains in the AUD/USD pair. The AUD/USD currency pair is currently trading at 0.7172 and consolidating in the range between 0.7158 – 0.7191.

It is worth recalling that the AUD/USD currency pair has been pressured since Friday after the negative news of U.S. President Donald Trump and his wife’s infection to the coronavirus (COVID-19). However, America’s fresh and positive updates helped the equity market stop its deeper losses on the day. The latest updates from the U.S. suggest that President Trump and his wife recover from the virus-led illness. Moreover, the hopes were further fueled after the comments from doctors off U.S. President Donald Trump, suggesting he and his wife could be discharged from the hospital as soon as Monday. 

Moreover, the market risk tone was further bolstered by optimism over the U.S. aid package talks. These hopes were originated after the U.S. House Speaker Nancy Pelosi showed positive signals about reaching the stimulus deal. On the other hand, the meeting between the UK PM Boris Johnson and E.U. Commission President Ursula von der Leyen over the weekend also offers fresh hopes of the oft Brexit, which also kept the market trading sentiment upbeat. 

Across the ocean, bullish sentiment around the AUD/USD currency pair was further bolstered by the reports suggesting that the Australian Deputy Prime Minister (PM) Michael McCormack is ready to announce a further $7.5 billion new transport infrastructure spending in Tuesday’s federal budget. Looking forward, the market traders keeping their eyes on the news concerning the American President’s health. Apart from this, the US ISM Services PMI for September, expected 56.0, would be key to watch. In the meantime, the updates surrounding the fresh Sino-US tussle, as well as the coronavirus (COVID-19), could not lose their importance.


Daily Support and Resistance

S1 0.7068

S2 0.7112

S3 0.7138

Pivot Point 0.7157

R1 0.7182

R2 0.7201

R3 0.7245

The AUD/USD pair is trading sideways in a narrow trading range of 0.7190 – 0.7170. The bullish breakout of 0.7190 level can drive buying until the 0.7240 resistance level, while the bearish breakout of 0.7170 can extend selling until 0.7160 and 0.7149 level. Let’s consider waiting for a breakout before taking any trades. Good luck! 

Categories
Forex Market Analysis

How Elliott Wave View of NASDAQ Anticipates Trump’s Coronavirus Outcome

Overview

The NASDAQ 100 Index fell 2.2 percent on Friday’s trading session on the news of the US President Donald Trump’s positive coronavirus test. Still, the price action unveiled the wave B completion, suggests further declines for the US technologic benchmark in the following trading sessions.

Market Sentiment Overview

During the last trading week, the NASDAQ 100 volatility has been driven by market participants’ expectations facing the first presidential debate between US President Donald Trump and former Vice President Joe Biden.

The advance experienced by the technology index was boosted by the expectation of new economic stimulus, driving the NASDAQ 100 to raise over 4%. However, its gains were lowered after the announcement of President Trump’s positive Coronavirus test, leading it to ease up to 2.74% on Friday’s trading session.

The following 8-hour chart of NASDAQ 100 reflects the 90 days high and low range. In the figure, we distinguish that the price halted its advance towards the extreme bullish sentiment zone, closing the trading week in the bullish market sentiment area and under the weighted 200-day moving average. This market context leads us to weight a neutral market sentiment.

On the other hand, the 12-hour chart corresponding to the NASDAQ 100 Volatility Index shows the 90 days high and low range where we distinguish a sideways movement consolidating above the 200-period weighted moving average. This volatility context of the NASDAQ 100 index, added to the new test of the upper-line of the consolidation structure, leads us to expect an increase in volatility within the coming trading sessions.

Summarizing, NASDAQ 100’s market sentiment unveils that this index and its volatility figures will be driven by the news on the upcoming presidential elections on Tuesday, November 03. In particular, NASDAQ 100 could turn bearish in the following trading sessions.

Elliott Wave Outlook

The overview of NASDAQ 100 shows the full development of a five-wave bullish sequence, which began on June 15, when the price found fresh buyers at 9,383.6 pts pushing the price towards new record highs September 02 at 12,466.6 pts. Once reached the all-time high, the technological index began to perform a bearish corrective movement, which remains in progress.

The following chart shows the NASDAQ 100 in its 4-hour timeframe, where we distinguish that the price has completed a five-wave impulsive structure of Minor degree labeled green. At the same time, we can confirm that the Elliott wave theory rule, stating that there must be only one extended wave. In this case, the NASDAQ 100 index developed a fifth extended wave that ended on September 02 when the price found resistance at 12,466.6 pts. Once the fifth wave of Minor degree concluded, the NASDAQ 100 began performing a corrective sequence, which remains in progress.

In particular, the completion of the wave ((c)) of Minute degree identified in black, which completed the wave B of Minor degree, coincided with the news media release concerning the US President Trump’s positive test, activating the beginning of the wave C, labeled in green.

The following hourly chart of NASDAQ 100 illustrates the first bearish movement’s internal structure corresponding to its wave (i) of the Minuette degree identified in blue. This first downward wave reveals a drop in five moves of Subminuette degree identified in green in its internal formation. Once this second move has been completed, the technological benchmark should resume its declines.

Finally, considering that wave (i) of Minuette degree completed its descending move at 11,220.8 pts on Friday 02nd, the price could retrace, forming its second wave of the same degree. In terms of the Dow Theory, this retrace could be between 33% and 66%, or between the 11,352.3 pts and 11,483.7 pts, where NASDAQ 100 might start to develop a new decline, corresponding to wave (iii) in blue.

Categories
Forex Market Analysis

Daily F.X. Analysis, October 05 – Top Trade Setups In Forex – Eyes on Eurogroup Meetings! 

The Asian sessions exhibit thin volatility as Chinese banks are closed in observance of National Day. However, the European and the U.S. session may drive some volatility on the back of Services PMI, Euro-group Meetings, and ISM Non-manufacturing PMI data. Let’s keep an eye on them today.

Economic Events to Watch Today  


EUR/USD – Daily Analysis

The EUR/USD pair was closed at 1.17160 after placing a high of 1.17488 and a low of 1.16955. . On Friday, the EUR/USD currency pair posted losses on the back of a strong U.S. dollar and weak Euro due to declining Consumer prices in many countries of the European Union. 

The 19-nation Eurozone saw a decline in Consumer prices on Friday more than forecasted in September and kept the pressure on the European Central Bank over the decision to add further stimulus help in the economy for fighting against the coronavirus crisis. At 11:45 GMT, the French Gov Budget Balance was released that showed a deficit of -165.7B against the previous decline of -151.0B. At 12:00 GMT, the Spanish Unemployment Change showed that the unemployment was reduced by -26.3K figure against the forecasted positive 59.5K and helped Euro gained strength. 

At 14:00 GMT, the Flash estimate for the year of Consumer Price Index for the whole Eurozone declined to -0.3% against the forecasted -0.1% and weighed on Euro. The Core CPI Flash estimate for the year also declined to 0.2% against the forecasted 0.5% and weighed on Euro. The weak inflation rate from Eurozone could be attributed to many reasons, including the temporary sales-tax cut in Germany, subdued demand, and the declining import costs due to the appreciation of the Euro.

The President of the European Central Bank (ECB), Christine Lagarde, has already warned that the region’s prices will slip in the months coming ahead, but she also said they would turn up again in early 2021. The ECB is currently looking to adjust its target inflation of 2% as part of its strategic review as the average inflation in 2022 is projected as 1.3%, which is far below its goal.

Many policymakers have started to lay the ground for further support from the government as one of the executive members of ECB said that there was less risk in delivering too much support than delaying and being shy to deliver. The ECB Vice President Luis de Geindos said last week that there was no need to immediately take any decision; however, in time of need, the Bank could recalibrate its 1.35 trillion euros emergency bond-purchase program. There are also some predictions that this program will be increased by 350 billion euros this year in December. All these things kept the Euro currency under pressure on Friday and added weight on EUR/USD pair prices.

The U.S. dollar was strong across the board after releasing the Unemployment Rate and Revised Consumer Confidence report. At 17:30 GMT, the U.S. job loss rate declined to 7.9% in August against the projected 8.2% and supported the U.S. dollar. The Revised UoM Consumer Sentiment rose to 80.4 against the anticipated 78.9 and supported the U.S. dollar. The U.S. dollar’s strength was also supported by the news that U.S. President Donald Trump and his wife were diagnosed with coronavirus. The U.S. Dollar Index rose to 93.918 level in late Friday after this news raised the safe-haven appeal and the U.S. dollar gained due to its safe-haven status and weighed on EUR/USD pair.

The pair was also down due to low-risk sentiment and declining U.S. stocks that fell sharply after the news that Trump and First Lady tested positive for COVID-19. The S&P 500 futures were down by 1.3%, the Dow Futures were down by 1.2%, and the NASDAQ was down by 1.8%; this weighed further on EUR/USD pair on Friday.

Daily Technical Levels

Support Resistance

1.1724     1.1739

1.1715     1.1745

1.1709     1.1754

Pivot point: 1.1730

EUR/USD– Trading Tip

The EUR/USD is trading over a resistance become a support level of 1.1728 level. Above this level, the EUR/USD can soar until the next resistance level of 1.1740 and 1.1760. Conversely, a bearish breakout of 1.1720 can lead EUR/USD pair towards 1.1711 areas. Let’s keep an eye on the Eurogroup meeting to determine further trends in the market. The bullish bias remains dominant today.


GBP/USD – Daily Analysis

The GBP/USD pair was closed at 1.29345 after placing a high of 1.29538 and a low of 1.28364. The GBP/USD pair remained positive throughout the day on the back of rising hopes that this weekend there might be a breakthrough in the Brexit deal as PM Boris Johnson and ECB President Ursula Von der Leyen are set to meet.

Pound investors see this weekend meeting as a positive sign for the Brexit deal and raised the British Pound value on renewed hopes that this meeting will provide some fresh hopes on the Brexit deal. However, the gains remain limited as there were many uncertainties in the market weighing on the riskier assets.

During the late-night Thursday, the news that U.S. President Donald Trump and his wife, First Lady, tested positive for COVID-19. The uncertainty related to the U.S. President and a candidate for the upcoming U.S. Presidential Election, Donald Trump’s health, raised concerns that it might cause the election’s complications.

Although the U.S. dollar gained in this uncertainty due to its safe-haven status, the gains remain limited and failed to reverse the GBP/USD pair’s an upward trend as the issue affects the U.S. in particular. So, in this situation, investors found other safe-havens like the Japanese Yen comparatively more appealing.

On the data front, the highly awaited Average Hourly Earnings for September declined to 0.1% on Friday against the forecasted 0.5% and weighed on the S.U. dollar. The Non-Farm Employment Change revealed that the U.S. created only 66K jobs in September projected as 900K and weighed heavily on the U.S. dollar. In August, the factory orders of the U.S. also fell to 0.7% from the projected 1.5% and weighed on the U.S. dollar.

Due to negative macroeconomic data, the weak U.S. dollar added further support to the rising GBP/USD prices on Friday. Meanwhile, the pair GBP/USD remained supported by the progress being made in the Brexit process and the U.S. Presidential Elections. The hopes in the market raised that weekend talks could lead to a breakthrough or approve further months of negotiations due to comments that progress has been made, but some significant gaps were still there. 

If some more time is provided for negotiations, then the Brexit deal might get approved, and that is why investors were cheering the news of a meeting between Johnson and Ursula. Furthermore, the GBP/USD pair’s gains were capped by the rising number of coronavirus cases in the U.K. U.K. reported roughly 12,900 cases in a single day that was the biggest daily record that raised fears that a full lockdown could be imposed in the U.K. The U.K. has already imposed a lockdown in some areas, and fears for further restrictions capped further gains in GBP/USD pair. The investors will look forward to Bank of England’s Haldane’s speech on Monday to find fresh clues about the pair’s movement.

Daily Technical Levels

Support Resistance

1.2912     1.2948

1.2896     1.2968

1.2876    1.2984

Pivot point: 1.2932

GBP/USD– Trading Tip

The GBP/USD is holding below a strong resistance level of 1.2954 level after violating the narrow trading range of 1.2835 – 1.2810. Above this resistance level of 1.2954, the GBP/USD may go after the 1.3000 level. The leading technical indicators such as 50 periods EMA and MACD suggest bullish bias in the Sterling; however, the recent closings below the 1.2950 level can drive selling bias until the 1.2885 level today. Consider taking selling trade below 1.2955 level or buying above the same level today. 


USD/JPY – Daily Analysis

The USD/JPY pair was closed at 105.361 after placing a high of 105.664 and a low of 104.941. Overall the movement of the USD/JPY pair remained bearish throughout the day. The pair USD/JPY fell to its seven days lowest level on Friday amid the U.S. President’s shocking news being infected with the coronavirus. In the early trading session on Friday, the pair suffered heavy selling bias; however, during the late trading session, the pair recovered most of its daily losses but remained bearish all day.

On the data front, at 04:30 GMT, the Unemployment Rate from Japan remained flat with 3.0% expectations in August. 

At 04:50 GMT, the Monetary Base for the year from Japan raised to 14.3% from the forecasted 11.9% and supported the Japanese Yen. The Consumer Confidence from Japan was released at 10:00 GMT that raised to 32.7 from the projected 31.6 in September and supported the Japanese Yen. The strong JPY weighed on the USD/JJPY pair, and the pair started to decline on Friday.

However, the pair was already under pressure due to Trump’s late-night announcement being infected by COVID-19. He twitted that he and the Frist Lady of the U.S. were tested positive for coronavirus. This news kept the uncertainty higher in the market as the 2020 U.S. Presidential Elections were coming, and an influencing candidate fell sick of coronavirus. The news came in hours after a top adviser to U.S. President Donald Trump was tested positive for COVID-19.

The bullish bets in the Japanese Yen caught up after this news as the issue was related to the United States and investors found the Yen more appealing. The rising JPY added further pressure on the USD/JPY pair that dropped to its 7-days lowest level. In the late trading session, the U.S. dollar saw some buying that capped some earlier daily losses in the USD/JPY pair on Friday. The U.S. Dollar Index posted gains on Friday with reaching at 93.918 level in the late trading session. The US Stocks also declined on Friday amid the shocking news with S&P futures down by 1.3%, and Dow futures fell by 1.2% along with NASDAQ futures down by 1.8%. 

From the U.S. side, the Average Hourly Earnings for September declined to 0.1% from the anticipated 0.5% and weighed on the U.S. dollar. The Non-Farm Employment Change also dropped to 661K against the projected 900K and weighed on the U.S. dollar. Simultaneously, the Unemployment Rate in August dropped to 7.9% from the forecasted 8.2% that supported the U.S. dollar.

After these releases, the President of Philadelphia Federal Reserve, Patrick Harker, provided his reviews over Fed’s new framework. He said that the employment gap in society would be closed by allowing inflation to move slightly higher. He added that more support would be needed from governments and employers to ensure that lower-income workers could benefit from it. Harker also stressed the need to build an equitable workforce recovery and added that it would not be easy to recover all lost jobs during a pandemic crisis. Harker suggested that a program is needed to help workers provided better jobs and pay. Harker’s positive comments provided some strength to the U.S. dollar that was further supported by the late session positive data release.

At 19:00 GMT, the Revised Consumer Sentiment raised to 80.4 from the projected 78.9 and supported the U.S. dollar. Whereas, the Revised UoM Inflation Expectations came in at 2.6%. These positive updates gave the U.S. dollar strength and capped further losses in the USD/JPY pair.

Daily Technical Levels

Support Resistance

105.34     105.65

105.16     105.78

105.04     105.96

Pivot point: 105.47

USD/JPY – Trading Tips

The USD/JPY is also trading neutral at 105.560 amid thin trading volume and China national holiday today. The downward trendline is extending resistance at 105.560 level on the two-hourly timeframes today. The closing of Doji candles below the trendline is suggesting neutral bias among traders. The technical side of USD/JPY may extend the pair lower towards 105.200, and the series for EMA is now developing support at 105.400 level. On the flip side, the bullish breakout of 105.590 level may lead the safe haven pair towards 105.800. Consider taking buying trade over 105.450 level and selling below the same today. Good luck! 
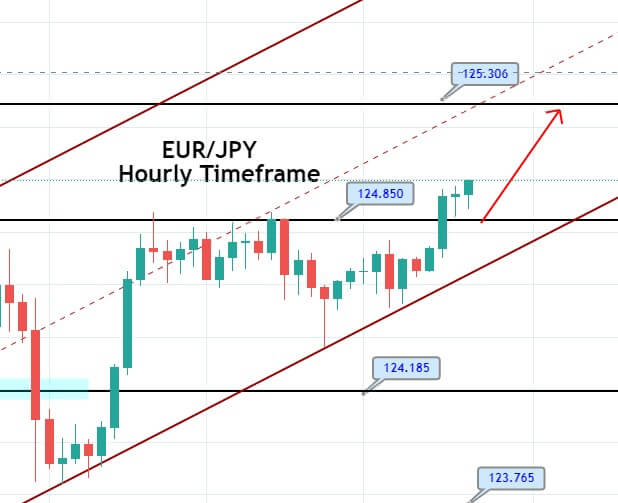
 

Categories
Forex Signals

USD/CAD Succeeded to Stop Bearish Streak – Quick Update on Signal! 

Today in the Asian trading session, the USD/CAD currency pair managed to stop its previous day bearish rally and edged higher around well above the 1.3300 level on the day. However, the bullish sentiment around the currency pair was being supported by the combination of factors, and as the broad-based U.S. dollar is back in demand on the day in reaction to a confusing end of the U.S. presidential debate, as well as the U.S. dollar gained further support after the release of upbeat U.S. macro data, which kept the currency pair higher. 

Besides, the market prevalent risk-off sentiment, triggered by the latest headlines surrounding U.S. President Donald Trump’s infection of the coronavirus (COVID-19), provided a further boost to the U.S. dollar as its safe-haven status. Across the pond, the reason for the USD/CAD pair’s bullish bias could also be linked to the soft WTI crude oil prices, which undermined the demand for the loonie and contributed to the currency pair gains. 

The stock market had been flashing red since the day session started and going toward ending the day with losses. Nevertheless, the reason could be associated with the U.S. policymakers’ failures to break the deadlock over the COVID-19 stimulus talks. Meanwhile. The rumors are surrounding U.S. President Donald Trump’s infection of the coronavirus (COVID-19), also weighing on the market trading tone, which tends to underpin the safe-haven assets like the U.S. dollar.

The long-lasting fight between the United States and China remain on the play as the South China Morning Post (SCMP) cites the U.S. preference for Taiwan over Beijing, which keeps fueling the relations between the United States and China. In the meantime, the market risk-off tone was further bolstered by the Financial Times (F.T.) headline, suggesting deployment of forces in Hong Kong to tame the democracy protests. This, in turn, added further pessimism around the market trading sentiment and underpinned the safe-haven assets.

The crude oil prices failed to extend its previous session winning streak and remained depressed around $38.00 marks across the pond. Nevertheless, the idea for the bearish bias around the crude oil prices could be attributed to the prevalent worries over the economic recovery after the coronavirus (COVID-19) resurgence in the U.S., Europe, and the U.K. Besides, the rise in OPEC output last month also weighed on crude oil prices. Apart from this, the currency pair’s bullish sentiment was further bolstered by the downbeat monthly Canadian GDP report, which eventually undermined the Candian dollar and extended further support to the currency pair. At the data front, the economy recorded a 3% growth in July, lower than the previous month’s 6.5% rise.

Looking forward, the traders will keep their eyes on the continuous drama surrounding the U.S. elections and updates about the U.S. stimulus package. Meanwhile, the U.S. employment data for September will be key to watch on the day.


Daily Support and Resistance

S1 1.3222

S2 1.3301

S3 1.3344

Pivot Point 1.3381

R1 1.3423

R2 1.3461

R3 1.354

Technically, the USD/CAD is supported around 1.3283 levels extended by a double bottom support level. On the higher side, the USD/CAD may face resistance at 1.3342 level. The USD/CAD two-hour timeframe shows a bullish signal, especially after closing the bullish engulfing candle over 1.3283 support zones. Checkout a trading plan below…

Entry Price – Buy 1.33255

Stop Loss – 1.32855

Take Profit – 1.33655

Risk to Reward – 1:1

Profit & Loss Per Standard Lot = -$400/ +$400

Profit & Loss Per Micro Lot = -$40/ +$40

Fellas, now you can check out forex trading signals via Forex Academy mobile app. Follow the links below.

iPhone Users: https://apps.apple.com/es/app/fasignals/id1521281368

Andriod Users: https://play.google.com/store/apps/details?id=academy.forex.thesignal&hl=en_US

Categories
Forex Market Analysis

Daily F.X. Analysis, October 02 – Top Trade Setups In Forex – Brace for Non-farm Payroll! 

On the news front, it’s going to be a busy day, as the U.S. economy will be releasing it’s Non-farm payroll figures. For all the new members, the NFP is the most awaited data, and it’s expected to show an 8.2% unemployment rate along with a 0.5% average hourly earnings. Such a figure should drive buying in the dollar, and gold may dip on the positive news release today. However, the 900K Non-farm employment change is below 1371K figures beforehand, which may burden on the U.S. dollar. The mixed movement is expected from the dollar today.

Economic Events to Watch Today  


EUR/USD – Daily Analysis

The EUR/USD prices were closed at1.17455 after placing a high of 1.17695 and a low of 1.17170. Overall the movement of the EUR/USD pair remained bullish throughout the day. On Thursday, EUR/USD prices rose on the back of upbeat European stock market amid improved risk sentiment due to rising hopes of U.S. stimulus measure and some positive corporate news.

Different European companies reported gains, and increased sales in September gave signals of a significant recovery in the European corporate sector. It raised the European currency against its rival U.S. dollar and supported the upward trend of the EUR/USD pair on Thursday.

Meanwhile, the optimism raised in the market related to the U.S. stimulus measures after U.S. Treasury Secretary Steven Mnuchin confirmed that talks with Nancy Pelosi had a significant breakthrough. However, the differences were still there. The fact that both sides were showing a willingness to reach a consensus and issue the next round of aid raised bars that the U.S. Congress would announce the package sooner.

These hopes in the market supported the risk sentiment that helped the riskier Euro currency to post gains against its rival U.S. dollar and push the EUR/USD pair even higher.

On the data front, at 12:15 GMT, the Spanish Manufacturing PMI for September remained flat with the expectations of 50.8. At 12:45 GMT, the Italian Manufacturing PMI dropped to 53.2 from the forecasted 53.6 and weighed on Euro. At 12:50 GMT, the French Final Manufacturing PMI for September increased to 51.2 against the forecast of 50.9. At 12:55 GMT, the German Final Manufacturing PMI remained flat with the projected 56.4. At 13:00 GMT, the Final Manufacturing PMI for the whole Eurozone also came in line with the expectations of 53.7. The Italian Monthly Unemployment Rate for August dropped to 9.7% against the expectations of 10.2% and supported Euro. 

At 14:00 GMT, the Producer Price Index for Eurozone dropped to 0.1% against the expectations of 0.2% and weighed on local currency. Whereas, the Unemployment Rate for the whole bloc remained flat with forecasts at 8.1%. Most data from Europe on Thursday came in as expected and supported Euro that also added further gains in EUR/USD pair.

On the U.S. side, the U.S. dollar remained depressed on Thursday after the release of negative ISM Manufacturing PMI and Personal Income data. At 17:30 GMT, the Personal Income for August dropped to -2.7% from the expected -2.0% and weighed on the U.S. dollar. At 19:00 GMT, the ISM Manufacturing PMI from the U.S. fell short of expectations of 56.0 and came in as 55.4 and weighed on the U.S. dollar.

The U.S. dollar index also fell by 0.2% on Thursday, and this weakness drove the EUR/USD pair in the upward direction, but the gains remained limited as the European countries were forced to implement renewed restrictions due to the second wave of coronavirus. 

On Wednesday, European countries like Finland, Spain, the Czech Republic, Slovakia, Spain, and Poland implemented new restrictions as the infection cases were continuously increasing. These restrictions kept the local currency under pressure, and the gains in EUR/USD pair limited on Thursday.

Daily Technical Levels

Support Resistance

1.1718      1.1771

1.1691      1.1797

1.1665      1.1824

Pivot point: 1.1744

EUR/USD– Trading Tip

The EUR/USD has violated the upward trendline support level of 1.1728 level, and now the same level is working as a resistance for the EUR/USD. Below this, the EUR/USD can trade with a bearish bias until the 1.1695 level. Conversely, negative NFP figures may lead the EUR/USD price towards the 1.1755 level. The bearish bias remains strong today.

GBP/USD – Daily Analysis

The GBP/USD pair was closed at 1.28859 after placing a high of 1.29785 and a low of 1.28194. Overall the movement of the GBP/USD pair remained bearish throughout the day. After posting gains for six consecutive days, the GBP/USD pair dropped on Thursday amid different headlines in the market related to Brexit talks. The talks between the U.K. and the E.U. suggested some progress in breaking the deadlock in Brexit talks.

The comments after the latest round of talks between the U.K. & E.U. over the post-Brexit deal provided differing reports of progress that suggested that both sides were far from reaching a consensus. This weighed on the Sterling and dragged the pair GBP/USD from its previous daily gains.

The differences over the key sticking issues like fisheries and level playing fields remain intact in the latest trade negotiations. Some reports suggested that a landing zone on state aid has been identified between the E.U. & the U.K., and the only fishing issue was left. Both reports were providing different information, and this confused the market traders and raised fears of a no-deal Brexit that weighed on local currency and ultimately on the GBP/USD pair.

The Cabinet Office Minister Michael Gove said that the U.K. has already made it clear that it will not look into the demands to take control over the access to its waters and fish after the Brexit-transition period. He said that the U.K. would rather leave the E.U. without a Brexit deal than sticking with the E.U.’s Common Fisheries Policies. 

The U.K. has also issued an internal market bill that undermines the withdrawal agreement, and this has already made the E.U. angry. The chances for a no-deal Brexit are increasing day by day as the E.U. has threatened to take legal actions against the U.K. in response to the internal market bill. The pressure over negotiators has been increased to reach a consensus before the European Summit on October 15 as the top E.U. negotiator Michel Barnier will have to address the latest updates on Brexit negotiations.

Meanwhile, on the data front, the Final Manufacturing PMI from the U.K. came in line with the expectations of 54.1. And from the U.S. side, the ISM Manufacturing PMI dropped to 55.4 from the forecasted 56.0 and weighed on the U.S. dollar that capped further losses in the GBP/USD pair on Thursday.

Moreover, on Thursday, the Bank of England’s governor Andy Haldane said that the corporate sector needed to spend more and hire more people to make the economic recovery smooth. He addressed that corporate investments were the missing ingredient in the economic recovery, and it should be met to see further growth in the economy.

Daily Technical Levels

Support Resistance

Support Resistance

1.2812     1.2974

1.2735     1.3057

1.2651     1.3135

Pivot Point: 1.2896

GBP/USD– Trading Tip

The GBP/USD is also supported over a strong trading range of 1.2835 – 1.2810 support levels. Above this range, the Cable will always have strong odds of bouncing off until 1.2901 and 1.2945 level. At the same time, a bearish breakout of 1.2811 level may lead the Sterling towards 1.2764 level. Today, we should look for a buy trade 1.2896 until the next target level of 1.2950 as the market is likely to stay supported. Let’s brace for the U.S. non-farm payroll data today to have further certainty about the pair. 


USD/JPY – Daily Analysis

The USD/JPY closed at 105.543 after placing a high of 105.726 and a low of 105.401. Overall the movement of the USD/JPY pair remained bullish throughout the day. Despite the broad-based U.S. dollar weakness and negative ISM Manufacturing PMI, the USD/JPY pair posted small gains on the day and climbed to a fresh daily high of 105.726 level. The upward momentum in the USD/JPY pair could be attributed to the improved risk sentiment in the market after the hopes for a U.S. stimulus package from the U.S. Congress increased.

On Thursday, the U.S. Treasury Secretary Steven Mnuchin said that he held talks with Nancy Pelosi to discuss the next round of U.S. stimulus measures, and he hoped that it would be released soon. The difference in the size of the package between Republicans & Democrats is still there, but they have agreed that consensus should be quickly reached, so the optimism surrounding the package increased and weighed on the safe-haven Japanese Yen that ultimately added Support to the USD/JPY pair. 

Meanwhile, on the data front, at 04:50 GMT, the Tankan Manufacturing Index came in as -27 against the forecast of -23 and weighed on the Japanese Yen. The Tankan Non-Manufacturing Index also dropped to -12 from the expected -9 and weighed on the Japanese Yen. The negative data from Japan gave strength to the USD/JPY pair on Thursday in early trading hours. 

However, at 05:30 GMT, the Final Manufacturing PMI from Japan rose to 47.7 against the projected 47.3 in September and supported the Japanese Yen that capped further upside momentum in the USD/JPY pair.

From the USD side, at 17:30 GMT, the Core PCE Price Index for August remained flat with the expectations of 0.3%. Personal Spending in August rose to 1.0% against the projected 0.7% and supported the U.S. dollar. The Unemployment Claims from last week also dropped to 837K against the expected 850K and supported the U.S. dollar. The Personal Income in August dropped to -2.7% against the forecasted -2.0% and weighed on the U.S. dollar.

At 18:45 GMT, the Final Manufacturing PMI for September remained flat with the expectations of 53.2. At 19:00 GMT, the ISM Manufacturing PMI dropped to 55.4 from the projected 56.0 in September and weighed on the U.S. dollar. Whereas, Construction Spending in August rose to 1.4% against the expected 0.8% and supported the U.S. dollar. The ISM Manufacturing Prices also rose to 62.8 from the forecasted 59.0 and supported the greenback.

The Wards Total Vehicle Sales from the U.S. also rose to 16.3M from the anticipated 15.5M in September and supported the U.S. dollar.

The U.S. dollar was weak across the board on Thursday, as the U.S. Dollar Index (DXY) posted 0.2% losses on the day. However, the USD/JPY pair still manage to post gains on the day due to positive data releases. Most of the data released on Thursday came in Support of the U.S. dollar except the highlighted data of ISM Manufacturing PMI. But traders tend to ignore the declining PMI and focused more on other positive releases like Personal Spending and Unemployment claims.

Daily Technical Levels

Support Resistance

Support Resistance

105.35    105.70

105.20    105.90

104.99    106.05

Pivot point: 105.55

USD/JPY – Trading Tips

The USD/JPY has violated the double bottom support level of 105.277 level amid an increased safe-haven appeal. The coronavirus news of Trump and his wife testing positive is making the market volatile. The technical side of USD/JPY continues to be bearish around 105.200, and the series for EMA is now extending resistance at 105.550 level. On the flip side, the support holds at 104.800 level. The MACD also supports the selling bias amid a stronger Japanese yen due to increased safe-haven appeal. Bearish trend continuation and violation of the 104.800 level can open additional room for selling until 104.350. Good luck! 
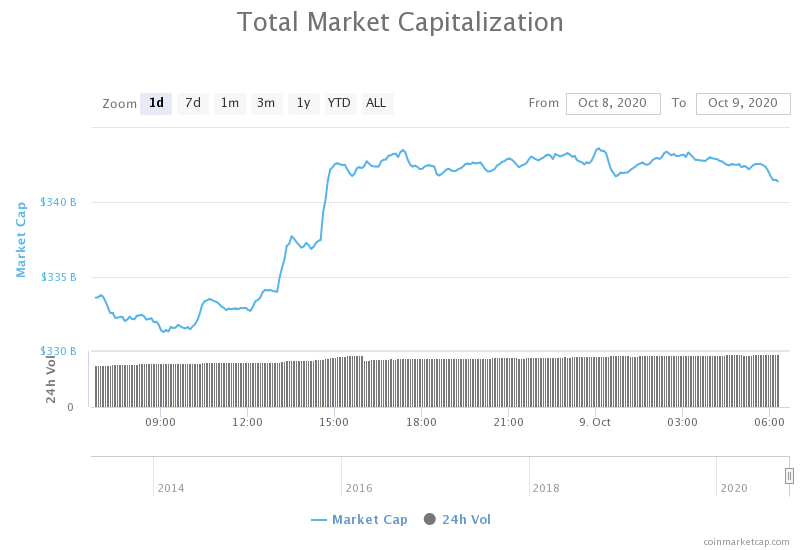
 

Categories
Crypto Market Analysis

Daily Crypto Review, Oct 2 – Trump Tests Positive for COVID-19; Crypto and Stocks Negatively Affected

The cryptocurrency sector has failed to confidently push towards new highs, which triggered a pullback. On top of that, the current macroeconomic situation has pushed both cryptocurrencies and stocks towards the downside. Bitcoin is currently trading for $10,476, representing a decrease of 2.82% on the day. Meanwhile, Ethereum lost 5.09% on the day, while XRP lost 3.7%.

 Daily Crypto Sector Heat Map

If we look at the top100 cryptocurrencies as well as their gains and losses, Bitcoin Gold gained 4.88% on the day, making it the most prominent daily gainer. Balancer (3.92%) and Celsius (3.43%) also did great. On the other hand, Energy Web Token lost 16.88%, making it the most prominent daily loser. It is followed by Arweave’s loss of 16.61% and yearn. finance’s loss of 14.45%.

Top 10 24-hour Performers (Click to enlarge)

Bottom 10 24-hour Performers (Click to enlarge)

Bitcoin’s level of market dominance stayed at the same spot since our last report, with its value currently being at 60.37%. This value represents a 0.11% difference to the downside when compared to when we last reported.

Daily Crypto Market Cap Chart

The crypto sector capitalization has lost value over the course of the past 24 hours. Its current value is $336.45 billion, which represents a decrease of $7.99billion when compared to our previous report.

_______________________________________________________________________

What happened in the past 24 hours?

_______________________________________________________________________

_______________________________________________________________________

Technical analysis

_______________________________________________________________________

Bitcoin

The largest cryptocurrency by market cap failed to break the 38.2% Fib retracement level, causing a pullback, which (as we mentioned in our previous article) brought its price to the $10,360 range. The pullback happened over the course of a few hours, and first tested the ascending (pink) resistance level, which got confirmed, triggering another push towards the downside.

Even though Bitcoin’s price went down slightly, the good news is that the $10,360 range has not been breached. If Bitcoin, on the other hand, breaks this level to the downside, we may expect a strong push towards the downside.

BTC/USD 4-hour Chart

Bitcoin’s short-term technicals remained tilted towards the sell-side ever since Bitcoin confirmed its position below the 38.2% Fib retracement. Its daily overview has become a bit more bearish as well, while its weekly and monthly overviews are extremely bullish.

BTC/USD 4-hour Technicals

Technical factors (4-hour Chart):
  • Price is below its 50-period EMA and its 21-period EMA
  • Price is below its lower Bollinger band
  • RSI is pushing towards oversold(37.02)
  • Volume is average (with a couple of spike candles)
Key levels to the upside          Key levels to the downside

1: $10,630                                 1: $10,500

2: $10,850                                 2: $10,360

3: $11,000                                  3: $10,015

Ethereum

Ethereum’s price movement has lost its structure ever since it broke the higher high/higher low pattern it has created. The second-largest cryptocurrency by market cap pushed towards the $371 resistance level, but failed to break it, causing a strong pullback which first tested $360, and then went all the way down to $340 as $360 failed to hold.

ETH/USD 4-hour Chart

While Ethereum’s 4-hour and 1-day technicals are now tilted towards the sell-side, its long-term overview seems extremely bullish. Its weekly or monthly technicals are both heavily tilted towards the buy-side.

ETH/USD 4-hour Technicals

Technical Factors (4-hour Chart):
  • The price right below its 50-period and its 21-period EMA
  • The price is below its lower Bollinger band
  • RSI is heading towards the oversold territory (36.74)
  • Volume is average with a couple of spike candles
Key levels to the upside          Key levels to the downside

1: $360                                     1: $340

2: $371                                     2: $300

3: $400                                      3: $289

Ripple

XRP’s trading in the upper part of the range-bound by $0.235 and $0.2454 got interrupted by the market tumbling, pushing its price down towards $0.235 as well. While the $0.235 level was passed in the most recent push towards the downside, it is still unsure whether the price will stabilize above or below it. Traders should be very careful and should either try “riding the wave” if XRP starts to drop, or they should wait until the picture becomes a bit more clear.

XRP/USD 4-hour Chart

XRP technicals are now quite uniformed, with both short-term and long-term technicals being bearish. However, its weekly outlook shows a slight tint of bullishness.

XRP/USD 4-hour Technicals

Technical factors (4-hour Chart):
  • The price is below both its 50-period EMA and its 21-period EMA
  • Price is slightly below its lower Bollinger band
  • RSI is heading towards the oversold territory (37.47)
  • Volume is average (with a couple of spike candles)
Key levels to the upside          Key levels to the downside

1: $0.2454                                 1: $0.235 

2: $0.266                                   2: $0.227

3: $0.27                                    3: $0.221


Categories
Forex Market Analysis

DAX 30 Unveils Exhaustion Signals

Overview

The German DAX 30 index, which groups together the 30 most capitalized companies in Germany, shows signs of exhaustion after the rally it developed since the second half of March this year. Likewise, the Elliott wave theory’s perspective reflects the exhaustion of the bullish impulsive movement, which may be advancing in the last impulsive wave of Primary degree.

Market Sentiment Overview

The German benchmark DAX 30 shows a pause in its upward trend, consolidating the rebound that the price has been developing since March 19th when the German index found support in the yearly low located at 7,957.6 pts. Since this bottom zone, DAX 30 has advanced over 60% to date; however, this year the benchmark eases over 2.75% (YTD).

The following daily chart of the German index shows the price action running in the zone of extreme bullish sentiment. However, the shift in price below the 60-day weighted moving average reveals that it could be starting to develop a new short-term corrective process. 

Although the DAX 30 remains in the zone of extreme bullish sentiment, our market bias continues being neutral as long as the likely corrective movement is not confirmed.

Elliott Wave Outlook

The DAX 30 index overview shows a bullish impulsive sequence that looks incomplete. This five-wave structural series that began in early March 2009 currently moves in a consolidation phase, showing exhaustion signals.

In its log-scale weekly chart, the DAX 30 reveals the price moving in a possible fifth bullish wave of Primary degree identified in black. At the same time, we note that the German benchmark had developed a third wave extended of Primary degree.

According to Elliott wave theory, in an impulsive structure, there can only be one extended wave. In this context, and based on the price development formed by DAX 30, we can recognize the movement of five internal impulsive waves of Intermediate degree labeled in blue within the third wave of Primary degree. This bullish movement ended in the second half of January 2018 when DAX climbed until 13,602 pts.

On the other hand, the alternation principle between corrective waves is recognized to happen between the second and fourth waves. While the second wave performed a corrective movement that took 133 days, the fourth wave was developed in 784 days.

As for the fifth wave’s potential completion, there is still no evidence to confirm this completion. On the one hand, according to Elliott wave theory, when in an impulsive sequence, the third wave is extended, it is highly likely that the fifth wave will fail in its attempt to reach new peaks.

On the other hand, we recognize that there is no confirmation of the fulfillment of the criterion of similarity in price, time, or both between the first and fifth wave. In other words, while the first wave advanced 4,024 pts in just over two years, the fifth wave, which started in the second half of March 2020,  has grown about 5,500 pts in barely six months.

To conclude, the overall market sentiment seems to have shifted from the extreme bullish to neutral. Furthermore, the market structure shows the progress fifth wave of Primary degree progress, giving exhaustion signals. Thus, our bias for the German DAX 30 index continues being neutral.

Categories
Crypto Market Analysis

Daily Crypto Review, Oct 1 – Bitcoin Fighting for $10,850; Ethereum Bulls Rallying Against All Odds

The cryptocurrency sector ended up the day in the green, with most cryptocurrencies rallying towards the upside. Bitcoin is currently trading for $10,796, representing an increase of 1.28% on the day. Meanwhile, Ethereum gained 2.46% on the day, while XRP gained 1.15%.

 Daily Crypto Sector Heat Map

If we look at the top100 cryptocurrencies and their gains and losses, DigiByte gained 19.31% in the past 24 hours, making it the most prominent daily gainer. Ren (17.14%) and Maker (15.03%) also did great. On the other hand, The Midas Touch Gold lost 12.25%, making it the most prominent daily loser. It is followed by Energy Web Token’s loss of 7.37% and Hyperion’s loss of 5.71%.

Top 10 24-hour Performers (Click to enlarge)

Bottom 10 24-hour Performers (Click to enlarge)

Bitcoin’s level of market dominance decreased slightly since our last report, with its value currently being at 60.05%. This value represents a 0.43% difference to the downside when compared to when we last reported.

Daily Crypto Market Cap Chart

The crypto sector capitalization has gained in value over the course of the past 24 hours. Its current value is $349.36 billion, which represents an increase of $4.95 billion when compared to our previous report.

_______________________________________________________________________

What happened in the past 24 hours?

_______________________________________________________________________

_______________________________________________________________________

Technical analysis

_______________________________________________________________________

Bitcoin

Bitcoin’s 1-day chart shows that slight bullish sentiment took over after Bitcoin broke the triangle formation to the upside, pushing its price towards the 38.2% Fib retracement, which has proven as a resistance area. It is key for Bitcoin to confidently establish its price above this level if it wants to tackle $11,000 any time soon. However, if this does not happen, we may expect pullbacks to the $10,360 area.

BTC/USD 1-day Chart

If we zoom in to the 4-hour chart, we can see that the bulls are desperately trying to break the $10,850 level (38.2% Fib retracement), but to no avail. If the level does fall, however, we expect it to be on increased volume. Also, if that happens, the push will probably be extended, and traders can catch a lucrative trade on the way down while Bitcoin pulls back.

BTC/USD 4-hour Chart

Bitcoin’s technicals are showing strength all-around, with both shorter and longer time-frames showing bullish sentiment. This may be an indicator of Bitcoin’s current strength and a possible push past $10,850.

BTC/USD 4-hour Technicals

Technical factors (4-hour Chart):
  • Price is slightly above both its 50-period EMA and its 21-period EMA
  • Price is right above its middle Bollinger band
  • RSI is neutral (56.31)
  • Volume is average
Key levels to the upside          Key levels to the downside

1: $10,850                                 1: $10,630

2: $11,000                                 2: $10,500

3: $11,090                                  3: $10,015

Ethereum

Ethereum has shown some strength in the past 24 hours. Its price pattern of making higher highs and higher lows has been interrupted by a lower high and a lower low the past day. On the other hand, its current price movement seems to ignore this bearish sign and is pushing higher towards the $371 level. It seems that, however, $371 will not be reached as the volume is descending and showing a lack of interest in any volatility from both bulls and bears.

When it comes to any form of price direction prediction, traders are torn between putting Ethereum’s current movement in an ascending trend and calling for a rally towards the upside, or calling the most recent lower high/lower low combo a break of the ascending trend, and calling for a push towards the downside.

ETH/USD 4-hour Chart

Both Ethereum’s short-term and long-term technical overviews are tilted towards the buy-side. While its longer-term technicals were always bullish, its 4-hour and 1-day overviews changed from bearish to bullish since we last reported, indicating that the bullish traders might be in the right when it comes to Ethereum’s next move.

ETH/USD 4-hour Technicals

Technical Factors (4-hour Chart):
  • The price is above both its 50-period and its 21-period EMA
  • The price is above its middle Bollinger band
  • RSI is pushing towards the overbought area (59.99)
  • Volume is below average
Key levels to the upside          Key levels to the downside

1: $360                                     1: $340

2: $371                                     2: $300

3: $400                                      3: $289

Ripple

XRP has been trading sideways near its $0.2454 resistance level and tried to break it several times. However, each time failed, and the cryptocurrency had to pull back towards the middle of the range and prepare for its next move. XRP’s low volume and low volatility may be confirming that it is just preparing for the next big move, but the direction is currently unknown. If it rallies towards the upside, traders can either join the extended leg up or trade the pullback. If the price moves down, traders can either trade a bounce off of the $0.235 or wait for a possible break of this support level.

XRP/USD 4-hour Chart

XRP technicals are seemingly always the most interesting and confusing. When it comes to short time-frames, the 4-hour outlook is mixed (but tilted slightly towards the buy-side), while the daily outlook is slightly bearish. Its weekly outlook is back to bullish, while its monthly technicals show bearish sentiment.

XRP/USD 4-hour Technicals

Technical factors (4-hour Chart):
  • The price is slightly above both its 50-period EMA and its 21-period EMA
  • Price is at its middle Bollinger band
  • RSI is neutral (51.39)
  • Volume is stable, and average
Key levels to the upside          Key levels to the downside

1: $0.2454                                 1: $0.235 

2: $0.266                                   2: $0.227

3: $0.27                                    3: $0.221


Categories
Forex Market Analysis

Daily F.X. Analysis, October 01 – Top Trade Setups In Forex – Manufacturing PMI in Highlights! 

On the news front, the eyes will remain on the series of services PMI figures from the Eurozone and the U.K. Most of the data is expected to be neutral; however, the U.S. Unemployment Claims and Manufacturing PMI will be the main highlight of the day. Claims are expected to perform better, while the ISM Non-Manufacturing PMI is expected to report negative figures. Mixed bias prevail for the U.S. dollar today.

Economic Events to Watch Today  


EUR/USD – Daily Analysis

The EUR/USD closed at 1.17208 after placing a high of 1.17548 and a low of 1.16844. After posting gains for two consistent days, the EUR/USD pair dropped on Wednesday amid the broad-based U.S. dollar strength. Another major reason behind the fall in EUR/USD prices on Wednesday was the latest comments from ECB President Lagarde of talking up an idea of moving toward the average inflation targeting measure like the U.S. Fed to fight against pandemic recession. 

Lagarde said on Wednesday that ECB was considering following the footsteps of the U.S. Federal Reserve to ditch its current policy that sets the target of inflation below but close to 2%. The debate over whether ECB should follow the Fed in setting an average inflation target and let inflation run above 2% target came in as analysts suggested that the central bank was running out of tools. Another reason could be a low appetite for cutting interest rates below zero. These dovish hopes kept the market risk sentiment under pressure, and the Euro currency suffered that led to declining EUR/USD pair prices on Wednesday. 

Meanwhile, at the data front, the German Import Prices in August rose to 0.1% from the projected 0.0% and supported Euro. At 10:59 GMT, the German Retail Sales for August also rose to 3.1% from the anticipated 0.4% and supported Euro. 

The French Consumer Spending for August rose to 2.3% from the anticipated -0.2% and supported shared currency. The French Prelim Consumer Price Index (CPI) for September declined to -0.5% against the projected -0.3% and weighed on Euro. 

At 12:55 GMT, the German Unemployment Change in August came in as -8K against the forecasted -7K. At 14:00GMT, the Italian Prelim CPI for September declined to -0.6% against the forecasted -0.5% and weighed on single currency Euro. 

On the U.S. front, at 17:15 GMT, the ADP Non-Farm Employment Change showed a job creation of 749K against the forecasted 650K in September and supported the U.S. dollar. At 17:20 GMT, the Chicago Purchasing Managers Index (PMI) advanced to 62.4 from the forecasted 52.0 and supported the greenback. At 17:30 GMT, the Final GDP for the quarter came in as -31.4% against the projected -31.7% and supported the U.S. dollar. At 19:00 GMT, the Pending Home Sales also rose to 8.8% from the projected 3.1% and supported the U.S. dollar.

Despite the strong economic data from Europe, the pair EUR/USD continued declining on Wednesday as the focus has been shifted towards the U.S. dollar and its strength. The strong greenback managed to keep the pair under heavy pressure on Wednesday amid several factors supporting U.S. dollar gains. Furthermore, the U.S. dollar also gained its strength as the hopes for a new round of U.S. stimulus measures finally increased. Steven Mnuchin, the U.S. Treasury Secretary, said that the talks between Democrats and Republicans over the next round of the coronavirus aid package have resumed. This raised optimism in the market that both parties will reach a consensus soon given Tuesday’s statement of Lagarde in which she reiterated that she had high hopes that both parties will reach a deal by the end of this week. The broad-based greenback’s strength kept weighing on the EUR/USD pair on Wednesday.

Daily Technical Levels

Support Resistance

1.1686       1.1772

1.1630       1.1802

1.1600       1.1858

Pivot Point: 1.1716

EUR/USD– Trading Tip

The bullish bias of the EUR/USD continues to play in the market as the pair is trading at 1.1740 level. On the higher side, the EUR/USD pair may find resistance at 1.1750 level along with a support level of 1.1716 level. A bearish breakout of the 1.1715 level can extend selling bias until the 1.1694 level today. Overall, the price action of the EUR/USD pair will be highly influenced by the series of manufacturing PMI figures not only from the Eurozone but also from the U.S. economy. Bullish bias will be dominant upon the breakout of 1.1750.


GBP/USD – Daily Analysis

The GBP/USD closed at 1.29232 after placing a high of 1.29424 and a low of 1.28051. Overall the movement of the GBP/USD pair remained bullish throughout the day. The GBP/USD pair continued its bullish streak for the 6th consecutive days on Wednesday despite the broad-based U.S. dollar weakness. The upward momentum of GBP/USD could be attributed to the renewed Brexit hopes and positive comments from Haldane. 

On Wednesday, the U.S. Dollar Index remained flat at 93.92 despite the strong macroeconomic releases on the day. At 17:15 GMT, the ADP Non-Farm Employment Change from the United States rose to 749K against the expectations of 650K and supported the U.S. dollar. At 17:20 GMT, the Chicago PMI also rose to 62.4 from the expected 52.0. At 17:30 GMT, the Final GDP for the quarter showed a contraction of -31.4% in the second quarter against the projected contraction of -31.7%. At 19:00 GMT, the Pending Home Sales for August rose to 8.8% against the forecasted 3.1%. All these positive data from the U.S., but still GBP/USD pair managed to post gains on the back of high Brexit hopes. 

On Wednesday, the Cable moved higher as the latest headlines out of Brexit negotiations were positive. The E.U.’s chief negotiator Michel Barnier praised the improved atmosphere around the post-Brexit deal on Wednesday. The member states ordered France to back down from its demands to secure status quo access to Britain’s fishing grounds. Barnier said that a breakthrough could be made during this week’s round of negotiation as both sides had been able to engage more closely on fishing and state aid issues.

Apart from Brexit renewed hopes, the comments from Bank of England’s chief economist Andy Haldane also provided support to the rising GBP/USD pair. Haldane said that Britain’s economy was being held back by the overly pessimistic views about the coronavirus crisis. He provided some relief when he said that none of the conditions that would lead to negative interest rates had been met. 

It means his comments ruled out the option of negative interest rates in the current period when the country is facing a healthy and robust wave of coronavirus pandemic. These positive comments from Haldane supported British Pound that pushed the GBP/USD pair on the upside for the 6th consecutive days.

From the U.K., the BRC Shop Price Index for the year dropped to -1.6% against the forecasted -1.4% and weighed on Sterling. At 10:59 GMT, the Nationwide HPI for September rose to 0.9% against the forecasted 0.5% and supported the Sterling that added gains in GBP/USD pair. At 11:00 GMT, the Current Account Balance from the U.K. showed a deficit of 2.8B against the forecasted deficit of 1.0B and weighed on British Pound. The Final GDP for the quarter showed a contraction of -19.8% against the forecasted contraction of -20.4% and supported the local currency GBP that ultimately provided added support to GBP/USD pair’s gains on Wednesday. At 11:02 GMT, the Revised Business Investment for the quarter came in as -26.5% against the forecasted -31.4% and supported the upward momentum of the GBP/USD pair.

Daily Technical Levels

Support Resistance

1.2821       1.2902

1.2781       1.2943

1.2740       1.2983

Pivot point: 1.2862

GBP/USD– Trading Tip

The GBP/USD is consolidating with a bullish bias at 1.2875 level, having violated the sideways trading range of 1.2770 to 1.2725 level. Most of the buying trend was triggered amid stronger Sterling and weakness in the U.S. dollar. The Cable has formed an upward channel on the hourly chart that may support the pair at 1.2827 level along with a resistance level of 1.2909 level. Bullish crossover of 1.2900 level can open up further buying room until 1.2998 level today. Let’s consider taking buying trades over 1.2827 level today. 


USD/JPY – Daily Analysis

The USD/JPY pair was closed at 105.436 after placing a high of 105.802 and a low of 105.400. The USD/JPY pair broke its 7-days bullish streak on Wednesday and declined on Wednesday to its lowest level at 105.400. The USD/JPY pair managed to post losses on Wednesday despite the strong macroeconomic data releases from the U.S. 

On the data front, at 04:50 GMT, the Prelim Industrial Production from the United States in August rose to 1.7% from the forecasted 1.5% and supported the Japanese yen that ultimately weighed on the USD/JPY currency pair. The Retail Sales from Japan came in as -1.9% against the forecasted -3.2% and supported the Japanese Yen that exerted weighed on the USD/JPY pair. The Housing Starts for the year came in as -9.1% against the forecasted -10.0% and supported the Japanese Yen. The strong macroeconomic data from Japan pushed the Japanese Yen higher against the U.S. dollar and weighed on the USD/JPY pair.

On Wednesday, the U.S. Dollar Index (DXY) remained flat at 93.92 level but posted monthly gains in September by 2% and losses for the 3rd quarter by 3.5%. The steady U.S. dollar was due to the un-decisive presidential debate. Both candidates Donald Trump and Joe Biden took part in the first of third presidential debate on Tuesday and discussed issues like the coronavirus pandemic, Trump’s leadership, and the U.S. economy along with taxes. However, the debate failed to provide clues about the results of upcoming elections and weighed on the U.S. dollar that dragged the USD/JPY pair’s prices.

Moreover, the renewed hopes about the Stimulus package came under headlines after Steven Mnuchin said that the White House would hold talks with Democrats over the stimulus issue. Meanwhile, the Governor of Federal Reserve, Michelle Bowman, said that economic recovery from the pandemic crisis was bumpy because of the high rate of unemployment and persisting need for support from fiscal and monetary departments of the U.S.   

The President of Federal Reserve Bank of Minneapolis, Neel Kashkari, also called the U.S. economic recovery as grinding and told the lawmakers that it would remain the same unless a dramatic change or sooner than expected breakthrough in vaccine development. He said that to smooth the economic recovery of the world’s largest economy, a dramatic policy change was needed. The above comments from Fed officials also had a role in the downward movement of the USD/JPY pair on Wednesday.

Daily Technical Levels

Support Resistance

105.41      105.82

105.17      105.99

105.00      106.23

Pivot point: 105.58


USD/JPY – Trading Tips

The technical side of the safe-haven pair USD/JPY continues to be steady as it’s consolidating with a bullish bias to trade at 105.460 level, and the series for EMA is now extending at 105.750 level. On the lower side, the support holds at 105.300 level. The MACD also supports the bullish bias amid a stronger U.S. dollar and diminished safe-haven appeal. A bullish crossover of the 105.750 is likely to lead the USD/JPY price towards the next resistance level of 106.250. As we can see, the 50 periods EMA is also in support of buying; therefore, we should look for buying trades in the USD/JPY pair. However, bearish trend continuation and violation of the 105.300 level can open further room for selling until 104.900. Good luck! 


Categories
Forex Market Analysis

Daily F.X. Analysis, September 30 – Top Trade Setups In Forex – ECB President Lagarde Speaks Ahead! 

The eyes will remain on the German Prelim CPI and Spanish CPI figures during the European session on the news front. At the same time, the C.B. Consumer Confidence and series of FOMC member’s speeches are likely to remain in the highlights today. Economists are expecting C.B. Consumer Confidence to perform better than before. Therefore the U.S. dollar can trade with a bullish bias today.

Economic Events to Watch Today  


EUR/USD – Daily Analysis

The EUR/USD pair was closed at 1.17416 after placing a high of 1.17452 and a low of 1.16569. Overall the movement of the EUR/USD pair remained bullish throughout the day. On Tuesday, the EUR/USD pair surged and recovered most of its previous 3-4 days losses on the back of broad-based U.S. dollar weakness and rising risk sentiment in the market. The U.S. dollar came under fresh pressure ahead of the U.S. first Presidential debate and provided great support to its rival currency Euro on Tuesday.

The dovish comments from the ECB president and the weakness of its rival currency U.S. dollar improved the market’s risk sentiment ahead of the U.S. presidential debate and supported the riskier EUR/USD currency pair on Tuesday.

On the data front, The German Prelim Consumer Price Index (CPI) for September dropped to -0.2% from the projected -0.1% and weighed on single currency Euro. At 12:00 GMT, the Spanish Flash CPI for the year remained flat with the projected -0.4%. The data from Europe had an almost null impact on EUR/USD pair because traders’ focus was solely on the U.S. dollar weakness amid the rising hopes of next U.S. stimulus measures.

From the U.S. side, at 17:30 GMT, the Goods Trade Balance for August dropped to -82.9B from the expected -81.8B and weighed on the U.S. dollar. In August, the Prelim Wholesale Inventories rose to 0.5% from the forecasted -0.1% and weighed on the U.S. dollar. The weak U.S. dollar added further support to the rising EUR/USD prices. The greenback was further declined after the dovish comments from Fed officials on Tuesday and the U.S. stimulus package’s rising hopes.

The U.S. Treasury Secretary Steven Mnuchin and the House Speaker Nancy Pelosi have said that the next round of coronavirus aid packages will be delivered soon. Both parties held a meeting on Monday and were optimistic that a deal between Republicans & Democrats was highly possible on the $2.2Tpackage.

These rising optimism added to the risk sentiment and provided strength to the Euro currency against the U.S. dollar. The U.S. Dollar Index was already under pressure and was testing the critical support zone near 93.40 level on Tuesday, and Euro’s regained strength pushed it even on the downside. Meanwhile, the latest move from ECB’s President Christine Lagarde over the next round of stimulus package from the European government to refrain from mentioning anything about it and saying that the bank was ready to act as need, also supported the risk sentiment and rising EUR/USD prices.

Lagarde said that coronavirus’s impact across Europe was still intact as people were continuously losing their jobs, and the prospects for the future were still uncertain. She said that economic activity in the third quarter was rebounded, but the recovery was still incomplete, uneven, and uncertain. These dovish comments kept weighing the local currency.

However, the main driver of EUR/USD’s latest surge was the weak U.S. dollar because the Euro was facing an all-time pressure of rising coronavirus cases in the region. As the coronavirus infections rose in European nations, the need for stimulus also increase and exerted downside pressure on the Euro currency. These lingering fears that the second wave of coronavirus pandemic could cause a lasting impact on the European economy kept the gains in the EUR/USD pair limited on Tuesday. As for the U.S. dollar weakness, it is expected to remain until the U.S. Presidential debate between Joe Biden and Donald Trump that will start late at night in the U.S.

Daily Technical Levels

Support Resistance

1.1625      1.1689

1.1588      1.1716

1.1561      1.1754

Pivot point: 1.1652

EUR/USD– Trading Tip

The EUR/USD is trading at 1.1722 level, facing immediate resistance at 1.1760 level that marks a double top pattern for the EUR/USD. The bullish crossover of 1.1760 level can open further room for buying until the 1.1807 area, while the bearish trend continuation below 1.1685 level may lead the EUR/USD price towards 1.1654 and 1.1627 level today. Let’s consider taking buying trades over 1.1650 today.

GBP/USD – Daily Analysis

The GBP/USD closed at 1.28527 after placing a high of 1.29027 and a low of 1.28225. Overall the movement of the GBP/USD pair remained bullish throughout the day. The GBP/USD pair extended its bullish streak for the 5th consecutive day on Tuesday. The gains in the GBP/USD pair were due to the broad-based U.S. dollar weakness. The Brexit talks were resumed on Tuesday that also helped GBP/USD pair to gain some traction. However, the gains in currency air were limited as the United Kingdom was facing a strong wave of coronavirus pandemic. The dovish comments from Bank of England’s president also capped further upside in the GBP/USD pair.

The greenback was weak across the board ahead of the first U.S. presidential debate between U.S. President Donald Trump and Former U.S. President Joe Biden that will begin late in the U.S. on Tuesday. The renewed hopes that the U.S. will announce the next round of coronavirus aid package soon after White House Speaker Nancy Pelosi said that she hoped that Democrats and Republicans would reach a consensus on the stimulus package soon.

Apart from U.S. dollar weakness, the positive data from Great Britain also helped GBP/USD pair’s gains on Tuesday. The Mortgage Approvals from the U.K. hit their highest since October 2007 on Tuesday and reached 85K against the forecasted 72K in August and supported British Pound. Meanwhile, at 13:30 GMT, the Net Lending to Individuals dropped to 3.4B from the expected 5.2B and weighed on Pound. The unexpected rise in Mortgage Approvals in the U.K. added further support to the rising GBP/USD pair on Tuesday.

Furthermore, the Final round of Brexit talks between the U.K. and E.U. resumed on Tuesday despite the British Prime Minister Boris Johnsons attempt to undermine the Brexit withdrawal agreement by proceeding with an internal market bill. The negotiations mean that the Brexit deal was still on the table and could be reached, and this renewed Brexit deal hopes they supported the GBP/USD gains on the day.

Whereas, the gains were capped by many factors, including the ongoing strong wave of coronavirus pandemic in Great Britain. PM Johnson has already imposed many restrictions, including a new bill of six-people gathering and closing pubs, bars, and theaters before 10 pm, and the situation regarding pandemic is not settling.

Further restrictions would hurt the economic recovery and lead the central bank to look into negative interest rates. The latest comments made by the governor of Bank of England, Andrew Bailey, have increased the market’s fears. He said that BoE was not out of ammunition to fight with the pandemic crisis. He added that negative interest rates were not ruled out, but they were realistic options in a challenging environment. These dovish comments from the Bank of England governor weighed on local currency GBP and forced GBP/USD pair to lose some of its earlier daily gains.

On the U.S. front, the macroeconomic data was mixed and failed to provide a significant pair movement. Whereas, the U.S. Dollar Index saw fresh pressure and fell to 93.4 level ahead of the U.S. Presidential debate. This kept supporting the upward trend of GBP/USD throughout the day.

Daily Technical Levels

Support Resistance

1.2698      1.2791

1.2647      1.2833

1.2605      1.2884

Pivot point: 1.2740

GBP/USD– Trading Tip

The GBP/USD is trading with a bullish bias at 1.2875 level, having violated the sideways trading range of 1.2770 to 1.2725 level. Most of the buying trend was triggered amid stronger Sterling and weakness in the U.S. dollar. The Cable has formed an upward channel on the hourly chart that may support the pair at 1.2827 level along with a resistance level of 1.2909 level. Bullish crossover of 1.2900 level can open up further buying room until 1.2998 level today. Let’s consider taking buying trades over 1.2827 level today. 


USD/JPY – Daily Analysis

The USD/JPY pair was closed at 105.677 after placing a high of 105.733 and a low of 105.340. Overall the movement of the USD/JPY pair remained bullish throughout the day. The USD/JPY pair continued its bullish streak for the 7th consecutive day on Tuesday despite the broad-based U.S. dollar weakness across the board ahead of the Presidential debate on the day. The rally in the USD/JPY pair could be attributed to the improved risk sentiment in the market as the U.S. stimulus measure’s hopes increased.

Furthermore, the gains in the USD/JPY pair could also be attributed to the unexpected rise in the Consumer Confidence from the U.S. and the statements made by Fed officials.

The CEO of the New York Federal Reserve, John C. Williams, said that full employment and growth in the labor sector was needed to recover from the pandemic induced recession. He also added that the recession was more robust than it was expected, and it would almost need 3-years to go back to pre-pandemic levels. The President of Philadelphia Federal Reserve, Patrick Harker, said that as long as the vaccine is not approved, the economic recovery depends on the mask’s usage to control the spread of the virus. He said that even if the spread of the virus were slow down, the recovery would still need the employment figures to reach the fullest and this could only be possible if people would feel safe to go to their work and that is why the usage of masks eve in indoor holds an important part in economic recovery.

Harker also said that a renewed aid package was essential for coronavirus-affected individuals and unemployed people, and small businesses. He also proposed that a $1Trillion package in aid would be needed to help the falling U.S. economy. On the other hand, the Vice Chairman of the Federal Reserve, Richard Clarida, said that Fed would not increase interest rates until the employment reached its full level, and the inflation target is met or surpassed the 2% level. According to the Fed, the inflation target could be met in 2023, not before that, and it means the interest rates will remain at the lowest level for more than three years. This weighed on the greenback but failed to reverse the USD/JPY pair’s movement.

Furthermore, the U.S. Treasury Secretary Steven Mnuchin and House Speaker Nancy Pelosi said that they were hopeful that a deal would be reached between Republicans & Democrats over the $2.2Trillion package. These optimistic hopes raised the market’s risk sentiment that weighed on the safe-haven Japanese Yen and supported the upward momentum of the USD/JPY pair.

On the data front, the Tokyo Core Consumer Price Index for the year came in as -0.2% against the forecasted -0.3% and supported the Japanese Yen. While at 17:30 GMT, the Goods Trade Balance from the U.S. dropped to -82.9B from the forecasted -81.8B and weighed on the U.S. dollar. In August, the Prelim Wholesale Inventories rose to 0.5% from the forecasted -0.3% and weighed on the U.S. dollar. At 18:00 GMT, the S&/CS Composite-20 HPI for the year from the U.S. rose to 3.9% from the projected 3.6^ and supported the U.S. dollar that added further strength to the USD/JPY pair on Tuesday. At 19:00 GMT, the C.B. Consumer Confidence rose to 101.8 points against the forecasted 90.0 points and supported the U.S. dollar that ultimately pushed the USD.JPY pair on the upside. Market traders are keenly awaiting the Presidential debate to find fresh clues about the election results that would highly impact the local currency U.S. dollar.

Daily Technical Levels

Support    Resistance

105.41      105.82

105.17      105.99

105.00      106.23

Pivot point: 105.58


USD/JPY – Trading Tips

The technical side of the safe-haven pair USD/JPY continues to be steady as it’s consolidating with a bullish bias to trade at 105.460 level, and the series for EMA is now extending at 105.750 level. On the lower side, the support holds at 105.300 level. The MACD also supports the bullish bias amid a stronger U.S. dollar and diminished safe-haven appeal. A bullish crossover of the 105.750 is likely to lead the USD/JPY price towards the next resistance level of 106.250. As we can see, the 50 periods EMA is also in support of buying; therefore, we should look for buying trades in the USD/JPY pair. However, bearish trend continuation and violation of the 105.300 level can open further room for selling until 104.900. Good luck! 


Categories
Crypto Market Analysis

Daily Crypto Review, Sept 30 – Goldman Sachs Entering the Crypto Sector; Bitcoin Prepares for a Move

The cryptocurrency sector has stayed at virtually the same spot since our last report. Bitcoin is currently trading for $10,688, representing a decrease of 0.07% on the day. Meanwhile, Ethereum gained 0.18% on the day, while XRP lost 0.95%.

 Daily Crypto Sector Heat Map

If we look at the top100 cryptocurrencies and their gains and losses, The Midas Touch Gold gained 21.5% on the day, making it the most prominent daily gainer. Zilliqa (14.64%) and Energy Web Token (11.71%) also did great. On the other hand, DeFi projects took a hit as UMA lost 10.9%, making it the most prominent daily loser. It is followed by yearn.finance’s loss of 7.8% and OMG Network’s loss of 6.4%.

Top 10 24-hour Performers (Click to enlarge)

Bottom 10 24-hour Performers (Click to enlarge)

Bitcoin’s level of market dominance stayed at the same spot since our last report, with its value currently being at 60.48%. This value represents a 0.02% difference to the upside when compared to when we last reported.

Daily Crypto Market Cap Chart

The crypto sector capitalization has gained in value over the course of the past 24 hours. Its current value is $344.44 billion, which represents an increase of $0.55 billion when compared to our previous report.

_______________________________________________________________________

What happened in the past 24 hours?

_______________________________________________________________________

_______________________________________________________________________

Technical analysis

_______________________________________________________________________

Bitcoin

While it seems that Bitcoin is having quite a slow day, that is not exactly the case. Even though its price has not changed much since our last report, the largest cryptocurrency by market cap is fighting to stay above the triangle formation it has recently passed. If it manages to confirm its position above the triangle (and then 38.2% Fib retracement level), Bitcoin will set itself up to rush towards (and past) $11,000.

BTC/USD 1-day Chart

If we zoom in to the 4-hour chart, we can see that Bitcoin is right on the verge of going back under is level, but has held up nicely so far. Trading is quite simple at the moment, as Bitcoin is not making any sudden moves either towards the upside or downside.

BTC/USD 4-hour Chart

Bitcoin’s short-term technicals are tilted towards the sell-side and will be tilted in that direction until Bitcoin confirms its position above the 38.2% Fib retracement. However, its daily overview is slightly bullish, while its weekly and monthly overviews are extremely bullish.

BTC/USD 4-hour Technicals

Technical factors (4-hour Chart):
  • Price is slightly above its 50-period EMA and below its 21-period EMA
  • Price is right below its middle Bollinger band
  • RSI is neutral (48.90)
  • Volume is average
Key levels to the upside          Key levels to the downside

1: $10,850                                 1: $10,630

2: $11,000                                 2: $10,500

3: $11,090                                  3: $10,015

Ethereum

Ethereum has been pretty stable in the past 24 hours. Its price has been making higher highs and higher lows ever since Sept 24, until now. The trend has (seemingly) stopped, with Ethereum being stopped out by the $360 resistance level. While this makes Ethereum’s outlook slightly more bearish, in reality, this doesn’t change much as Ethereum Option traders have already made a prediction of ETH trading between $340 and $360 by the end of Oct.

ETH/USD 4-hour Chart

While Ethereum’s 4-hour and 1-day technicals are now tilted towards the sell-side, its longer-term overview is extremely bullish. If we take a look at its weekly or monthly technicals, the sentiment is heavily tilted towards the buy-side.

ETH/USD 4-hour Technicals

Technical Factors (4-hour Chart):
  • The price is at its 50-period and its 21-period EMA
  • The price is at its middle Bollinger band
  • RSI is neutral (50.89)
  • Volume is below average
Key levels to the upside          Key levels to the downside

1: $360                                     1: $340

2: $371                                     2: $300

3: $400                                      3: $289

Ripple

XRP has, after four days of trying, failed to break the $0.2454 resistance level. Its price has fallen off a bit since the last attempt, currently trading at around $0.24. We can also see that XRP has moved below its 50-period moving average, which may cause a further descent towards $0.235.

XRP/USD 4-hour Chart

XRP technicals are quite confusing. While its 4-hour outlook is mixed, its daily outlook is heavily tilted towards the sell-side. On the other hand, its weekly outlook is bullish, while its monthly outlook is, once again, bearish.

XRP/USD 4-hour Technicals

Technical factors (4-hour Chart):
  • The price is below both its 50-period EMA and its 21-period EMA
  • Price is slightly below its middle Bollinger band
  • RSI is neutral (48.16)
  • Volume is stable and average
Key levels to the upside          Key levels to the downside

1: $0.2454                                 1: $0.235 

2: $0.266                                   2: $0.227

3: $0.27                                    3: $0.221


Categories
Forex Signals

GBP/JPY Succeeded to extend Bullish Bias Amid Faded Haven Appeal!
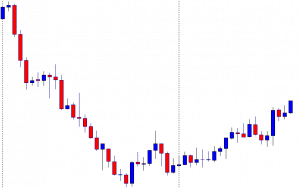
Today in the European trading session, the GBP/JPY currency pair successfully extended its previous session bullish trading moves and hit the two-weeks high around 135.70 marks mainly due to the on-going Brexit optimism, which eventually underpinned the Brtish Pound and contributed to the currency pair gains. Apart from this, the currency pair got an additional boost after the Bank of England (BoE) policymaker reduced the possibility of negative interest rates in the short-term, which also benefitted the British Pound and extended further support to the currency pair.

Let me remind you that the combination of factors helped the currency catch some aggressive bids on the 2nd-day of a new trading week and build on last week’s modest bounce from the lowest level since early July 133.00 marks. Across the pond, the strong rally in the equity markets, backed by the combination of factors, undermined the safe-haven Japanese yen and gave a further boost to the GBP/JPY currency pair.

Despite concerns about the coronavirus cases in some notable nations and worsening US-China relations, the investors continued to cheer the hopes of the US fiscal stimulus package triggered by reports suggesting that the US Democrats’ showed a willingness to alter previous proposals while saying that the deadlock over the much-awaited stimulus talks seems to break anytime. This, in turn, boosted the market trading sentiment and extended support to the currency pair.

Moreover, the upbeat market sentiment was being supported by optimism over the coronavirus vaccine, which came after the US pharmaceutical giant Johnson and Johnson Inc COVID-19 vaccine trial has shown a strong immune response to the coronavirus with a single dose in the early trial stages.

The UK and EU are ready to resume the 9th and final phases of Brexit talks on the day across the pond. Reports suggest that negotiators will start the process to finalize a deal by the end of this week to hammer out an agreement in time for the next EU summit in mid-October. However, the hopes of a Brexit deal were further fueled after the EU steps back from warnings to leave trade and security talks, shows a willingness to prepare a joint legal agreement. (WAB). This, in turn, boosted the sentiment around the British Pound and extended further support to the currency pair.

Looking forward, the market traders will keep their eyes on headlines concerning Brexit, pandemic, and the US Presidential Election, which may offer important clues on the day. It’s worth mentioning that the 1st-round of the US President Election debate is expected to use American President Donald Trump’s tax payments as a fresh obstacle, which may push the US dollar down.


The GBP/JPY pair has formed bullish engulfing candles on the 4-hour timeframe, suggesting a bullish bias around 135.150. The recent bullish crossover of 135.100 levels is likely to lead the GBP/JPY price towards 136.400 levels. On the further higher side, the bullish crossover of 136.400 level will make our forex trading signal more secure, and it can lead GBP/JPY price towards 139.900 level. Check out a trading plan below…

Entry Price – Buy 136.056
Stop Loss – 135.656
Take Profit – 136.456
Risk to Reward – 1:1
Profit & Loss Per Standard Lot = -$400/ +$400
Profit & Loss Per Micro Lot = -$40/ +$40
Fellas, now you can check out forex trading signals via Forex Academy mobile app. Follow the links below.
iPhone Users: https://apps.apple.com/es/app/fasignals/id1521281368
Andriod Users: https://play.google.com/store/apps/details?id=academy.forex.thesignal&hl=en_US

Categories
Forex Signals

USD/CHF Extended Previous Session Losing Streak – Signal Update! 
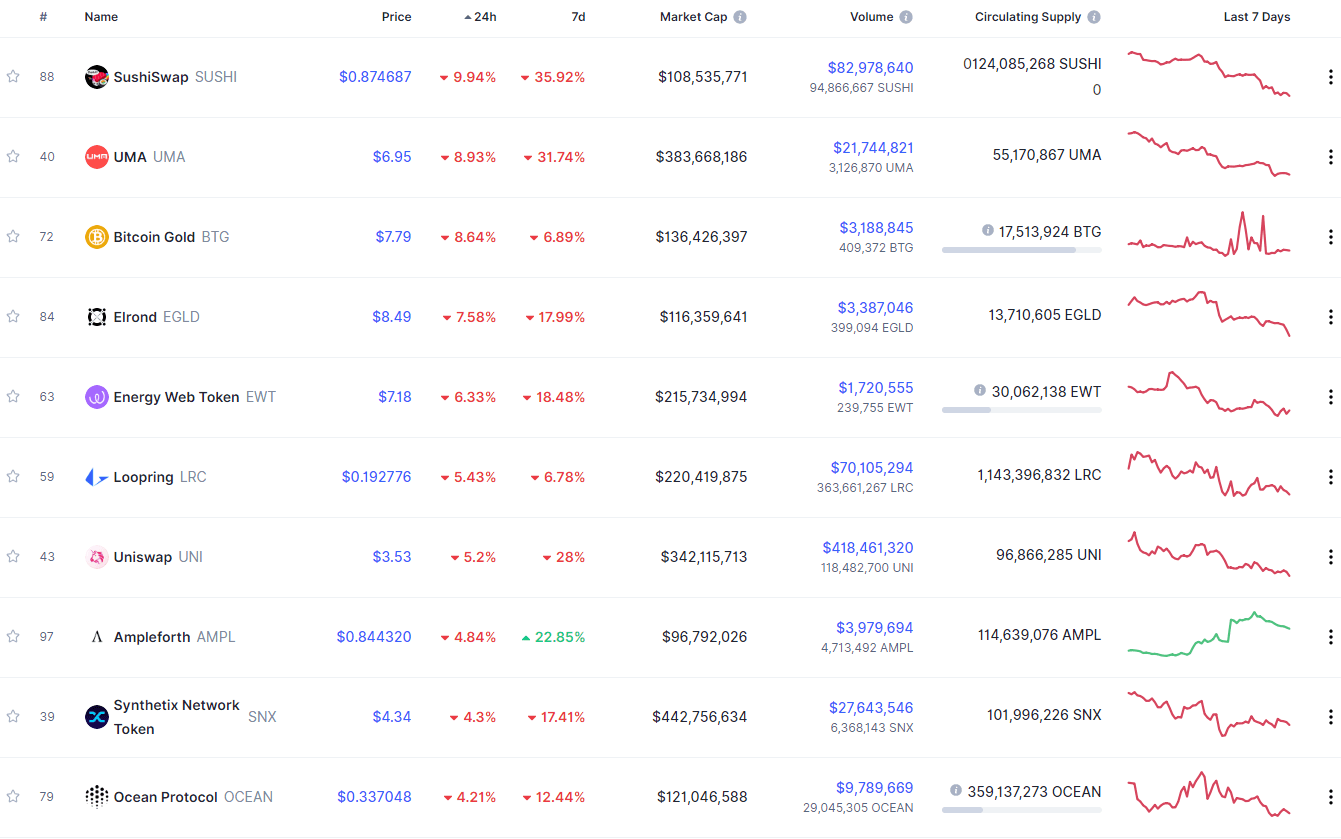
During Tuesday’s early European trading session, the USD/CHF currency pair failed to stop its Asian session bearish bias and dropped further near 0.9223 level, mainly due to the broad-based U.S. dollar selling bias, triggered by the cautious mood of traders ahead of the U.S. presidential debate. Moreover, the upbeat market sentiment, backed by the positive coronavirus (COVID-19) vaccine news, also weighed on the safe-haven U.S. dollar, which keeps the currency pair under pressure. Currently, the USD/JPY currency pair is currently trading at 0.9224 and consolidating in the range between 0.9222 – 0.9252.

However, the market trading sentiment extended its Monday’s upbeat performance and continue to flash d green during the European session on the day. The market was being supported by the risk-positive headlines from America and the European Union (E.U.). Moreover, the coronavirus (COVID-19) vaccine’s hopes also kept the bulls hopeful on the day. It is worth mentioning that the U.S. pharmaceutical giant Johnson and Johnson Inc COVID-19 vaccine trials earlier showed a robust immune response to the coronavirus with a single dose in the early trial stages. This, in turn, boosted market trading sentiment and dragged the currency pair down by undermining the safe-haven U.S. dollar.

On the other hand, the U.S. Democrats showed a willingness to alter previous proposals, while saying that the deadlock over the much-awaited stimulus talks seems to break anytime. Meanwhile, the U.S. House Speaker Nancy Pelosi recently said that we have made critical additions and reduce the bill’s cost by shortening the time covered for now. This eventually boosted the hopes of the much-awaited coronavirus (COVID-19) stimulus package, which keeps the market trading sentiment positive and helps the currency pair limit its deeper losses by undermining the safe-haven Swiss Franc.


Despite the hopes of further stimulus., the broad-based U.S. dollar still flashing red during the European session amid market risk-on sentiment. On the other hand, traders’ cautious mood ahead of Tuesday’s U.S. presidential election debate between President Donald Trump and Democratic candidate Joe Biden also weighed on the U.S. dollar. Although, the gains in the U.S. dollar keep the currency pair down. Looking ahead, the market traders will keep their focus on headlines concerning Brexit, pandemic, and the U.S. Presidential Election, which may offer important clues. It’s worth mentioning that the 1st-round of the U.S. President Election debate is expected to use American President Donald Trump’s tax payments as a fresh obstacle, which may push the U.S. dollar down. 

Daily Support and Resistance

S1 0.9038

S2 0.9109

S3 0.9154

Pivot Point 0.9181

R1 0.9225

R2 0.9252

R3 0.9323

The USD/CHF pair entered the overbought zone during the Asian session but soon started forming a bearish setup below a strong resistance level of 0.9295 level. The closing of the candle below 0.9295 level has driven strong selling until the 0.0222 level. An upward trendline is likely to support the USD/CHF pair at 0.9211 level, and if it closes over 0.9211 level, we may have a bullish reversal. Check out a trading plan below…

Entry Price – Sell 0.92306

Stop Loss – 0.92706

Take Profit – 0.91906

Risk to Reward – 1:1

Profit & Loss Per Standard Lot = -$400/ +$400

Profit & Loss Per Micro Lot = -$40/ +$40

Fellas, now you can check out forex trading signals via Forex Academy mobile app. Follow the links below.

iPhone Users: https://apps.apple.com/es/app/fasignals/id1521281368

Andriod Users: https://play.google.com/store/apps/details?id=academy.forex.thesignal&hl=en_US

Categories
Forex Signals

EUR/JPY Violates Descending Triangle Pattern – Who’s Up for Buying?

Today in the early European trading session, the EUR/JPY stretched its previous session bullish trend and took further bids around an intraday top closer to 123.240, mainly due to the risk-on market sentiment. The faded safe-haven appeal was backed by the on-going optimism over treatment for the highly infectious coronavirus. Therefore, the demand for Japanese yen fell compared to the single currency Euro and we noticed an upward movement in the EUR/JPY currency pair.

A day before, the EUR/USD pair’s gains were limited after the speech of European Central Bank’s President, Christine Lagarde. She made fresh comments on the coronavirus pandemic threat and said that despite the rebounded economic activity in Eurozone, the recovery remains incomplete, uncertain, and uneven. She added that consumer spending has resumed, but they are still cautious about their jobs and income prospects, so the spending is behind its margin. Similarly, the business investment has picked up, but the weak demand and pertaining uncertainty have weighed on the investment plans.

The market trading sentiment recently got the lift from the hints of further money flow from the US and Europe. These developments were supported by the US House Speaker Nancy Pelosi’s optimism towards the COVID-19 aid package discussion. Apart from this, the European Central Bank (ECB) President Christine Lagarde repeated that the Governing Council, “continues to stand ready to adjust all of its instruments, as appropriate” Thi, in turn, boosted the market trading sentiment.

The US-China picked up further pace after the headline from the South China Morning Post (SCMP), published Tuesday’s early Asian session, suggests further hardships for the Sino-American trade deal. However, the news relies on China’s imports of the US goods under the trade agreement between Washington and China, which keeps challenging the upbeat market tone and cap further upside momentum for the currency pair.


The EUR/JPY pair is trading with a bullish bias at 123.400 level, having violated a descending triangle pattern on the four hourly charts. The triangle pattern was extending resistance at 122.850 level, and bullish crossover and formation of a bullish engulfing pattern may drive further buying until the next resistance area of 124.088 level. The leading technical indicators such as RSI and MACD also show bullish crossover, supporting bullish bias in the market. At the same time, the 50 EMA is also in support of the buying trend. Checkout a trading plan below…

Entry Price – Buy 123.288
Stop Loss – 123.292
Take Profit – 123.688
Risk to Reward – 1:1
Profit & Loss Per Standard Lot = -$400/ +$400
Profit & Loss Per Micro Lot = -$40/ +$40
Fellas, now you can check out forex trading signals via Forex Academy mobile app. Follow the links below.
iPhone Users: https://apps.apple.com/es/app/fasignals/id1521281368
Andriod Users: https://play.google.com/store/apps/details?id=academy.forex.thesignal&hl=en_US

Categories
Forex Signals

AUD/JPY Heading North to Complete 50% Fibonacci Retracement! 

Today in the early European trading session, the AUD/JPY extended its previous session bullish trend and took further bids around an intraday top closer to 75.10 level, mainly due to the risk-on market sentiment, backed by the on-going optimism over treatment for the highly infectious coronavirus. 

Moreover, the renewed hopes over the U.S. COVID-19 aid package also boosted the market risk tone, underpinning the Australian dollar’s perceived risk currency and contributed to the currency pair gains. Apart from this, the broad-based U.S. dollar selling bias, triggered by the combination of factors, also played its major role in supporting the currency pair. Besides this, the currency pair got an extra boost mainly after the analysts at Citigroup downplayed the possibilities of negative interest rates, which gave further support to the Aussie dollar and contributed to the currency par gains. 

On the contrary, the renewed tension between the US-China over the trade deal keeps challenging the upbeat market mood and becomes the key factor that keeps the lid on any additional currency pair gains. 


The AUD/JPY pair is trading with a bullish bias at 75.45 level on the technical front. Bullish crossover of 75 levels has opened further room for buying until 75.42 level. The closing of the bullish engulfing pattern may drive sharp buying in the AUD/JPY pair; therefore, we have opened a buy trade to target quick 40 pips. Check out a trading plan below… 

Entry Price – Buy 74.892

Stop Loss – 74.92

Take Profit – 75.292

Risk to Reward – 1:1

Profit & Loss Per Standard Lot = -$400/ +$400

Profit & Loss Per Micro Lot = -$40/ +$40

Fellas, now you can check out forex trading signals via Forex Academy mobile app. Follow the links below.

iPhone Users: https://apps.apple.com/es/app/fasignals/id1521281368

Andriod Users: https://play.google.com/store/apps/details?id=academy.forex.thesignal&hl=en_US

Categories
Forex Course

147. How To Detect A Fakeout like a professional Forex trader?

Introduction

It is a general perception among Forex traders that the fakeouts are caused by the banks and large institutional players to stop retail traders players from moving the market in their desired directions. Although there is no evidence to prove this theory, we believe it is true. The manipulation is done by the big players. A fakeout is simply a failed breakout, and most of the time, they occur at significant areas like support, resistance, trend lines, Fibonacci retracement levels, and chart patterns, etc.

Typically, fakeouts are the result of a battle between both the parties on the price chart. So if you are witnessing a range and if we see both the parties printing aggressive candles, we can expect more fakeouts. The same applies to the trending markets as well. The aggressive battle between the buyers and sellers for domination leads to frequent fakeouts.

Trading Fakeouts

It is a common perception that it is impossible to trade these fakeouts, but that is not true. We can trade fakeouts, but a lot of market understanding is required to do so.

#1 Strategy 

The image below indicates a fakeout followed by an actual breakout in the EUR/GBP Forex pair.

As we can see below, when the price breaks above the breakout line, it started to hold there. If it didn’t hold, it means that the price goes above and came back into the range. So in our case, hold above the breakout line confirms that the price is not going to fake out, and riding the buy trade from here will be a good idea.

#2 Strategy 
Buy Example

The image below indicates a false breakout in this Forex pair.

As you can see below, we choose to enter a buy trade after the price action fakes below the major support area. We can see that it is eventually coming back and holding at the support area. This holding support clarifies that the sellers failed to move the market.

Now buyers are coming back and holding the market to go for a brand new higher high. We can see that price action respecting the trendline for a while, but then it breaks above the line, printing a brand new higher high.

Sell Example

The image below indicates the appearance of a faker on the EURGBP sixty-minute chart.

The image below represents our entry, exit, and stop-loss in this Forex pair. The pair was in an uptrend, and as it tries to go above the resistance line, it immediately came back and stated holding below the resistance line. This confirms the faker, and after our entry, prices go back to the most recent lower low.

That’s about identifying Fakeouts and how to trade them. Please be sure to trade these fakeouts only when you are absolutely sure about them. All the best.

Categories
Forex Basic Strategies

Trading Forex Majors and Crosses Using The ‘Awesome’ Strategy

Introduction

The Bollinger Bands is a technical analysis tool that uses a statistical measure of the standard deviation to establish levels of highs and lows in a trend. The upper band shows a level that is statistically high, and the lower band shows a statistically low level. The width correlates to the volatility of the market. This means, in volatile markets, Bollinger bands widen while in less volatile markets, the bands narrow.

In today’s strategy, we utilize this feature of the Bollinger band to anticipate a reversal in the market. But Bollinger bands alone are not sufficient in generating reliable signals. Along with the Bollinger bands, we use the Awesome Oscillator to confirm the reversal of a trend. Let us understand how both indicators can be combined to generate reversal signals.

Time Frame

Time frames suitable for trading this strategy are 1 minute, 5 minutes, and 15 minutes. Therefore, this a perfect strategy for ‘Scalpers.’

Indicators

Three indicators are applied to the chart listed below.

  • Bollinger bands (20,2)
  • Bill Williams’ Awesome Indicator
  • Exponential Moving Average (EMA)

Currency Pairs

The ‘Awesome’ strategy should ideally be traded with major forex currency pairs only. Liquidity and volatility are especially necessary for the strategy to work at its best, which is provided only by major pairs. Some preferred ones are EUR/USD, USD/JPY, AUD/USD, GBP/USD, GBP/JPY, EUR/JPY, CAD/JPY, and NZD/USD.

Strategy Concept

Apart from the Bollinger band, we use the awesome oscillator indicator that attempts to gauge whether bearish or bullish forces are driving the market. It market momentum indicator, which compares recent market movements to historical movements. It uses a line in the center, either side of which price movements are plotted according to a comparison between two different moving averages. We use this awesome oscillator to forecast a shift in market momentum and whether the prevailing trend will continue or reverse.

We look for ‘buy’ opportunities when EMA crosses up through the middle Bollinger band. At the same time, the Awesome Oscillator should be crossing above the zero levels. This is the first part of the reversal. We execute a ‘long’ trade at the ‘test’ of the previous ‘lower high’ that is a part of the earlier trend.

For ‘sell’ trades, we are looking for the opposite conditions of buy trades. The first condition being that the EMA crosses below the middle Bollinger band. At the same time, Awesome Oscillator also crosses below the zero-line. Finally, we enter at the ‘test’ of the ‘higher low’ of the previous trend.

A stop-loss a placed below the lowest point of the downtrend in an upward reversal while it will be above the highest point of the uptrend in a downward reversal.

Trade Setup

In order to execute the strategy, we have considered the 5-minute chart of AUD/USD, where we will be illustrating a ‘long’ trade. Here are the steps to execute the strategy.

Step 1: The first step is to identify the direction of the market. We can do this in two ways. If the price is making higher highs and higher lows, the market is said to be in an uptrend. While if the price is making lower lows and lower highs, the market is in a downtrend. The trend becomes clearer when price moves in a channel and plot the same on the chart.

In the case of AUD/USD, we have identified a downward channel, as shown in the below image.

Step 2: After identifying the direction, we need to wait for a reversal in the market. We can say that a reversal is taking place in the market when price breaks the trendline and starts moving in the same direction. Trendline break is not enough. Here’s where the indicators Bollinger band, EMA, and Awesome Oscillator come handy.

In case of a downtrend, the reversal is confirmed when EMA crosses above the middle line of the Bollinger band, and the Awesome Oscillator moves from negative to positive zone. While in an uptrend, the reversal is confirmed when EMA crosses below the middle line of the Bollinger band and Awesome Oscillator goes below the ‘zero’ level. However, we do not enter the market soon after this, where we need one last thing before that.

The below image shows that when the price is not able to make another ‘lower low,’ it reverses to the upside and breaks out of the channel. At the same, price EMA crosses above the middle line of BB, and Awesome Oscillator becomes ‘positive.’

Step 3: Now, let us discuss how to enter a trade. In a downtrend reversal, we enter the market for a ‘buy’ when the price tests the ‘lower high’ of the earlier trend and puts up a bullish candle. This is when we enter with an appropriate stop-loss and take-profit. Similarly, in an uptrend reversal, we enter for a ‘sell’ when price tests the ‘higher low’ of the previous trend and puts up a bearish candle.

As shown in the below image, we enter ‘long’ only when the price reacts from the ‘lower high’ of the previous downtrend and moves higher.

Step 4: Lastly, we determine the stop-loss and take-profit levels for the strategy. In a ‘buy’ trade, the stop-loss is placed below the lowest point of the previous trend, nothing but the lower low. While in a ‘short’ trade, it is placed at the highest point of the previous trend, nothing but the higher high. The take-profit is set in a manner where the risk-to-reward of the trade is at least 1:1. But since we are trying to grab a major reversal of the market, we move our stop-loss to break even once the market gets closer to the take-profit area.

Strategy Roundup

While it can get take a lot of effort to apply all the rules of strategy, it gets easier after little practice. Pay attention to the Awesome Oscillator, where it clearly indicates the shift in momentum in the market. Aggressive traders can also enter the market without waiting for additional confirmation from the ‘lower high’ or ‘higher low.’ All the best.

Categories
Forex Daily Topic Forex Price Action

Count the Breakout Length

In today’s lesson, we are going to demonstrate an example of a chart where the price makes an H4 breakout at the last week’s low. However, the chart does not offer entries. It rather gets choppy. We will try to find out the reason behind that. Let us get started.

It is an H4 chart. The chart shows that the price makes a bearish move and had a bullish correction. Upon producing a bearish engulfing candle, it heads towards the South again. The market is about to close for the weekend, and the sellers are going to wait for the H4 chart to make a bearish breakout and go short in the pair.

The chart produces a Doji candle to start its trading week. The next candle comes out as a bearish engulfing candle. It seems that the pair is going to make an H4 breakout at the week’s low soon.

The chart produces a long bearish candle closing well below the week’s low. It does not consolidate but produces a spinning top with a bearish body. The chart looks bearish, and the sellers may love to wait for the price to consolidate and to offer them a short entry. The question is whether they should wait to go short in the pair or not.

Look at those two drawn lines. One at the above indicates the highest high of the current week. The other one at the bottom indicates the lowest low of the last week. The difference between these two lines is vital. It determines the length of the next move. Usually, the price travels twice the distance of that length with good momentum. Once it travels three times that distance, the price usually makes longer consolidation or correction. The price travels three times that distance here. Thus, it may make a long bullish correction.

The chart produces a bullish engulfing candle followed by another bullish candle closing within the last week’s lowest low. The chart then creates an inverted hammer and drives the price towards the South. Look at the pace of that bearish move. It has been sluggish, and it suggests that the sellers are not interested in going short in this chart. The price has been roaming around the last swing low for quite a while. In a word, the H4 traders must wait for the price to give them the next direction. Meanwhile, it is a chart not to invest money and time in.

Categories
Forex Market Analysis

Daily F.X. Analysis, September 29 – Top Trade Setups In Forex – C.B. Consumer Confidence in Focus! 

The eyes will remain on the German Prelim CPI and Spanish CPI figures during the European session on the news front. At the same time, the C.B. Consumer Confidence and series of FOMC member’s speeches are likely to remain in the highlights today. Economists are expecting C.B. Consumer Confidence to perform better than before. Therefore the U.S. dollar can trade with a bullish bias today.

Economic Events to Watch Today  


EUR/USD – Daily Analysis

The EUR/USD closed at 1.16696 after placing a high of 1.16798 and a low of 1.16149. Euro to U.S. Dollar exchange rate saw fresh buying on Monday amid the broad-based U.S. dollar weakness. The U.S. dollar’s safe-haven rally was ended last week; however, the EUR/USD currency pair’s recovery was still limited on Monday.

Last week, the EUR/USD pair touched its lowest since 2-months at 1.1613 due to U.S. dollar strength gathered by safe-haven status. The U.S. stimulus package and coronavirus developments, and the coronavirus pandemic helped the U.S. dollar gain strength.

However, the U.S. dollar came under fresh pressure on Monday ahead of the U.S. Presidential debates will begin from Tuesday. The U.S. President Donald Trump and Joe Biden will face each other and debate over various topics, including the coronavirus pandemic, the U.S. economy, the latest race, and the protest issue, and the election integrity. 

The local currency faced heavy pressure before the debate and helped the EUR/USD pair to regain its strength in the market. The risk sentiment in the market was also emerging in the market with the developments made in a nasal spray for coronavirus infection. Researchers have revealed that promising results from nasal spray have been seen in ferrets; however, there was still a lot of work needed.

This news raised the EUR/USD prices as it is a riskier asset and tends to gain during times of depressed risk-averse sentiment. Meanwhile, the rising equities also helped the EUR/USD pair to post gains on Monday after the release of encouraging data from China. The rising equities also helped the rising EUR/USD pair on Monday.

However, the EUR/USD pair’s gains were limited after the speech of European Central Bank’s President, Christine Lagarde. She made fresh comments on the coronavirus pandemic threat and said that despite the rebounded economic activity in Eurozone, the recovery remains incomplete, uncertain, and uneven. 

She added that consumer spending has resumed, but they are still cautious about their jobs and income prospects, so the spending is behind its margin. Similarly, the business investment has picked up, but the weak demand and pertaining uncertainty have weighed on the investment plans. She also warned that Eurozone deflation would continue to persist in the coming months. She exclaimed that PEPP was very helpful and efficient in handling the coronavirus situation and confirmed that ECB would continue to stand ready to adjust all of its instruments in need. These concerning statements from Lagarde capped further gains in EUR/USD pair on Monday.

Daily Technical Levels

Support Resistance

1.1636      1.1698

1.1600      1.1724

1.1573      1.1760

Pivot point: 1.1662

EUR/USD– Trading Tip

The EUR/USD is trading at 1.1684 level, facing immediate resistance at 1.1685 level that marks a triple top pattern for the EUR/USD. The bullish crossover of 1.1685 level can open further room for buying until the 1.1715 area, while the bearish trend continuation below 1.1685 level may lead the EUR/USD price towards 1.1654 and 1.1627 level today. 


GBP/USD – Daily Analysis

Today in the Asian trading session, the GBP/USD currency pair continues to flash green and taking bids around above 1.2860 level, mainly due to the Brexit-positive headlines triggered after the E.U. stepped back from warnings to leave the trade and security talks. Meanwhile. They also showed a willingness to prepare a joint legal agreement, which keeps buyers hopeful and extended support to the currency pair. Apart from this, the currency pair got an additional boost after the Bank of England (BoE) policymaker eased the chance of negative interest rates in the short-term, which eventually underpinned the Brtish Pound and contributed to the currency pair gans. 

Across the pond, the broad-based U.S. dollar bearish tone ahead of the presidential debate also boosted the GBP/USD currency pair’s strong intraday positive move. The GBP/USD is trading at 1.2847 and consolidating in the range between 1.2832 – 1.2880. Moving on, the currency pair traders seem cautious to place any strong position ahead of crucial departure talks in the E.U.

It is worth recalling that the U.K. and Brussels are ready to resume the 9th-round of Brexit talks on the day. Reports suggest that negotiators will start the process to finalize a deal by the end of this week to hammer out an accord in time for the next E.U. summit in mid-October. However, the hopes of a Brexit deal were further fueled after the E.U. steps back from warnings to leave trade and security talks, shows a willingness to prepare a joint legal agreement. Hence, this news also ignores the U.K. Cabinet Minister Michel Gove’s refusal to remove the Internal Market Bill (IMB) clauses that confront the Brexit Withdrawal Agreement (WAB). This, in turn, boosted the sentiment around the British Pound and extended further support to the currency pair.

Besides, the reason for the currency pair bullish bias could also be associated with the latest reports suggesting that the Bank of England (BoE) policymaker, Dave Ramsden, lessened the possibility of negative interest rates in the short-term, which tend to underpin the local currency. Ramsden declared that he still sees the effective lower bound in the bank rate at 0.10%.

Daily Technical Levels

Support Resistance

1.2698     1.2791

1.2647     1.2833

1.2605     1.2884

Pivot point: 1.2740

GBP/USD– Trading Tip

On Tuesday, the GBP/USD pair is trading with a bullish bias at 1.2875 level, having violated the sideways trading range of 1.2770 to 1.2725 level. Most of the buying trend was triggered amid stronger Sterling and weakness in the U.S. dollar. The Cable has formed an upward channel on the hourly chart that may support the pair at 1.2827 level along with a resistance level of 1.2909 level. Bullish crossover of 1.2900 level can open up further buying room until 1.2998 level today. Let’s consider taking buying trades over 1.2827 level today. 


USD/JPY – Daily Analysis

The USD/JPY currency pair stopped its overnight declining streak and picked up some modest bids around above the mid-105.00 level, mainly due to the risk-on market. However, the positive tone around the equity market was being supported by the hopes of the U.S. stimulus package and optimism over the virus vaccine, which tend to undermine the safe-haven Japanese yen currency and contributed to the currency pair gains. 

On the contrary, the broad-based U.S. dollar weakness, triggered by the political uncertainty in the run-up to the U.S. Presidential election in November, becomes the key factor that kept the lid on any further gains in the currency pair. Apart from this, the concerns of increasing COVID-19 cases in many countries keep challenging the market trading sentiment, which might cap further gains in the currency pair. Currently, the USD/JPY currency pair is currently trading at 105.63 and consolidating in the range between 105.34 – 105.64. 

As we already mentioned that the market trading sentiment was being supported by optimism over a possible vaccine and treatment for the highly infectious coronavirus. These hopes fueled after the U.S. pharmaceutical giant Johnson and Johnson Inc COVID-19 vaccine experiment has shown a strong immune response to the coronavirus with a single dose in the early trial stages. Apart from this, the market trading sentiment was further bolstered by the Brexit-positive sentiment. These hopes came after the European Central Bank (ECB) President Christine Lagarde repeated that the Governing Council “continues to stand ready to adjust all of its instruments. This, in turn, boosted the market trading tone and undermined the safe-haven assets. Besides, the reason for the upbeat market sentiment could also be associated with the hints of further money flow from the U.S. and Europe. As per the U.S. House Speaker Nancy Pelosi, the COVID-19 aid package deal is possible. 

Looking ahead, the market traders will keep their focus on headlines concerning Brexit, pandemic, and the U.S. Presidential Election, which may offer important clues. It’s worth mentioning that the 1st-round of the U.S. President Election debate is expected to use American President Donald Trump’s tax payments as a fresh obstacle, which may push the U.S. dollar down.

Daily Technical Levels

Support Resistance

105.22      105.56

105.04      105.72

104.88      105.90

Pivot point: 105.38


USD/JPY – Trading Tips

On Tuesday, the technical side of the safe-haven pair USD/JPY continues to be steady as it’s consolidating with a bullish bias to trade at 105.460 level, and the series for EMA is now extending at 105.750 level. On the lower side, the support holds at 105.300 level. The MACD also supports the bullish bias amid a stronger U.S. dollar and diminished safe-haven appeal. A bullish crossover of the 105.750 is likely to lead the USD/JPY price towards the next resistance level of 106.250. As we can see, the 50 periods EMA is also in support of buying; therefore, we should look for buying trades in the USD/JPY pair. However, bearish trend continuation and violation of the 105.300 level can open further room for selling until 104.900. Good luck!